Radiation Response of Human Cardiac Endothelial Cells Reveals a Central Role of the cGAS-STING Pathway in the Development of Inflammation

 ,
,  ,
, 
Abstract
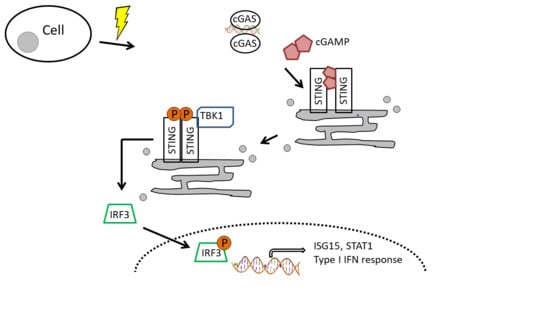
1. Introduction
2. Materials and Methods
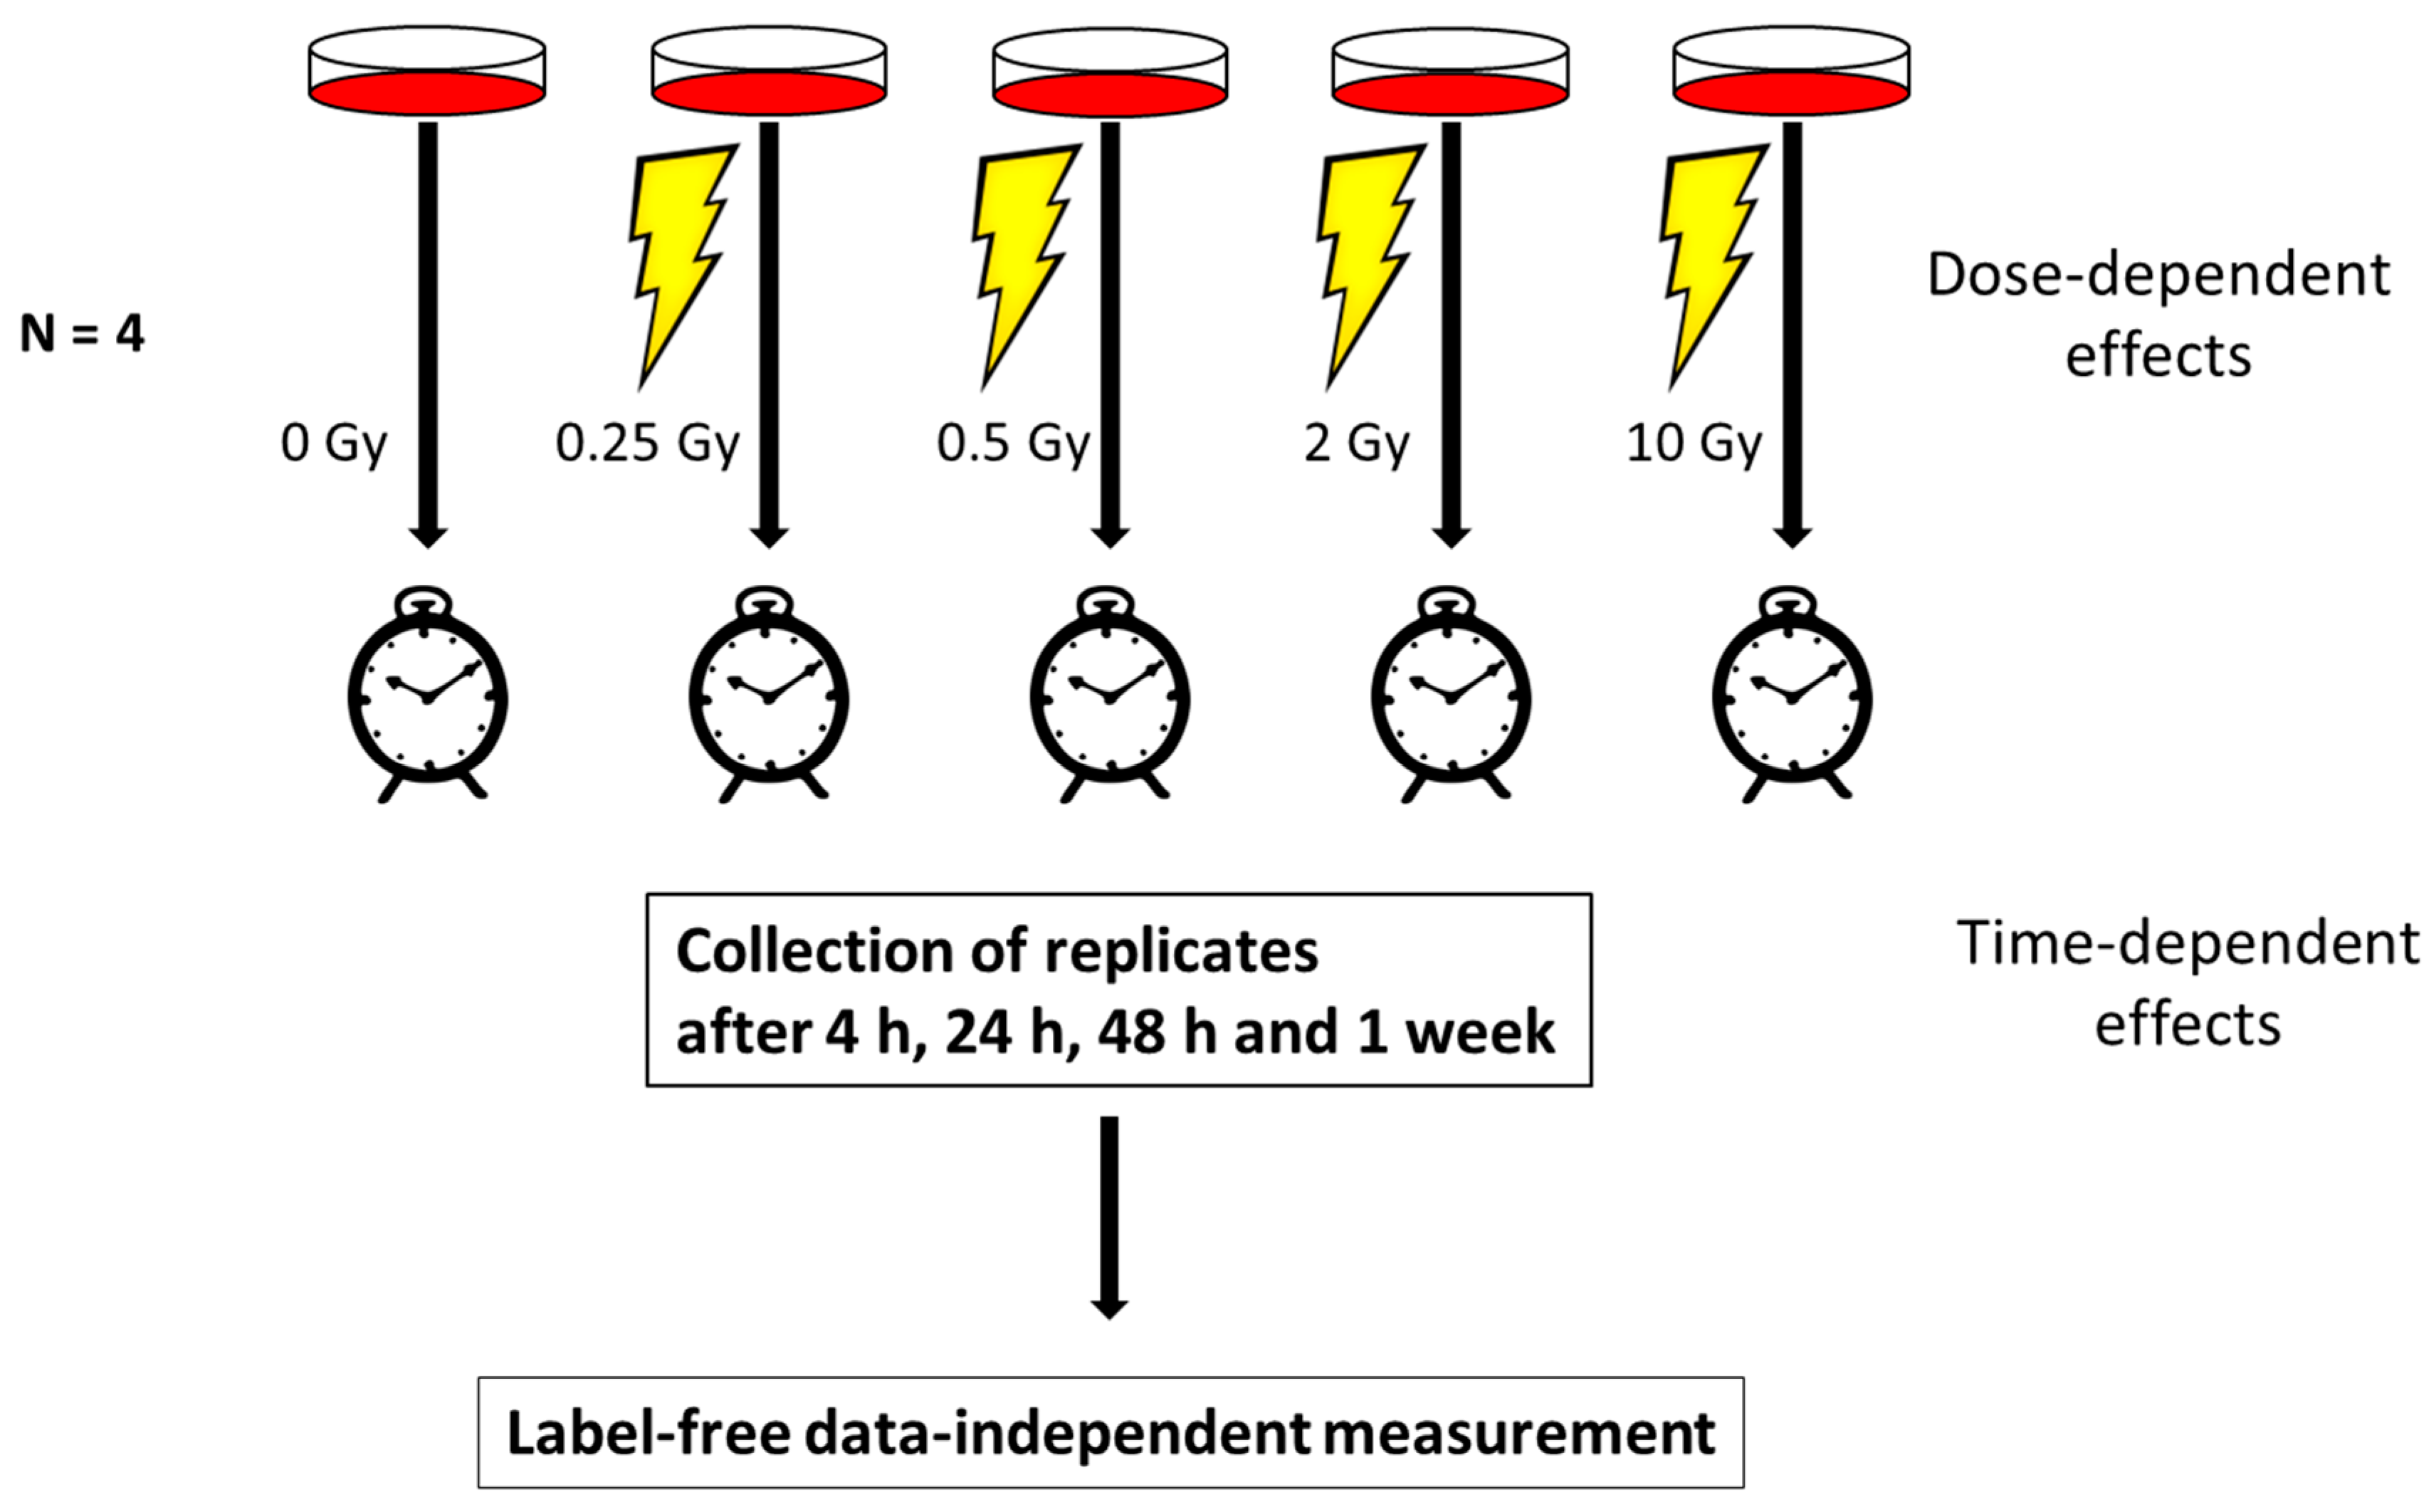
2.1. Cell Culture and Irradiation
2.2. Cell Lysis and Sample Preparation
2.3. Mass Spectrometry (MS)
2.4. Spectral Library, Spectronaut Analysis and Data Processing
2.5. Statistical Analysis
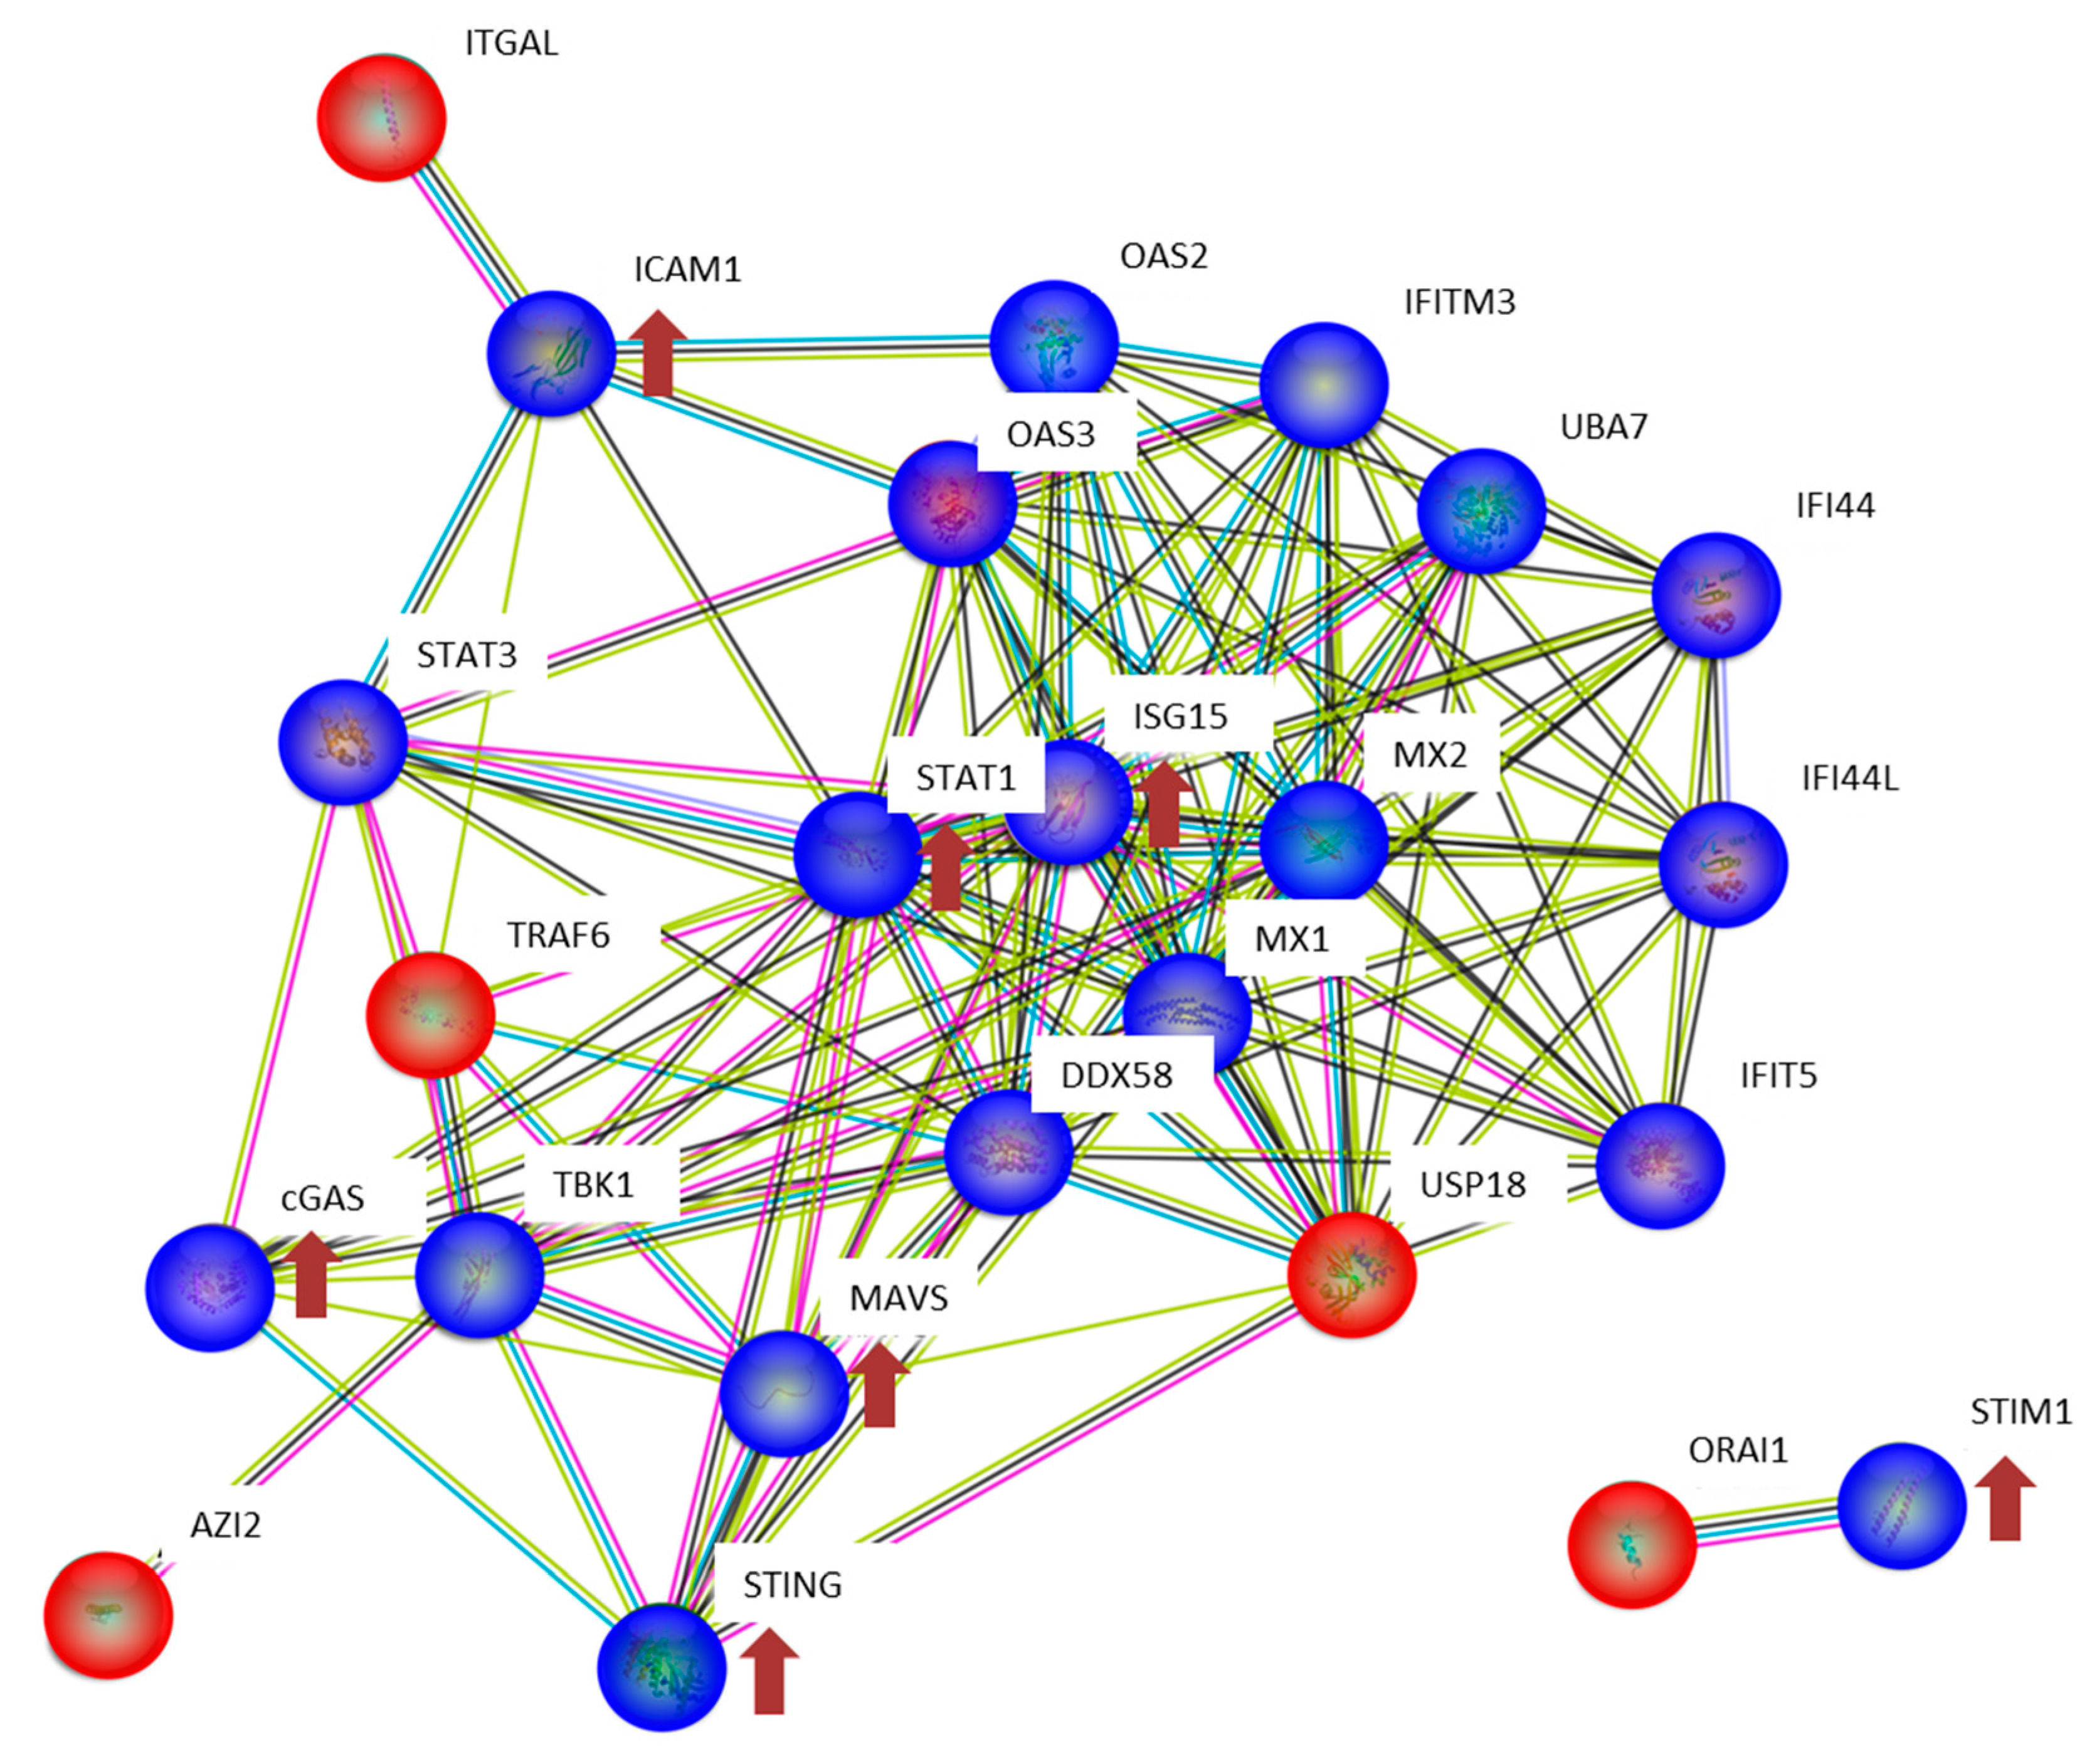
2.6. Bioinformatics
2.7. Immunoblotting
2.8. Data Availability
3. Results
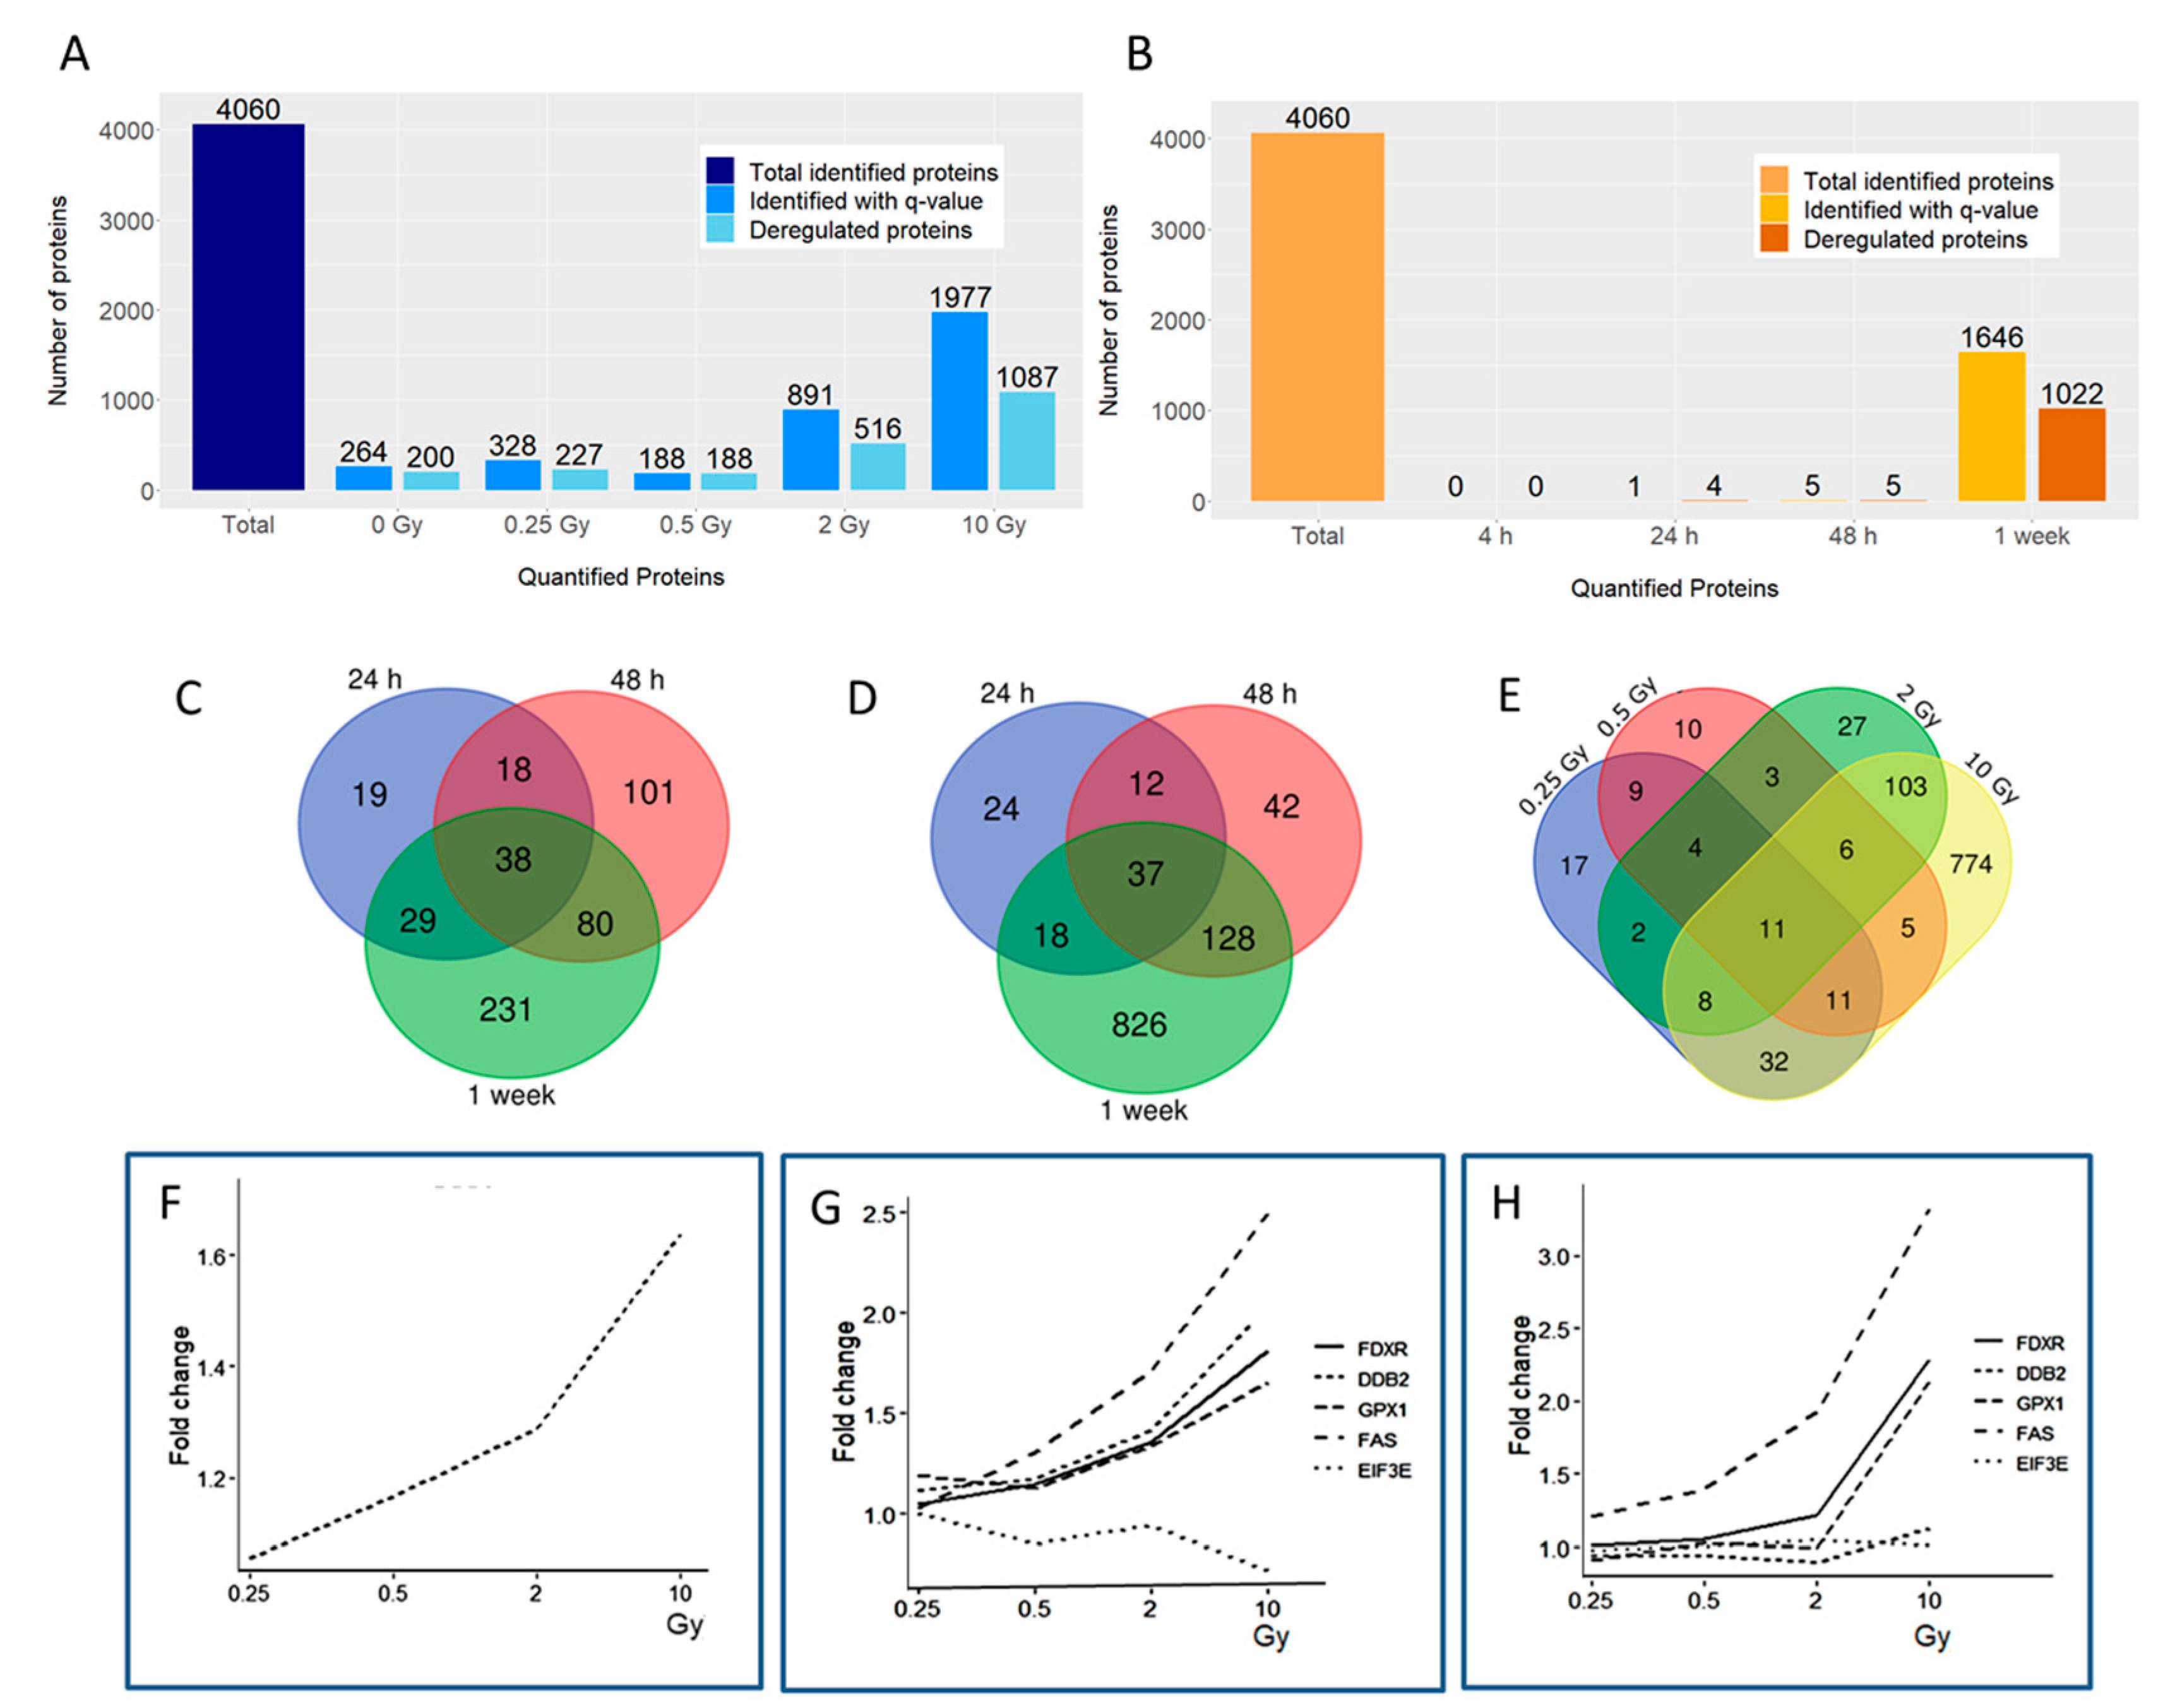
3.1. Radiation Dose and Time Effects on the Proteome
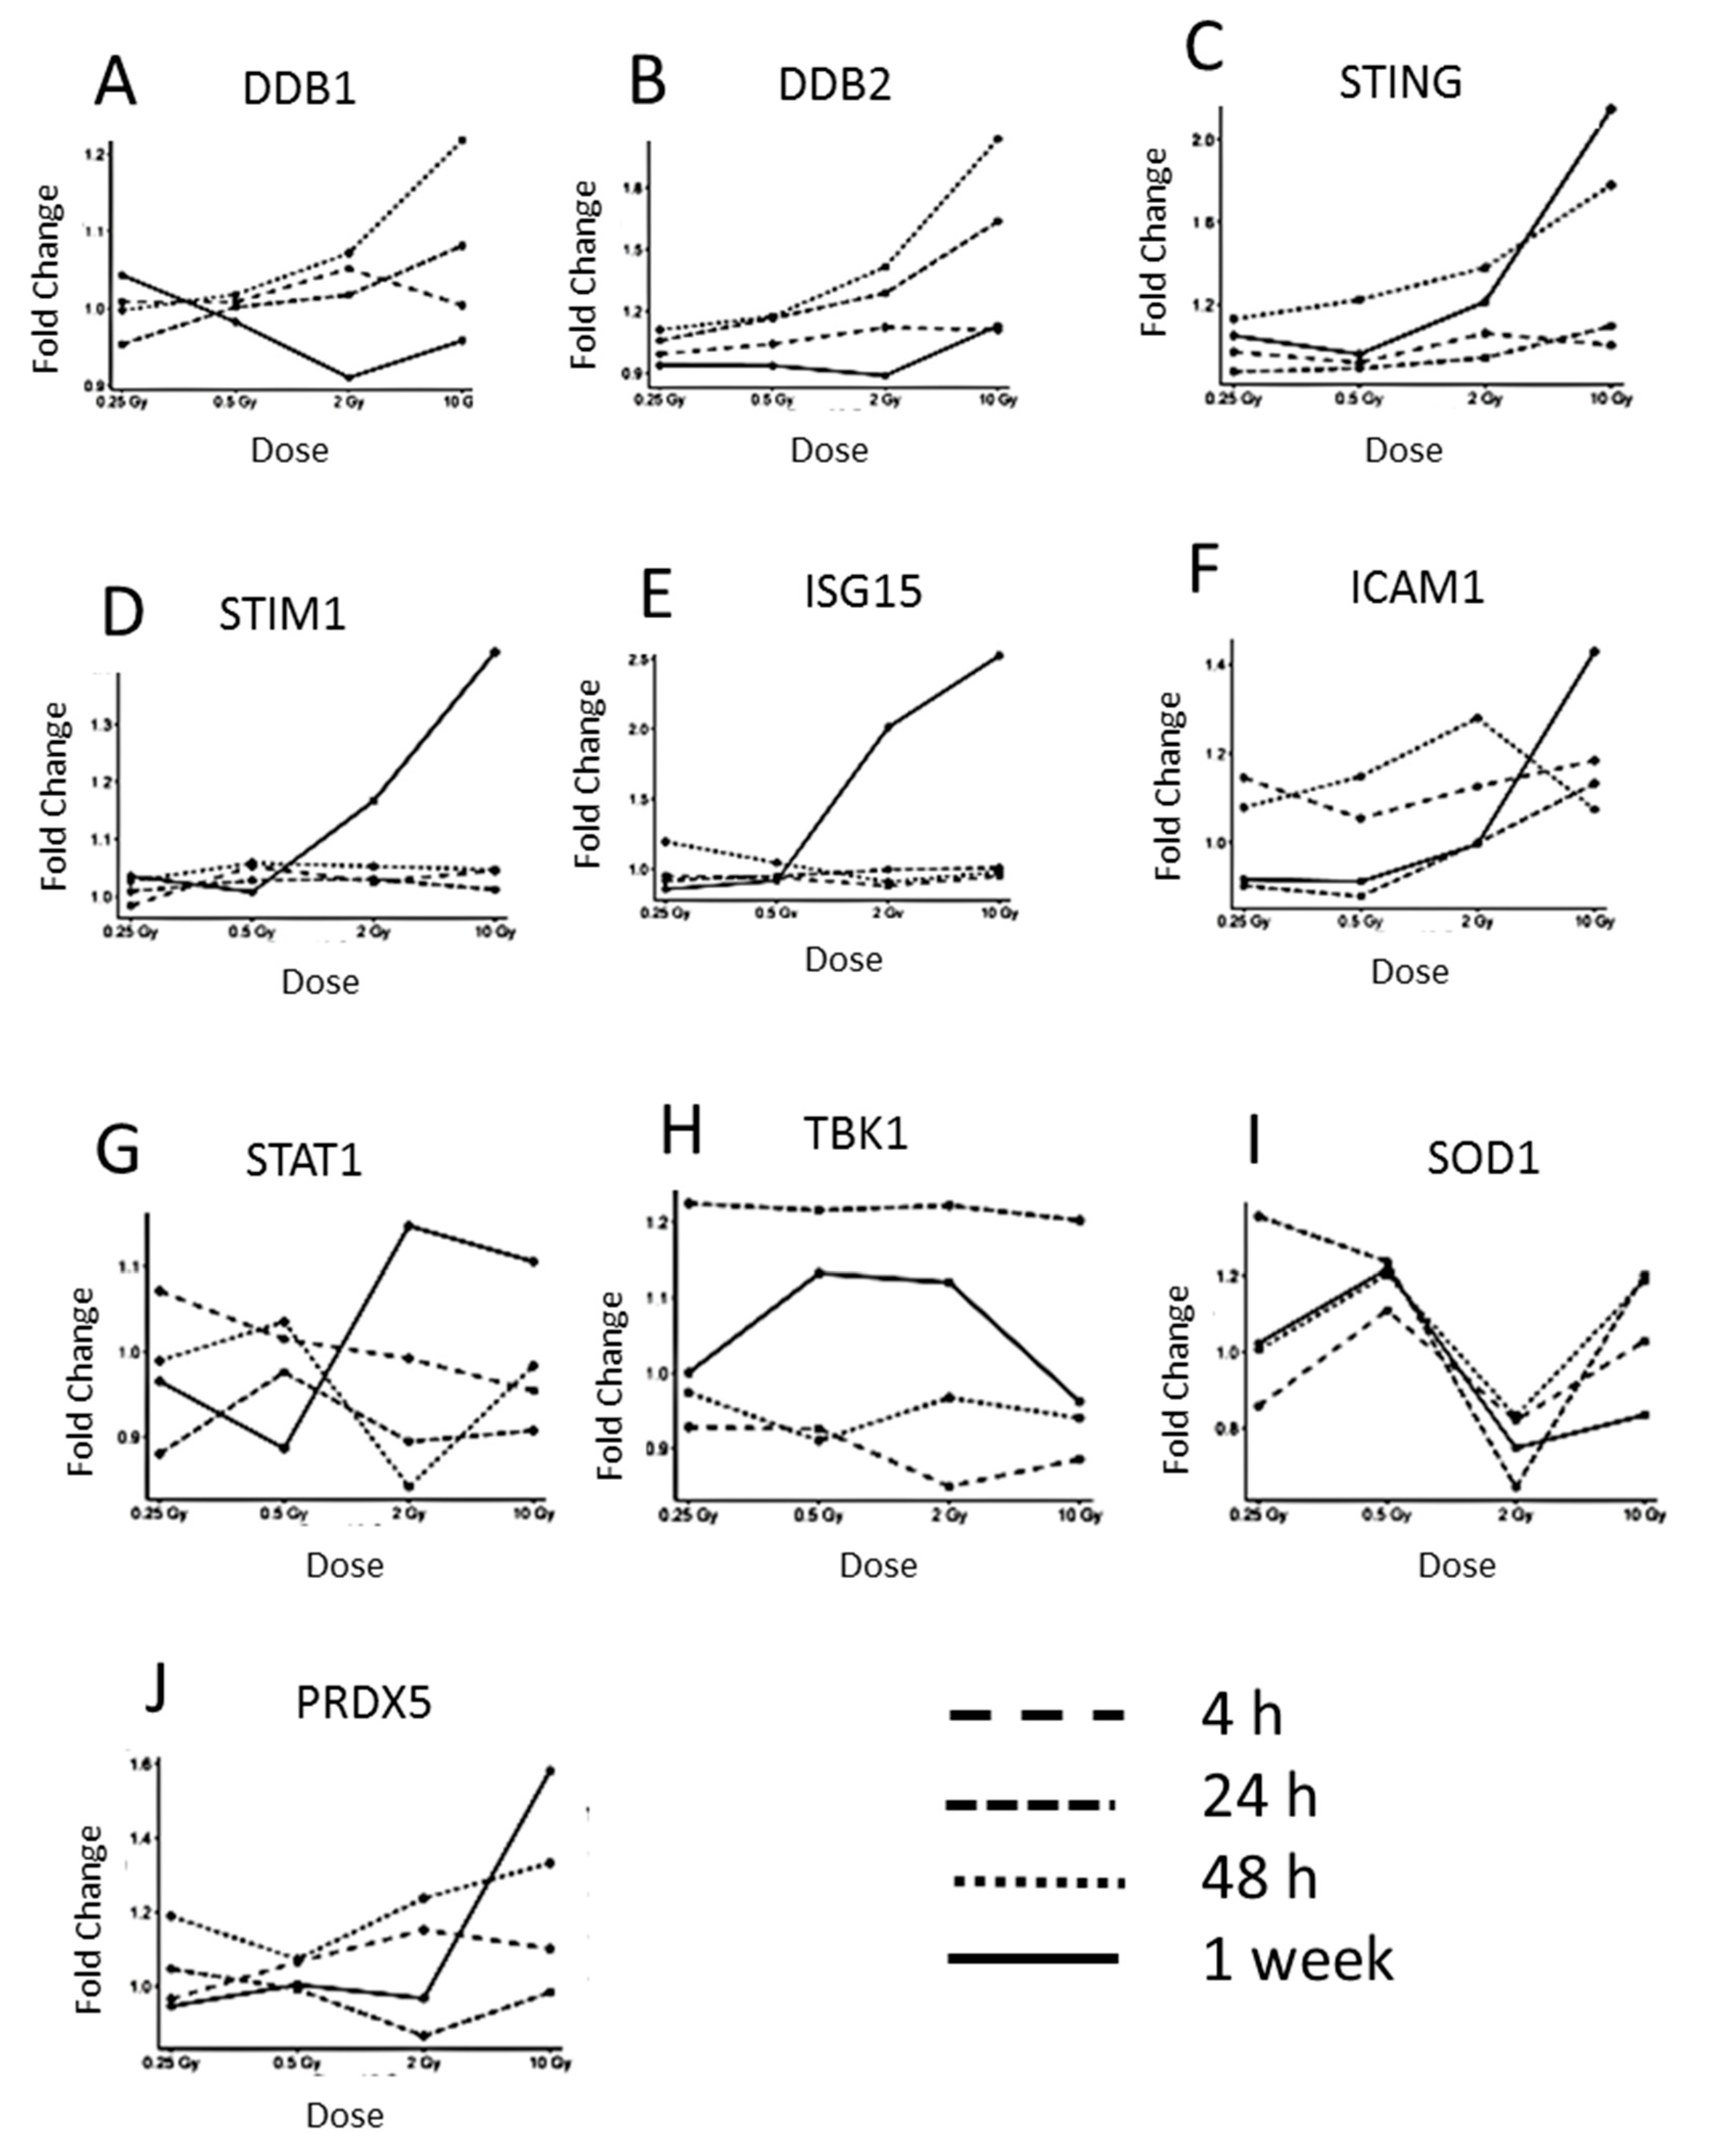
3.2. The Expression of Proteins Involved in DNA Repair, Oxidative Stress and Inflammatory Response
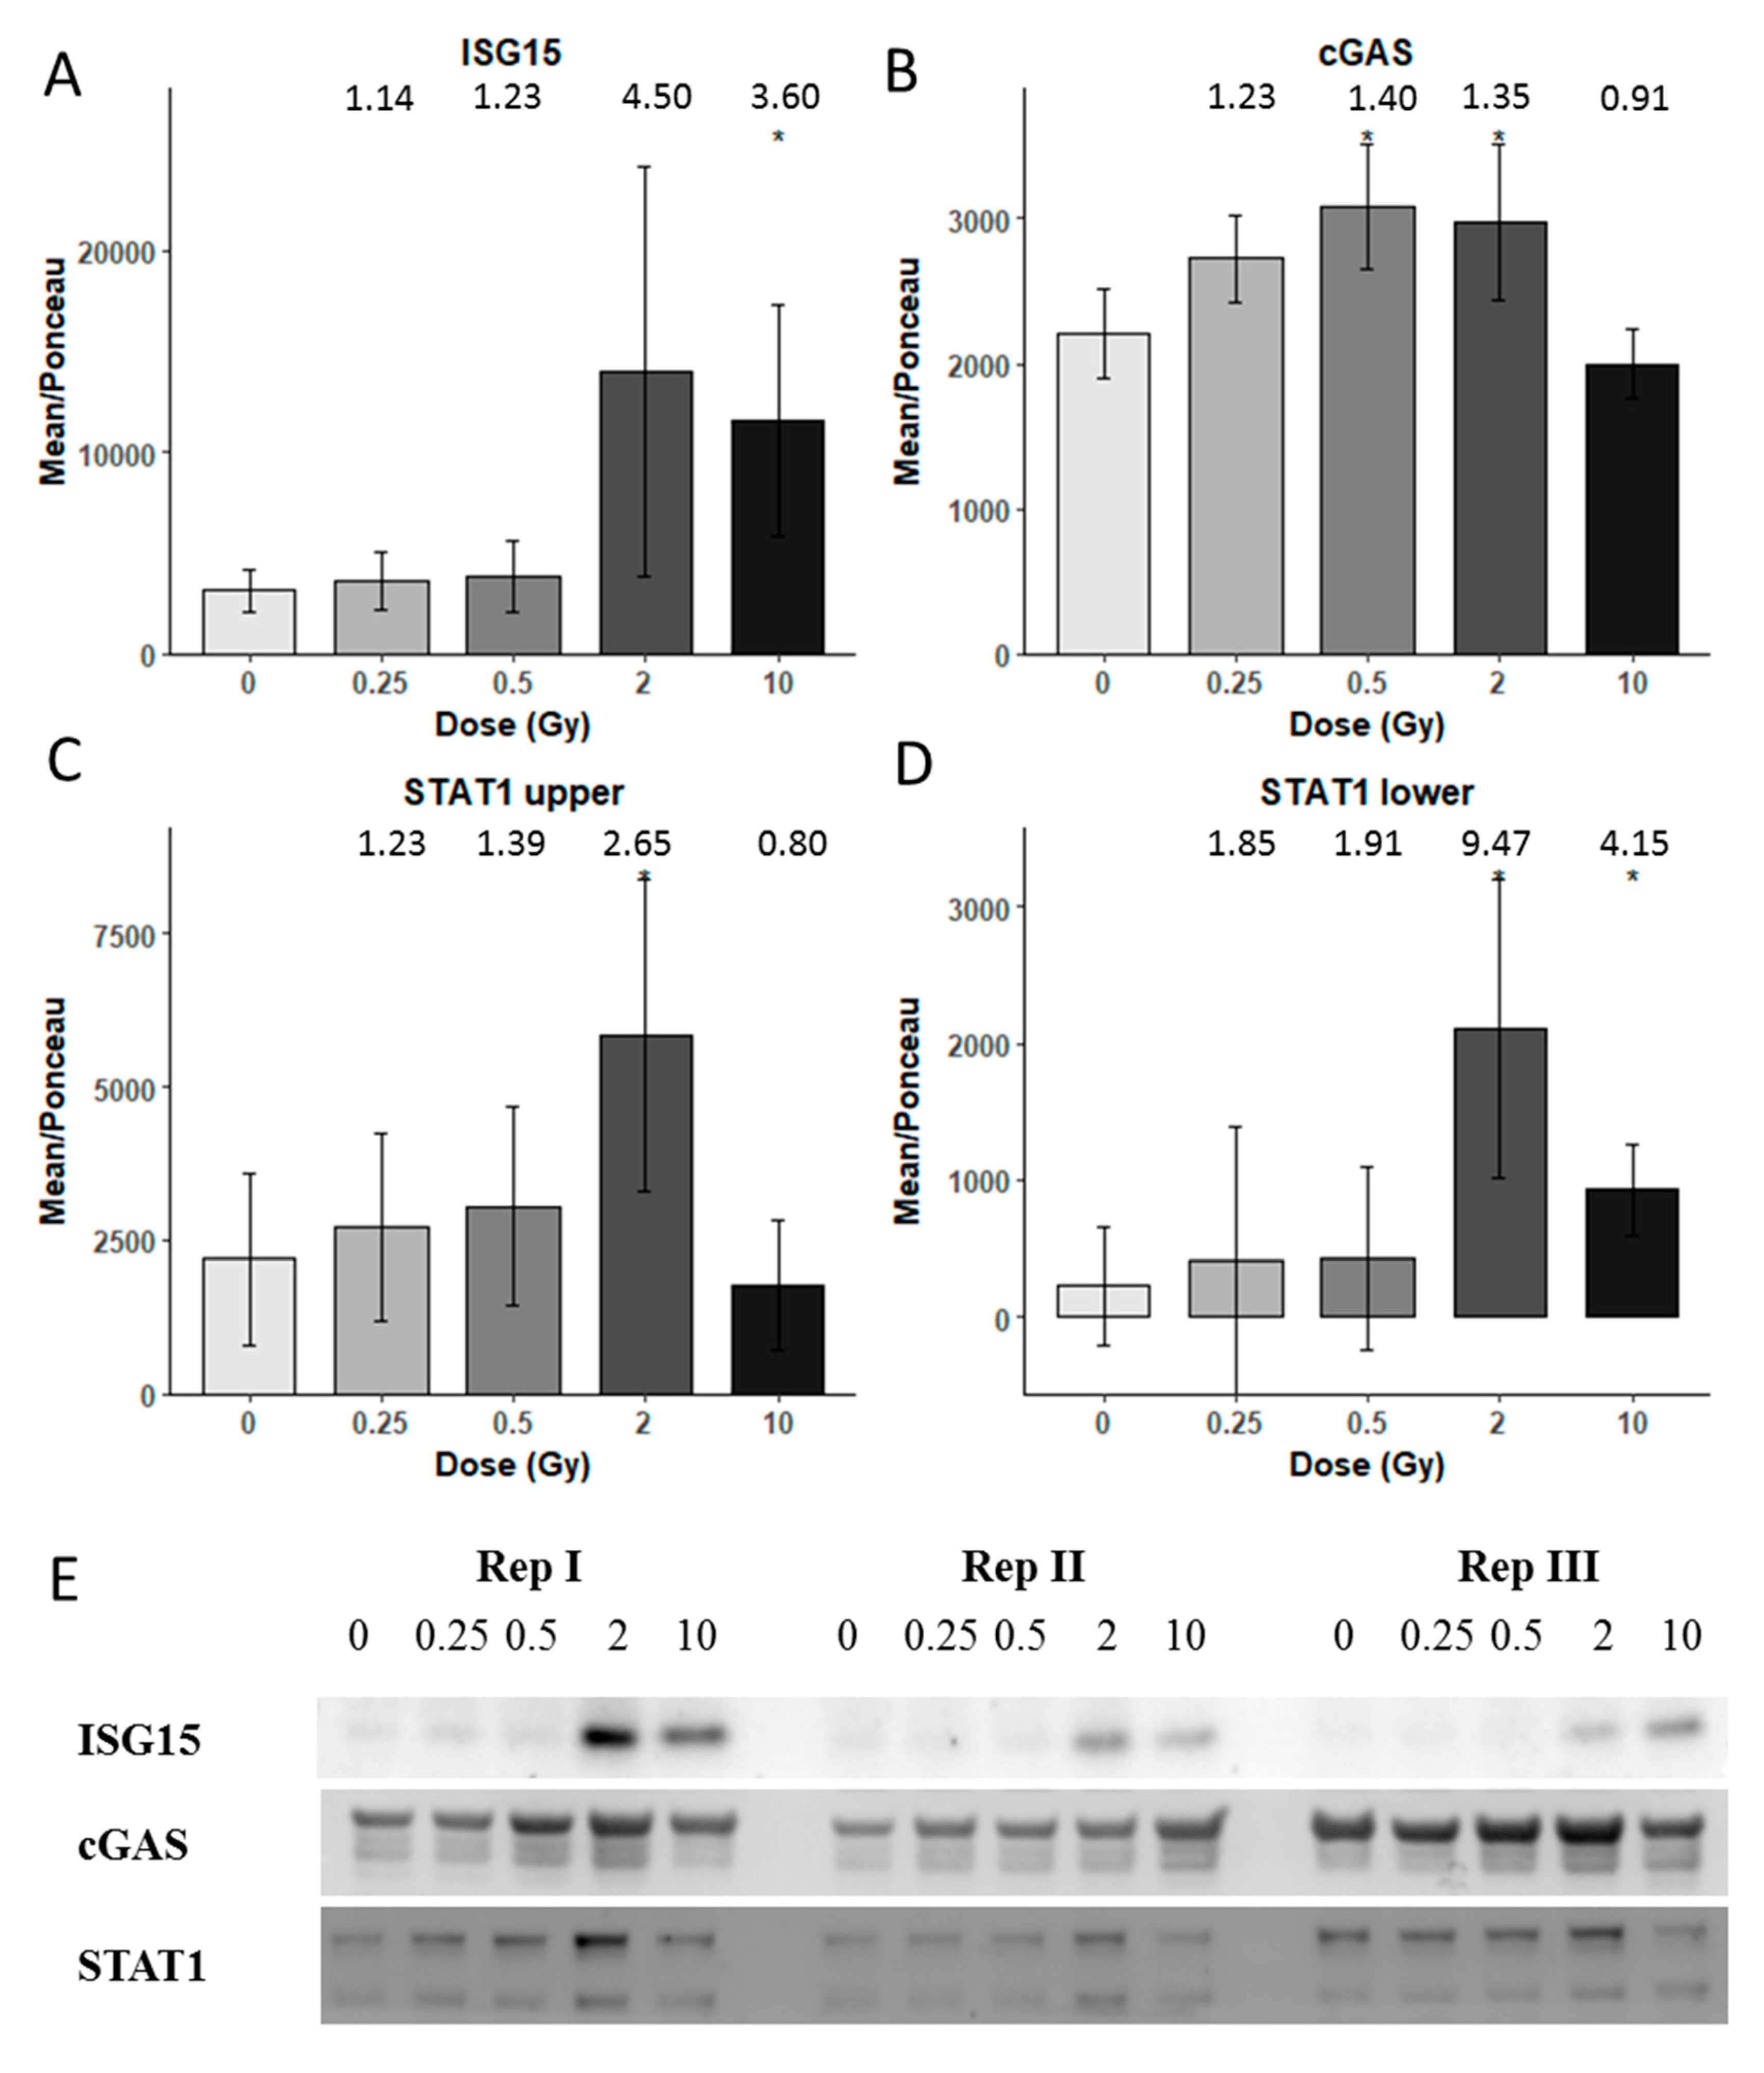
3.3. Immunoblotting Validation 1 Week Post-Radiation
4. Discussion
5. Conclusions
Limitations of the Study
Supplementary Materials
Author Contributions
Funding
Acknowledgments
Conflicts of Interest
References
- Krüger-Genge, A.; Blocki, A.; Franke, R.P.; Jung, F. Vascular endothelial cell biology: An update. Int. J. Mol. Sci. 2019, 20, 4411. [Google Scholar] [CrossRef] [PubMed]
- Kim, K.S.; Kim, J.E.; Choi, K.J.; Bae, S.; Kim, D.H. Characterization of DNA damage-induced cellular senescence by ionizing radiation in endothelial cells. Int. J. Radiat. Biol. 2014, 90, 71–80. [Google Scholar] [CrossRef] [PubMed]
- Bhayadia, R.; Schmidt, B.M.; Melk, A.; Homme, M. Senescence-induced oxidative stress causes endothelial dysfunction. J. Gerontol. A Biol. Sci. Med. Sci. 2016, 71, 161–169. [Google Scholar] [CrossRef] [PubMed]
- Cancel, L.M.; Ebong, E.E.; Mensah, S.; Hirschberg, C.; Tarbell, J.M. Endothelial glycocalyx, apoptosis and inflammation in an atherosclerotic mouse model. Atherosclerosis 2016, 252, 136–146. [Google Scholar] [CrossRef] [PubMed]
- Guipaud, O.; Jaillet, C.; Clément-Colmou, K.; François, A.; Supiot, S.; Milliat, F. The importance of the vascular endothelial barrier in the immune-inflammatory response induced by radiotherapy. Br. J. Radiol. 2018, 91, 20170762. [Google Scholar] [CrossRef]
- Draeger, E.; Sawant, A.; Johnstone, C.; Koger, B.; Becker, S.; Vujaskovic, Z.; Jackson, I.L.; Poirier, Y. A Dose of Reality: How 20 years of incomplete physics and dosimetry reporting in radiobiology studies may have contributed to the reproducibility crisis. Int. J. Radiat. Oncol. Biol. Phys 2020, 106, 243–252. [Google Scholar] [CrossRef]
- Jordan, B.R. The Hiroshima/Nagasaki survivor studies: Discrepancies between results and general perception. Genetics 2016, 203, 1505–1512. [Google Scholar] [CrossRef]
- Papiez, A.; Azimzadeh, O.; Azizova, T.; Moseeva, M.; Anastasov, N.; Smida, J.; Tapio, S.; Polanska, J. Integrative multiomics study for validation of mechanisms in radiation-induced ischemic heart disease in Mayak workers. PLoS ONE 2018, 13, e0209626. [Google Scholar] [CrossRef]
- Azimzadeh, O.; Sievert, W.; Sarioglu, H.; Merl-Pham, J.; Yentrapalli, R.; Bakshi, M.V.; Janik, D.; Ueffing, M.; Atkinson, M.J.; Multhoff, G.; et al. Integrative proteomics and targeted transcriptomics analyses in cardiac endothelial cells unravel mechanisms of long-term radiation-induced vascular dysfunction. J. Proteome Res. 2015, 14, 1203–1219. [Google Scholar] [CrossRef]
- Sievert, W.; Trott, K.R.; Azimzadeh, O.; Tapio, S.; Zitzelsberger, H.; Multhoff, G. Late proliferating and inflammatory effects on murine microvascular heart and lung endothelial cells after irradiation. Radiother Oncol. 2015, 117, 376–381. [Google Scholar] [CrossRef]
- Hayashi, T.; Kusunoki, Y.; Hakoda, M.; Morishita, Y.; Kubo, Y.; Maki, M.; Kasagi, F.; Kodama, K.; Macphee, D.G.; Kyoizumi, S. Radiation dose-dependent increases in inflammatory response markers in A-bomb survivors. Int. J. Radiat. Biol. 2003, 79, 129–136. [Google Scholar] [CrossRef]
- Chen, Y.C.; Huang, A.L.; Kyaw, T.S.; Bobik, A.; Peter, K. Atherosclerotic plaque rupture: Identifying the straw that breaks the camel’s back. Arterioscler. Thromb. Vasc. Biol. 2016, 36, e63–e72. [Google Scholar] [CrossRef] [PubMed]
- Karahalil, B. Overview of systems biology and omics technologies. Curr. Med. Chem. 2016, 23, 4221–4230. [Google Scholar] [CrossRef]
- Shan, Y.X.; Jin, S.Z.; Liu, X.D.; Liu, Y.; Liu, S.Z. Ionizing radiation stimulates secretion of pro-inflammatory cytokines: Dose-response relationship, mechanisms and implications. Radiat. Environ. Biophys. 2007, 46, 21–29. [Google Scholar] [CrossRef]
- Frey, B.; Hehlgans, S.; Rödel, F.; Gaipl, U.S. Modulation of inflammation by low and high doses of ionizing radiation: Implications for benign and malign diseases. Cancer Lett. 2015, 368, 230–237. [Google Scholar] [CrossRef]
- Cervelli, T.; Panetta, D.; Navarra, T.; Andreassi, M.G.; Basta, G.; Galli, A.; Salvadori, P.A.; Picano, E.; Del Turco, S. Effects of single and fractionated low-dose irradiation on vascular endothelial cells. Atherosclerosis 2014, 235, 510–518. [Google Scholar] [CrossRef] [PubMed]
- Azimzadeh, O.; Subramanian, V.; Stander, S.; Merl-Pham, J.; Lowe, D.; Barjaktarovic, Z.; Moertl, S.; Raj, K.; Atkinson, M.J.; Tapio, S. Proteome analysis of irradiated endothelial cells reveals persistent alteration in protein degradation and the RhoGDI and NO signalling pathways. Int. J. Radiat. Biol. 2017, 93, 920–928. [Google Scholar] [CrossRef] [PubMed]
- Ebrahimian, T.G.; Beugnies, L.; Surette, J.; Priest, N.; Gueguen, Y.; Gloaguen, C.; Benderitter, M.; Jourdain, J.R.; Tack, K. Chronic exposure to external low-dose gamma radiation induces an increase in anti-inflammatory and anti-oxidative parameters resulting in atherosclerotic plaque size reduction in ApoE(-/-) Mice. Radiat. Res. 2018, 189, 187–196. [Google Scholar] [CrossRef]
- Baselet, B.; Belmans, N.; Coninx, E.; Lowe, D.; Janssen, A.; Michaux, A.; Tabury, K.; Raj, K.; Quintens, R.; Benotmane, M.A.; et al. Functional gene analysis reveals cell cycle changes and inflammation in endothelial cells irradiated with a single X-ray dose. Front. Pharmacol. 2017, 8, 213. [Google Scholar] [CrossRef]
- Baselet, B.; Sonveaux, P.; Baatout, S.; Aerts, A. Pathological effects of ionizing radiation: Endothelial activation and dysfunction. Cell. Mol. Life Sci. 2019, 76, 699–728. [Google Scholar] [CrossRef]
- Boström, M.; Kalm, M.; Eriksson, Y.; Bull, C.; Ståhlberg, A.; Björk-Eriksson, T.; Hellström Erkenstam, N.; Blomgren, K. A role for endothelial cells in radiation-induced inflammation. Int. J. Radiat. Biol. 2018, 94, 259–271. [Google Scholar] [CrossRef] [PubMed]
- Halle, M.; Hall, P.; Tornvall, P. Cardiovascular disease associated with radiotherapy: Activation of nuclear factor kappa-B. J. Intern. Med. 2011, 269, 469–477. [Google Scholar] [CrossRef]
- Lowe, D.; Raj, K. Premature aging induced by radiation exhibits pro-atherosclerotic effects mediated by epigenetic activation of CD44 expression. Aging Cell 2014, 13, 900–910. [Google Scholar] [CrossRef] [PubMed]
- Philipp, J.; Azimzadeh, O.; Subramanian, V.; Merl-Pham, J.; Lowe, D.; Hladik, D.; Erbeldinger, N.; Ktitareva, S.; Fournier, C.; Atkinson, M.J.; et al. Radiation-induced endothelial inflammation is transferred via the secretome to recipient cells in a stat-mediated process. J. Proteome Res. 2017, 16, 3903–3916. [Google Scholar] [CrossRef]
- Meeren, A.V.; Bertho, J.M.; Vandamme, M.; Gaugler, M.H. Ionizing radiation enhances IL-6 and IL-8 production by human endothelial cells. Mediat. Inflamm. 1997, 6, 185–193. [Google Scholar] [CrossRef]
- Sievert, W.; Tapio, S.; Breuninger, S.; Gaipl, U.; Andratschke, N.; Trott, K.R.; Multhoff, G. Adhesion molecule expression and function of primary endothelial cells in benign and malignant tissues correlates with proliferation. PLoS ONE 2014, 9, e91808. [Google Scholar] [CrossRef]
- Margolis, S.R.; Wilson, S.C.; Vance, R.E. Evolutionary origins of cGAS-STING signaling. Trends Immunol. 2017, 38, 733–743. [Google Scholar] [CrossRef]
- Durante, M.; Formenti, S.C. Radiation-induced chromosomal aberrations and immunotherapy: Micronuclei, Cytosolic DNA, and interferon-production pathway. Front. Oncol. 2018, 8, 192. [Google Scholar] [CrossRef]
- Lam, E.; Stein, S.; Falck-Pedersen, E. Adenovirus detection by the cGAS/STING/TBK1 DNA sensing cascade. J. Virol. 2014, 88, 974–981. [Google Scholar] [CrossRef]
- Li, T.; Chen, Z.J. The cGAS-cGAMP-STING pathway connects DNA damage to inflammation, senescence, and cancer. J. Exp. Med. 2018, 215, 1287–1299. [Google Scholar] [CrossRef] [PubMed]
- Tao, J.; Zhou, X.; Jiang, Z. cGAS-cGAMP-STING: The three musketeers of cytosolic DNA sensing and signaling. IUBMB Life 2016, 68, 858–870. [Google Scholar] [CrossRef] [PubMed]
- Sun, L.; Wu, J.; Du, F.; Chen, X.; Chen, Z.J. Cyclic GMP-AMP synthase is a cytosolic DNA sensor that activates the type I interferon pathway. Science 2013, 339, 786–791. [Google Scholar] [CrossRef]
- Lafargue, A.; Degorre, C.; Corre, I.; Alves-Guerra, M.C.; Gaugler, M.H.; Vallette, F.; Pecqueur, C.; Paris, F. Ionizing radiation induces long-term senescence in endothelial cells through mitochondrial respiratory complex II dysfunction and superoxide generation. Free Radic. Biol. Med. 2017, 108, 750–759. [Google Scholar] [CrossRef]
- Philipp, J.; Sievert, W.; Azimzadeh, O.; von Toerne, C.; Metzger, F.; Posch, A.; Hladik, D.; Subedi, P.; Multhoff, G.; Atkinson, M.J.; et al. Data independent acquisition mass spectrometry of irradiated mouse lung endothelial cells reveals a STAT-associated inflammatory response. Int. J. Radiat. Biol 2020, 96, 642–650. [Google Scholar] [CrossRef]
- Au-Yeung, N.; Mandhana, R.; Horvath, C.M. Transcriptional regulation by STAT1 and STAT2 in the interferon JAK-STAT pathway. JAKSTAT 2013, 2, e23931. [Google Scholar] [CrossRef] [PubMed]
- Trilling, M.; Bellora, N.; Rutkowski, A.J.; de Graaf, M.; Dickinson, P.; Robertson, K.; Prazeres da Costa, O.; Ghazal, P.; Friedel, C.C.; Albà, M.M.; et al. Deciphering the modulation of gene expression by type I and II interferons combining 4sU-tagging, translational arrest and in silico promoter analysis. Nucleic Acids Res. 2013, 41, 8107–8125. [Google Scholar] [CrossRef]
- Kreienkamp, R.; Graziano, S.; Coll-Bonfill, N.; Bedia-Diaz, G.; Cybulla, E.; Vindigni, A.; Dorsett, D.; Kubben, N.; Batista, L.F.Z.; Gonzalo, S. A Cell-Intrinsic Interferon-like Response Links Replication Stress to Cellular Aging Caused by Progerin. Cell Rep. 2018, 22, 2006–2015. [Google Scholar] [CrossRef]
- Wisniewski, J.R.; Zougman, A.; Nagaraj, N.; Mann, M. Universal sample preparation method for proteome analysis. Nat. Methods 2009, 6, 359–362. [Google Scholar] [CrossRef]
- Kappler, L.; Hoene, M.; Hu, C.; von Toerne, C.; Li, J.; Bleher, D.; Hoffmann, C.; Bohm, A.; Kollipara, L.; Zischka, H.; et al. Linking bioenergetic function of mitochondria to tissue-specific molecular fingerprints. Am. J. Physiol. Endocrinol. Metab. 2019, 317, E374–E387. [Google Scholar] [CrossRef]
- Huber, W.; von Heydebreck, A.; Sültmann, H.; Poustka, A.; Vingron, M. Variance stabilization applied to microarray data calibration and to the quantification of differential expression. Bioinformatics 2002, 18 (Suppl. 1), S96–S104. [Google Scholar] [CrossRef] [PubMed]
- McInnes, L.; Healy, J. UMAP: Uniform manifold approximation and projection for dimension reduction. arXiv 2018, arXiv:1802.03426. [Google Scholar]
- van der Maaten, L.J.P.; Hinton, G.E. Visualizing high-dimensional data using t-SNE. J. Mach. Learn. Res. 2008, 9, 2579–2605. [Google Scholar]
- Phipson, B.; Lee, S.; Majewski, I.J.; Alexander, W.S.; Smyth, G.K. Robust hyperparameter estimation protects against hypervariable genes and improves power to detect differential expression. Ann. Appl. Stat. 2016, 10, 946–963. [Google Scholar] [CrossRef]
- Storey, J. A direct approach to false discovery rates. J. R. Stat. Soc. 2002, 64, 479–498. [Google Scholar] [CrossRef]
- Perez-Riverol, Y.; Csordas, A.; Bai, J.; Bernal-Llinares, M.; Hewapathirana, S.; Kundu, D.J.; Inuganti, A.; Griss, J.; Mayer, G.; Eisenacher, M.; et al. The PRIDE database and related tools and resources in 2019: Improving support for quantification data. Nucleic Acids Res. 2019, 47, D442–D450. [Google Scholar] [CrossRef]
- Srikanth, S.; Woo, J.S.; Wu, B.; El-Sherbiny, Y.M.; Leung, J.; Chupradit, K.; Rice, L.; Seo, G.J.; Calmettes, G.; Ramakrishna, C.; et al. The Ca(2+) sensor STIM1 regulates the type I interferon response by retaining the signaling adaptor STING at the endoplasmic reticulum. Nat. Immunol. 2019, 20, 152–162. [Google Scholar] [CrossRef]
- García, N.; Zazueta, C.; Aguilera-Aguirre, L. Oxidative stress and inflammation in cardiovascular disease. Oxid. Med. Cell. Longev. 2017, 2017, 5853238. [Google Scholar] [CrossRef]
- Wennstig, A.K.; Garmo, H.; Isacsson, U.; Gagliardi, G.; Rintelä, N.; Lagerqvist, B.; Holmberg, L.; Blomqvist, C.; Sund, M.; Nilsson, G. The relationship between radiation doses to coronary arteries and location of coronary stenosis requiring intervention in breast cancer survivors. Radiat. Oncol. 2019, 14, 40. [Google Scholar] [CrossRef]
- Aznar, M.C.; Duane, F.K.; Darby, S.C.; Wang, Z.; Taylor, C.W. Exposure of the lungs in breast cancer radiotherapy: A systematic review of lung doses published 2010–2015. Radiother. Oncol. 2018, 126, 148–154. [Google Scholar] [CrossRef]
- Hooning, M.J.; Botma, A.; Aleman, B.M.; Baaijens, M.H.; Bartelink, H.; Klijn, J.G.; Taylor, C.W.; van Leeuwen, F.E. Long-term risk of cardiovascular disease in 10-year survivors of breast cancer. J. Natl. Cancer Inst. 2007, 99, 365–375. [Google Scholar] [CrossRef]
- Wennstig, A.K.; Wadsten, C.; Garmo, H.; Fredriksson, I.; Blomqvist, C.; Holmberg, L.; Nilsson, G.; Sund, M. Long-term risk of ischemic heart disease after adjuvant radiotherapy in breast cancer: Results from a large population-based cohort. Breast Cancer Res. 2020, 22, 10. [Google Scholar] [CrossRef] [PubMed]
- Baselet, B.; Azimzadeh, O.; Erbeldinger, N.; Bakshi, M.V.; Dettmering, T.; Janssen, A.; Ktitareva, S.; Lowe, D.J.; Michaux, A.; Quintens, R.; et al. Differential impact of single-dose Fe ion and X-Ray irradiation on endothelial cell transcriptomic and proteomic responses. Front. Pharmacol. 2017, 8, 570. [Google Scholar] [CrossRef] [PubMed]
- Little, M.P.; Tawn, E.J.; Tzoulaki, I.; Wakeford, R.; Hildebrandt, G.; Paris, F.; Tapio, S.; Elliott, P. A systematic review of epidemiological associations between low and moderate doses of ionizing radiation and late cardiovascular effects, and their possible mechanisms. Radiat. Res. 2008, 169, 99–109. [Google Scholar] [CrossRef] [PubMed]
- Little, M.P.; Tawn, E.J.; Tzoulaki, I.; Wakeford, R.; Hildebrandt, G.; Paris, F.; Tapio, S.; Elliott, P. Review and meta-analysis of epidemiological associations between low/moderate doses of ionizing radiation and circulatory disease risks, and their possible mechanisms. Radiat. Environ. Biophys. 2010, 49, 139–153. [Google Scholar] [CrossRef]
- Gillies, M.; Richardson, D.B.; Cardis, E.; Daniels, R.D.; O’Hagan, J.A.; Haylock, R.; Laurier, D.; Leuraud, K.; Moissonnier, M.; Schubauer-Berigan, M.K.; et al. Mortality from circulatory diseases and other non-cancer outcomes among nuclear workers in France, the United Kingdom and the United States (INWORKS). Radiat. Res. 2017, 188, 276–290. [Google Scholar] [CrossRef] [PubMed]
- Little, M.P.; Zablotska, L.B.; Brenner, A.V.; Lipshultz, S.E. Circulatory disease mortality in the Massachusetts tuberculosis fluoroscopy cohort study. Eur. J. Epidemiol. 2016, 31, 287–309. [Google Scholar] [CrossRef]
- Amundson, S.A.; Fornace, A.J., Jr. Microarray approaches for analysis of cell cycle regulatory genes. Methods Mol. Biol. 2004, 241, 125–141. [Google Scholar]
- Kis, E.; Szatmári, T.; Keszei, M.; Farkas, R.; Esik, O.; Lumniczky, K.; Falus, A.; Sáfrány, G. Microarray analysis of radiation response genes in primary human fibroblasts. Int. J. Radiat. Oncol. Biol. Phys. 2006, 66, 1506–1514. [Google Scholar] [CrossRef]
- Tilton, S.C.; Markillie, L.M.; Hays, S.; Taylor, R.C.; Stenoien, D.L. Identification of differential gene expression patterns after acute exposure to high and low doses of low-let ionizing radiation in a reconstituted human skin tissue. Radiat. Res. 2016, 186, 531–538. [Google Scholar] [CrossRef]
- Balázs, K.; Kis, E.; Badie, C.; Bogdándi, E.N.; Candéias, S.; Garcia, L.C.; Dominczyk, I.; Frey, B.; Gaipl, U.; Jurányi, Z.; et al. Radiotherapy-induced changes in the systemic immune and inflammation parameters of head and neck cancer patients. Cancers 2019, 11, 1324. [Google Scholar] [CrossRef]
- Hwang, B.J.; Ford, J.M.; Hanawalt, P.C.; Chu, G. Expression of the p48 xeroderma pigmentosum gene is p53-dependent and is involved in global genomic repair. Proc. Natl. Acad. Sci. USA 1999, 96, 424–428. [Google Scholar] [CrossRef] [PubMed]
- Zhao, Q.; Barakat, B.M.; Qin, S.; Ray, A.; El-Mahdy, M.A.; Wani, G.; Arafa, E.-S.; Mir, S.N.; Wang, Q.E.; Wani, A.A. The p38 mitogen-activated protein kinase augments nucleotide excision repair by mediating DDB2 degradation and chromatin relaxation. J. Biol. Chem. 2008, 283, 32553–32561. [Google Scholar] [CrossRef] [PubMed]
- Nakamura, S.; Kawai, K.; Takeshita, Y.; Honda, M.; Takamura, T.; Kaneko, S.; Matoba, R.; Matsubara, K. Identification of blood biomarkers of aging by transcript profiling of whole blood. Biochem. Biophys. Res. Commun. 2012, 418, 313–318. [Google Scholar] [CrossRef] [PubMed]
- Badie, C.; Kabacik, S.; Balagurunathan, Y.; Bernard, N.; Brengues, M.; Faggioni, G.; Greither, R.; Lista, F.; Peinnequin, A.; Poyot, T.; et al. Laboratory intercomparison of gene expression assays. Radiat. Res. 2013, 180, 138–148. [Google Scholar] [CrossRef]
- Jen, K.Y.; Cheung, V.G. Transcriptional response of lymphoblastoid cells to ionizing radiation. Genome Res. 2003, 13, 2092–2100. [Google Scholar] [CrossRef]
- Hall, J.; Jeggo, P.A.; West, C.; Gomolka, M.; Quintens, R.; Badie, C.; Laurent, O.; Aerts, A.; Anastasov, N.; Azimzadeh, O.; et al. Ionizing radiation biomarkers in epidemiological studies—An update. Mutat. Res. 2017, 771, 59–84. [Google Scholar] [CrossRef]
- O’Brien, G.; Cruz-Garcia, L.; Majewski, M.; Grepl, J.; Abend, M.; Port, M.; Tichý, A.; Sirak, I.; Malkova, A.; Donovan, E.; et al. FDXR is a biomarker of radiation exposure in vivo. Sci. Rep. 2018, 8, 684. [Google Scholar] [CrossRef]
- Rothkamm, K.; Beinke, C.; Romm, H.; Badie, C.; Balagurunathan, Y.; Barnard, S.; Bernard, N.; Boulay-Greene, H.; Brengues, M.; De Amicis, A.; et al. Comparison of established and emerging biodosimetry assays. Radiat. Res. 2013, 180, 111–119. [Google Scholar] [CrossRef][Green Version]
- Fenech, M.; Morley, A.A. Cytokinesis-block micronucleus method in human lymphocytes: Effect of in vivo ageing and low dose X-irradiation. Mutat. Res. 1986, 161, 193–198. [Google Scholar] [CrossRef]
- Schlegel, R.; MacGregor, J.T.; Everson, R.B. Assessment of cytogenetic damage by quantitation of micronuclei in human peripheral blood erythrocytes. Cancer Res. 1986, 46, 3717–3721. [Google Scholar]
- Coppé, J.P.; Kauser, K.; Campisi, J.; Beauséjour, C.M. Secretion of vascular endothelial growth factor by primary human fibroblasts at senescence. J. Biol. Chem. 2006, 281, 29568–29574. [Google Scholar] [CrossRef]
- Rodier, F.; Coppe, J.P.; Patil, C.K.; Hoeijmakers, W.A.; Munoz, D.P.; Raza, S.R.; Freund, A.; Campeau, E.; Davalos, A.R.; Campisi, J. Persistent DNA damage signalling triggers senescence-associated inflammatory cytokine secretion. Nat. Cell Biol. 2009, 11, 973–979. [Google Scholar] [CrossRef]
- Brzostek-Racine, S.; Gordon, C.; Van Scoy, S.; Reich, N.C. The DNA damage response induces IFN. J. Immunol. 2011, 187, 5336–5345. [Google Scholar] [CrossRef] [PubMed]
- Kondo, T.; Kobayashi, J.; Saitoh, T.; Maruyama, K.; Ishii, K.J.; Barber, G.N.; Komatsu, K.; Akira, S.; Kawai, T. DNA damage sensor MRE11 recognizes cytosolic double-stranded DNA and induces type I interferon by regulating STING trafficking. Proc. Natl. Acad. Sci. USA 2013, 110, 2969–2974. [Google Scholar] [CrossRef] [PubMed]
- Härtlova, A.; Erttmann, S.F.; Raffi, F.A.; Schmalz, A.M.; Resch, U.; Anugula, S.; Lienenklaus, S.; Nilsson, L.M.; Kröger, A.; Nilsson, J.A.; et al. DNA damage primes the type I interferon system via the cytosolic DNA sensor STING to promote anti-microbial innate immunity. Immunity 2015, 42, 332–343. [Google Scholar] [CrossRef]
- Du, S.; Chen, G.; Yuan, B.; Hu, Y.; Yang, P.; Chen, Y.; Zhao, Q.; Zhou, J.; Fan, J.; Zeng, Z. DNA sensing and associated type 1 interferon signaling contributes to progression of radiation-induced liver injury. Cell. Mol. Immunol. 2020. [Google Scholar] [CrossRef]
- Ranoa, D.R.; Parekh, A.D.; Pitroda, S.P.; Huang, X.; Darga, T.; Wong, A.C.; Huang, L.; Andrade, J.; Staley, J.P.; Satoh, T.; et al. Cancer therapies activate RIG-I-like receptor pathway through endogenous non-coding RNAs. Oncotarget 2016, 7, 26496–26515. [Google Scholar] [CrossRef]
- Ma, X.; Helgason, E.; Phung, Q.T.; Quan, C.L.; Iyer, R.S.; Lee, M.W.; Bowman, K.K.; Starovasnik, M.A.; Dueber, E.C. Molecular basis of Tank-binding kinase 1 activation by transautophosphorylation. Proc. Natl. Acad. Sci. USA 2012, 109, 9378–9383. [Google Scholar] [CrossRef]
- Chen, Q.; Sun, L.; Chen, Z.J. Regulation and function of the cGAS-STING pathway of cytosolic DNA sensing. Nat. Immunol. 2016, 17, 1142–1149. [Google Scholar] [CrossRef]
- Przanowski, P.; Loska, S.; Cysewski, D.; Dabrowski, M.; Kaminska, B. ISG’ylation increases stability of numerous proteins including Stat1, which prevents premature termination of immune response in LPS-stimulated microglia. Neurochem. Int. 2018, 112, 227–233. [Google Scholar] [CrossRef]
- Bogunovic, D.; Boisson-Dupuis, S.; Casanova, J.L. ISG15: Leading a double life as a secreted molecule. Exp. Mol. Med. 2013, 45, e18. [Google Scholar] [CrossRef] [PubMed]
- Schröder, S.; Juerß, D.; Kriesen, S.; Manda, K.; Hildebrandt, G. Immunomodulatory properties of low-dose ionizing radiation on human endothelial cells. Int. J. Radiat. Biol. 2019, 95, 23–32. [Google Scholar] [CrossRef] [PubMed]
- Schröder, S.; Kriesen, S.; Paape, D.; Hildebrandt, G.; Manda, K. Modulation of inflammatory reactions by low-dose ionizing radiation: Cytokine release of murine endothelial cells is dependent on culture conditions. J. Immunol. Res. 2018, 2018, 2856518. [Google Scholar] [CrossRef] [PubMed]
- Wang, H.; Segaran, R.C.; Chan, L.Y.; Aladresi, A.A.M.; Chinnathambi, A.; Alharbi, S.A.; Sethi, G.; Tang, F.R. Gamma radiation-induced disruption of cellular junctions in HUVECs Is mediated through affecting MAPK/NF-κB inflammatory pathways. Oxid. Med. Cell. Longev. 2019, 2019, 1486232. [Google Scholar] [CrossRef] [PubMed]
- Sheridan, C. Drug developers switch gears to inhibit STING. Nat. Biotechnol. 2019, 37, 199–201. [Google Scholar] [CrossRef]


Publisher’s Note: MDPI stays neutral with regard to jurisdictional claims in published maps and institutional affiliations. |
© 2020 by the authors. Licensee MDPI, Basel, Switzerland. This article is an open access article distributed under the terms and conditions of the Creative Commons Attribution (CC BY) license (http://creativecommons.org/licenses/by/4.0/).
Share and Cite
Philipp, J.; Le Gleut, R.; Toerne, C.v.; Subedi, P.; Azimzadeh, O.; Atkinson, M.J.; Tapio, S. Radiation Response of Human Cardiac Endothelial Cells Reveals a Central Role of the cGAS-STING Pathway in the Development of Inflammation. Proteomes 2020, 8, 30. https://doi.org/10.3390/proteomes8040030
Philipp J, Le Gleut R, Toerne Cv, Subedi P, Azimzadeh O, Atkinson MJ, Tapio S. Radiation Response of Human Cardiac Endothelial Cells Reveals a Central Role of the cGAS-STING Pathway in the Development of Inflammation. Proteomes. 2020; 8(4):30. https://doi.org/10.3390/proteomes8040030
Chicago/Turabian StylePhilipp, Jos, Ronan Le Gleut, Christine von Toerne, Prabal Subedi, Omid Azimzadeh, Michael J. Atkinson, and Soile Tapio. 2020. "Radiation Response of Human Cardiac Endothelial Cells Reveals a Central Role of the cGAS-STING Pathway in the Development of Inflammation" Proteomes 8, no. 4: 30. https://doi.org/10.3390/proteomes8040030
APA StylePhilipp, J., Le Gleut, R., Toerne, C. v., Subedi, P., Azimzadeh, O., Atkinson, M. J., & Tapio, S. (2020). Radiation Response of Human Cardiac Endothelial Cells Reveals a Central Role of the cGAS-STING Pathway in the Development of Inflammation. Proteomes, 8(4), 30. https://doi.org/10.3390/proteomes8040030