Article

A Proteomic View of Salmonella Typhimurium in Response to Phosphate Limitation

Institute of Analytical Chemistry and Synthetic and Functional Biomolecules Center, College of Chemistry and Molecular Engineering, Peking University, 202 Chengfu Rd, Haidian District, Beijing 100871, China
*
Author to whom correspondence should be addressed.
Proteomes 2018, 6(2), 19; https://doi.org/10.3390/proteomes6020019
Submission received: 25 March 2018 / Revised: 22 April 2018 / Accepted: 23 April 2018 / Published: 25 April 2018

Abstract

:
Salmonella enterica serovar Typhimurium (S. Typhimurium), an important foodborne pathogen, often encounters phosphate (Pi) shortage both in the environment and inside host cells. To gain a global view on its physiological responses to Pi starvation, we performed proteomic profiling of S. Typhimurium upon the shift from Pi-rich to Pi-low conditions. In addition to the Pho regulon, many metabolic processes were up-regulated, such as glycolysis, pentose phosphate pathway, pyrimidine degradation, glycogen, and trehalose metabolism, allowing us to chart an overview of S. Typhimurium carbon metabolism under Pi starvation. Furthermore, proteomic analysis of a mutant lacking phoB (that encodes a key regulator of Pi shortage response) suggested that only a small subset of the altered proteins upon Pi limitation was PhoB-dependent. Importantly, we present evidence that S. Typhimurium N-acetylglucosamine catabolism was induced under Pi-limiting conditions in a PhoB-dependent manner. Immunoblotting and β-galactosidase assays demonstrated that PhoB was required for the full activation of NagB, a key enzyme of this pathway, in response to low Pi. Thus, our study reveals that N-acetylglucosamine catabolism may represent an additional PhoB-regulated pathway to tackle bacterial Pi shortage.

1. Introduction

As an essential element for life, phosphorus participates in many important cellular processes such as DNA and RNA synthesis, energy metabolism, membrane integrity and signal transduction [1]. Therefore, it is critical to maintain cellular phosphorus homeostasis. In bacteria, the most assimilable form of phosphorus is inorganic phosphate (Pi) [2,3]. Many bacteria have evolved elaborate mechanisms to sense and respond to the level of phosphate in the surrounding medium. A prominent mechanism of Pi management is the Phosphate (Pho) regulon, which is controlled by a two-component regulatory system (TCS) [3]. While nomenclatures differ among diverse bacteria, in Escherichia coli (E. coli) this regulatory circuit is called the PhoR-PhoB TCS. TCS is often composed of a histidine kinase (e.g., PhoR) and a response regulator (e.g., PhoB) [4]. Under Pi-limiting conditions, PhoR is activated and phosphorylates PhoB, which in turn drives the expression of many downstream genes by binding to specific DNA sequences (known as the Pho box).
Salmonella enterica serovar Typhimurium (S. Typhimurium) is a foodborne intracellular bacterial pathogen that causes acute gastroenteritis [5]. Upon infection of host cells, S. Typhimurium can survive and replicate within a membrane-bound compartment called Salmonella-containing vacuoles (SCVs) [6,7]. To support intracellular growth, it is often indispensable for S. Typhimurium to tailor its metabolic pathways within the host niche. By using high-throughput proteomic approaches, we previously characterized protein expression of intracellular S. Typhimurium at distinct stages of infection, revealing extensive bacterial adaptations to host epithelial cells [8,9,10]. A salient feature of such adaptations is the induction of Pi uptake and utilization pathways, consistent with Pi deficiency within SCVs.
Thus far, most of our knowledge of bacterial responses to Pi starvation has been gathered from the studies of E. coli [11,12,13,14]. In particular, the Pho regulon has been extensively characterized due to its central role in managing Pi homeostasis. It contains at least 40 members, including the high-affinity Pi uptake system PstSCAB-PhoU [15]. Upon binding to PstS in the periplasm, Pi can be transported into bacterial cytoplasm through a channel formed by PstA and PstC while the ATP-dependent permease PstB provides the energy required for transport [3,4,16,17,18,19]. PhoU is required for dephosphorylation of PhoB in an unknown manner when Pi becomes sufficient. Though expected to share some features with its E. coli counterpart, S. Typhimurium physiological responses to Pi starvation are less understood in particular on a systems level.
Herein we reported a proteomic survey of S. Typhimurium upon the shift from Pi-sufficient to Pi-limiting conditions. Among approximately 1600 detected proteins, we found differential regulation of 389 bacterial proteins. To differentiate PhoB-regulated and PhoB-independent pathways, we further analyzed the proteome of a phoB-deleting mutant in comparison to that of its parental strain. Interestingly, most of the altered proteins under Pi starvation are independent of the PhoR-PhoB regulatory system. Importantly, two enzymes involved in N-acetylglucosamine catabolism, NagA and NagB, were induced upon Pi starvation in a PhoB-dependent manner. Immunoblotting and β-galactosidase assays were exploited to further establish the regulation of Nag by PhoB. In summary, our proteomic work provides a global view of S. Typhimurium adaptation mechanisms during Pi starvation and identifies Nag as additional members of the PhoB regulon, which could aid in the future development of new treatment strategies for this bacterial pathogen.

2. Materials and Methods

2.1. Bacterial Strains and Culture Conditions

The Salmonella enterica serovar Typhimurium wild-type (WT) strain 14028s was kindly provided by Feng Shao’s laboratory (National Institute of Biological Sciences, Beijing, China). All of S. Typhimurium deletion mutants and strains chromosomally expressing 3 × FLAG-tagged proteins were generated by the λ-red recombination system as described previously [20,21]. A kanamycin-resistant fragment was introduced in those strains either at the site of deleted genes or after the FLAG tag. For constructing the complementation strain that harbors a copy of plasmid-borne phoB in the ΔphoB background (ΔphoB + pPhoB), the phoB fragment was inserted into a plasmid with an arabinose-inducible promoter. For constructing the strains used in β-galactosidase assays, the upstream regions of nagB or pstS were cloned and inserted into the upstream of lacZ in a single copy plasmid pNN387 [22]. All bacterial strains were maintained at −80 °C in Luria-Bertani (LB) broth supplemented with 25% (v/v) glycerol. A single colony was inoculated into 3 mL of MOPS (morpholinepropanesulfonic acid) medium with 1 mM phosphate (Pi+) [23] and grown overnight at 37 °C with shaking. The overnight culture was then subcultured (diluted 1:20 into 3 mL of MOPS medium) with 1 mM phosphate and harvested when the optical density at 600 nm (OD600) reached approximately 0.5. For phosphate starvation, bacteria were first subcultured in Pi+ MOPS medium till OD600 reached 0.3. Then cells were washed twice and resuspended in MOPS medium without phosphate (Pi). The culture was harvested when OD600 reached 0.5.

2.2. SDS-PAGE, in-Gel Protein Digestion and Stable Isotope Dimethyl Labeling

Bacterial pellets were resuspended in the SDS sample buffer and then boiled for 5 min. Approximately 100 μg of proteins were loaded onto 10% SDS-PAGE and separated into eight fractions (see Supplementary Figure S1). In-gel protein digestion was performed as previously reported [24]. Briefly, gel slices were cut into approximately 1 mm3 cubes and destained with 50% acetonitrile (ACN) in 50 mM triethyl ammonium bicarbonate (TEAB), then dehydrated with pure ACN. After vacuum dehydration, protein digestion was performed in a buffer containing 1.2 ng/μL trypsin in 50 mM TEAB (10% ACN) at 37 °C overnight. Tryptic peptides were extracted from gel cubes twice by incubating with 50% ACN and 5% formic acid (FA) for 20 min at 37 °C. Finally, extracted peptides were pooled and vacuum dried for stable isotopic labeling.
The dimethyl labeling experiments were performed as previously described [25]. Tryptic peptides were resuspended in 100 μL of the reaction buffer (100 mM TEAB) followed by the addition of 4 μL of 0.6 M sodium cyanoborohydride (NaBH3CN). Peptides from the WT strain cultured in Pi-limiting conditions were labeled with 4 μL 4% formaldehyde (CH2O) while peptides from the WT strain cultured in Pi-rich conditions and the ΔphoB mutant were labeled with the same amount of deuterated formaldehyde (CD2O), respectively. The reaction mixture was vortexed and incubated for 1 h at room temperature. The reaction was stopped by sequential addition of 16 μL of 1% (v/v) ammonia and 8 μL of formic acid. Finally, light- and heavy-labeled peptides were pooled and vacuum dried for further mass spectrometric analyses.

2.3. Nanoflow LC-MS/MS Analyses

LC-MS/MS experiments were performed on a nano-LC (EASY-nLC 1200, Thermo Scientific, Waltham, MA, USA) coupled with a hybrid ion trap-Orbitrap mass spectrometer (Orbitrap Velos, Thermo Scientific, USA). The capillary column (75 μm × 150 mm) with a laser-pulled electrospray tip (Model P-2000, Sutter Instruments, Novato, CA, USA) was home-packed with 4 μm, 100 Å Magic C18AQ silica-based particles (Michrom BioResources Inc., Auburn, CA, USA). Peptide samples were reconstituted in Buffer A (described below) and approximately 200 ng of samples were loaded onto the analytical column in a single LC-MS/MS run. The mobile phase comprised of Buffer A (97% H2O, 3% ACN, and 0.1% FA) and Buffer B (100% ACN and 0.1% FA). The LC separation was carried out with the following gradient: Buffer B was started at 7% for 3 min, and then raised to 35% over 120 min. Subsequently, Buffer B was rapidly increased to 90% in 2 min and maintained for 10 min before 100% Buffer A was used for column equilibration. The mass spectrometer was operated in a data-dependent mode. One full MS scan (m/z 350–1500) was acquired by the Orbitrap mass analyzer with R = 60,000 and followed by fragmentation of the ten most intense ions in the ion trap under collision-induced dissociation (CID). Dynamic exclusion was enabled with repeat duration of 30 s and exclusion duration of 12 s.

2.4. Proteomic Data Processing and Bioinformatics Analysis

Raw data were searched against the S. Typhimurium 14028s protein database (5472 sequences, downloaded from UniProt) using the Andromeda search engine included in MaxQuant [26]. The precursor mass tolerance was set at 20 ppm and the fragment mass tolerance was set at 0.8 Da. Trypsin was selected as the digestive enzyme with a maximum of two missed cleavages. Dimethyl (K, N-term) and dimethyl (D4K, D4N-term) were set as variable modifications for light (L)- and heavy (H)-labeled samples, respectively. Oxidation (M) was set as a variable modification as well. Both peptide and protein assignments were filtered to achieve a false discovery rate (FDR) <1%. Peptides used for protein quantification were set to razor and unique peptides. Only peptides that were identified in all three biological replicates were used for protein quantification. Normalized heavy to light (H/L) ratios were calculated by MaxQuant and further processed by the Perseus software (version 1.5.4.1). Potential contaminants and the hits from the reverse database search were excluded. The p-values were obtained by using the one-sample two-tailed Student’s t-test. Proteins with abundance ratios (H/L) >2.0 or <0.5 and p-values < 0.05 were considered as significant differences between samples.
For the analysis of protein-protein interactions, differentially expressed proteins were searched against the STRING database (Search Tool for the Retrieval of Interacting Genes/Protein, http://string-db.org/) with the highest confidence score (score > 0.9). Only the interaction network with at least three proteins was shown, and the unconnected proteins or clusters with two proteins were not presented.

2.5. Bacterial Growth Competition Assays

Overnight cultures of WT and kanamycin-resistant ΔotsB strains were washed twice and resuspended in Pi MOPS medium with a final OD600 of 0.3. Then equally mixed cultures were further inoculated for 3 hours before plating on LB agar plates with and without the supplementation of 20 μg/mL kanamycin, respectively. The plates were incubated at 37 °C for 24 h. The number of viable bacteria in the original cultures was determined by colony-forming unit (CFU) assays. The competitive index is defined as the number of viable WT bacteria divided by that of mutant bacteria. Results are presented as the mean of three independent experiments.

2.6. Western Blot Analysis

A Salmonella strain expressing 3 × FLAG-tagged NagB was cultured under either the Pi+ or Pi media as described above. Gel-separated bacterial proteins were transferred to the PVDF membrane and probed with primary antibodies specific for FLAG (Sigma, St. Louis, MO, USA) (1:5000) and anti-mouse HRP-conjugated secondary antibodies (Sigma, St. Louis, MO, USA) (1:5000). As a loading control, DnaK was probed by using Salmonella anti-DnaK (Enzo Life Sciences, New York, NY, USA) (1:5000) and anti-mouse HRP-conjugated secondary antibodies (Sigma, St. Louis, MO, USA) (1:5000).

2.7. β-Galactosidase Activity Assays

β-galactosidase activity assays were performed as previously described [10]. Briefly, Salmonella strains were cultured in the Pi media as described above. Bacterial pellets from 3 mL of cultures were resuspended in 1.2 mL of Z buffer (0.06 M Na2HPO4, 0.04 M NaH2PO4, 0.01 M KCl, and 0.001 M MgSO4) with freshly added 50 mM β-mercaptoethanol. 30 μL of chloroform and 15 μL of 0.1% SDS were added and mixed by vortexing. The assays were started by the addition of 240 μL of 4 mg/mL O-nitrophenyl-d-galactopyranoside (ONPG). Upon the observation of a faint yellow color, the reaction was quenched by the addition of 600 μL of 1 M Na2CO3 and the reaction time was noted. Finally, samples were centrifuged at 14,000× g for 2 min, and the OD420 of the culture supernatant was recorded. Assay units were calculated as 1000 × OD420/(OD600) (total time).

3. Results

3.1. Proteomic Analysis of S. Typhimurium in Response to Pi Starvation

To understand S. Typhimurium physiological responses to phosphate starvation, we quantitatively analyzed the bacterial proteome under Pi-rich and Pi-deficient conditions. Equivalent amounts of bacteria were harvested from different culturing conditions (see the method section for details) and used for quantitative LC-MS experiments. To further delineate PhoB-regulated proteins as well as PhoB-independent pathways upon the shift to Pi limitation, we also compared protein expression profile of a phoB-lacking mutant to that of the WT strain under Pi-limiting conditions (Figure 1A). When the Pi supply is sufficient, the phoB mutant grew as well as the WT bacteria. Upon a shift to phosphate starvation, both bacterial strains exhibited much reduced growth rates and the growth of the phoB knockout mutant was not distinguishably slower than that of the WT (Figure 1B), suggesting the contribution of PhoB-independent pathways to bacterial replication. In other words, the lack of the Pho regulon did not noticeably inhibit bacterial growth under Pi-poor conditions, which is consistent with previous findings [12].
For WT bacteria cultured under Pi-replete and Pi-deficient conditions, in total we identified 1651 Salmonella proteins (FDR < 1%) from three biological replicates. Upon the switch to phosphate starvation, indeed the bacterial proteome differed considerably as evidenced by 389 proteins of altered expression. Next, we graphed the fold ratios of protein abundance (Pi/Pi+) as well as corresponding p-values in a volcano plot. Among those altered proteins, 225 proteins were up-regulated (shown in red) and 164 proteins were down-regulated (shown in green) under Pi-limiting conditions (Figure 1C). For those highly induced proteins upon the shift to Pi starvation, we clearly observed several components of the PhoB regulon including PstS, PstB, PhoU, UgpC, PhnS and PhoE. The robust induction of classical PhoB-regulated proteins demonstrates the functional relevance of our culturing conditions. In contrast, the most depressed proteins (shown in the left in Figure 1C) under Pi deficiency are those associated with either the ribosome machinery or amino acid metabolism. A full list of the altered proteins is provided as Supplemental Table S1.

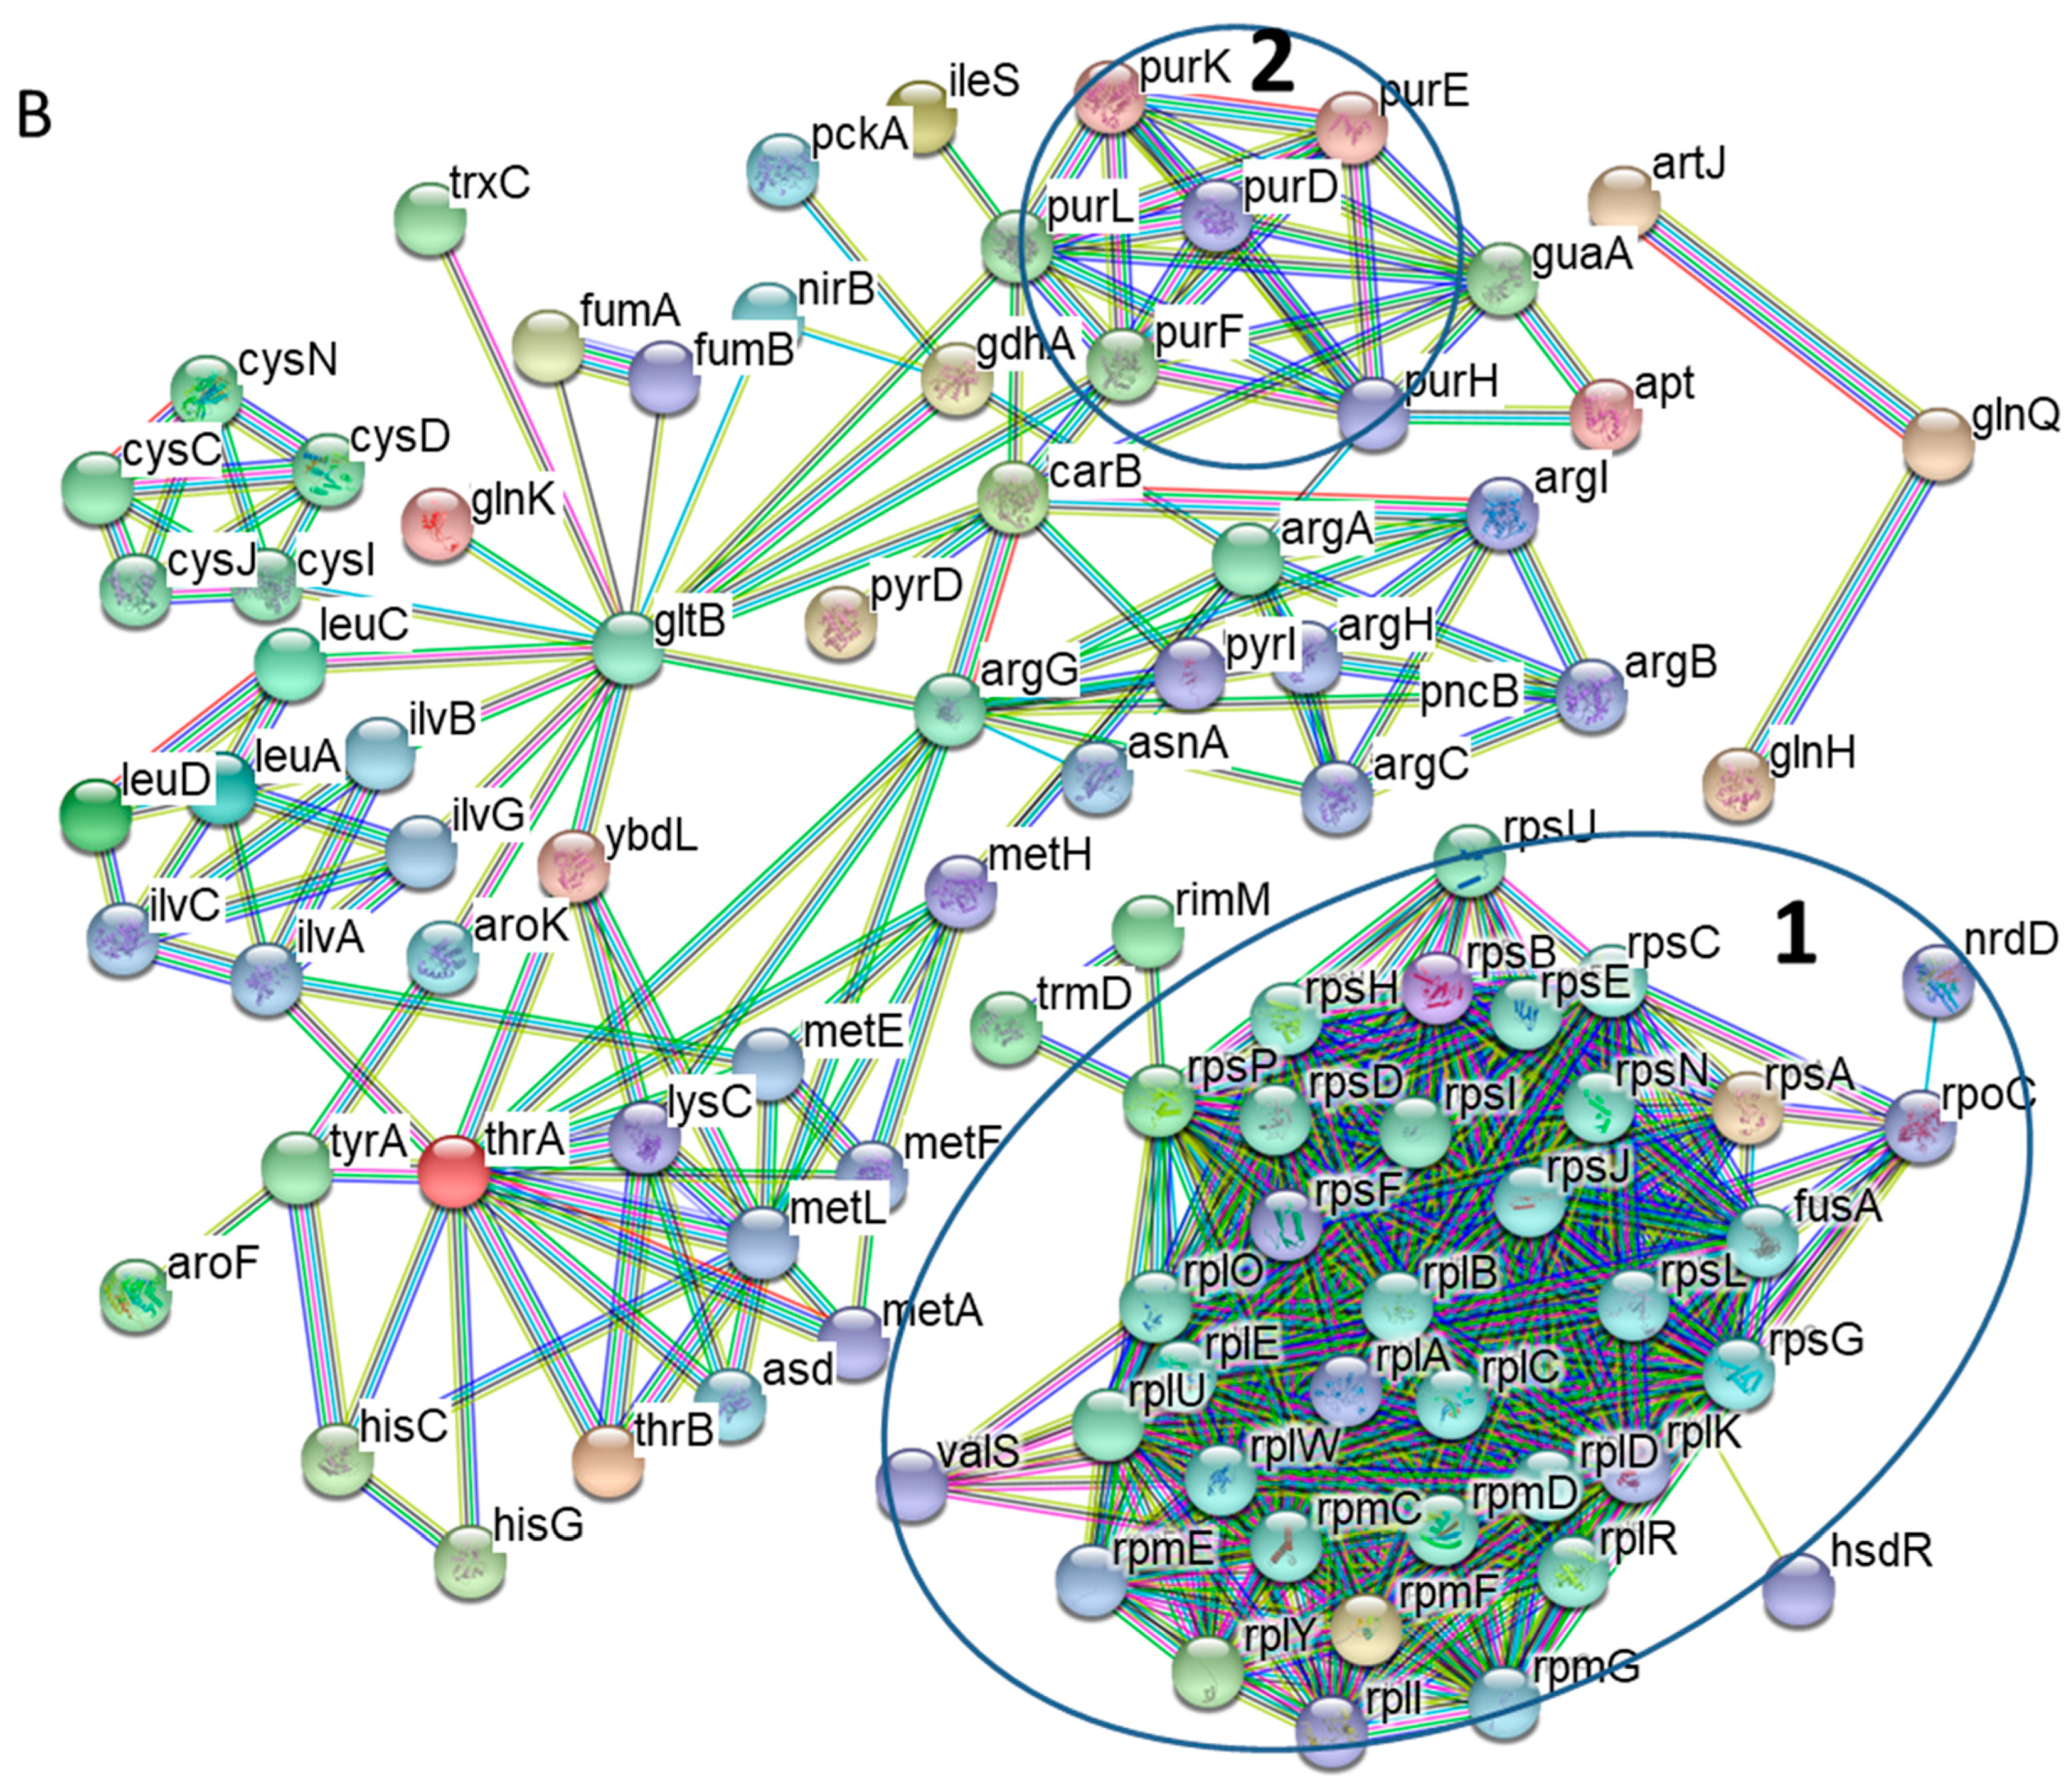
3.2. Protein-Protein Interaction Networks of Altered S. Typhimurium Proteins

To examine protein-protein interactions among those differentially expressed proteins upon the shift to Pi starvation, we conducted network analysis by using the STRING database (Figure 2A). Several network features were revealed among the induced proteins during phosphate starvation. As expected, at least two clusters (enclosed in Circle 1) are readily visible corresponding to the classical Pho regulon. One network contains the PhoR-PhoB regulatory circuit and the Pst high affinity Pi transport system, whereas the small one comprises the Ugp uptake system (UgpB, UgpC and UgpQ) for glycerol-3-phosphate, a phosphorous-containing compound. Additionally, a prominent network is formed by several proteins associated with bacterial virulence (in Circle 2). S. Typhimurium possesses two distinct type III secretion systems (T3SSs) within its pathogenicity islands 1 and 2 (SPI-1 and SPI-2), which are essential for bacterial virulence [6]. Our data revealed a cluster of virulence proteins exclusively from SPI-2 T3SS, including SseA, SsaN, SscA, SsaJ, SsrA, SsrB, and SseL.
Many clusters formed by the up-regulated proteins are involved in bacterial energy metabolism. For instance, many proteins participating in glycolysis were induced under Pi starvation together with the pentose phosphate pathway, making a sizeable interaction network (in Circle 3). Furthermore, this bulky cluster encompasses the proteins involved in pyrimidine degradation such as DeoA, DeoB and DeoC, which provides glyceraldehyde 3-phosphate, a compound that can be readily fed into glycolysis. Interestingly, another notable network is defined by the proteins associated with glycogen and trehalose metabolism (in Circle 4). As the induction of trehalose metabolism during Pi limitation has not been noted before and the otsB gene encodes trehalose-phosphate phosphatase, next we sought to determine its contribution to S. Typhimurium adaptation to Pi deficiency. We constructed a mutant strain lacking otsBotsB) and measured the competition index when ΔotsB was co-cultured with its parental strain under Pi-limiting conditions. The mutant showed no growth defect compared to its isogenic parental strain (see Supplementary Figure S2), suggesting that trehalose metabolism is unlikely to play a major role in coping with Pi starvation. Other clusters include several dehydrogenases (LdhA, LldD, PoxB, AldB, AdhP and YjgB in Circle 5) and proteins involved in glutathione transport and oxidation (Circle 6).
With respect to those down-regulated proteins, a dominant interaction network is made of protein components of the ribosome machinery (Figure 2B, in Circle 1), indicating strong repression of protein translation. In addition, several clusters (scattered throughout the graph) are defined by the proteins involved in amino acid metabolism. Our data revealed down-regulation of the transport and biosynthetic pathways for several amino acids including leucine, isoleucine, methionine, histidine, serine, and arginine. Moreover, an interaction network is formed by the proteins in the purine biosynthesis pathway (in Circle 2).

3.3. Assignment of PhoB-regulated and PhoB-independent Pathways under Pi Starvation

Given the central role of the PhoR-PhoB TCS in mediating Salmonella responses to Pi limitation, next we examined protein expression of a phoB knockout mutant in comparison to that of the WT strain under low Pi conditions. We found strikingly similar expression profiles of the two proteomes (Figure 3A). In fact, only a small set of proteins differed between the mutant and the WT strain, including 5 up-regulated (shown in red) and 22 down-regulated (shown in green) proteins (Figure 3A). These results contrast with the previous observation that the WT proteome differed vastly upon the switch from Pi-replete to Pi-limiting conditions (Figure 1C). Taken together, these findings suggest that the PhoR-PhoB regulatory system only mediates a rather small fraction of the altered proteome upon Pi starvation. In other words, many differentially expressed proteins are likely independent of the PhoR-PhoB control circuit.
Next, we focused our attention on the subset of those down-regulated proteins in the phoB mutant relative to its parental strain, given that most proteins of the Pho regulon are PhoB-activated. As shown in Figure 3A, many known components of the Pho regulon were severely suppressed including proteins encoded in the pst and the ugp operons, PhnS (a 2-aminoethylphosphonate transporter), PhoE (an outer membrane phosphoporin), and ApeE (an outer membrane esterase), which is in good agreement with the well-documented activation of these proteins by PhoB [3]. Intriguingly, we also found marked repression of NagA and NagB, two key enzymes required for bacterial N-acetylglucosamine catabolism, in the phoB mutant proteome (Figure 3A). As also shown by the intensities of two representative peptides, the levels of NagA and NagB were 2 to 3-fold lower in the phoB mutant relative to its parental strain (Figure 3B). The nag operon encodes most proteins in the N-acetylglucosamine catabolic pathway. In E. coli, N-acetylglucosamine can be used as a carbon source after deacetylation by NagA and deamination by NagB, generating fructose 6-phosphate, an important glycolytic intermediate [27]. Encoded in the same operon, NagD is annotated as a phosphatase (potentially for fructose 6-phosphate) [28,29,30], though it was not detected in our work. Therefore, N-acetylglucosamine catabolism may serve as an additional means for bacterial Pi supply. In support of this notion, we found robust induction (5 to 9-fold) of NagA and NagB in WT bacteria upon the shift from Pi-rich to Pi-low conditions.

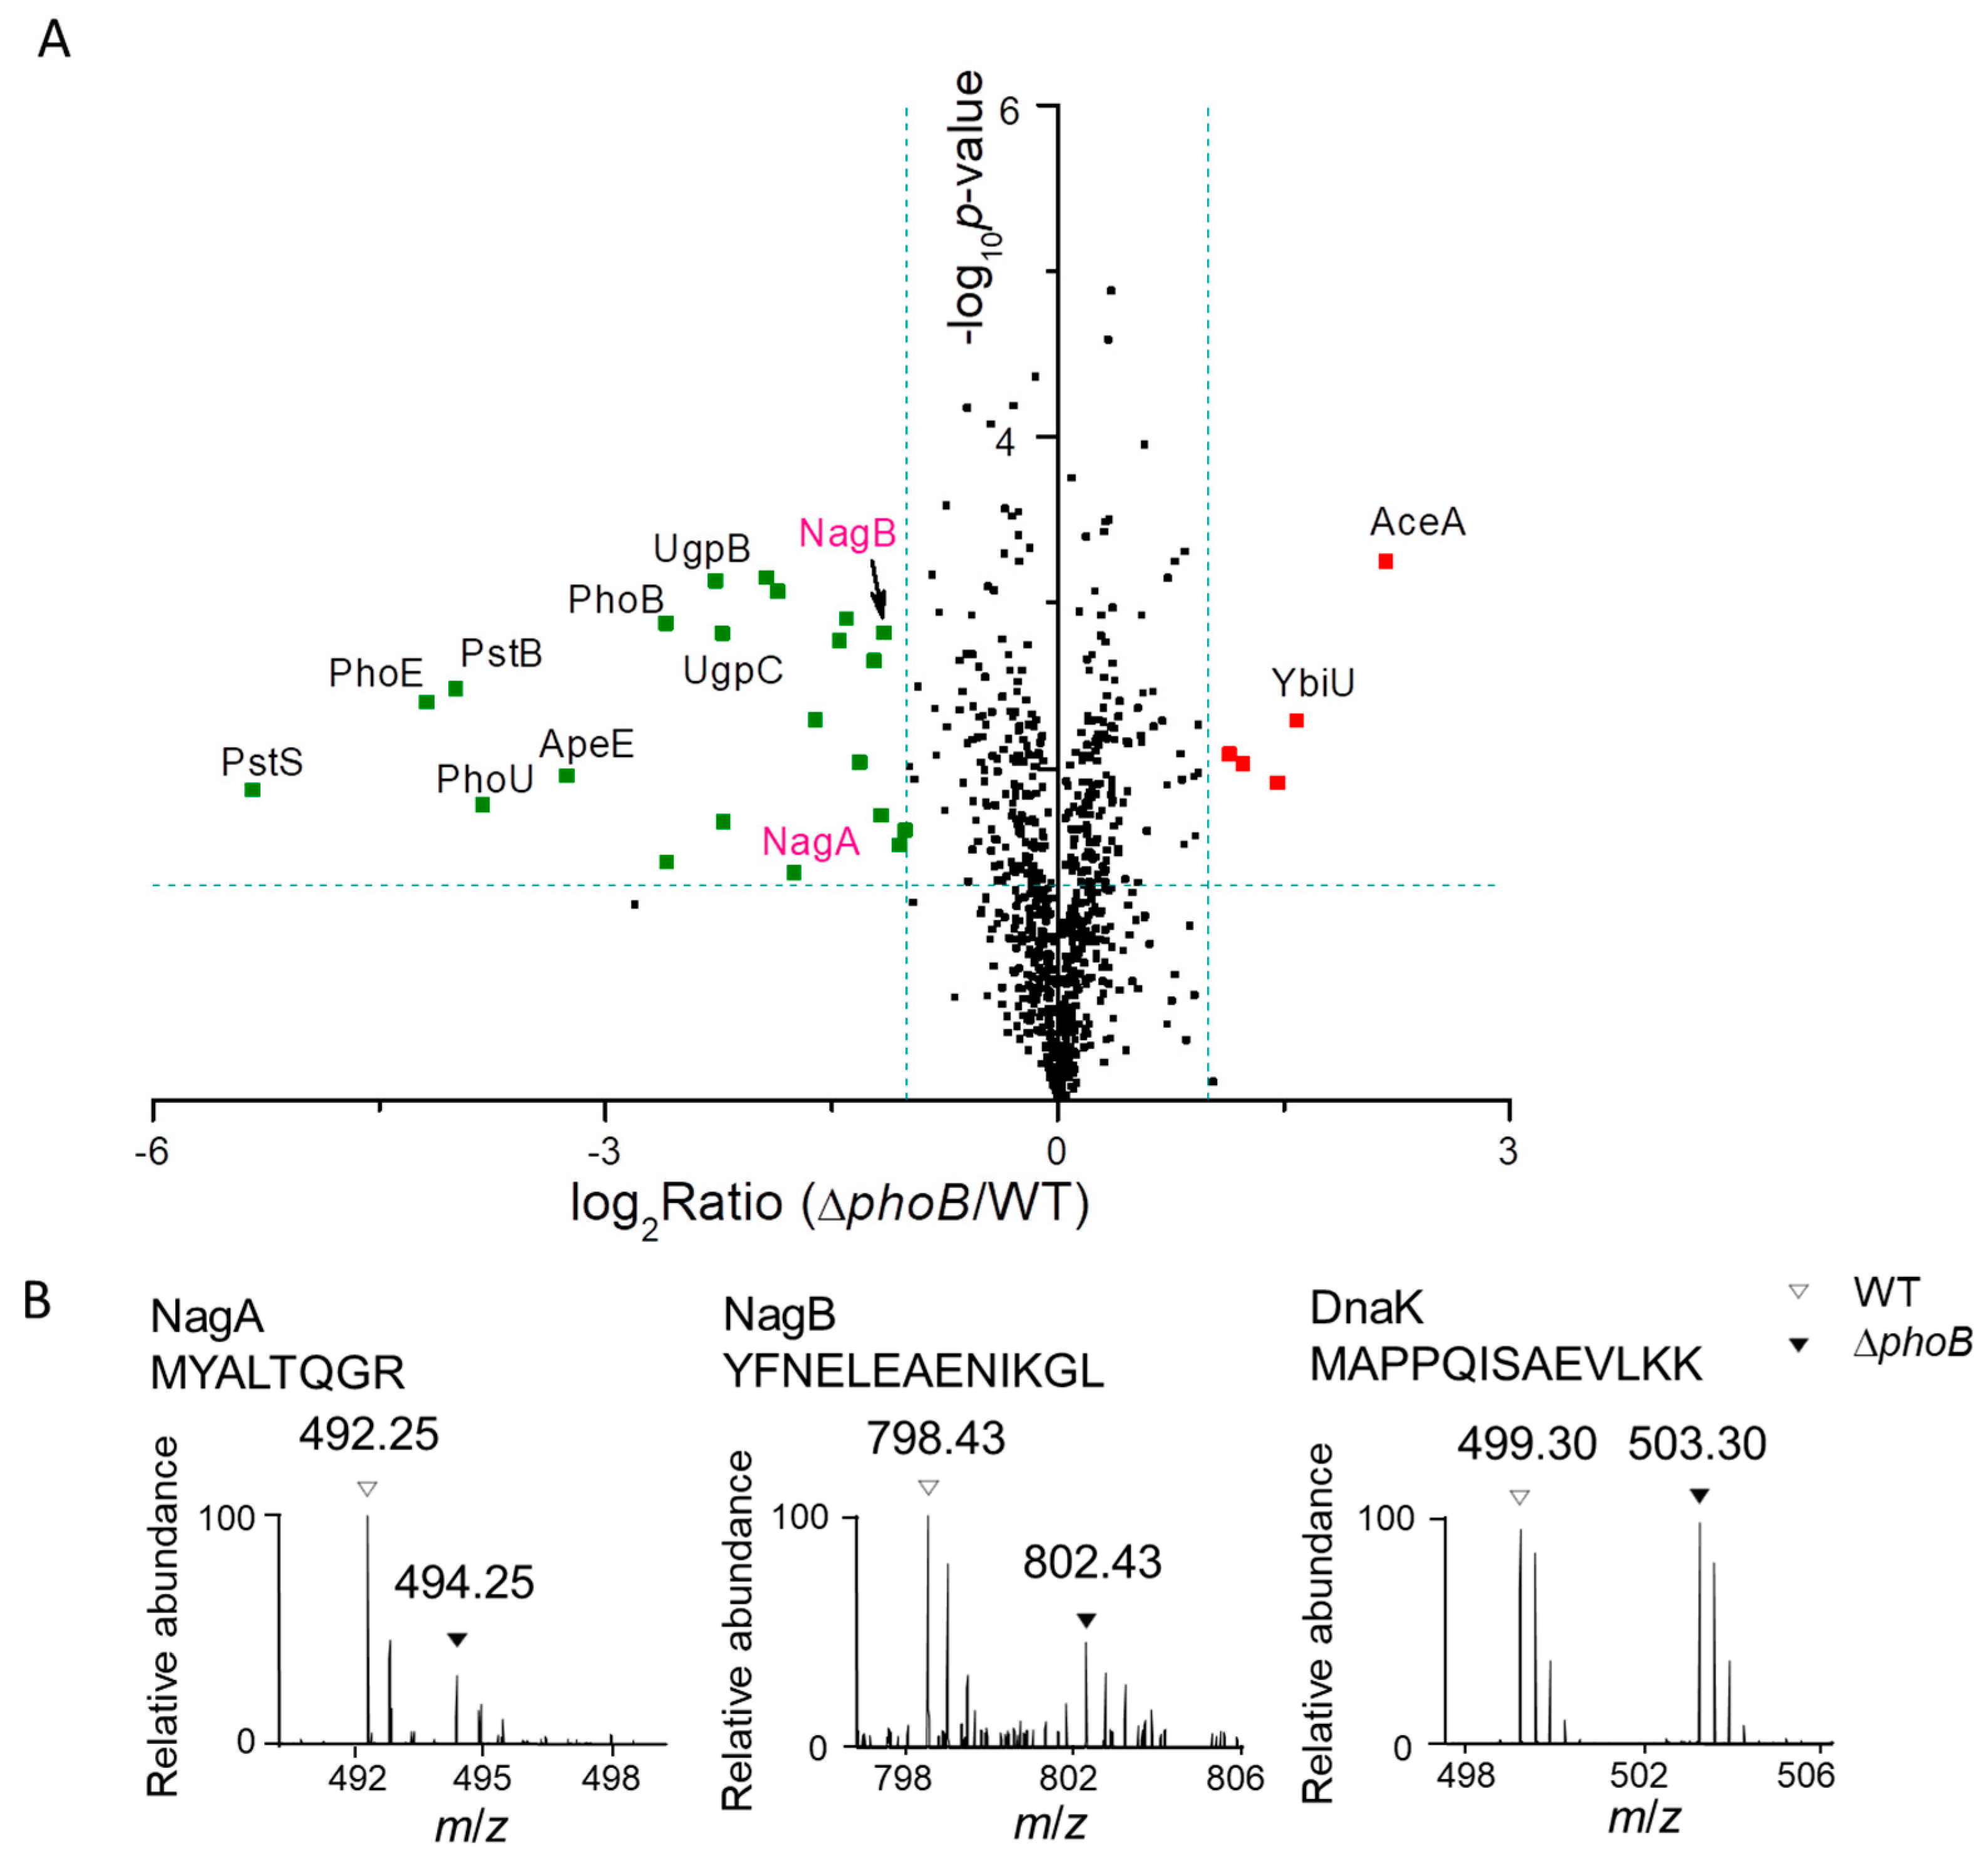
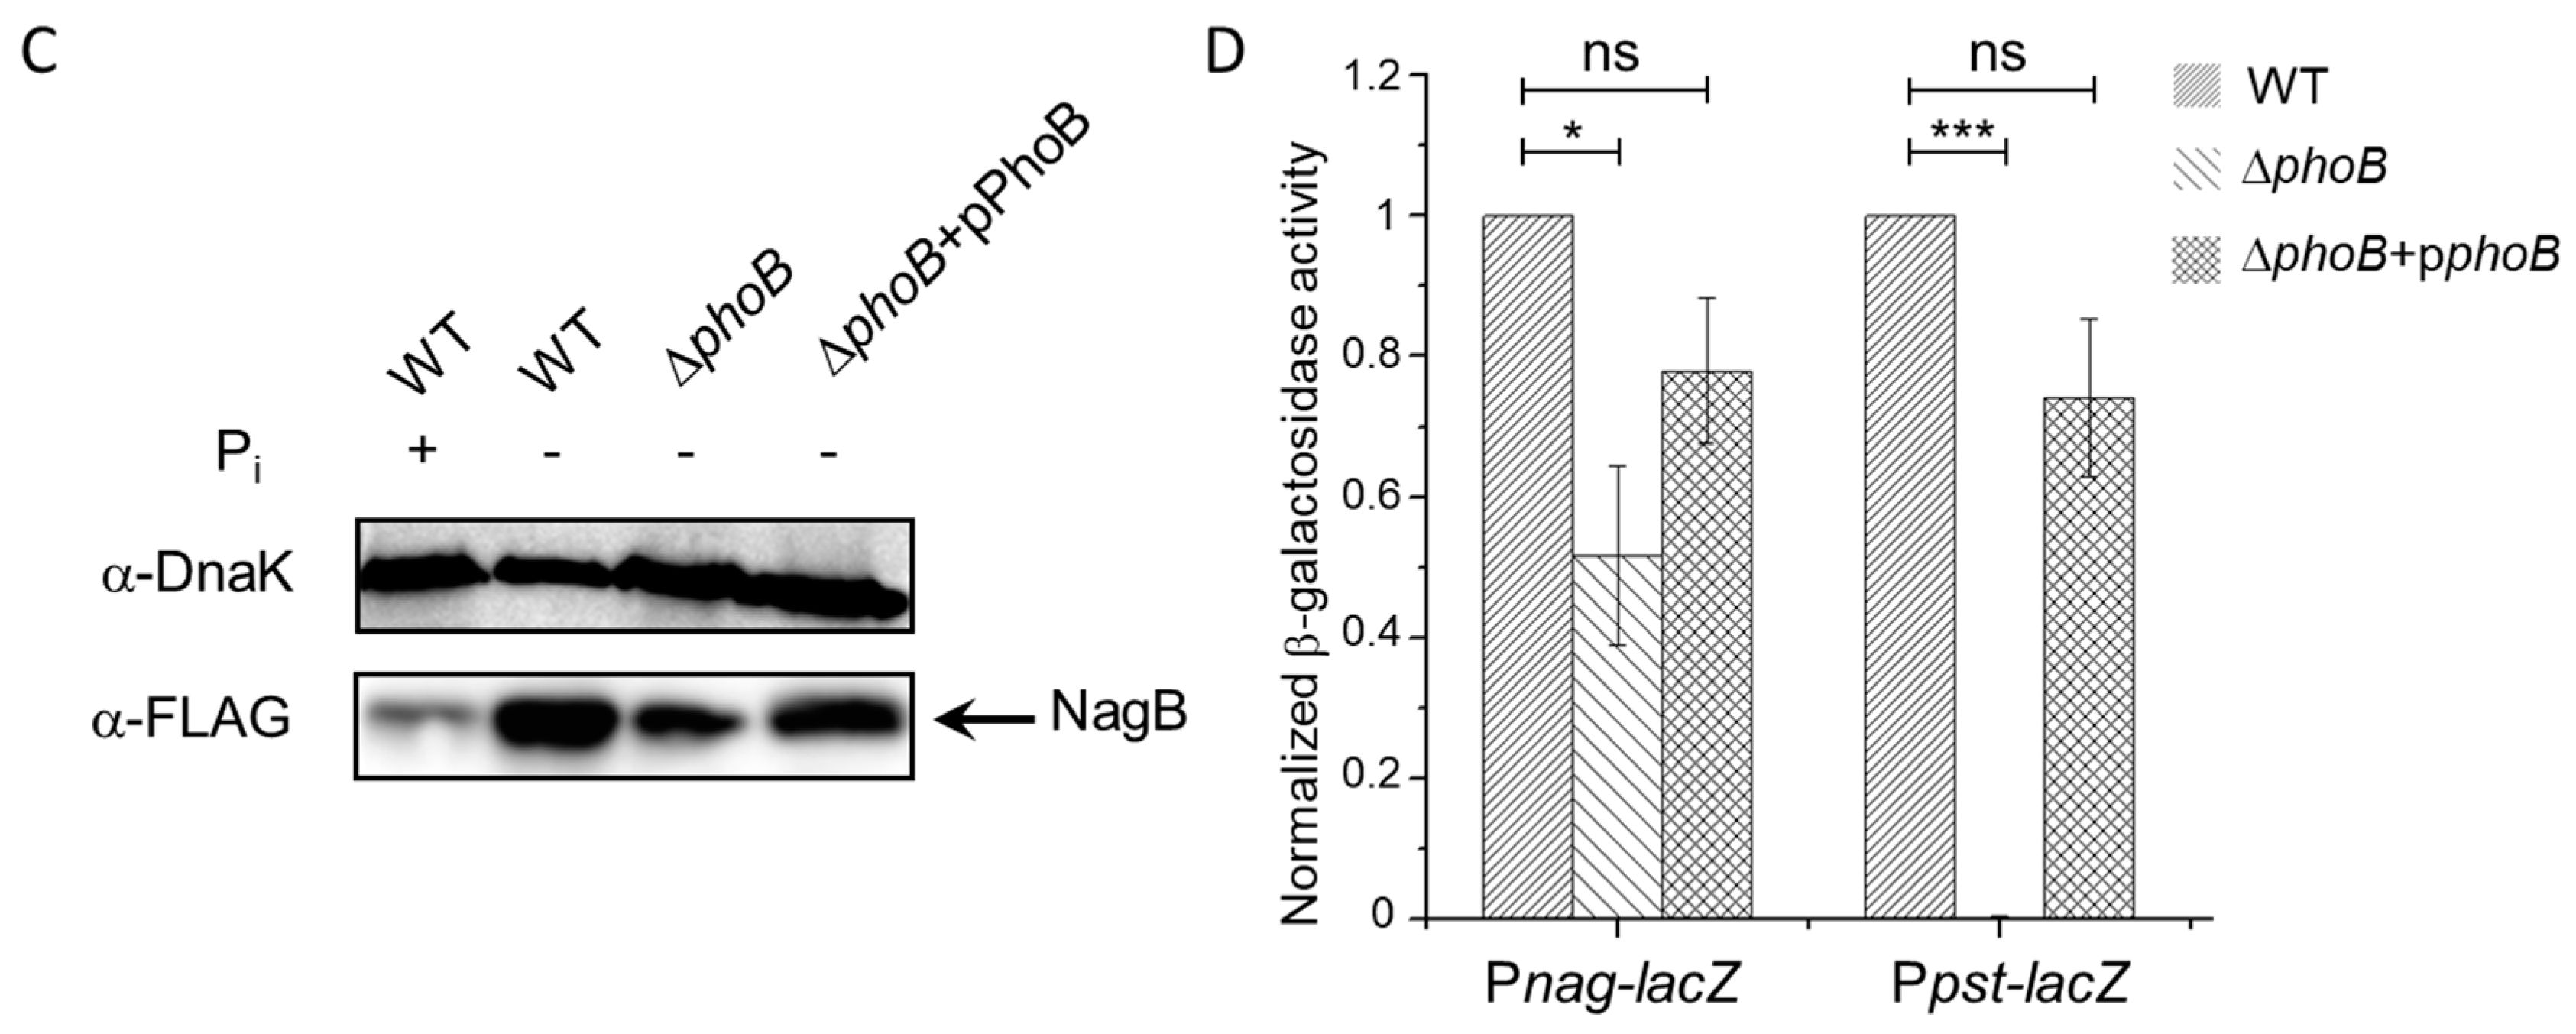
3.4. PhoB-Dependent Induction of S. Typhimurium Nag during Pi Starvation

Considering the potential role of N-acetylglucosamine catabolism in generating additional Pi, next we set out to verify the proteomic changes of NagB during Pi starvation by immunoblotting assays. To do this, we engineered S. Typhimurium strains chromosomally expressing a 3×FLAG-tagged version of NagB in different genetic backgrounds (WT, ΔphoB and a complementation strain ΔphoB + pPhoB). We confirmed the expression of PhoB in the WT and complementation strains but not the deletion mutant by using selected reaction monitoring (SRM) experiments (data provided as Supplementary Figure S3). Consistent with our proteomic data, immunoblotting analyses confirmed the marked elevation of NagB expression upon the switch to Pi-limiting conditions. Importantly, the full induction of NagB required the regulator PhoB as evidenced by the lower level of NagB in a phoB knockout mutant. Furthermore, introduction of a copy of plasmid-borne phoB into the phoB-deleting strain restored, at least partially, the expression level of NagB during Pi deficiency. Together, these data suggest that S. Typhimurium up-regulates N-acetylglucosamine catabolism during Pi starvation in a PhoB-dependent manner. That being said, our immunoblotting data revealed partial induction of NagB in the phoB-lacking strain upon the shift to Pi limitation (Figure 3C), indicating potential PhoB-independent regulatory mechanisms as well.
Next, we used β-galactosidase assays to clarify the transcriptional control of the nag operon by PhoB. We constructed S. Typhimurium reporter strains harboring lacZ fusions to the nagB promoter (Pnag-lacZ) in different genetic backgrounds (WT, ΔphoB and ΔphoB + pPhoB). At the same time, we included bacterial strains harboring a plasmid with the pst promoter-lacZ fusion (Ppst-lacZ) as positive controls in the assays. Measurements of β-galactosidase activities revealed that the ΔphoB strain exhibited markedly lower transcription levels of lacZ than those in the WT during Pi starvation (Figure 3D). Complementation with a phoB-expressing plasmid restored, at least in part, the nag promoter activity. These transcriptional readouts are indeed consistent with our previous proteomic and immunoblotting results. In comparison, the dependence of Ppst-lacZ transcription on PhoB is much more pronounced because β-galactosidase activities were barely detected in the phoB deletion mutant. Taken together, these findings established that S. Typhimurium PhoB transcriptionally controls, at least partially, the induction of N-acetylglucosamine catabolism after the shift to Pi starvation.

4. Discussion

Previously, studies of bacterial adaptations to Pi starvation were mostly carried out in E. coli [2,11,12,13,14]. Our current work comparatively analyzed S. Typhimurium proteome upon the switch from Pi-rich to Pi-low conditions. The induction of the classical Pho regulon and the repression of ribosomal proteins and amino acid metabolism are in line with previous transcriptome analysis in E. coli [11,12]. It is interesting to note that under Pi starvation S. Typhimurium may have entered the stationary phase earlier than usual (see Figure 1B). Therefore, some of the proteomic changes (e.g., the general repression of protein translation) may be attributed to the stationary phase response [11]. Furthermore, many proteins associated with SPI-2 T3SS were up-regulated, which is consistent with the activation of SPI-2 genes under low Pi conditions [31]. It is well known that SCVs (the compartment where S. Typhimurium resides intracellularly) are poor in Pi, which serves as one of the environmental cues for SPI-2 activation. It is also interesting to note that Chekabab et al. reported activation of T3SS virulence genes in enterohemorrhagic E. coli (EHEC) in response to Pi starvation [12].
In our study, many up-regulated S. Typhimurium proteins after the shift to Pi-limiting conditions are involved in energy metabolism. Both glycolytic and pentose phosphate pathways (PPP) in central carbon metabolism were markedly induced, consistent with E. coli mRNA studies [11,12,14]. Previously, Schuhmacher et al. proposed that in E. coli ATP generation (from ATP synthase) would be adversely affected under Pi starvation, leading to increased substrate demand and hence higher glucose uptake [14]. Such a notion seems to explain well the up-regulation of glycolysis upon Pi limitation. It is also worthwhile to note that elevated glycolysis itself can serve as an additional means of ATP generation (though with less efficiency). In addition to glycolysis and PPP, pyrimidine degradation, glycogen and trehalose metabolism were induced as well.
To get a better understanding of these altered metabolic processes, we organized them in distinct modules containing sequential enzymatic reactions, generating a graphic overview of these pathways (Figure 4). Notably, the products of pyrimidine/glycogen/trehalose degradation pathways can be channeled into glycolysis at certain steps, indicating the extensive coupling of these up-regulated processes. It is worth noting that several metabolic pathways in Figure 4 (i.e., glycolysis, PPP and pyrimidine degradation) were found to be induced or at high expression levels during bacterial infection of host cells [9], suggesting that some proteomic features of intracellular Salmonella are likely to be shaped by Pi starvation inside SCVs. Other than substrates such as pyruvate, increased glycolysis also results in a higher level of NADH. In addition, NADH buildup would be intensified by the disruption of oxidative phosphorylation (due to the lack of Pi). To counteract the excess of NADH, cells may resort to less efficient dehydrogenases rather than the electron transport chain [14]. In support of this notion, we found up-regulation of several dehydrogenases under Pi-deficient conditions.
Importantly, we also uncovered NagA and NagB as the additional members of the Pho regulon by comparing the proteome of a phoB mutant to that of the WT under Pi-limiting conditions. We provided multiple lines of evidence including immunoblotting and β-galactosidase assays that Nag expression is under the control of PhoB during Pi starvation. Yet we do note that unlike classical PhoB-regulated proteins (e.g., those encoded in the pst operon), additional mechanisms seem to be involved in the control of Nag expression as well. A known repressor of the nag operon is NagC, which unfortunately was not detected in our LC-MS experiments probably owing to its low expression level. Last but not the least, the proteomic study of the phoB mutant allows us to conclude that PhoB only regulates a small subset of the altered proteins upon the shift from Pi-rich to Pi-poor conditions. In other words, most proteomic changes we observed under Pi starvation are PhoB-independent, including those carbon metabolic pathways discussed above.

Supplementary Materials

The following are available online, Figure S1: A representative gel image of bacterial cell lysates fractionated by SDS-PAGE, Figure S2: Competitive growth index of the WT and ΔotsB strains, Figure S3: Determination of PhoB levels in WT, ΔphoB and ΔphoB + pPhoB strains by selected reaction monitoring (SRM) experiments, Table S1: A full list of protein identifications as well as the altered proteins.

Author Contributions

J.J. carried out most of the experiments. K.Y. and L.Q. contributed to the generation of bacterial strains. Y.L. and J.F. contributed to mass spectrometric analysis. Bioinformatics analysis was performed by S.C., M.W., and Z.W. J.J. and X.L. wrote the manuscript with editorial input from all authors.

Funding

This research was funded by the National Natural Science Foundation of China (21475005 and 21622501), Clinical Medicine Plus X-Young Scholars Project of Peking University and the Thousand Young Talents program of the Chinese government.

Acknowledgments

We thank the members of the Liu laboratory for critical reading of this manuscript.

Conflicts of Interest

The authors declare no conflict of interest.

References

  1. Wanner, B.L. Phosphorus assimilation and control of the phosphate regulon. In Escherichia coli and Salmonella: Cellular and Molecular Biology, 2nd ed.; Neidhardt, F.C., Curtiss, R., III, Ingraham, J.L., Lin, E.C.C., Low, K.B., Magasanik, B., Reznikoff, W.S., Riley, M., Schaechter, M., Umbarger, H.E., Eds.; ASM Press: Washington, DC, USA, 1996; pp. 1357–1381. [Google Scholar]
  2. VanBogelen, R.A.; Olson, E.R.; Wanner, B.L.; Neidhardt, F.C. Global analysis of proteins synthesized during phosphorus restriction in Escherichia coli. J. Bacteriol. 1996, 178, 4344–4366. [Google Scholar] [CrossRef] [PubMed]
  3. Hsieh, Y.J.; Wanner, B.L. Global regulation by the seven-component Pi signaling system. Curr. Opin. Microbiol. 2010, 13, 198–203. [Google Scholar] [CrossRef] [PubMed]
  4. Santos-Beneit, F. The Pho regulon: A huge regulatory network in bacteria. Front. Microbiol. 2015, 6, 402. [Google Scholar] [CrossRef] [PubMed]
  5. Darwin, K.H.; Miller, V.L. Molecular basis of the interaction of Salmonella with the intestinal mucosa. Clin. Microbiol. Rev. 1999, 12, 405–428. [Google Scholar] [PubMed]
  6. Galán, J.E.; Lara-Tejero, M.; Marlovits, T.C.; Wagner, S. Bacterial type III secretion systems: Specialized nanomachines for protein delivery into target cells. Annu. Rev. Microbiol. 2014, 68, 415–438. [Google Scholar] [CrossRef] [PubMed]
  7. Jennings, E.; Thurston, T.L.M.; Holden, D.W. Salmonella SPI-2 Type III Secretion System Effectors: Molecular Mechanisms And Physiological Consequences. Cell Host Microbe 2017, 22, 217–231. [Google Scholar] [CrossRef] [PubMed]
  8. Liu, Y.; Zhang, Q.; Hu, M.; Yu, K.; Fu, J.; Zhou, F.; Liu, X. Proteomic analyses of intracellular Salmonella enterica Serovar Typhimurium reveal extensive bacterial adaptations to infected host epithelial cells. Infect. Immun. 2015, 83, 2897–2906. [Google Scholar] [CrossRef] [PubMed]
  9. Liu, Y.; Yu, K.; Zhou, F.; Ding, T.; Yang, Y.; Hu, M.; Liu, X. Quantitative proteomics charts the landscape of Salmonella carbon metabolism within host epithelial cells. J. Proteome Res. 2017, 16, 788–797. [Google Scholar] [CrossRef] [PubMed]
  10. Liu, Y.; Liu, Q.; Qi, L.; Ding, T.; Wang, Z.; Fu, J.; Hu, M.; Li, M.; Song, J.; Liu, X.; et al. Temporal regulation of a Salmonella Typhimurium virulence factor by the transcriptional regulator YdcR. Mol. Cell. Proteom. 2017, 16, 1683–1693. [Google Scholar] [CrossRef] [PubMed]
  11. Baek, J.H.; Lee, S.Y. Transcriptome analysis of phosphate starvation response in Escherichia coli. J. Microbiol. Biotechnol. 2007, 17, 244–252. [Google Scholar] [PubMed]
  12. Chekabab, S.M.; Jubelin, G.; Dozois, C.M.; Harel, J. PhoB activates Escherichia coli O157:H7 virulence factors in response to inorganic phosphate limitation. PLoS ONE 2014, 9, e94285. [Google Scholar] [CrossRef] [PubMed]
  13. Marzan, L.W.; Shimizu, K. Metabolic regulation of Escherichia coli and its phoB and phoR genes knockout mutants under phosphate and nitrogen limitations as well as at acidic condition. Microb. Cell. Fact. 2011, 10, 39. [Google Scholar] [CrossRef] [PubMed]
  14. Schuhmacher, T.; Loffler, M.; Hurler, T.; Takors, R. Phosphate limited fed-batch processes: Impact on carbon usage and energy metabolism in Escherichia coli. J. Biotechnol. 2014, 190, 96–104. [Google Scholar] [CrossRef] [PubMed]
  15. Yoshida, Y.; Sugiyama, S.; Oyamada, T.; Yokoyama, K.; Makino, K. Novel members of the phosphate regulon in Escherichia coli O157:H7 identified using a whole-genome shotgun approach. Gene 2012, 502, 27–35. [Google Scholar] [CrossRef] [PubMed]
  16. Blanco, A.G.; Canals, A.; Coll, M. PhoB transcriptional activator binds hierarchically to pho box promoters. Biol. Chem. 2012, 393, 1165–1171. [Google Scholar] [CrossRef] [PubMed]
  17. Chekabab, S.M.; Harel, J.; Dozois, C.M. Interplay between genetic regulation of phosphate homeostasis and bacterial virulence. Virulence 2014, 5, 786–793. [Google Scholar] [CrossRef] [PubMed]
  18. Torriani, A. From cell membrane to nucleotides: The phosphate regulon in Escherichia coli. Bioessays 1990, 12, 371–376. [Google Scholar] [CrossRef] [PubMed]
  19. Chan, F.Y.; Torriani, A. PstB protein of the phosphate-specific transport system of Escherichia coli is an ATPase. J. Bacteriol. 1996, 178, 3974–3977. [Google Scholar] [CrossRef] [PubMed]
  20. Datsenko, K.A.; Wanner, B.L. One-step inactivation of chromosomal genes in Escherichia coli K-12 using PCR products. Proc. Natl. Acad. Sci. USA 2000, 97, 6640–6645. [Google Scholar] [CrossRef] [PubMed]
  21. Uzzau, S.; Figueroa-Bossi, N.; Rubino, S.; Bossi, L. Epitope tagging of chromosomal genes in Salmonella. Proc. Natl. Acad. Sci. USA 2001, 98, 15264–15269. [Google Scholar] [CrossRef] [PubMed]
  22. Elledge, S.J.; Davis, R.W. Position and density effects on repression by stationary and mobile DNA-binding proteins. Genes Dev. 1989, 3, 185–197. [Google Scholar] [CrossRef] [PubMed]
  23. Neidhardt, F.C.; Bloch, P.L.; Smith, D.F. Culture medium for enterobacteria. J. Bacteriol. 1974, 119, 736–747. [Google Scholar] [PubMed]
  24. Hu, M.; Liu, Y.; Yu, K.; Liu, X. Decreasing the amount of trypsin in in-gel digestion leads to diminished chemical noise and improved protein identifications. J. Proteom. 2014, 109, 16–25. [Google Scholar] [CrossRef] [PubMed]
  25. Hsu, J.L.; Huang, S.Y.; Chow, N.H.; Chen, S.H. Stable-isotope dimethyl labeling for quantitative proteomics. Anal. Chem. 2003, 75, 6843–6852. [Google Scholar] [CrossRef] [PubMed]
  26. Cox, J.; Mann, M. MaxQuant enables high peptide identification rates, individualized p.p.b.-range mass accuracies and proteome-wide protein quantification. Nat. Biotechnol. 2008, 26, 1367–1372. [Google Scholar] [CrossRef] [PubMed]
  27. Plumbridge, J.A. Sequence of the nagBACD operon in Escherichia coli K12 and pattern of transcription within the nag regulon. Mol. Microbiol. 1989, 3, 505–515. [Google Scholar] [CrossRef] [PubMed]
  28. Plumbridge, J. How to achieve constitutive expression of a gene within an inducible operon: The example of the nagC gene of Escherichia coli. J. Bacteriol. 1996, 178, 2629–2636. [Google Scholar] [CrossRef] [PubMed]
  29. Plumbridge, J.A. Repression and induction of the nag regulon of Escherichia coli K-12: The roles of nagC and nagA in maintenance of the uninduced state. Mol. Microbiol. 1991, 5, 2053–2062. [Google Scholar] [CrossRef] [PubMed]
  30. Tremblay, L.W.; Dunaway-Mariano, D.; Allen, K.N. Structure and activity analyses of Escherichia coli K-12 NagD provide insight into the evolution of biochemical function in the haloalkanoic acid dehalogenase superfamily. Biochemistry 2006, 45, 1183–1193. [Google Scholar] [CrossRef] [PubMed]
  31. Deiwick, J.; Nikolaus, T.; Erdogan, S.; Hensel, M. Environmental regulation of Salmonella pathogenicity island 2 gene expression. Mol. Microbiol. 1999, 31, 1759–1773. [Google Scholar] [CrossRef] [PubMed]
Figure 1. (A) A schematic diagram of experimental setup for quantitative profiling of Salmonella proteome under phosphate (Pi)-limiting conditions. Protein samples from bacteria cultured in both Pi-rich and Pi-low media were digested, isotopically labeled, and equally mixed prior to LC-MS/MS analyses. (B) Bacterial growth curves of Salmonella WT (denoted by inverted triangles) and ΔphoB strains (denoted by circles) in MOPS media with or without the addition of 1 mM Pi. For growth in Pi-deficient conditions, bacteria were first cultured in Pi-rich media until OD600 reached 0.3 and then the media was changed to MOPS without Pi. The solid and open symbols represent Pi+ and Pi conditions respectively. (C) A volcano plot of detected Salmonella proteins under Pi-rich (Pi+) and Pi low (Pi) conditions by LC-MS/MS. The logarithmic ratios of average fold changes are plotted on the x-axis. The y-axis plots negative logarithmic p-values from the t-test performed on three biological replicates. Dotted lines denote 2-fold (vertical) and p < 0.05 cutoff (horizontal). The up- or down-regulated proteins are denoted by the red and green dots, respectively.
Proteomes 06 00019 g001
Figure 2. Network analyses of functional associations and/or interactions of those up-regulated proteins (A) and down-regulated proteins (B) during Pi starvation. Different clusters of interacting proteins were identified by using the STRING software with a highest confidence score. Some notable protein clusters are circled for the sake of clarity. The color lines linking different proteins represent the types of evidence (red line: fusion evidence; green line: neighborhood evidence; blue line: co-occurrence evidence; purple line: experimental evidence; yellow line: text-mining evidence; light blue line: database evidence; black line; co-expression evidence).
Proteomes 06 00019 g002aProteomes 06 00019 g002b
Figure 3. (A) A volcano plot of detected proteins in Salmonella WT and the phoB mutant strains by LC-MS/MS. The logarithmic ratios of average fold changes are plotted on the x-axis. The y-axis plots negative logarithmic p-values from the t-test performed on three biological replicates. Dotted lines denote 2-fold (vertical) and p < 0.05 cutoff (horizontal). The up- or down-regulated proteins are denoted by the red and green dots, respectively. (B) Representative mass spectra of dimethyl labeled peptides from NagA, NagB and DnaK (as a loading control). Peptides in WT and ΔphoB samples with light and heavy labels are indicated by open and filled triangles respectively. (C) Immunoblotting analyses of 3×FLAG-tagged NagB in Salmonella WT, ΔphoB and the complementation ΔphoB + pPhoB strains. DnaK was used as a loading control. (D) β-galactosidase activities of various reporter strains harboring the lacZ fusions to either the nag or the pst promoter (Pnag-lacZ and Ppst-lacZ, respectively) in WT, ΔphoB and ΔphoB + pPhoB backgrounds. Asterisks represent the range of p-values calculated by Student’s t test (*, p < 0.05; ***, p < 0.001; ns, not significant).
Proteomes 06 00019 g003aProteomes 06 00019 g003b
Figure 4. A pathway overview of Salmonella carbon metabolism under Pi starvation. ND: not detected. Bacterial enzymes are grouped by individual pathways with color-coded metabolites and arrows denoting the directionality of enzymatic reactions. Protein fold difference of those enzymes upon Pi starvation is color-coded as well.
Proteomes 06 00019 g004

