Proteomics Analysis to Assess the Role of Mitochondria in BRCA1-Mediated Breast Tumorigenesis


 ,
, 
 and
and 
Abstract
1. Introduction
2. Materials and Methods
2.1. Cells Culture
2.2. Full-Length Transfection of BRCA1 in HCC1937 Breast Cancer Cells
2.3. Whole Protein Extraction
2.4. Mitochondrial Fraction
2.5. Isolation of Nuclear Fractions
2.6. 2D-DIGE
2.7. Nanoscale LC-MS/MS Analysis
2.8. Western Blot Analysis
2.9. Pathway Analysis
2.10. Immunofluorescence Microscopy Analysis
3. Results
3.1. Mitochondrial Fraction Isolation
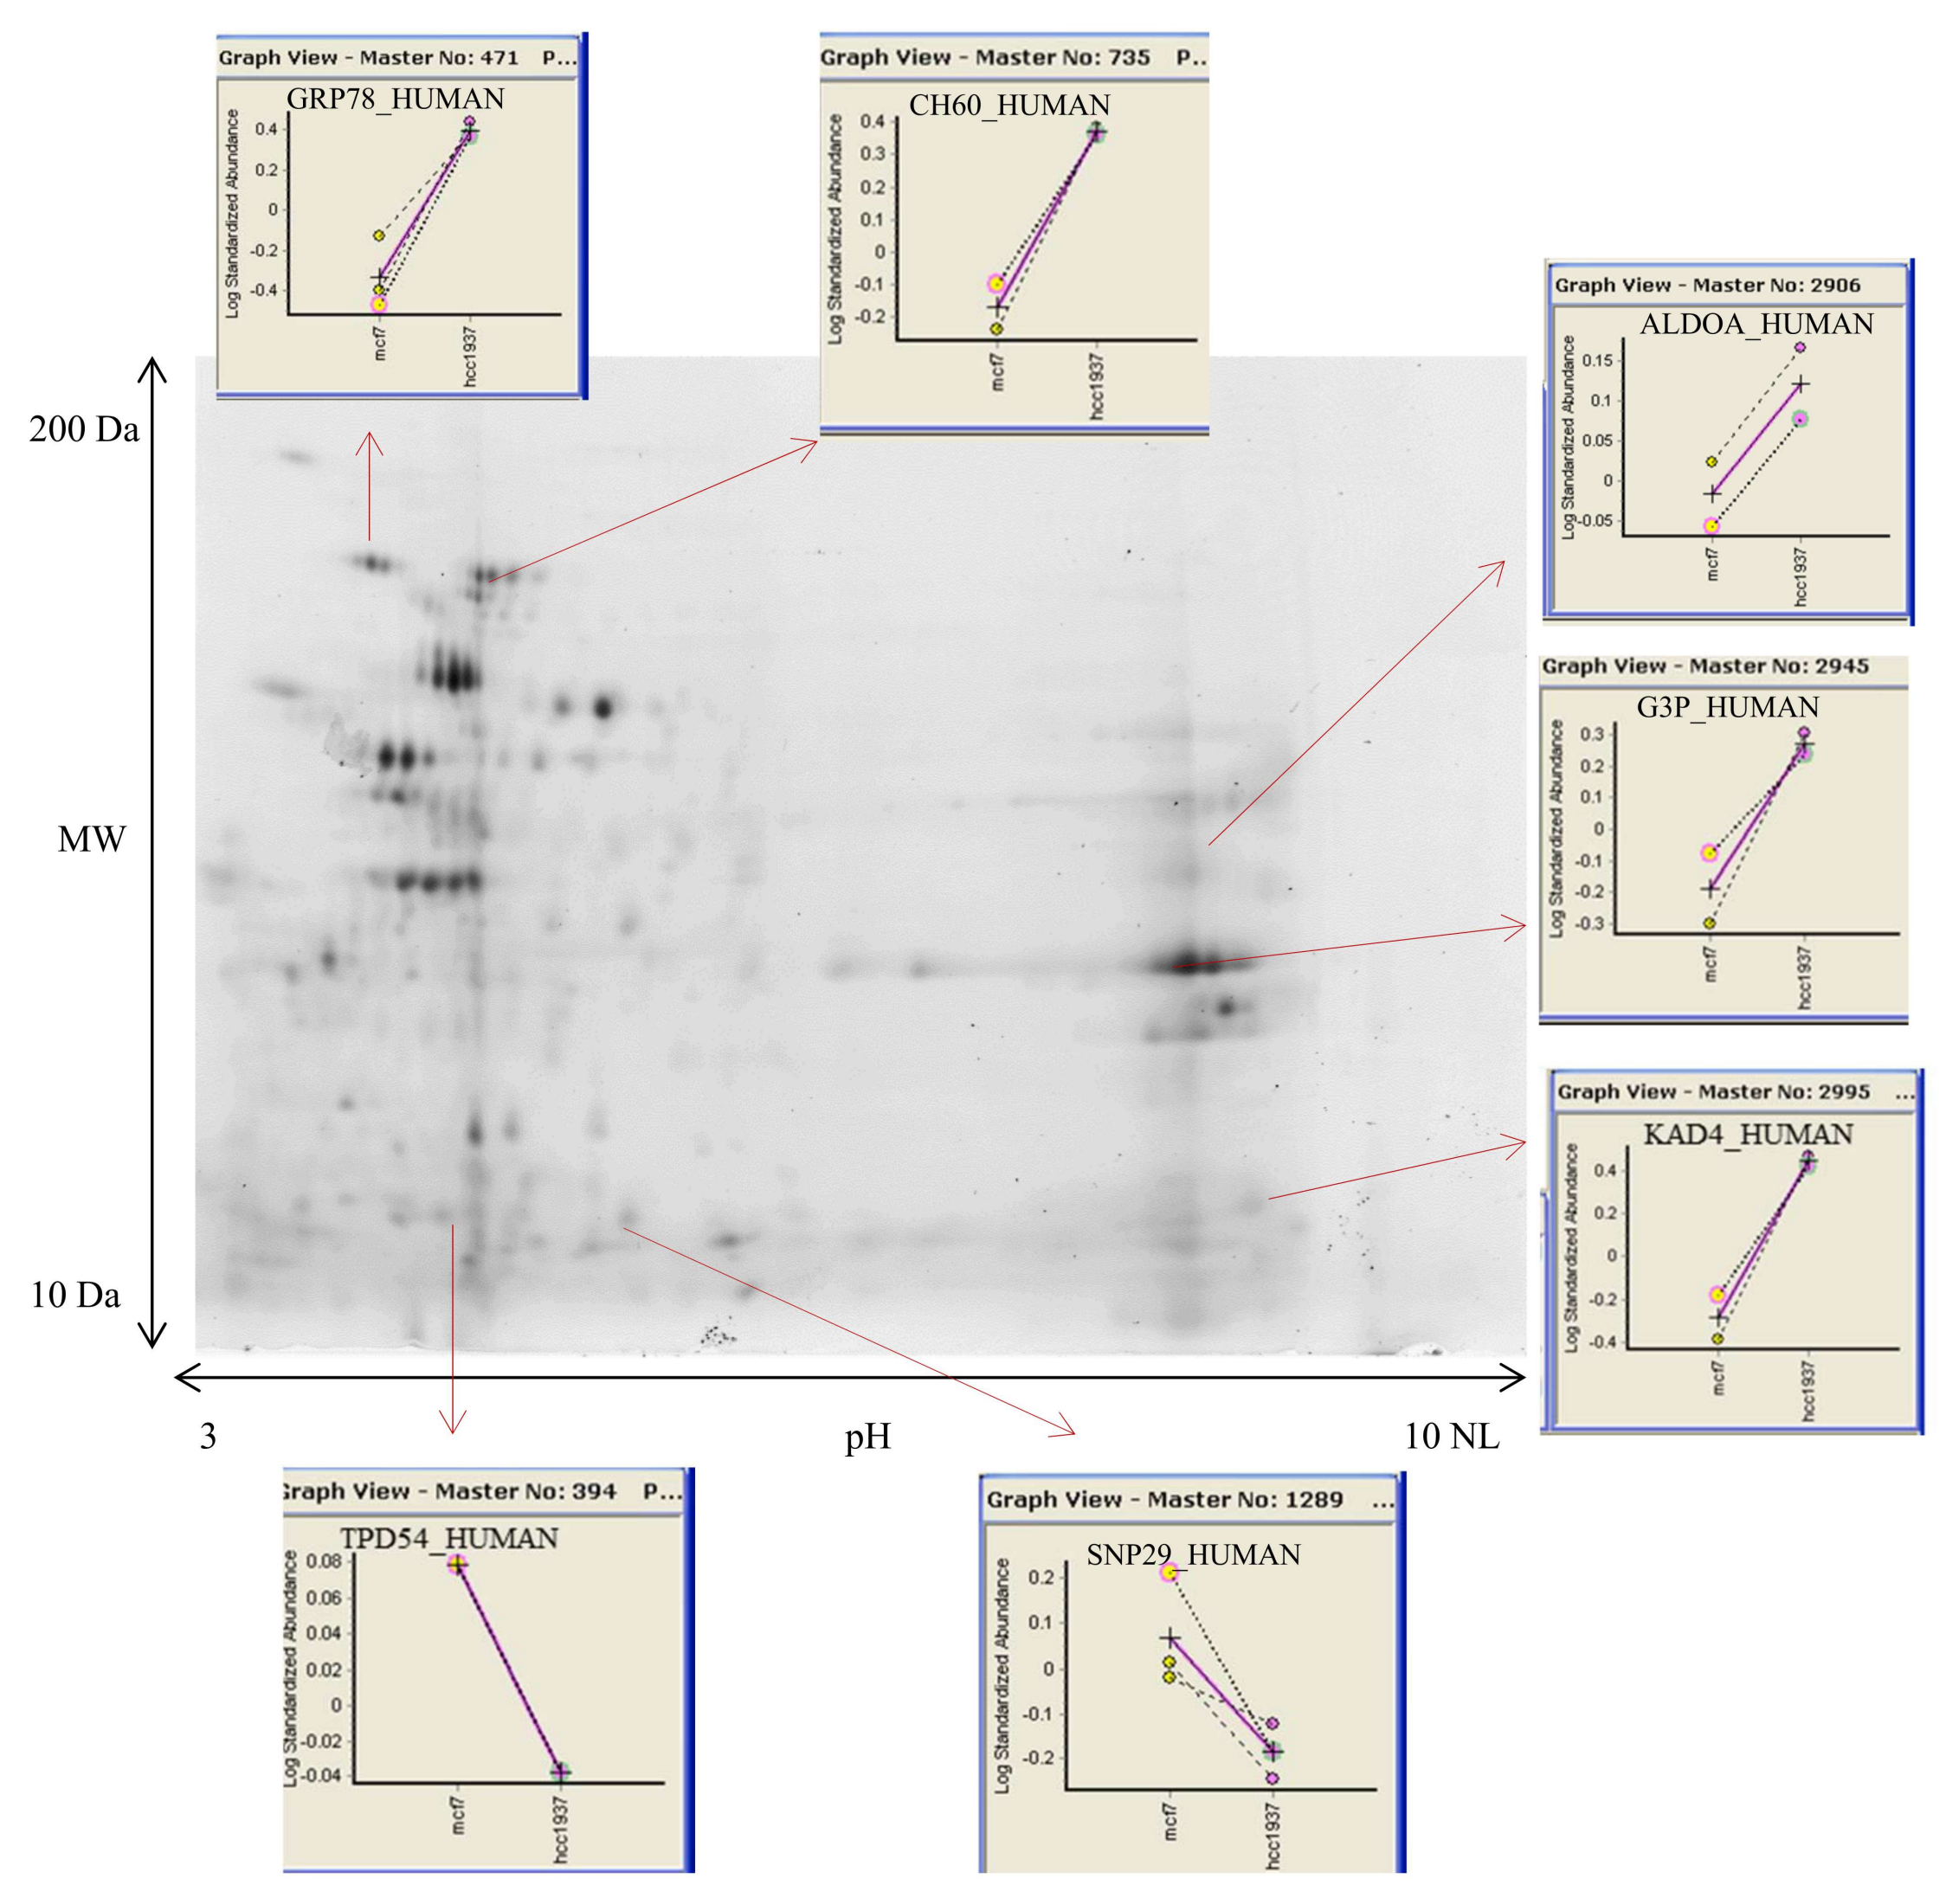
3.2. 2D DIGE and Mass Spectrometry Identifications
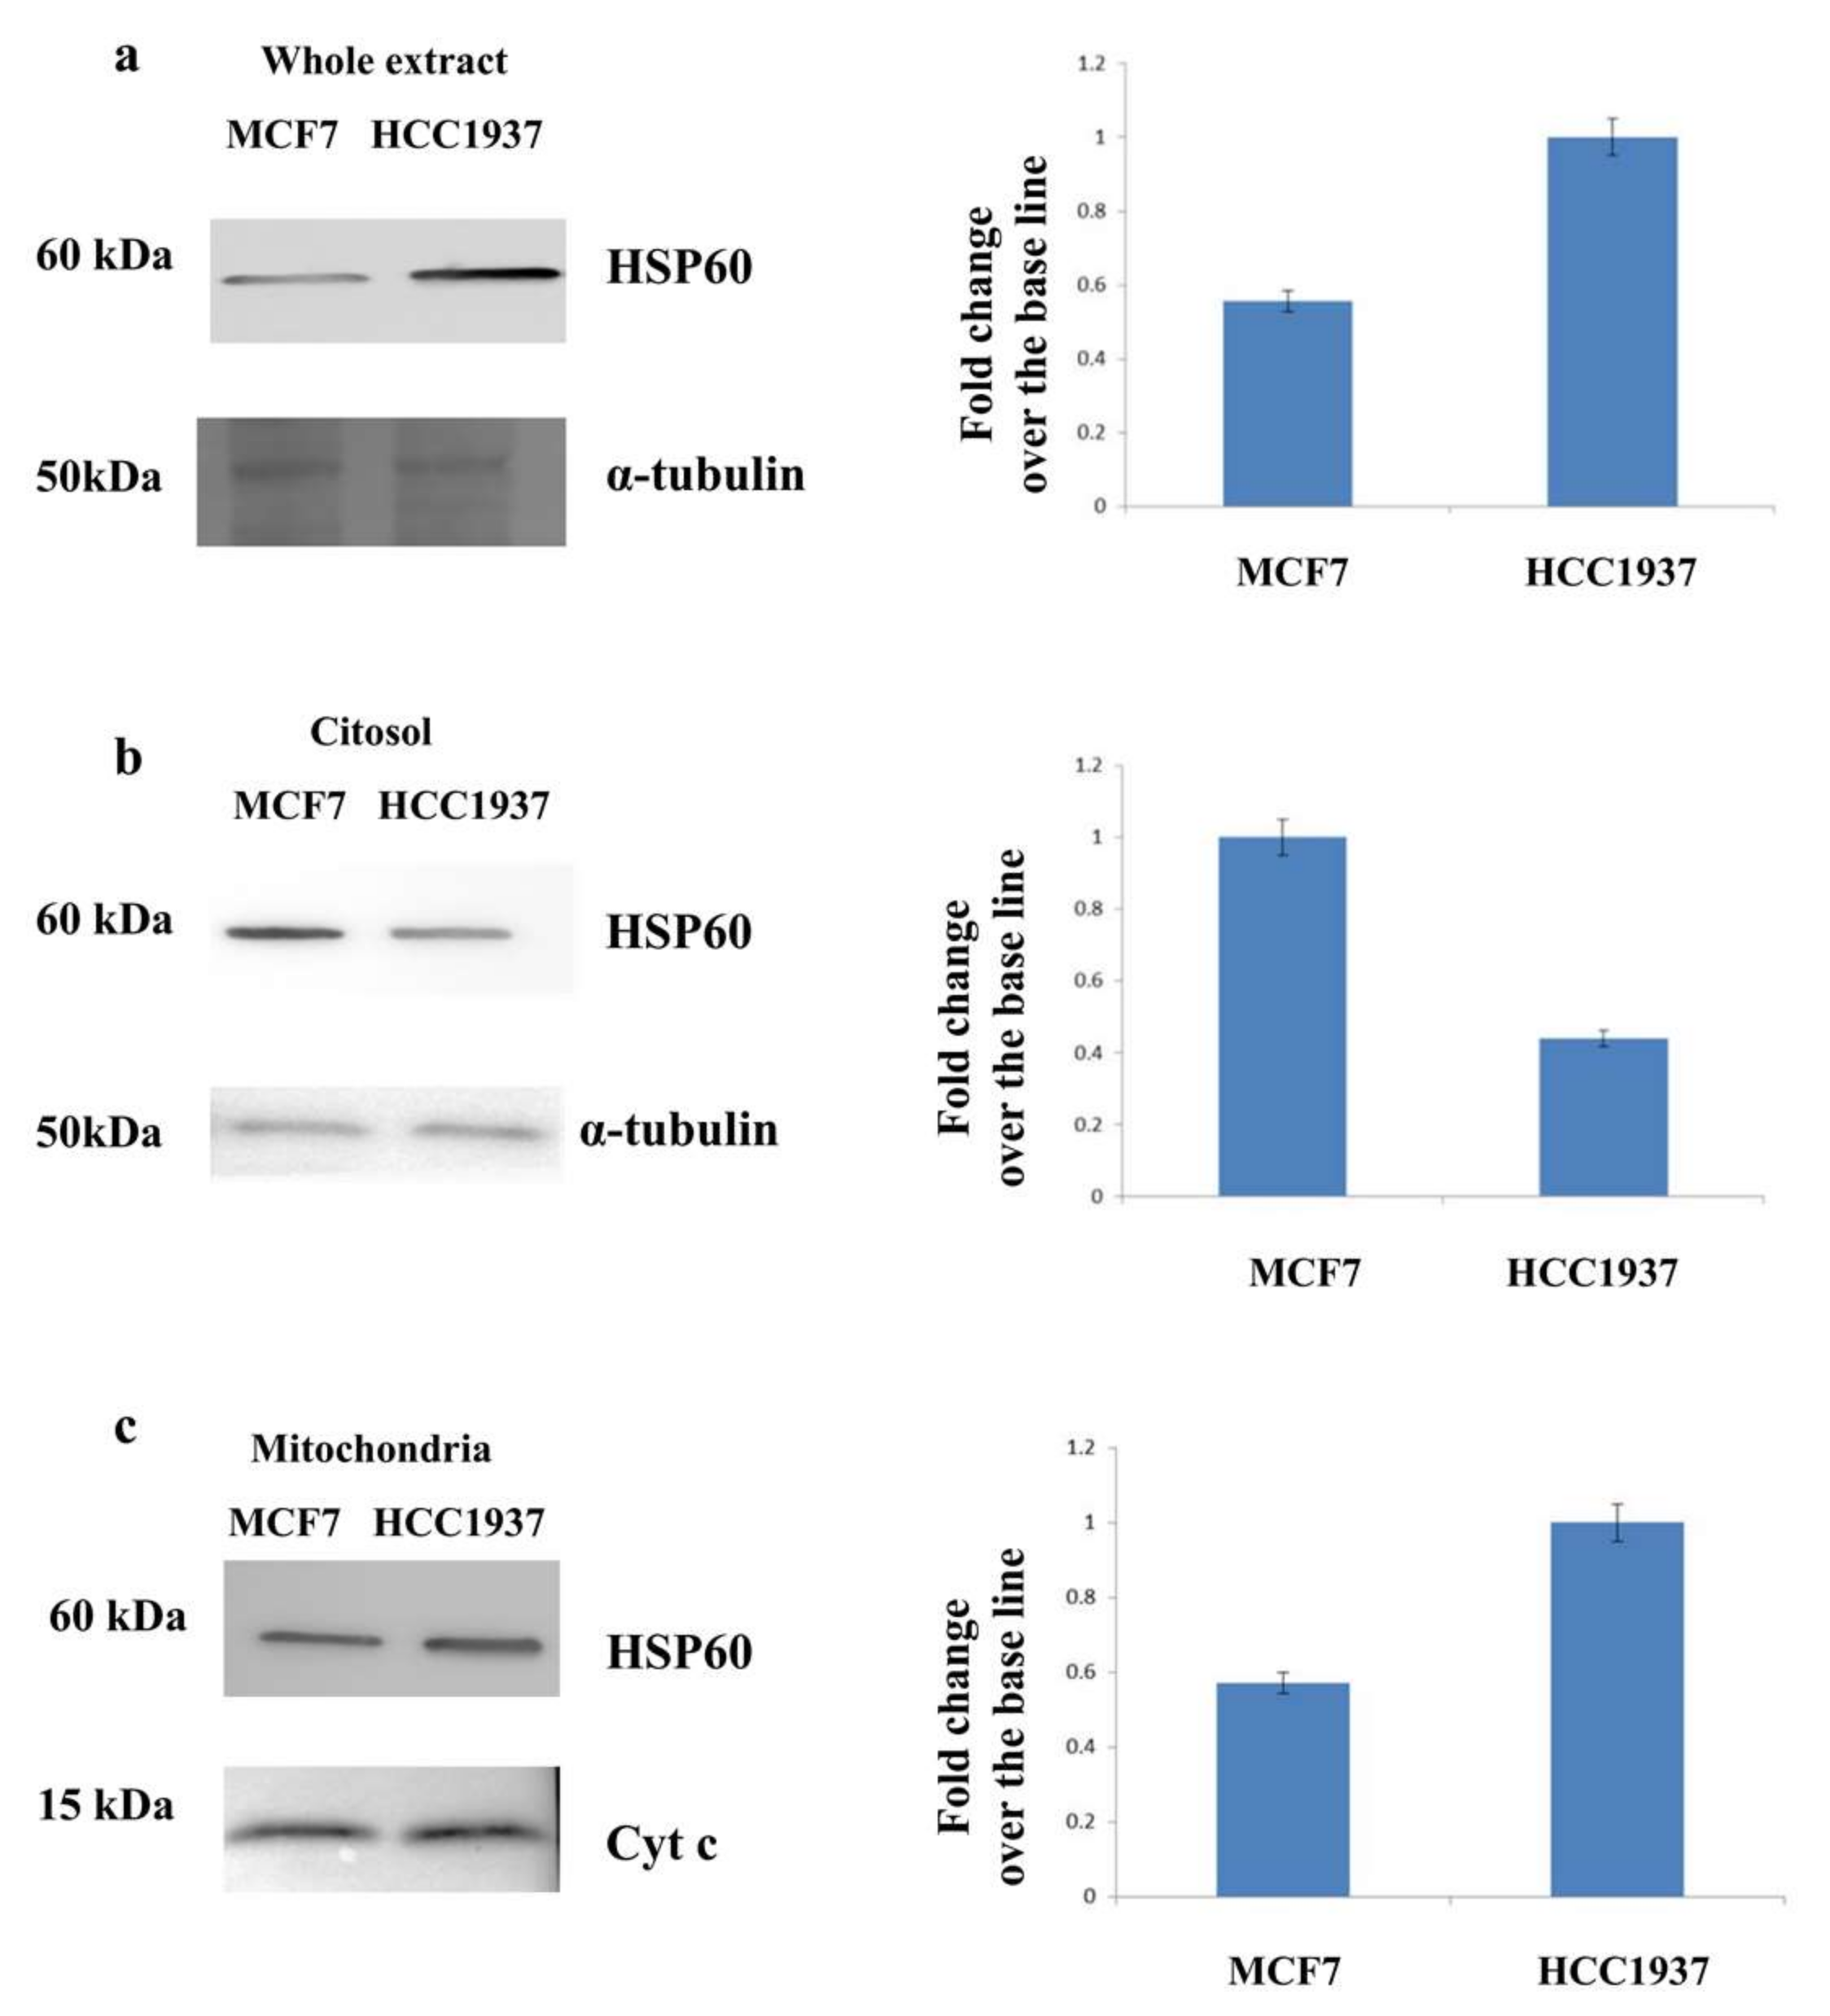
3.3. Assessment of the Mitochondrial Localization of HSP60
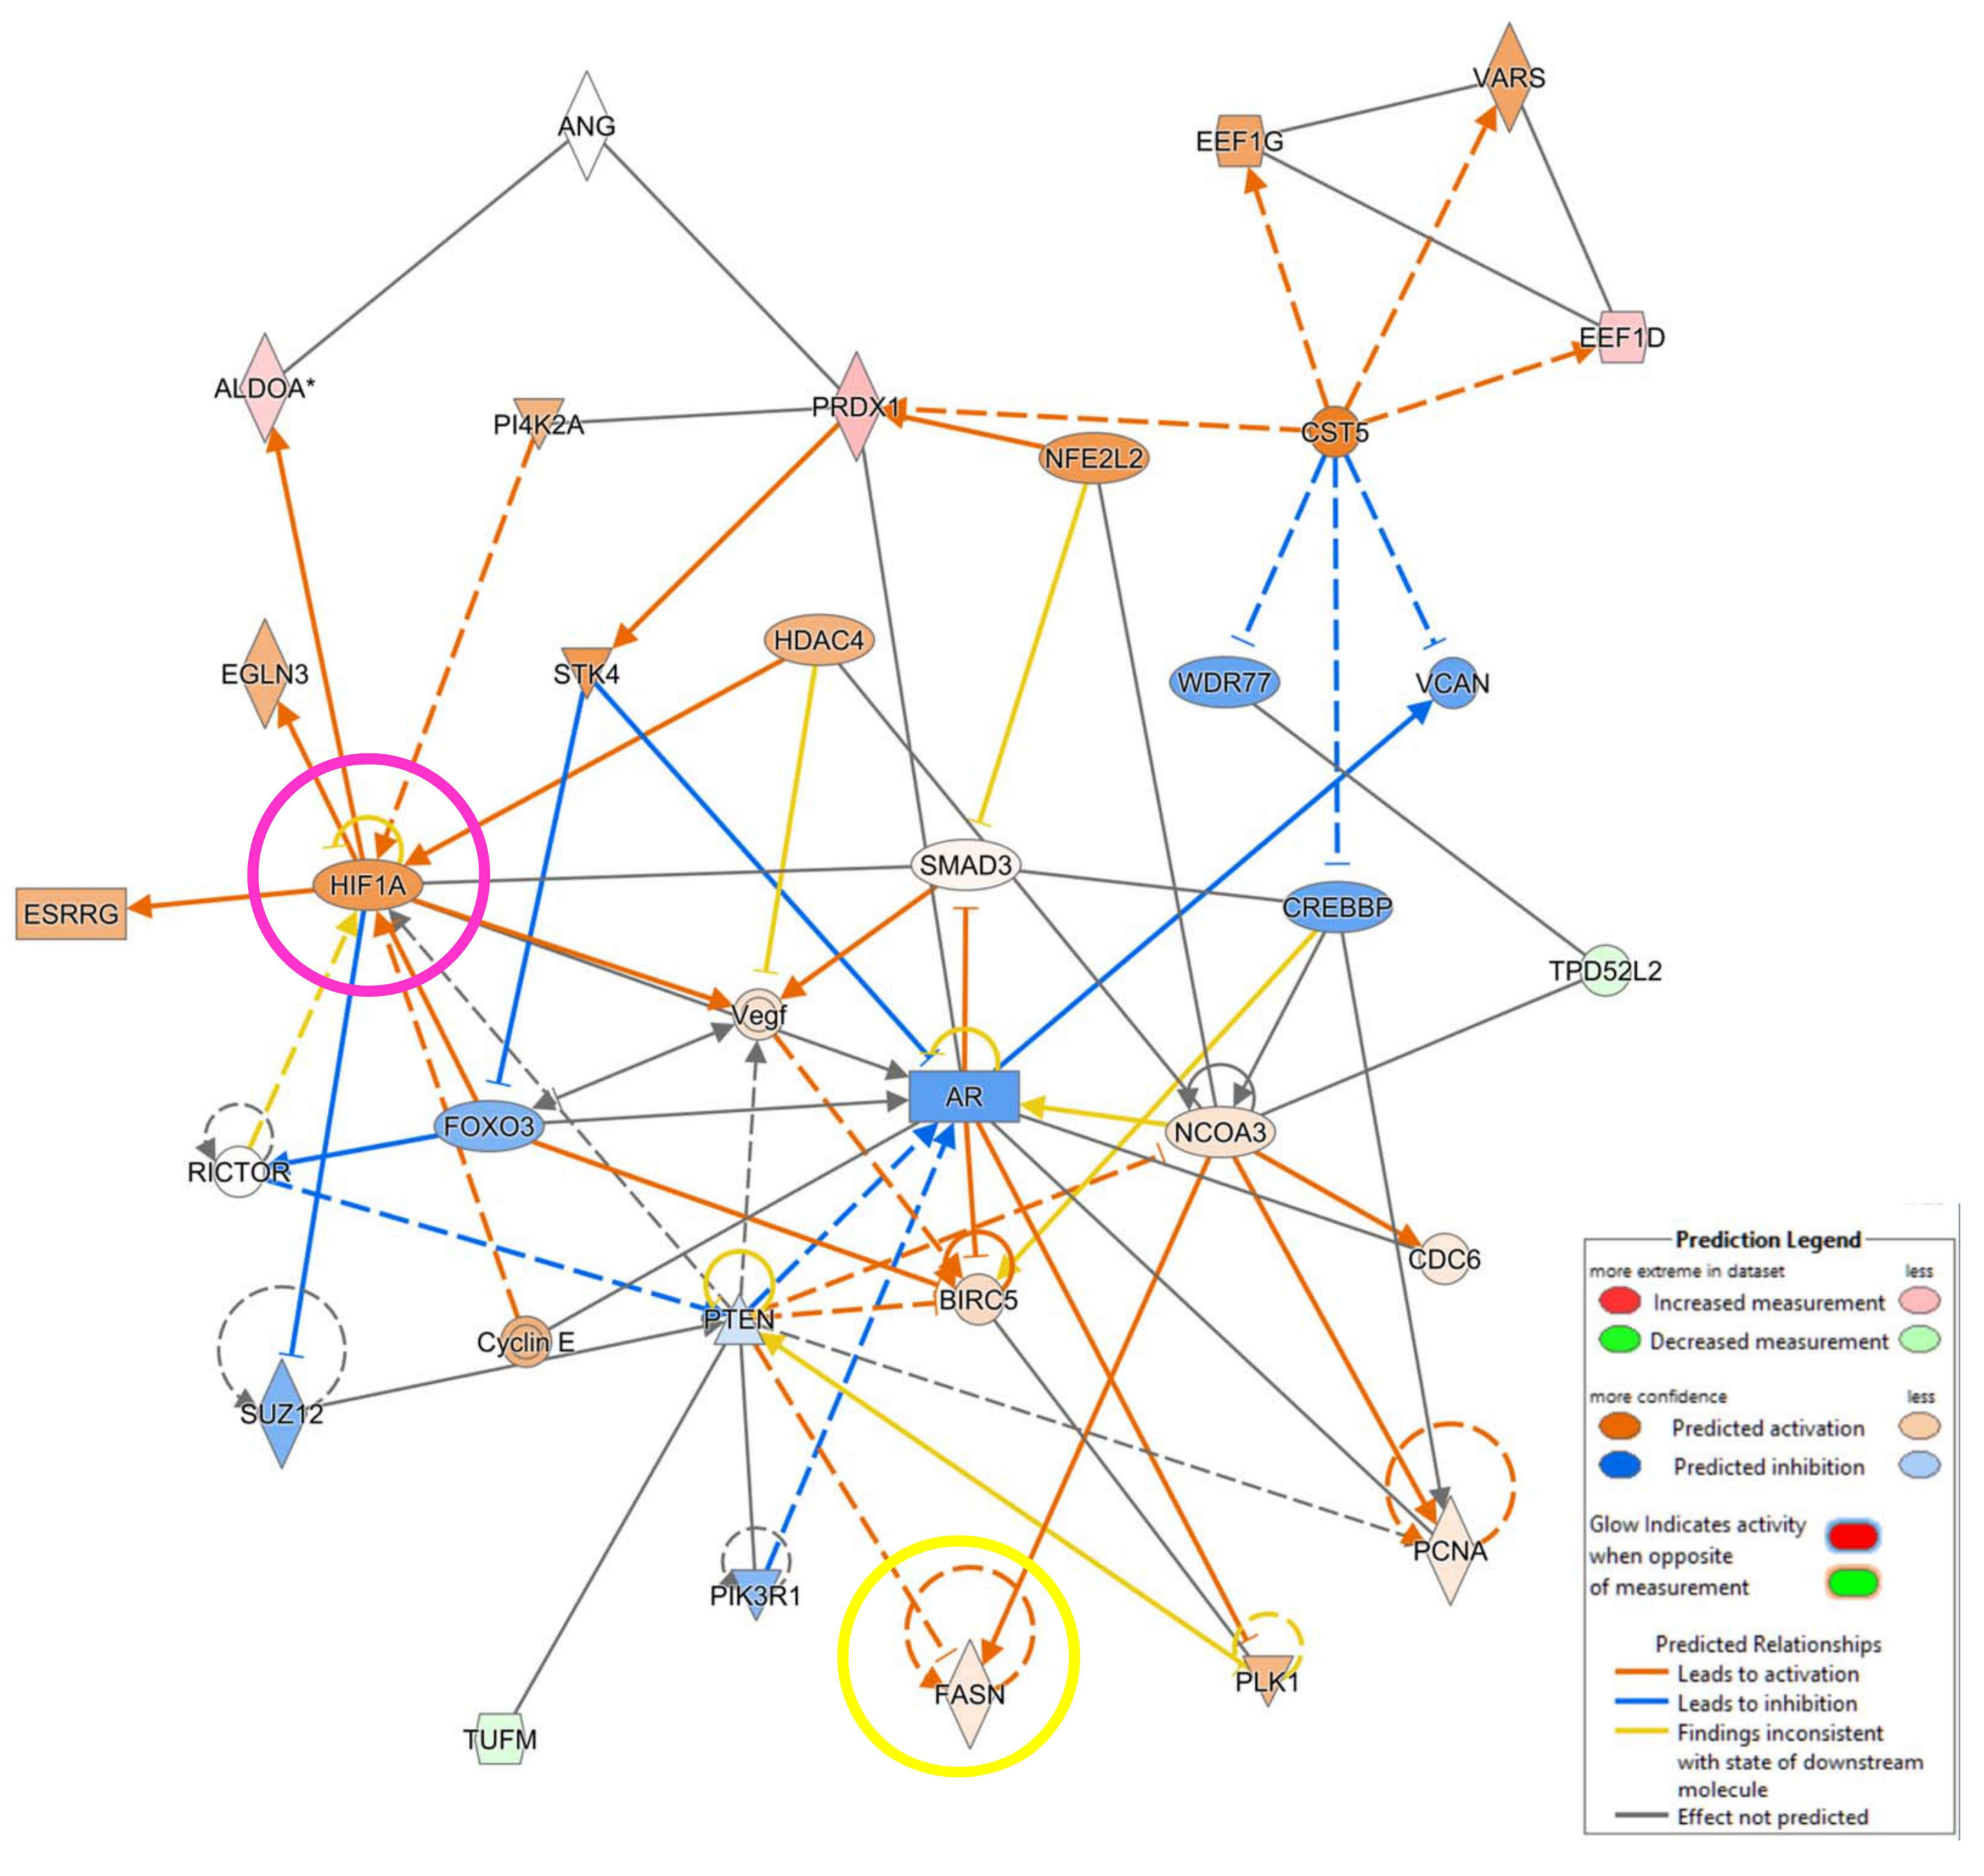
3.4. IPA Analysis
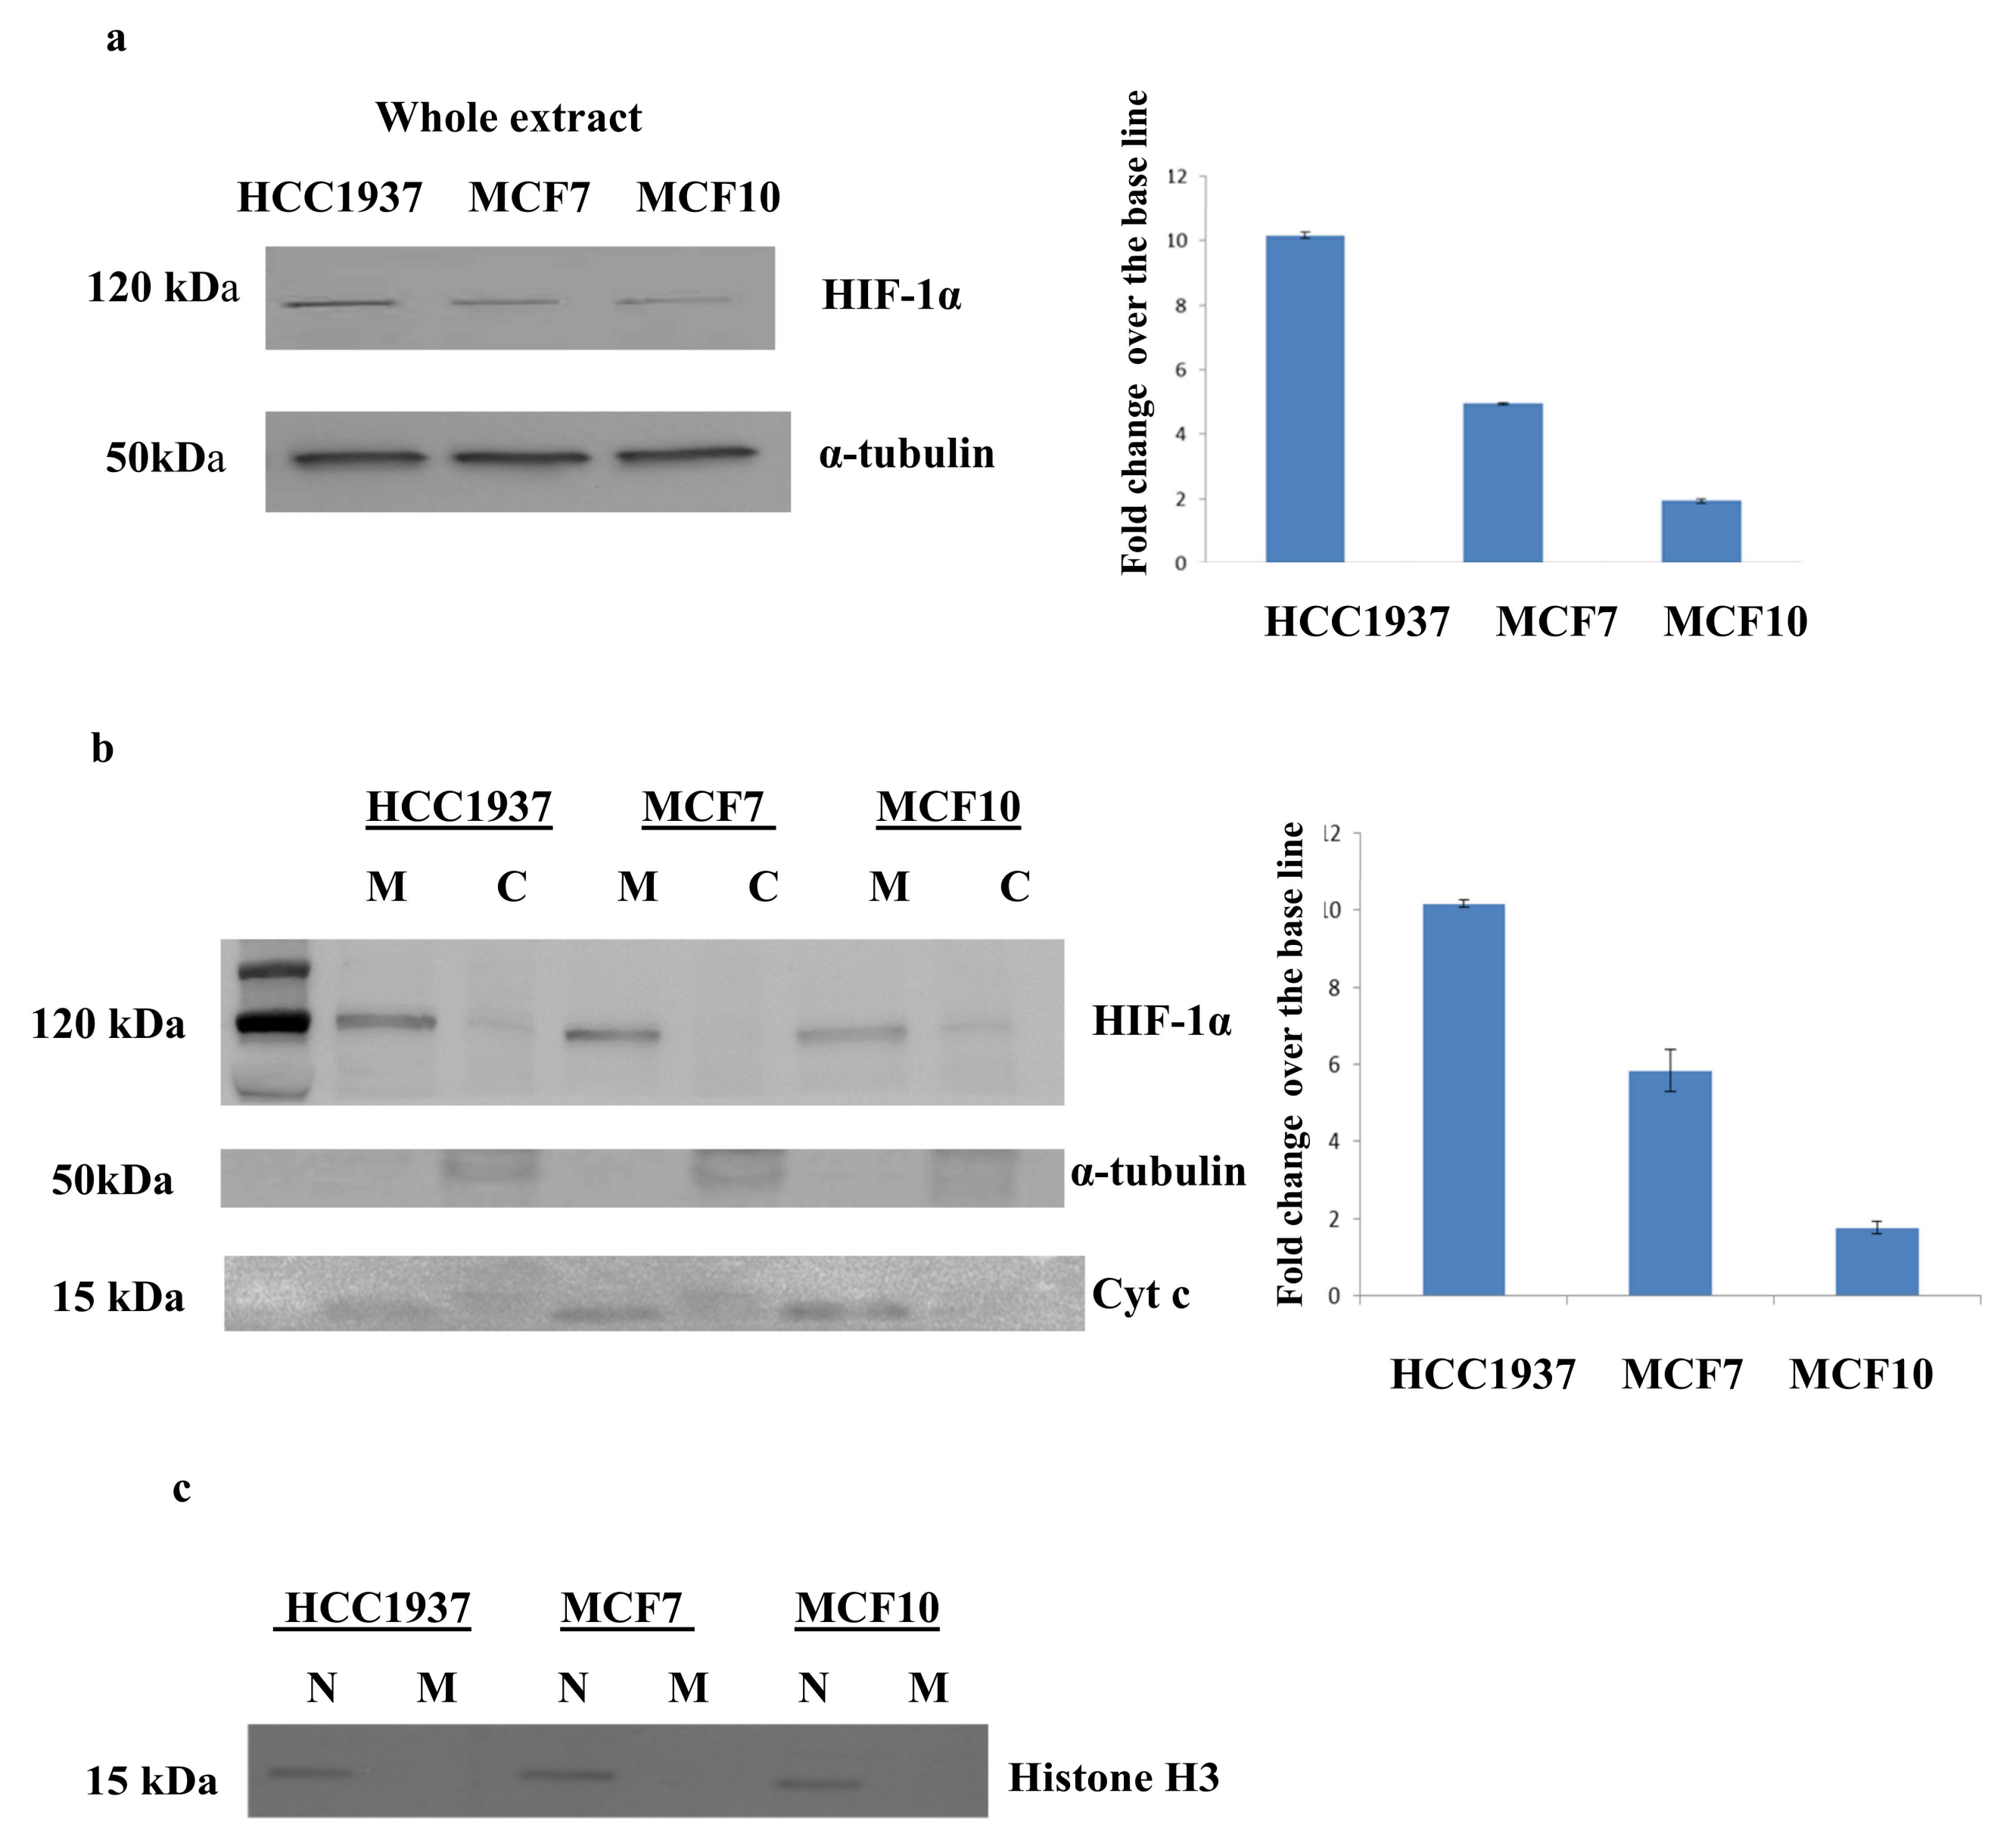
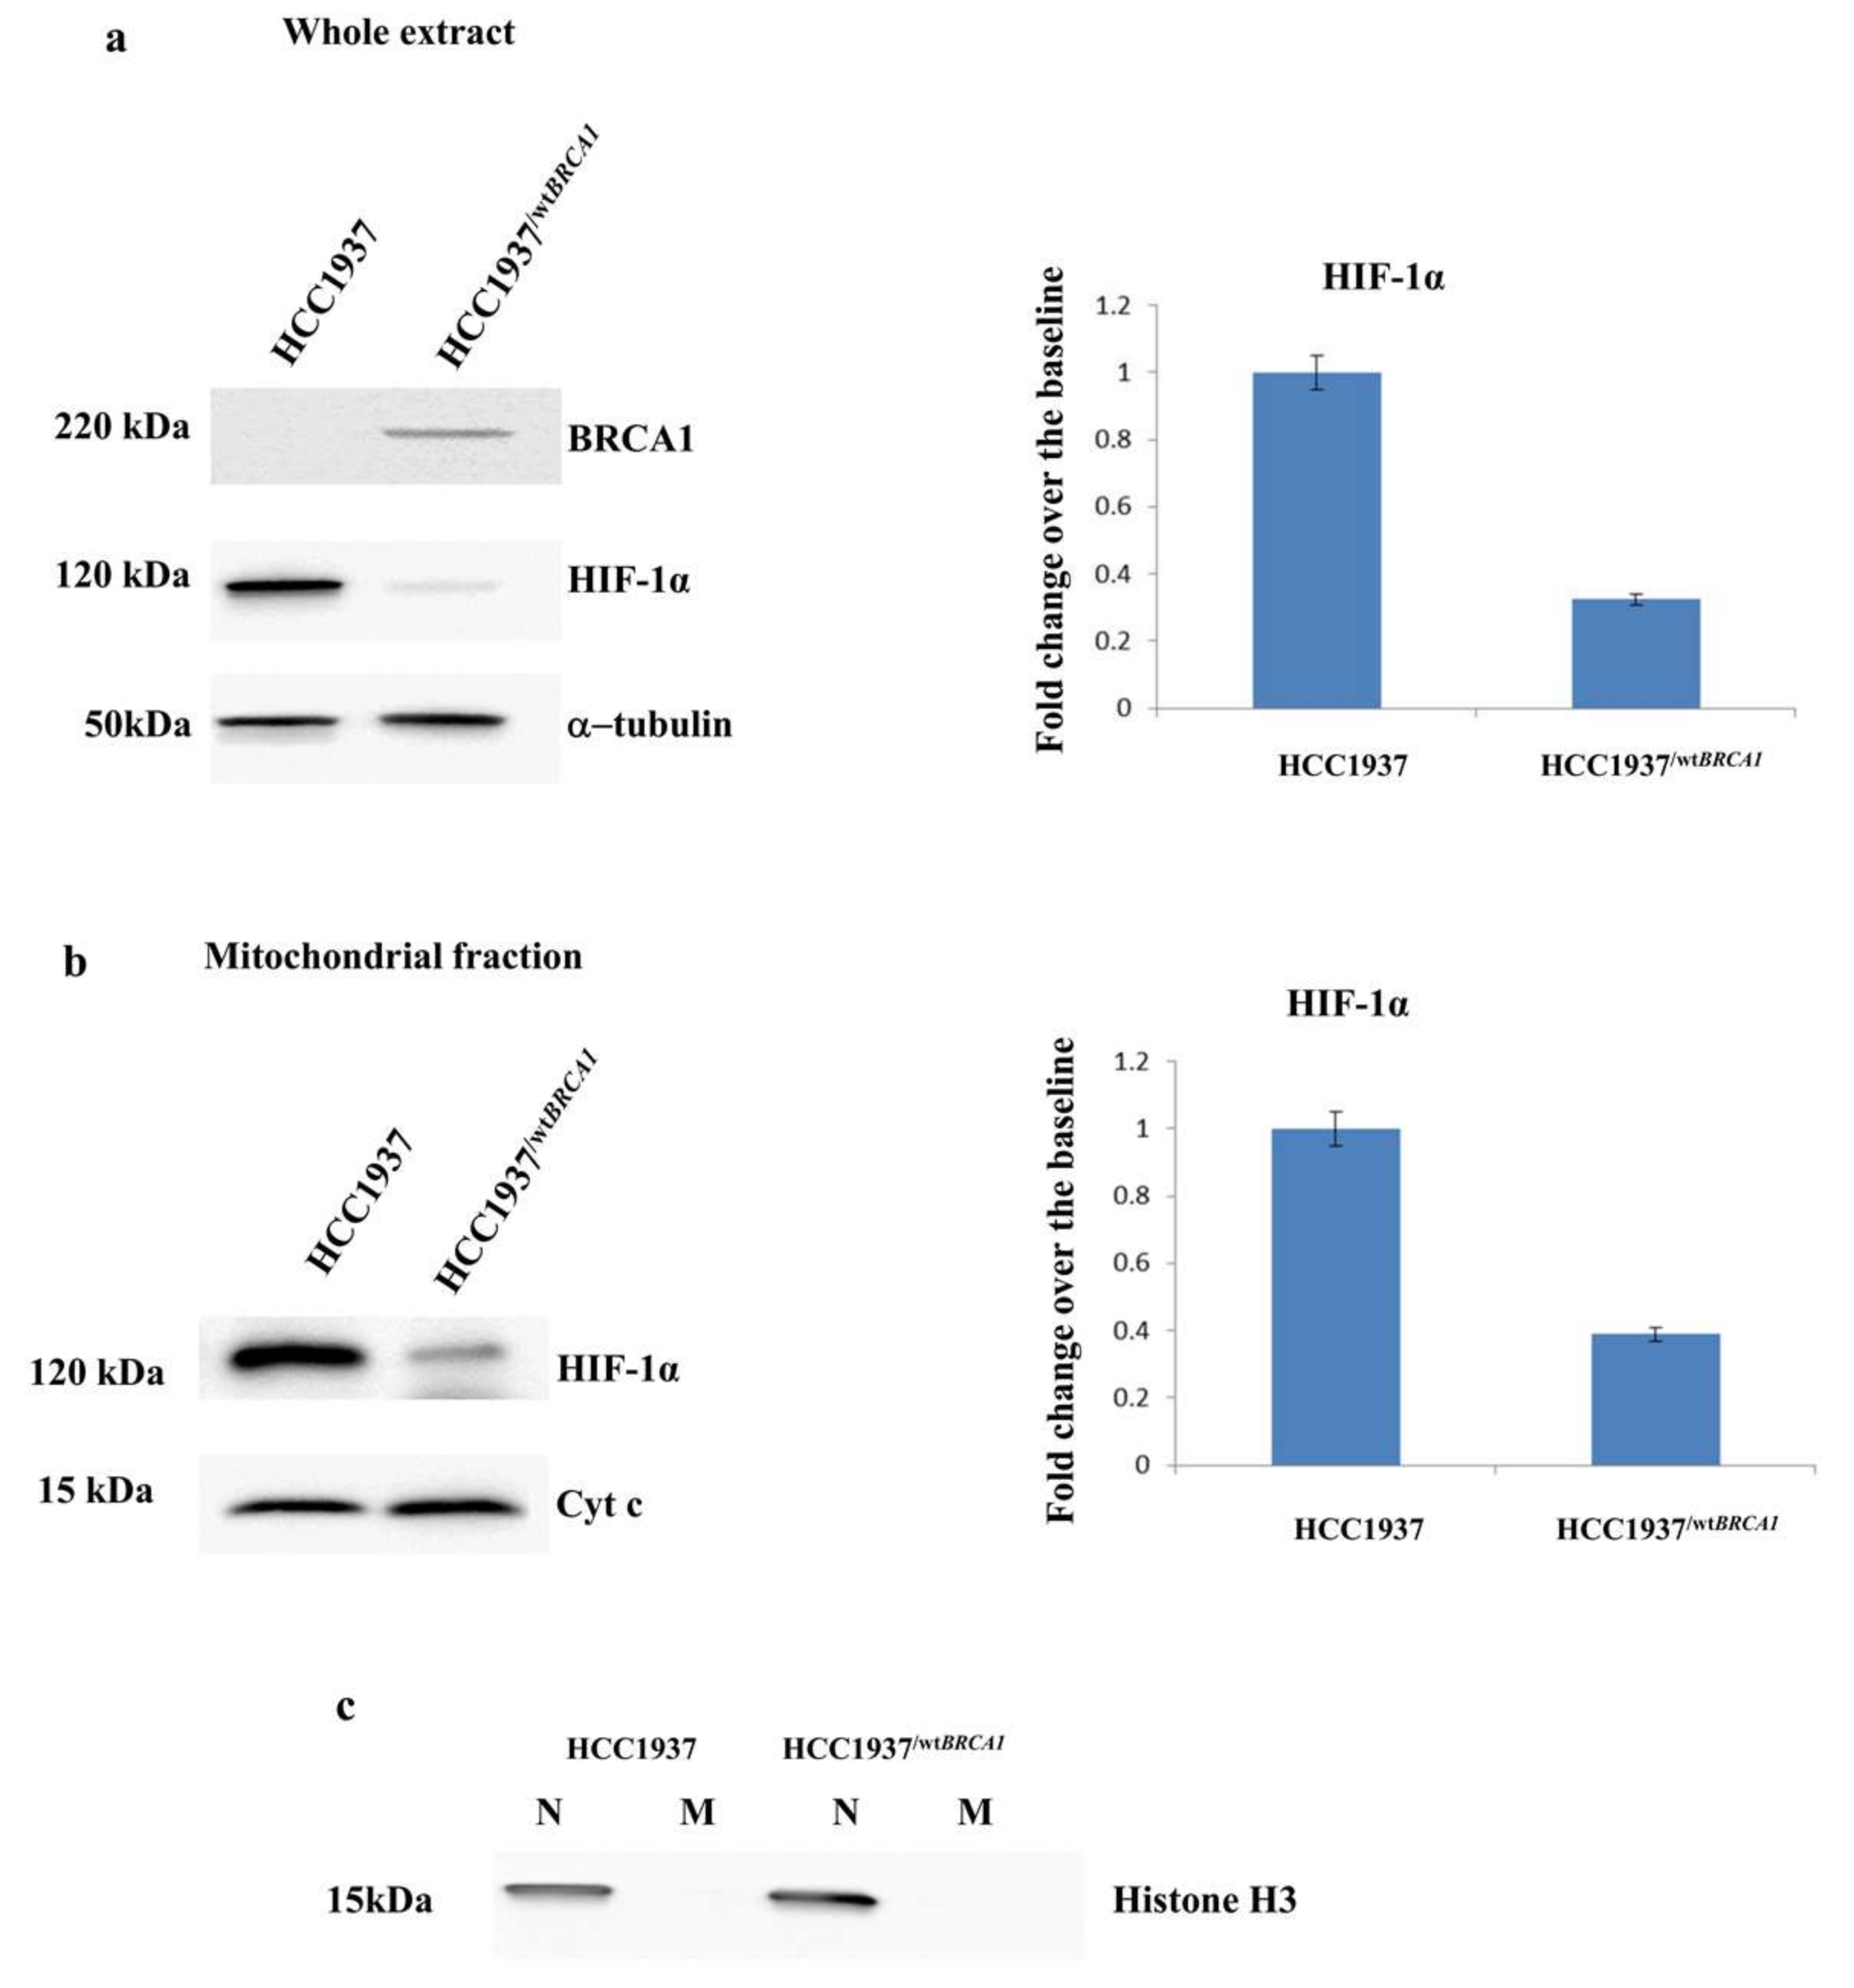
3.5. Validation of the Expression of HIF-1α by Western Blot Analysis
3.6. Stable Transfection of BRCA1 in Hereditary Breast Cancer Cell Line (HCC1937)
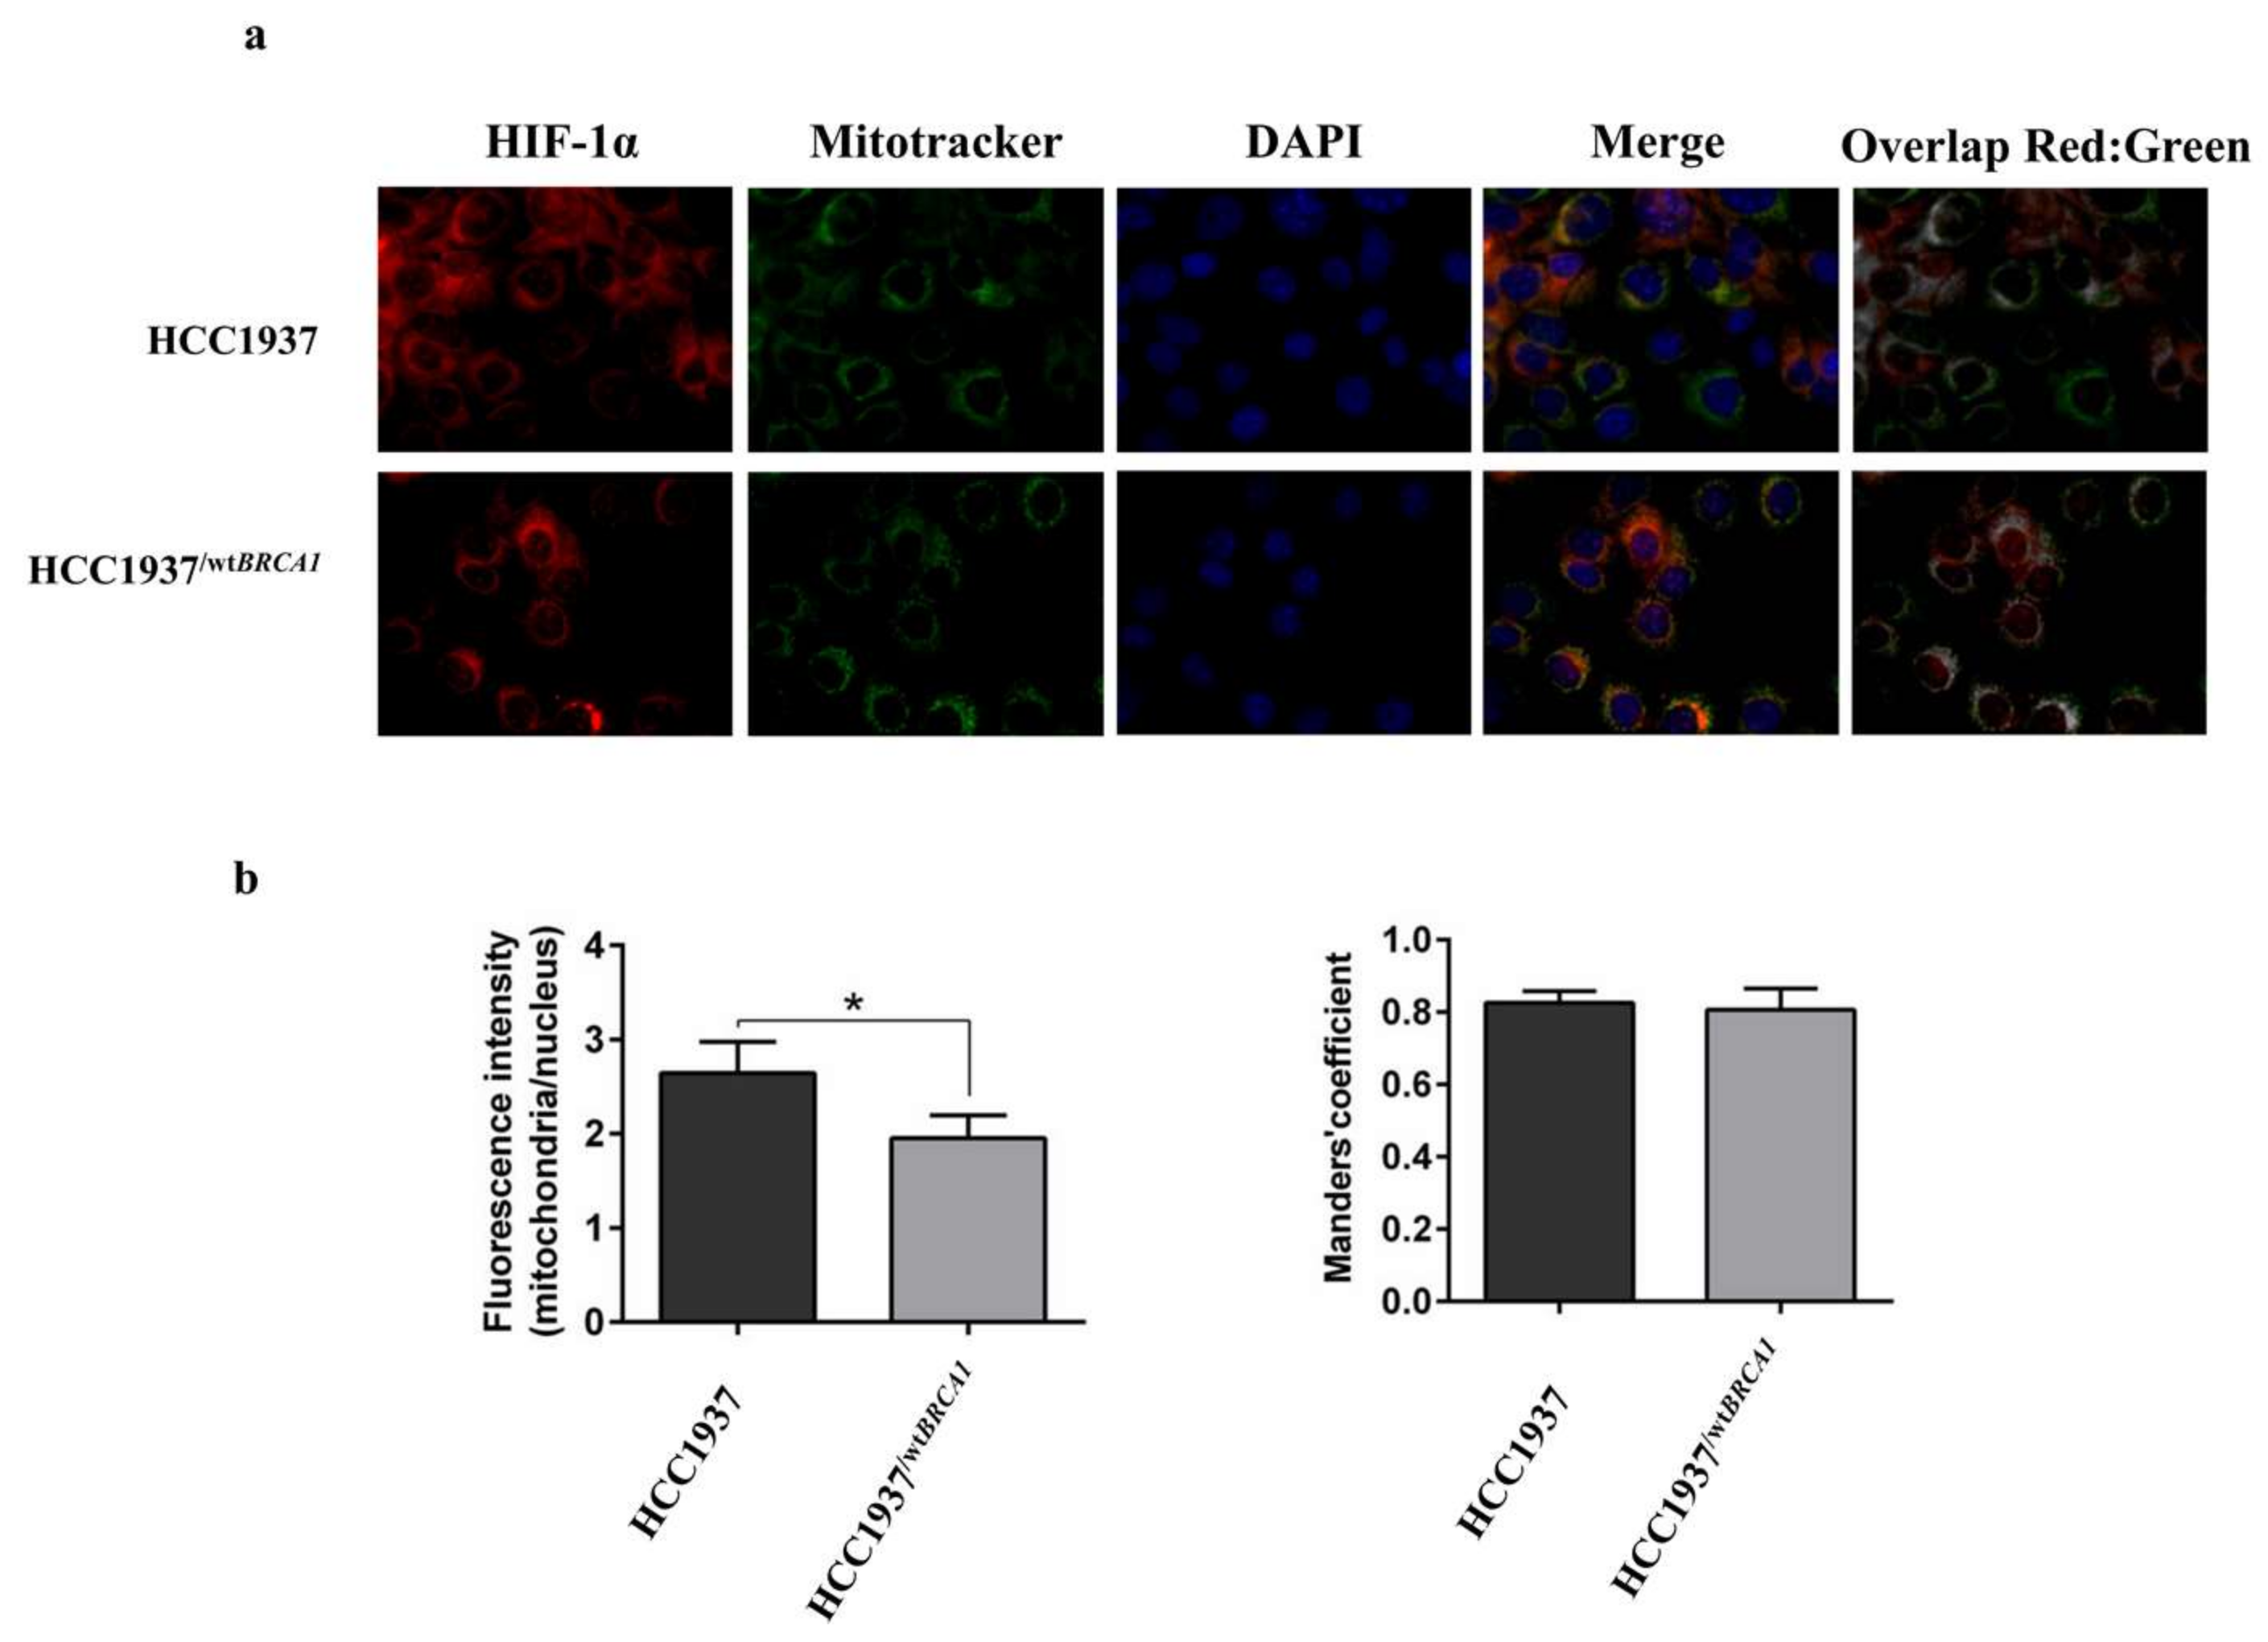
3.7. Immunofluorescence Analysis on HIF-1α
4. Discussion
5. Conclusions
Supplementary Materials
Acknowledgments
Author Contributions
Conflicts of Interest
References
- Narod, S.A.; Foulkes, W.D. BRCA1 and BRCA2: 1994 and beyond. Nat. Rev. Cancer 2004, 4, 665–676. [Google Scholar] [CrossRef] [PubMed]
- Miki, Y.; Swensen, J.; Shattuck-Eidens, D.; Futreal, P.A.; Harshman, K.; Tavtigian, S.; Liu, Q.; Cochran, C.; Bennett, L.M.; Ding, W. A strong candidate for the breast and ovarian cancer susceptibility gene BRCA1. Science 1994, 266, 66–71. [Google Scholar] [CrossRef] [PubMed]
- Yarden, R.I. Papa MZ BRCA1 at the crossroad of multiple cellular pathways: Approaches for therapeutic interventions. Mol. Cancer Ther. 2006, 5, 1396–1404. [Google Scholar] [CrossRef] [PubMed]
- Xiang, T.; Ohashi, A.; Huang, Y.; Pandita, T.K.; Ludwig, T.; Powell, S.N.; Yang, Q. Negative Regulation of AKT Activation by BRCA1. Cancer Res. 2008, 68, 10040–10044. [Google Scholar] [CrossRef] [PubMed]
- Van der Groep, P.; Bouter, A.; Menko, F.H.; van der Wall, E.; van Diest, P.J. High frequency of HIF-1alpha overexpression in BRCA1 related breast cancer. Breast Cancer Res. Treat. 2008, 111, 475–480. [Google Scholar] [CrossRef] [PubMed]
- Knudson, A.G., Jr. Mutation and cancer: Statistical study of retinoblastoma. Proc. Natl. Acad. Sci. USA 1971, 68, 820–823. [Google Scholar] [CrossRef] [PubMed]
- Rennstam, K.; Ringberg, A.; Cunliffe, H.E.; Olsson, H.; Landberg, G.; Hedenfalk, I. Genomic alterations in histopathologically normal breast tissue from BRCA1 mutation carriers may be caused by BRCA1 haploinsufficiency. Genes Chromosomes Cancer 2010, 49, 78–90. [Google Scholar] [CrossRef] [PubMed]
- Konishi, H.; Mohseni, M.; Tamaki, A.; Garay, J.P.; Croessmann, S.; Karnan, S.; Ota, A.; Wong, H.Y.; Konishi, Y.; Karakas, B.; et al. Mutation of a single allele of the cancer susceptibility gene BRCA1 leads to genomic instability in human breast epithelial cells. Proc. Natl. Acad. Sci. USA 2011, 108, 17773–17778. [Google Scholar] [CrossRef] [PubMed]
- Sedic, M.; Skibinski, A.; Brown, N.; Gallardo, M.; Mulligan, P.; Martinez, P.; Keller, P.J.; Glover, E.; Richardson, A.L.; Cowan, J.; et al. Haploinsufficiency for BRCA1 leads to cell-type-specific genomic instability and premature senescence. Nat. Commun. 2015, 6, 7505. [Google Scholar] [CrossRef] [PubMed]
- Vander Heiden, M.G.; Cantley, L.C. Understanding the Warburg effect: The metabolic requirements of cell proliferation. Science 2009, 324, 1029–1033. [Google Scholar] [CrossRef] [PubMed]
- DeBerardinis, R.J.; Lum, J.J.; Hatzivassiliou, G.; Thompson, C.B. The biology of cancer: Metabolic reprogramming fuels cell growth and proliferation. Cell Metab. 2008, 7, 11–20. [Google Scholar] [CrossRef] [PubMed]
- Liu, C.Y.; Flesken-Nikitin, A.; Li, S.; Zeng, Y.; Lee, W.H. Inactivation of the mouse Brca1 gene leads to failure in the morphogenesis of the egg cylinder in early postimplantation development. Genes Dev. 1996, 10, 1835–1843. [Google Scholar] [CrossRef] [PubMed]
- Chiarella, E.; Carrà, G.; Scicchitano, S.; Codispoti, B.; Mega, T.; Lupia, M.; Pelaggi, D.; Marafioti, M.G.; Aloisio, A.; Giordano, M.; et al. UMG Lenti: Novel lentiviral vectors for efficient transgene- and reporter gene expression in human early hematopoietic progenitors. PLoS ONE 2014, 9, e114795. [Google Scholar] [CrossRef] [PubMed]
- Tassone, P.; Tagliaferri, P.; Perricelli, A.; Blotta, S.; Quaresima, B.; Martelli, M.L.; Goel, A.; Barbieri, V.; Costanzo, F.; Boland, C.R.; et al. BRCA1 expression modulates chemosensitivity of BRCA1-defective HCC1937 human breast cancer cells. Br. J. Cancer 2003, 88, 1285–1291. [Google Scholar] [CrossRef] [PubMed]
- Tassone, P.; Blotta, S.; Palmieri, C.; Masciari, S.; Quaresima, B.; Montagna, M.; D’Andrea, E.; Eramo, O.P.; Migale, L.; Costanzo, F.; et al. Differential sensitivity of BRCA1-mutated HCC1937 human breast cancer cells to microtubule-interfering agents. Int. J. Oncol. 2005, 26, 1257–1263. [Google Scholar] [CrossRef] [PubMed]
- Frezza, S.; Cipolat, L. Scorrano, Organelle isolation: Functional mitochondria from mouse liver, muscle and cultured fibroblasts. Nat. Protoc. 2007, 2, 287–295. [Google Scholar] [CrossRef] [PubMed]
- Iacopetta, D.; Carrisi, C.; De Filippis, G.; Calcagnile, V.M.; Cappello, A.R.; Chimento, A.; Curcio, R.; Santoro, A.; Vozza, A.; Dolce, V.; et al. The biochemical properties of the mitochondrial thiamine pyrophosphate carrier from Drosophila melanogaster. FEBS J. 2010, 277, 1172–1181. [Google Scholar] [CrossRef] [PubMed]
- Pochini, L.; Galluccio, M.; Scumaci, D.; Giangregorio, N.; Tonazzi, A.; Palmieri, F.; Indiveri, C. Interaction of beta-lactam antibiotics with the mitochondrial carnitine/acylcarnitine transporter. Chem. Biol. Interact. 2008, 173, 187–194. [Google Scholar] [CrossRef] [PubMed]
- Di Carli, M.; Villani, M.E.; Renzone, G.; Nardi, L.; Pasquo, A.; Scaloni, A.; Benvenuto, E.; Desiderio, A. Leaf proteome analysis of transgenic plants expressing antiviral antibodies. J. Proteome Res. 2009, 8, 838–848. [Google Scholar] [CrossRef] [PubMed]
- Seillier-Moiseiwitsch, F. The Proteomics Protocols Handbook; Walker, M.J., Ed.; Humana Press: New York, NY, USA, 2005; pp. 239–258. ISBN 978-1-59259-890-8. [Google Scholar] [CrossRef]
- Krämer, A.; Green, J.; Pollard, J.; Tugendreich, S. Causal Analysis Approaches in Ingenuity Pathway Analysis (IPA). Bioinformatics 2014, 30, 523–530. [Google Scholar] [CrossRef] [PubMed]
- Scumaci, D.; Tammè, L.; Fiumara, C.V.; Pappaianni, G.; Concolino, A.; Leone, E.; Faniello, M.C.; Quaresima, B.; Ricevuto, E.; Costanzo, F.S.; et al. Plasma Proteomic Profiling in Hereditary Breast Cancer Reveals a BRCA1-Specific Signature: Diagnostic and Functional Implications. PLoS ONE 2015, 10, e0129762. [Google Scholar] [CrossRef] [PubMed]
- Calvo, S.E.; Klauser, C.R.; Mootha, V.K. MitoCarta2.0: An updated inventory of mammalian mitochondrial proteins. Nucleic Acids Res. 2016, 44, D1251–D1257. [Google Scholar] [CrossRef] [PubMed]
- Pagliarini, D.J.; Calvo, S.E.; Chang, B.; Sheth, S.A.; Vafai, S.B.; Ong, S.E.; Walford, G.A.; Sugiana, C.; Boneh, A.; Chen, W.K.; et al. A mitochondrial protein compendium elucidates complex I disease biology. Cell 2008, 134, 112–123. [Google Scholar] [CrossRef] [PubMed]
- Wang, Q.; Chen, X.; Hay, N. Akt as a target for cancer therapy: More is not always better (lessons from studies in mice). Br. J. Cancer 2017, 117, 159–163. [Google Scholar] [CrossRef] [PubMed]
- Hientz, K.; Mohr, A.; Bhakta-Guha, D.; Efferth, T. The role of p53 in cancer drug resistance and targeted chemotherapy. Oncotarget 2017, 8, 8921–8946. [Google Scholar] [CrossRef] [PubMed]
- Majmundar, A.J.; Wong, W.J.; Simon, M.C. Hypoxia-inducible factors and the response to hypoxic stress. Mol. Cell 2010, 40, 294–309. [Google Scholar] [CrossRef] [PubMed]
- Thomas, S.N.; Liao, Z.; Clark, D.; Chen, Y.; Samadani, R.; Mao, L.; Ann, D.K.; Baulch, J.E.; Shapiro, P.; Yang, A.J. Exosomal Proteome Profiling: A Potential Multi-Marker Cellular Phenotyping Tool to Characterize Hypoxia-Induced Radiation Resistance in Breast Cancer. Proteomes 2013, 1, 87–108. [Google Scholar] [CrossRef] [PubMed]
- Yan, M.; Rayoo, M.; Takano, E.A. KConFab Investigators, Fox SB. BRCA1 tumours correlate with a HIF-1alpha phenotype and have a poor prognosis through modulation of hydroxylase enzyme profile expression. Br. J. Cancer 2009, 101, 1168–1174. [Google Scholar] [CrossRef] [PubMed]
- Van der Groep, P.; van Diest, P.J.; Smolders, Y.H.; Ausems, M.G.; van der Luijt, R.B.; Menko, F.H.; Bart, J.; de Vries, E.G.; van der Wall, E. HIF-1α overexpression in ductal carcinoma in situ of the breast in BRCA1 and BRCA2 mutation carriers. PLoS ONE 2013, 8, e56055. [Google Scholar] [CrossRef] [PubMed]
- Salem, A.F.; Howell, A.; Sartini, M.; Sotgia, F.; Lisanti, M.P. Downregulation of stromal BRCA1 drives breast cancer tumor growth via upregulation of HIF-1α, autophagy and ketone body production. Cell Cycle 2012, 11, 4167–4173. [Google Scholar] [CrossRef] [PubMed][Green Version]
- Briston, T.; Yang, J.; Ashcroft, M. HIF-1α localization with mitochondria: A new role for an old favorite? Cell Cycle 2011, 10, 4170–4171. [Google Scholar] [CrossRef] [PubMed]
- Chandra, D.; Choy, G.; Tang, D.G. Cytosolic accumulation of HSP60 during apoptosis with or without apparent mitochondrial release: Evidence that its pro-apoptotic or pro-survival functions involve differential interactions with caspase-3. J. Biol. Chem. 2007, 282, 31289–31301. [Google Scholar] [CrossRef] [PubMed]
- Chiche, J.; Brahimi-Horn, M.C.; Pouyssegur, J. Tumour hypoxia induces a metabolic shift causing acidosis: A common feature in cancer. J. Cell. Mol. Med. 2010, 14, 771–794. [Google Scholar] [CrossRef] [PubMed]
- Semenza, G.L. HIF-1: Upstream and downstream of cancer metabolism. Curr. Opin. Genet. Dev. 2010, 20, 51–56. [Google Scholar] [CrossRef] [PubMed]
- Mole, D.R.; Blancher, C.; Copley, R.R.; Pollard, P.J.; Gleadle, J.M.; Ragoussis, J.; Ratcliffe, P.J. Genome-wide association of hypoxia-inducible factor (HIF)-1alpha and HIF-2alpha DNA binding with expression profiling of hypoxia-inducible transcripts. J. Biol. Chem. 2009, 284, 16767–16775. [Google Scholar] [CrossRef] [PubMed]
- Tchernyshyov, I.; Semenza, G.L.; Dang, C.V. HIF-1-mediated expression of pyruvate dehydrogenase kinase: A metabolic switch required for cellular adaptation to hypoxia. Cell Metab. 2006, 3, 177–185. [Google Scholar]
- Chattopadhyay, E.; Roy, B. Altered Mitochondrial Signalling and Metabolism in Cancer. Front. Oncol. 2017, 20, 43. [Google Scholar] [CrossRef] [PubMed]
- Lanning, N.J.; Looyenga, B.D.; Kauffman, A.L.; Niemi, N.M.; Sudderth, J.; DeBerardinis, R.J.; MacKeigan, J.P. A mitochondrial RNAi screen defines cellular bioenergetic determinants and identifies an adenylate kinase as a key regulator of ATP levels. Cell Rep. 2014, 7, 907–917. [Google Scholar] [CrossRef] [PubMed]


© 2018 by the authors. Licensee MDPI, Basel, Switzerland. This article is an open access article distributed under the terms and conditions of the Creative Commons Attribution (CC BY) license (http://creativecommons.org/licenses/by/4.0/).
Share and Cite
Concolino, A.; Olivo, E.; Tammè, L.; Fiumara, C.V.; De Angelis, M.T.; Quaresima, B.; Agosti, V.; Costanzo, F.S.; Cuda, G.; Scumaci, D. Proteomics Analysis to Assess the Role of Mitochondria in BRCA1-Mediated Breast Tumorigenesis. Proteomes 2018, 6, 16. https://doi.org/10.3390/proteomes6020016
Concolino A, Olivo E, Tammè L, Fiumara CV, De Angelis MT, Quaresima B, Agosti V, Costanzo FS, Cuda G, Scumaci D. Proteomics Analysis to Assess the Role of Mitochondria in BRCA1-Mediated Breast Tumorigenesis. Proteomes. 2018; 6(2):16. https://doi.org/10.3390/proteomes6020016
Chicago/Turabian StyleConcolino, Antonio, Erika Olivo, Laura Tammè, Claudia Vincenza Fiumara, Maria Teresa De Angelis, Barbara Quaresima, Valter Agosti, Francesco Saverio Costanzo, Giovanni Cuda, and Domenica Scumaci. 2018. "Proteomics Analysis to Assess the Role of Mitochondria in BRCA1-Mediated Breast Tumorigenesis" Proteomes 6, no. 2: 16. https://doi.org/10.3390/proteomes6020016
APA StyleConcolino, A., Olivo, E., Tammè, L., Fiumara, C. V., De Angelis, M. T., Quaresima, B., Agosti, V., Costanzo, F. S., Cuda, G., & Scumaci, D. (2018). Proteomics Analysis to Assess the Role of Mitochondria in BRCA1-Mediated Breast Tumorigenesis. Proteomes, 6(2), 16. https://doi.org/10.3390/proteomes6020016