Variety and Dynamics of Proteoforms in the Human Proteome: Aspects of Markers for Hepatocellular Carcinoma
Abstract
1. Introduction
2. Materials and Methods
3. Results
4. Discussion
5. Conclusions
Supplementary Materials
Acknowledgments
Author Contributions
Conflicts of Interest
Abbreviations
| 2DE | two-dimensional electrophoresis |
| ESI LC-MS/MS | liquid chromatography-electrospray ionization-tandem mass spectrometry |
| HCD | higher energy collisional dissociation |
| ABC | ammonium bicarbonate |
| CAN | acetonitrile |
| PTM | post-translation modification |
| emPAI | exponential modified form of protein abundance index |
| HCC | hepatocellular carcinoma |
References
- Aebersold, R.; Mann, M. Mass spectrometry-based proteomics. Nature 2003, 422, 198–207. [Google Scholar] [CrossRef] [PubMed]
- Smith, L.M.; Kelleher, N.L. Proteoform: A single term describing protein complexity. Nat. Methods 2013, 10, 186–187. [Google Scholar] [CrossRef] [PubMed]
- Schlüter, H.; Apweiler, R.; Holzhütter, H.-G.; Jungblut, P.R. Finding one’s way in proteomics: A protein species nomenclature. Chem. Cent. J. 2009, 3, 11. [Google Scholar] [CrossRef] [PubMed]
- Toby, T.K.; Fornelli, L.; Kelleher, N.L. Progress in Top-Down Proteomics and the Analysis of Proteoforms. Annu. Rev. Anal. Chem. 2016, 9, 499–519. [Google Scholar] [CrossRef] [PubMed]
- Siuti, N.; Kelleher, N.L. Decoding protein modifications using top-down mass spectrometry. Nat. Methods 2007, 4, 817–821. [Google Scholar] [CrossRef] [PubMed]
- Naryzhny, S.N.; Maynskova, M.A.; Zgoda, V.G.; Ronzhina, N.L.; Novikova, S.E.; Belyakova, N.V.; Kleyst, O.A.; Legina, O.K.; Pantina, R.A.; Filatov, M.V. Proteomic profiling of high-grade glioblastoma using virtual-experimental 2DE. J. Proteom. Bioinform. 2016, 9, 158–165. [Google Scholar] [CrossRef]
- Naryzhny, S.N.; Maynskova, M.A.; Zgoda, V.G.; Ronzhina, N.L.; Kleyst, O.A.; Vakhrushev, I.V.; Archakov, A.I. Virtual-Experimental 2DE Approach in Chromosome-Centric Human Proteome Project. J. Proteome Res. 2016, 15, 525–530. [Google Scholar] [CrossRef] [PubMed]
- Naryzhny, S. Towards the Full Realization of 2DE Power. Proteomes 2016, 4, 33. [Google Scholar] [CrossRef] [PubMed]
- Abu El Makarem, M. An overview of biomarkers for the diagnosis of hepatocellular carcinoma. Hepat. Mon. 2012, 12, e6122. [Google Scholar] [CrossRef] [PubMed]
- Wright, L.M.; Kreikemeier, J.T.; Fimmel, C.J. A concise review of serum markers for hepatocellular cancer. Cancer Detect. Prev. 2007, 31, 35–44. [Google Scholar] [CrossRef] [PubMed]
- Lee, N.P.; Chen, L.; Lin, M.C.; Tsang, F.H.; Yeung, C.; Poon, R.T.; Peng, J.; Leng, X.; Beretta, L.; Sun, S.; et al. Proteomic expression signature distinguishes cancerous and nonmalignant tissues in hepatocellular carcinoma. J. Proteome Res. 2009, 8, 1293–1303. [Google Scholar] [CrossRef] [PubMed]
- Gygi, S.P.; Rist, B.; Gerber, S.A.; Turecek, F.; Gelb, M.H.; Aebersold, R. Quantitative analysis of complex protein mixtures using isotope-coded affinity tags. Nat. Biotechnol. 1999, 17, 994–999. [Google Scholar] [CrossRef] [PubMed]
- Ong, S.-E.; Mann, M. Mass spectrometry-based proteomics turns quantitative. Nat. Chem. Biol. 2005, 1, 252–262. [Google Scholar] [CrossRef] [PubMed]
- Wiśniewski, J.R.; Vildhede, A.; Norén, A.; Artursson, P. In-depth quantitative analysis and comparison of the human hepatocyte and hepatoma cell line HepG2 proteomes. J. Proteom. 2016, 136, 234–247. [Google Scholar] [CrossRef] [PubMed]
- Vildhede, A.; Wiśniewski, J.R.; Norén, A.; Karlgren, M.; Artursson, P. Comparative Proteomic Analysis of Human Liver Tissue and Isolated Hepatocytes with a Focus on Proteins Determining Drug Exposure. J. Proteome Res. 2015, 14, 3305–3314. [Google Scholar] [CrossRef] [PubMed]
- Shtam, T.A.; Naryzhny, S.N.; Landa, S.B.; Burdakov, V.S.; Artamonova, T.O.; Filatov, M.V. Purification and in vitro analysis of exosomes secreted by malignantly transformed human cells. Cell Tissue Biol. 2012, 6, 317–325. [Google Scholar] [CrossRef]
- Naryzhny, S.N.; Zgoda, V.G.; Maynskova, M.A.; Ronzhina, N.L.; Belyakova, N.V.; Legina, O.K.; Archakov, A.I. Experimental estimation of proteome size for cells and human plasma. Biomed. Khimiia 2015, 61, 279–285. [Google Scholar] [CrossRef] [PubMed]
- Naryzhny, S.N.; Lisitsa, A.V.; Zgoda, V.G.; Ponomarenko, E.A.; Archakov, A.I. 2DE-based approach for estimation of number of protein species in a cell. Electrophoresis 2014, 35, 895–900. [Google Scholar] [CrossRef] [PubMed]
- Naryzhny, S.; Maynskova, M.; Zgoda, V.; Archakov, A. Dataset of protein species from human liver. Data Br. 2017, 12, 584–588. [Google Scholar] [CrossRef] [PubMed]
- Naryzhny, S.N.; Lee, H. Proliferating cell nuclear antigen in the cytoplasm interacts with components of glycolysis and cancer. FEBS Lett. 2010, 584, 4292–4298. [Google Scholar] [CrossRef] [PubMed]
- Naryzhny, S.N. Blue Dry Western: Simple, economic, informative, and fast way of immunodetection. Anal. Biochem. 2009, 392, 90–95. [Google Scholar] [CrossRef] [PubMed]
- Naryzhny, S.N.; Zgoda, V.G.; Maynskova, M.A.; Novikova, S.E.; Ronzhina, N.L.; Vakhrushev, I.V.; Khryapova, E.V.; Lisitsa, A.V.; Tikhonova, O.V.; Ponomarenko, E.A.; et al. Combination of virtual and experimental 2DE together with ESI LC-MS/MS gives a clearer view about proteomes of human cells and plasma. Electrophoresis 2016, 37, 302–309. [Google Scholar] [CrossRef] [PubMed]
- Wiśniewski, J.R.; Zougman, A.; Nagaraj, N.; Mann, M. Universal sample preparation method for proteome analysis. Nat. Methods 2009, 6, 359–362. [Google Scholar] [CrossRef] [PubMed]
- Ishihama, Y.; Oda, Y.; Tabata, T.; Sato, T.; Nagasu, T.; Rappsilber, J.; Mann, M. Exponentially Modified Protein Abundance Index (emPAI) for Estimation of Absolute Protein Amount in Proteomics by the Number of Sequenced Peptides per Protein. Mol. Cell. Proteom. 2005, 4, 1265–1272. [Google Scholar] [CrossRef] [PubMed]
- Ishihama, Y.; Schmidt, T.; Rappsilber, J.; Mann, M.; Hartl, F.U.; Kerner, M.J.; Frishman, D. Protein abundance profiling of the Escherichia coli cytosol. BMC Genom. 2008, 9, 102. [Google Scholar] [CrossRef] [PubMed]
- Polanski, M.; Anderson, N.L. A list of candidate cancer biomarkers for targeted proteomics. Biomark. Insights 2007, 1, 1–48. [Google Scholar] [CrossRef] [PubMed]
- Lou, J.; Zhang, L.; Lv, S.; Zhang, C.; Jiang, S. Biomarkers for Hepatocellular Carcinoma. Biomark. Cancer 2017, 9, 1–9. [Google Scholar] [CrossRef] [PubMed]
- Chaiteerakij, R.; Addissie, B.D.; Roberts, L.R. Update on Biomarkers of Hepatocellular Carcinoma. Clin. Gastroenterol. Hepatol. 2015, 13, 237–245. [Google Scholar] [CrossRef] [PubMed]
- Bertino, G.; Ardiri, A.; Malaguarnera, M.; Malaguarnera, G.; Bertino, N.; Calvagno, G.S. Hepatocellualar carcinoma serum markers. Semin. Oncol. 2012, 39, 410–433. [Google Scholar] [CrossRef] [PubMed]
- Oka, H.; Saito, A.; Ito, K.; Kumada, T.; Satomura, S.; Kasugai, H.; Osaki, Y.; Seki, T.; Kudo, M.; Tanaka, M. Multicenter prospective analysis of newly diagnosed hepatocellular carcinoma with respect to the percentage of Lens culinaris agglutinin-reactive α-fetoprotein. J. Gastroenterol. Hepatol. (Australia) 2001, 16, 1378–1383. [Google Scholar] [CrossRef]
- Saffroy, R.; Pham, P.; Reffas, M.; Takka, M.; Lemoine, A.; Debuire, B. New perspectives and strategy research biomarkers for hepatocellular carcinoma. Clin. Chem. Lab. Med. 2007, 45, 1169–1179. [Google Scholar] [CrossRef] [PubMed]
- Shiota, G.; Miura, N. Biomarkers for hepatocellular carcinoma. Clin. J. Gastroenterol. 2012, 5, 177–182. [Google Scholar] [CrossRef] [PubMed]
- Zhao, Y.-J.; Ju, Q.; Li, G.-C. Tumor markers for hepatocellular carcinoma. Mol. Clin. Oncol. 2013, 1, 593–598. [Google Scholar] [CrossRef] [PubMed]
- Shang, S.; Plymoth, A.; Ge, S.; Feng, Z.; Rosen, H.R.; Sangrajrang, S.; Hainaut, P.; Marrero, J.A.; Beretta, L. Identification of osteopontin as a novel marker for early hepatocellular carcinoma. Hepatology 2012, 55, 483–490. [Google Scholar] [CrossRef] [PubMed]
- Zhang, S.Y.; Lin, B.D.; Li, B.R. Evaluation of the diagnostic value of alpha-l-fucosidase, alpha-fetoprotein and thymidine kinase 1 with ROC and logistic regression for hepatocellular carcinoma. FEBS Open Bio 2015, 5, 240–244. [Google Scholar] [CrossRef] [PubMed]
- Schmilovitz-Weiss, H.; Tobar, A.; Halpern, M.; Levy, I.; Shabtai, E.; Ben-Ari, Z. Tissue expression of squamous cellular carcinoma antigen and Ki67 in hepatocellular carcinoma-correlation with prognosis: A historical prospective study. Diagn. Pathol. 2011, 6, 121. [Google Scholar] [CrossRef] [PubMed]
- Fimmel, C.J.; Wright, L. Golgi protein 73 as a biomarker of hepatocellular cancer: Development of a quantitative serum assay and expression studies in hepatic and extrahepatic malignancies. Hepatology 2009, 49, 1421–1423. [Google Scholar] [CrossRef] [PubMed]
- Dehm, S.; Senger, M.-A.; Bonham, K. SRC transcriptional activation in a subset of human colon cancer cell lines. FEBS Lett. 2001, 487, 367–371. [Google Scholar] [CrossRef]
- Sigala, I.; Tsamis, K.I.; Gousia, A.; Alexiou, G.; Voulgaris, S.; Giannakouros, T.; Kyritsis, A.P.; Nikolakaki, E. Expression of SRPK1 in gliomas and its role in glioma cell lines viability. Tumor Biol. 2016, 37, 8699–8707. [Google Scholar] [CrossRef] [PubMed]
- Zhu, W.L.; Fan, B.L.; Liu, D.L.; Zhu, W.X. Abnormal expression of fibrinogen gamma (FGG) and plasma level of fibrinogen in patients with hepatocellular carcinoma. Anticancer Res. 2009, 29, 2531–2534. [Google Scholar] [PubMed]
- Faucher, C.; Capdevielle, J.; Canal, I.; Ferrara, P.; Mazarguil, H.; McGuire, W.L.; Darbon, J.M. The 28-kDa protein whose phosphorylation is induced by protein kinase C activators in MCF-7 cells belongs to the family of low molecular mass heat shock proteins and is the estrogen-regulated 24-kDa protein. J. Biol. Chem. 1993, 268, 15168–15173. [Google Scholar] [PubMed]
- Deora, A.B.; Kreitzer, G.; Jacovina, A.T.; Hajjar, K.A. An annexin 2 phosphorylation switch mediates p11-dependent translocation of annexin 2 to the cell surface. J. Biol. Chem. 2004, 279, 43411–43418. [Google Scholar] [CrossRef] [PubMed]
- Chen, R.; Jiang, X.; Sun, D.; Han, G.; Wang, F.; Ye, M.; Wang, L.; Zou, H. Glycoproteomics analysis of human liver tissue by combination of multiple enzyme digestion and hydrazide chemistry. J. Proteome Res. 2009, 8, 651–661. [Google Scholar] [CrossRef] [PubMed]
- Halligan, B.D.; Ruotti, V.; Jin, W.; Laffoon, S.; Twigger, S.N.; Dratz, E.A. ProMoST (Protein Modification Screening Tool): A web-based tool for mapping protein modifications on two-dimensional gels. Nucleic Acids Res. 2004, 32, W638–W644. [Google Scholar] [CrossRef] [PubMed]
- Naryzhny, S.; Zgoda, V.; Kopylov, A.; Petrenko, E.; Archakov, А. A semi-virtual two dimensional gel electrophoresis: IF–ESI LC-MS/MS. MethodsX 2017, 4, 260–264. [Google Scholar] [CrossRef] [PubMed]
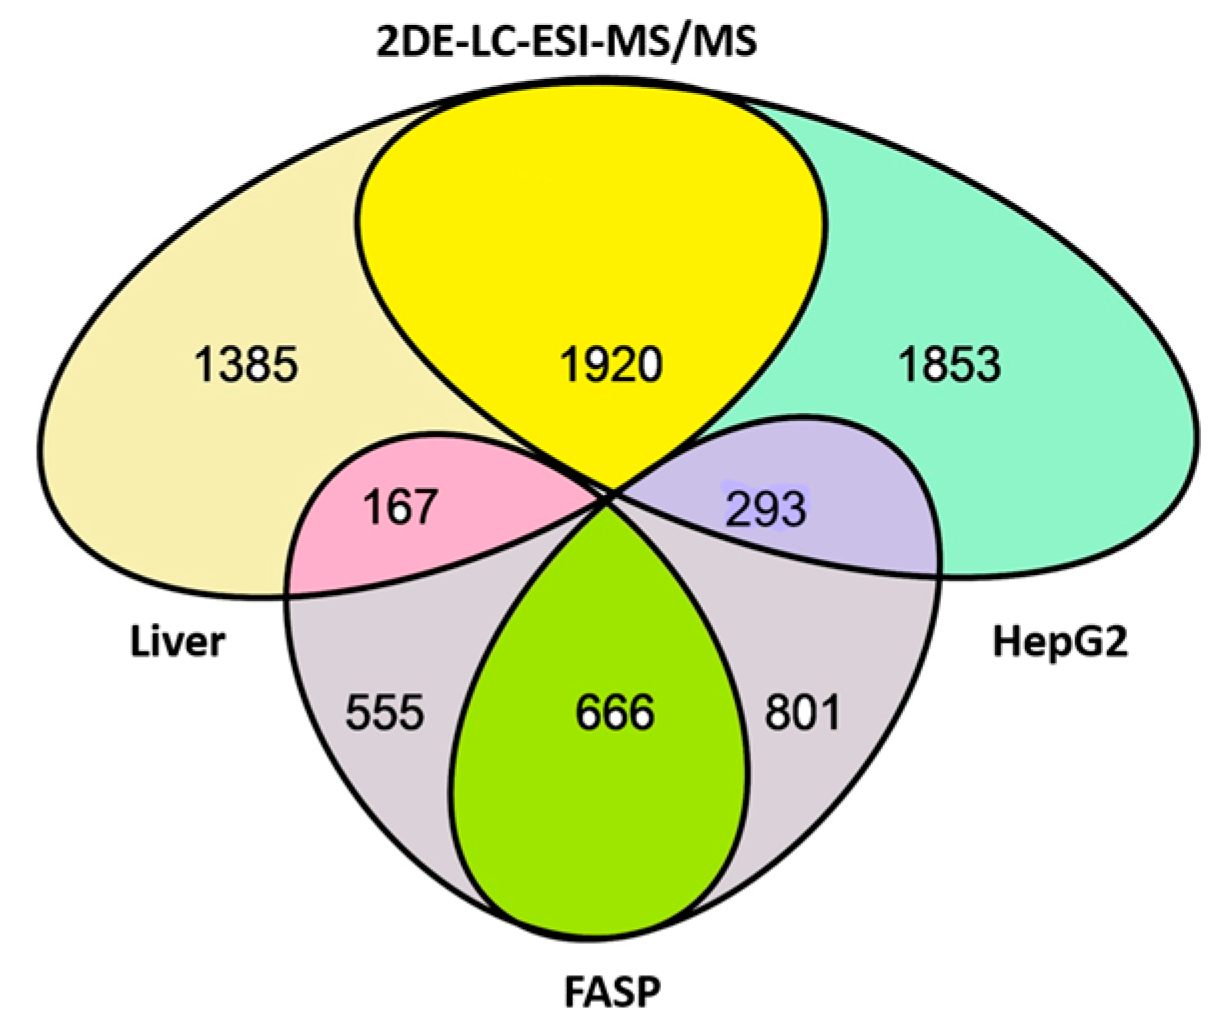
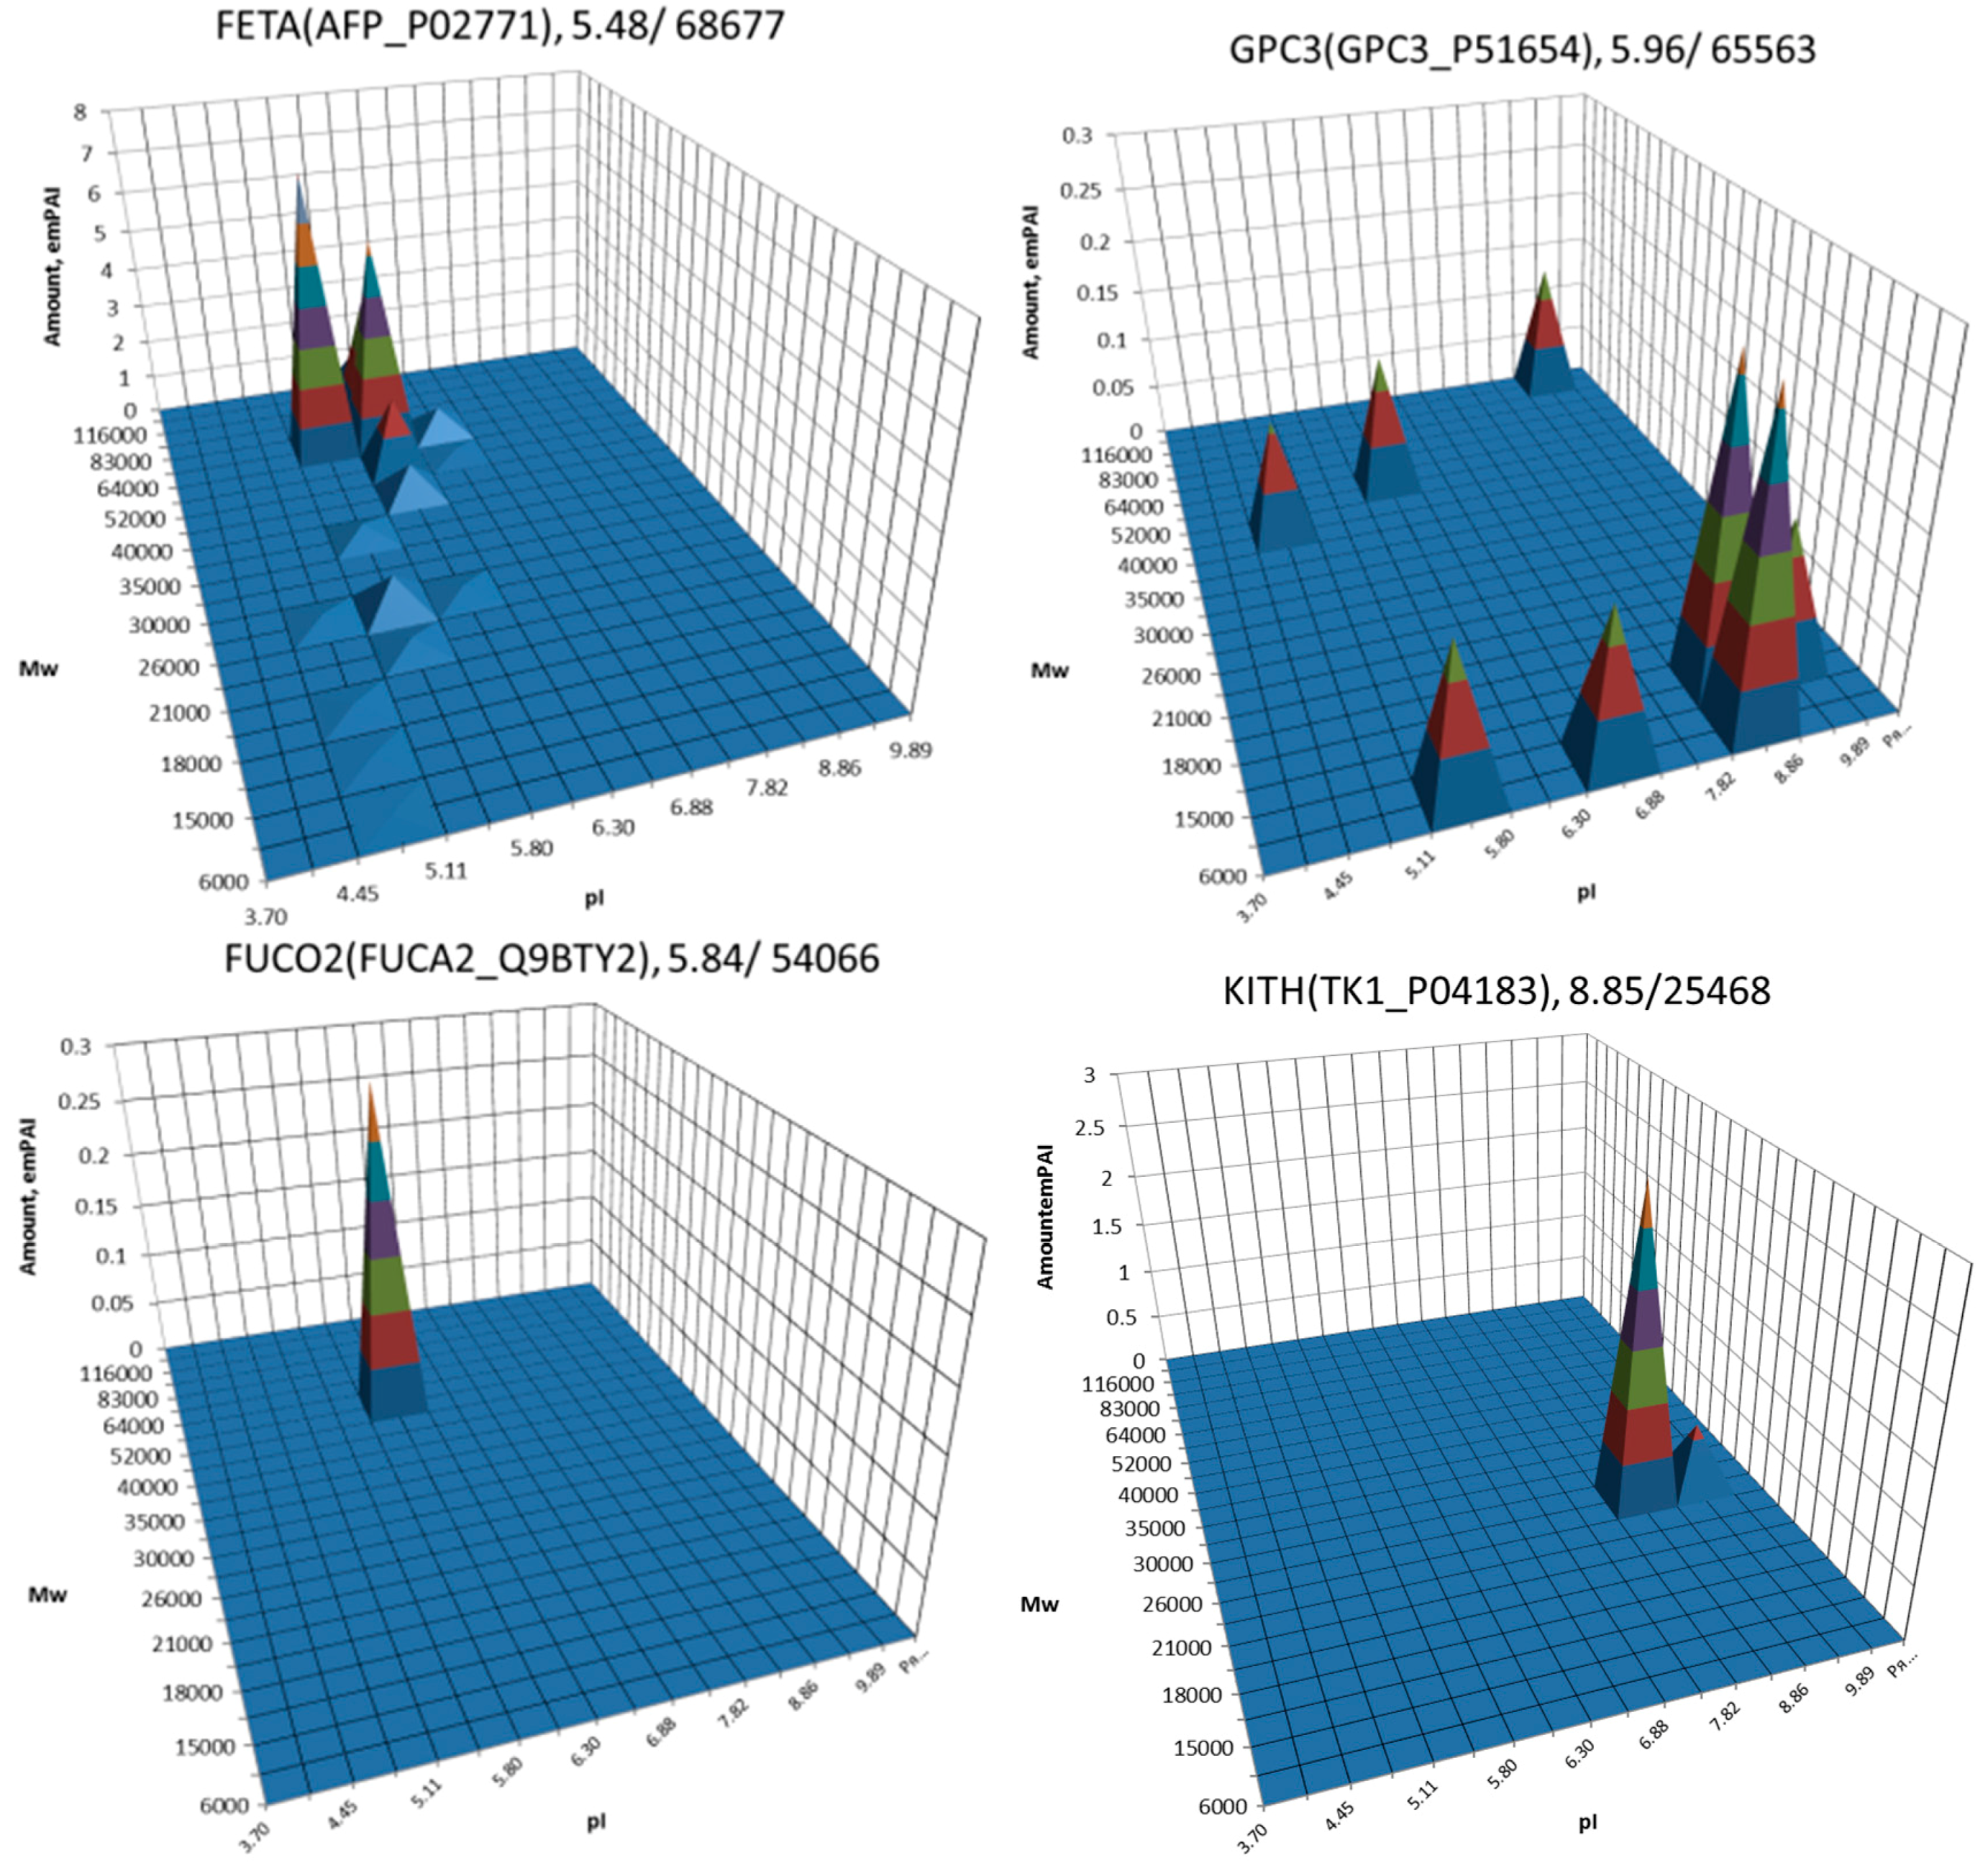
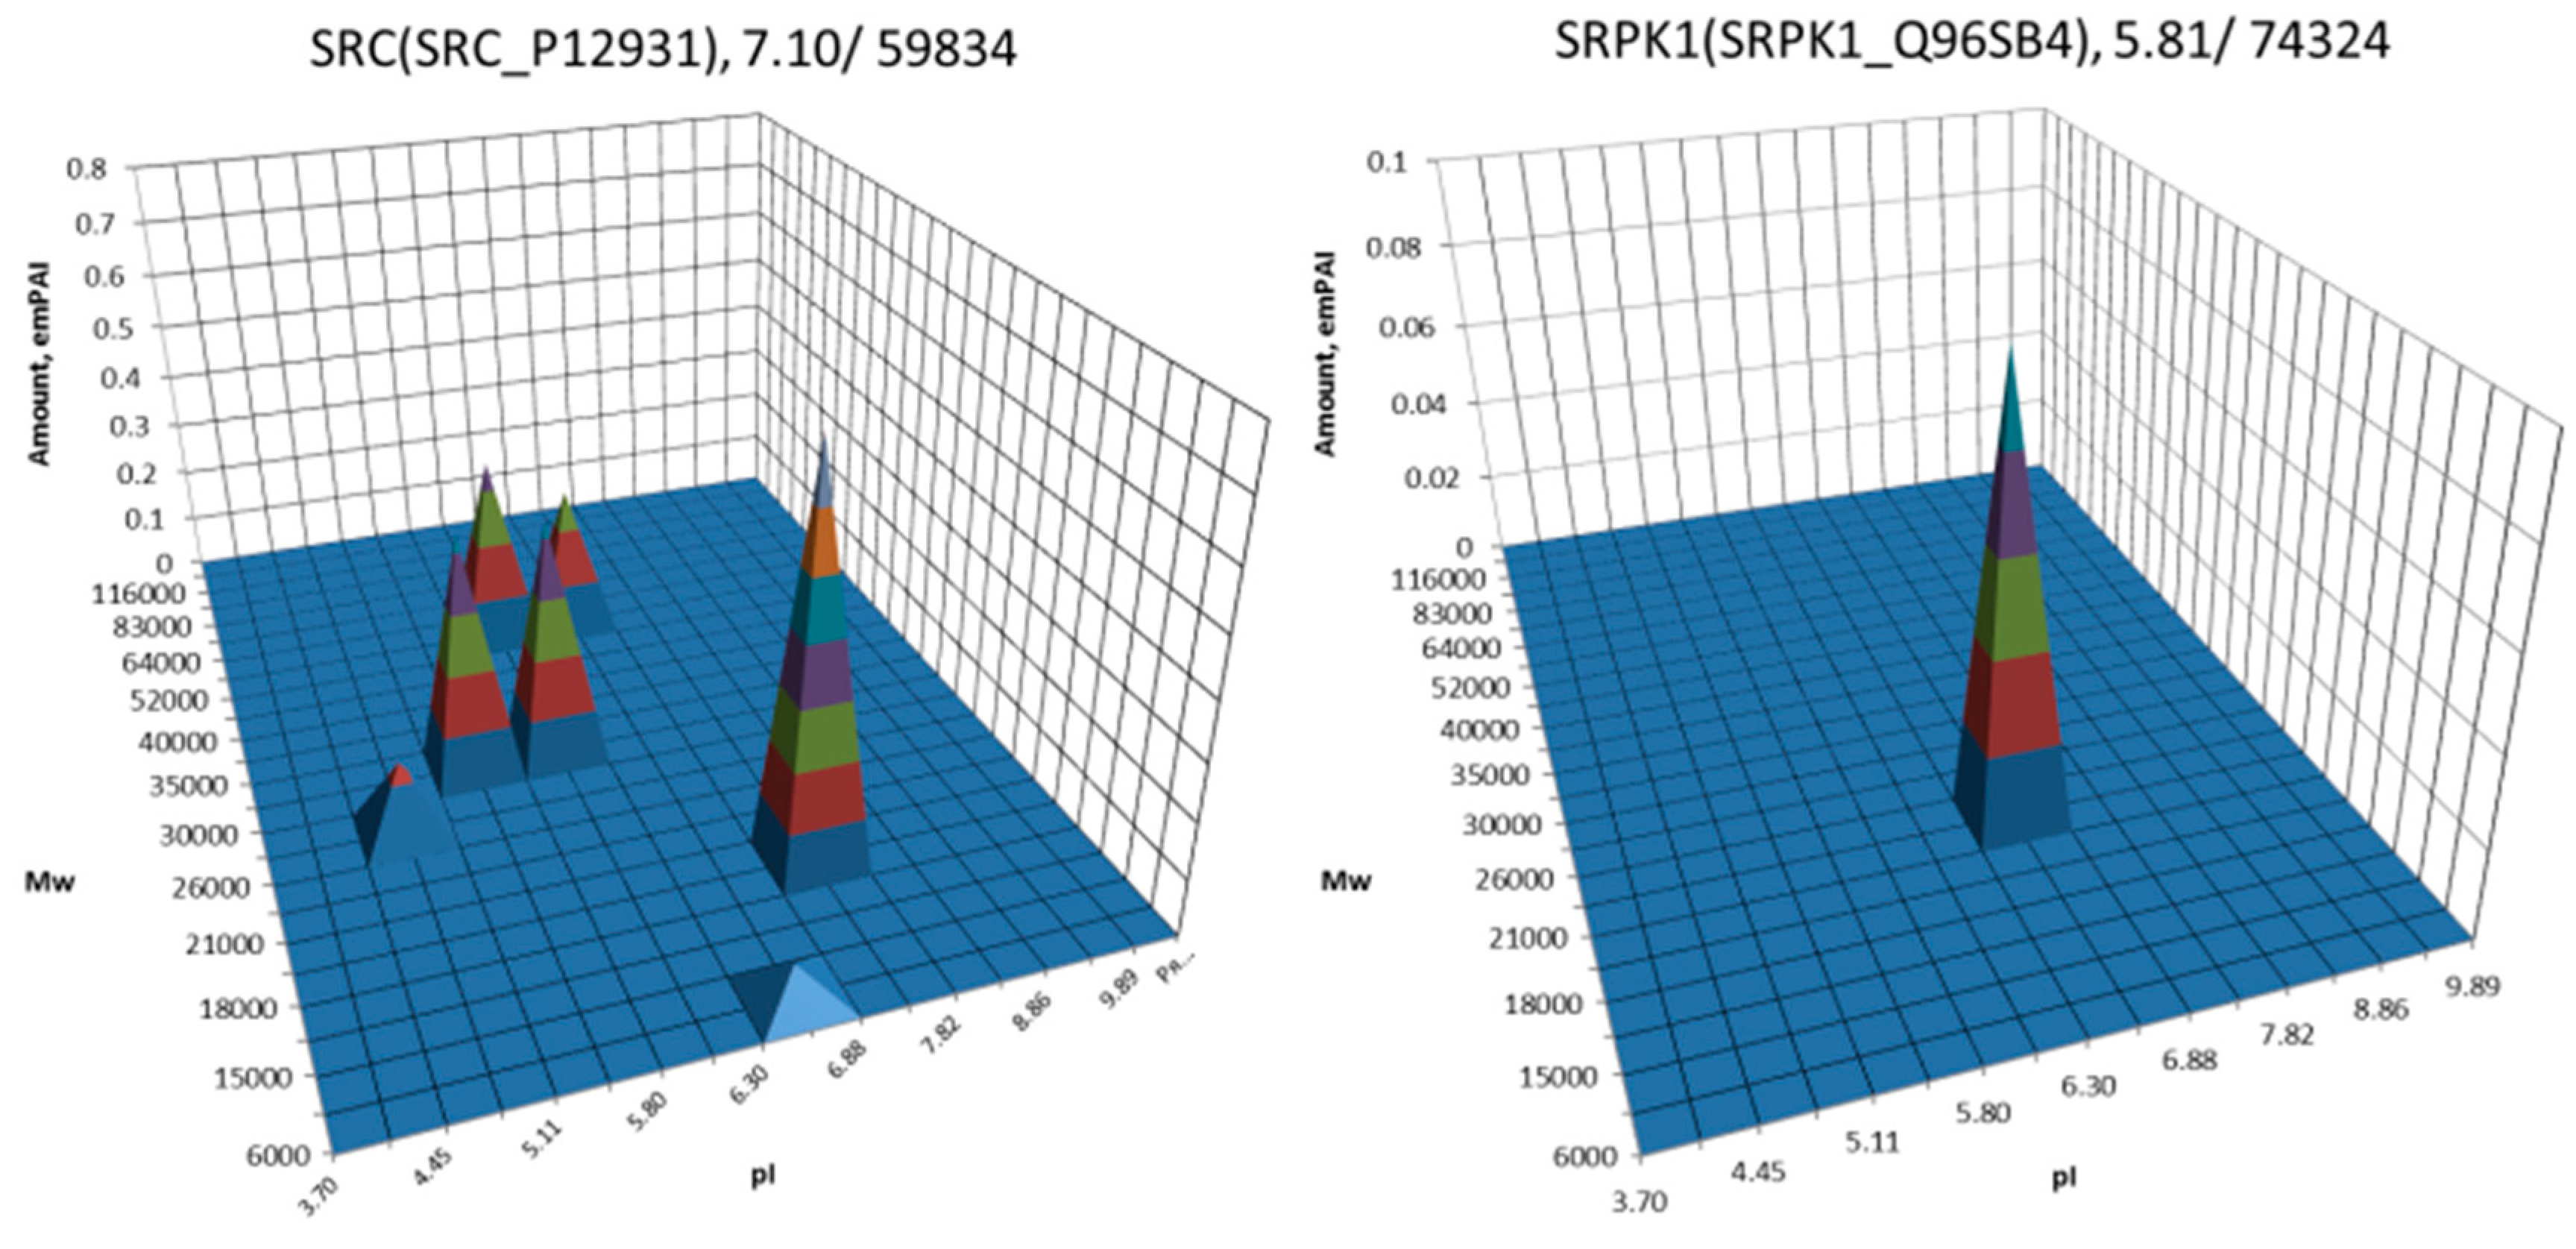
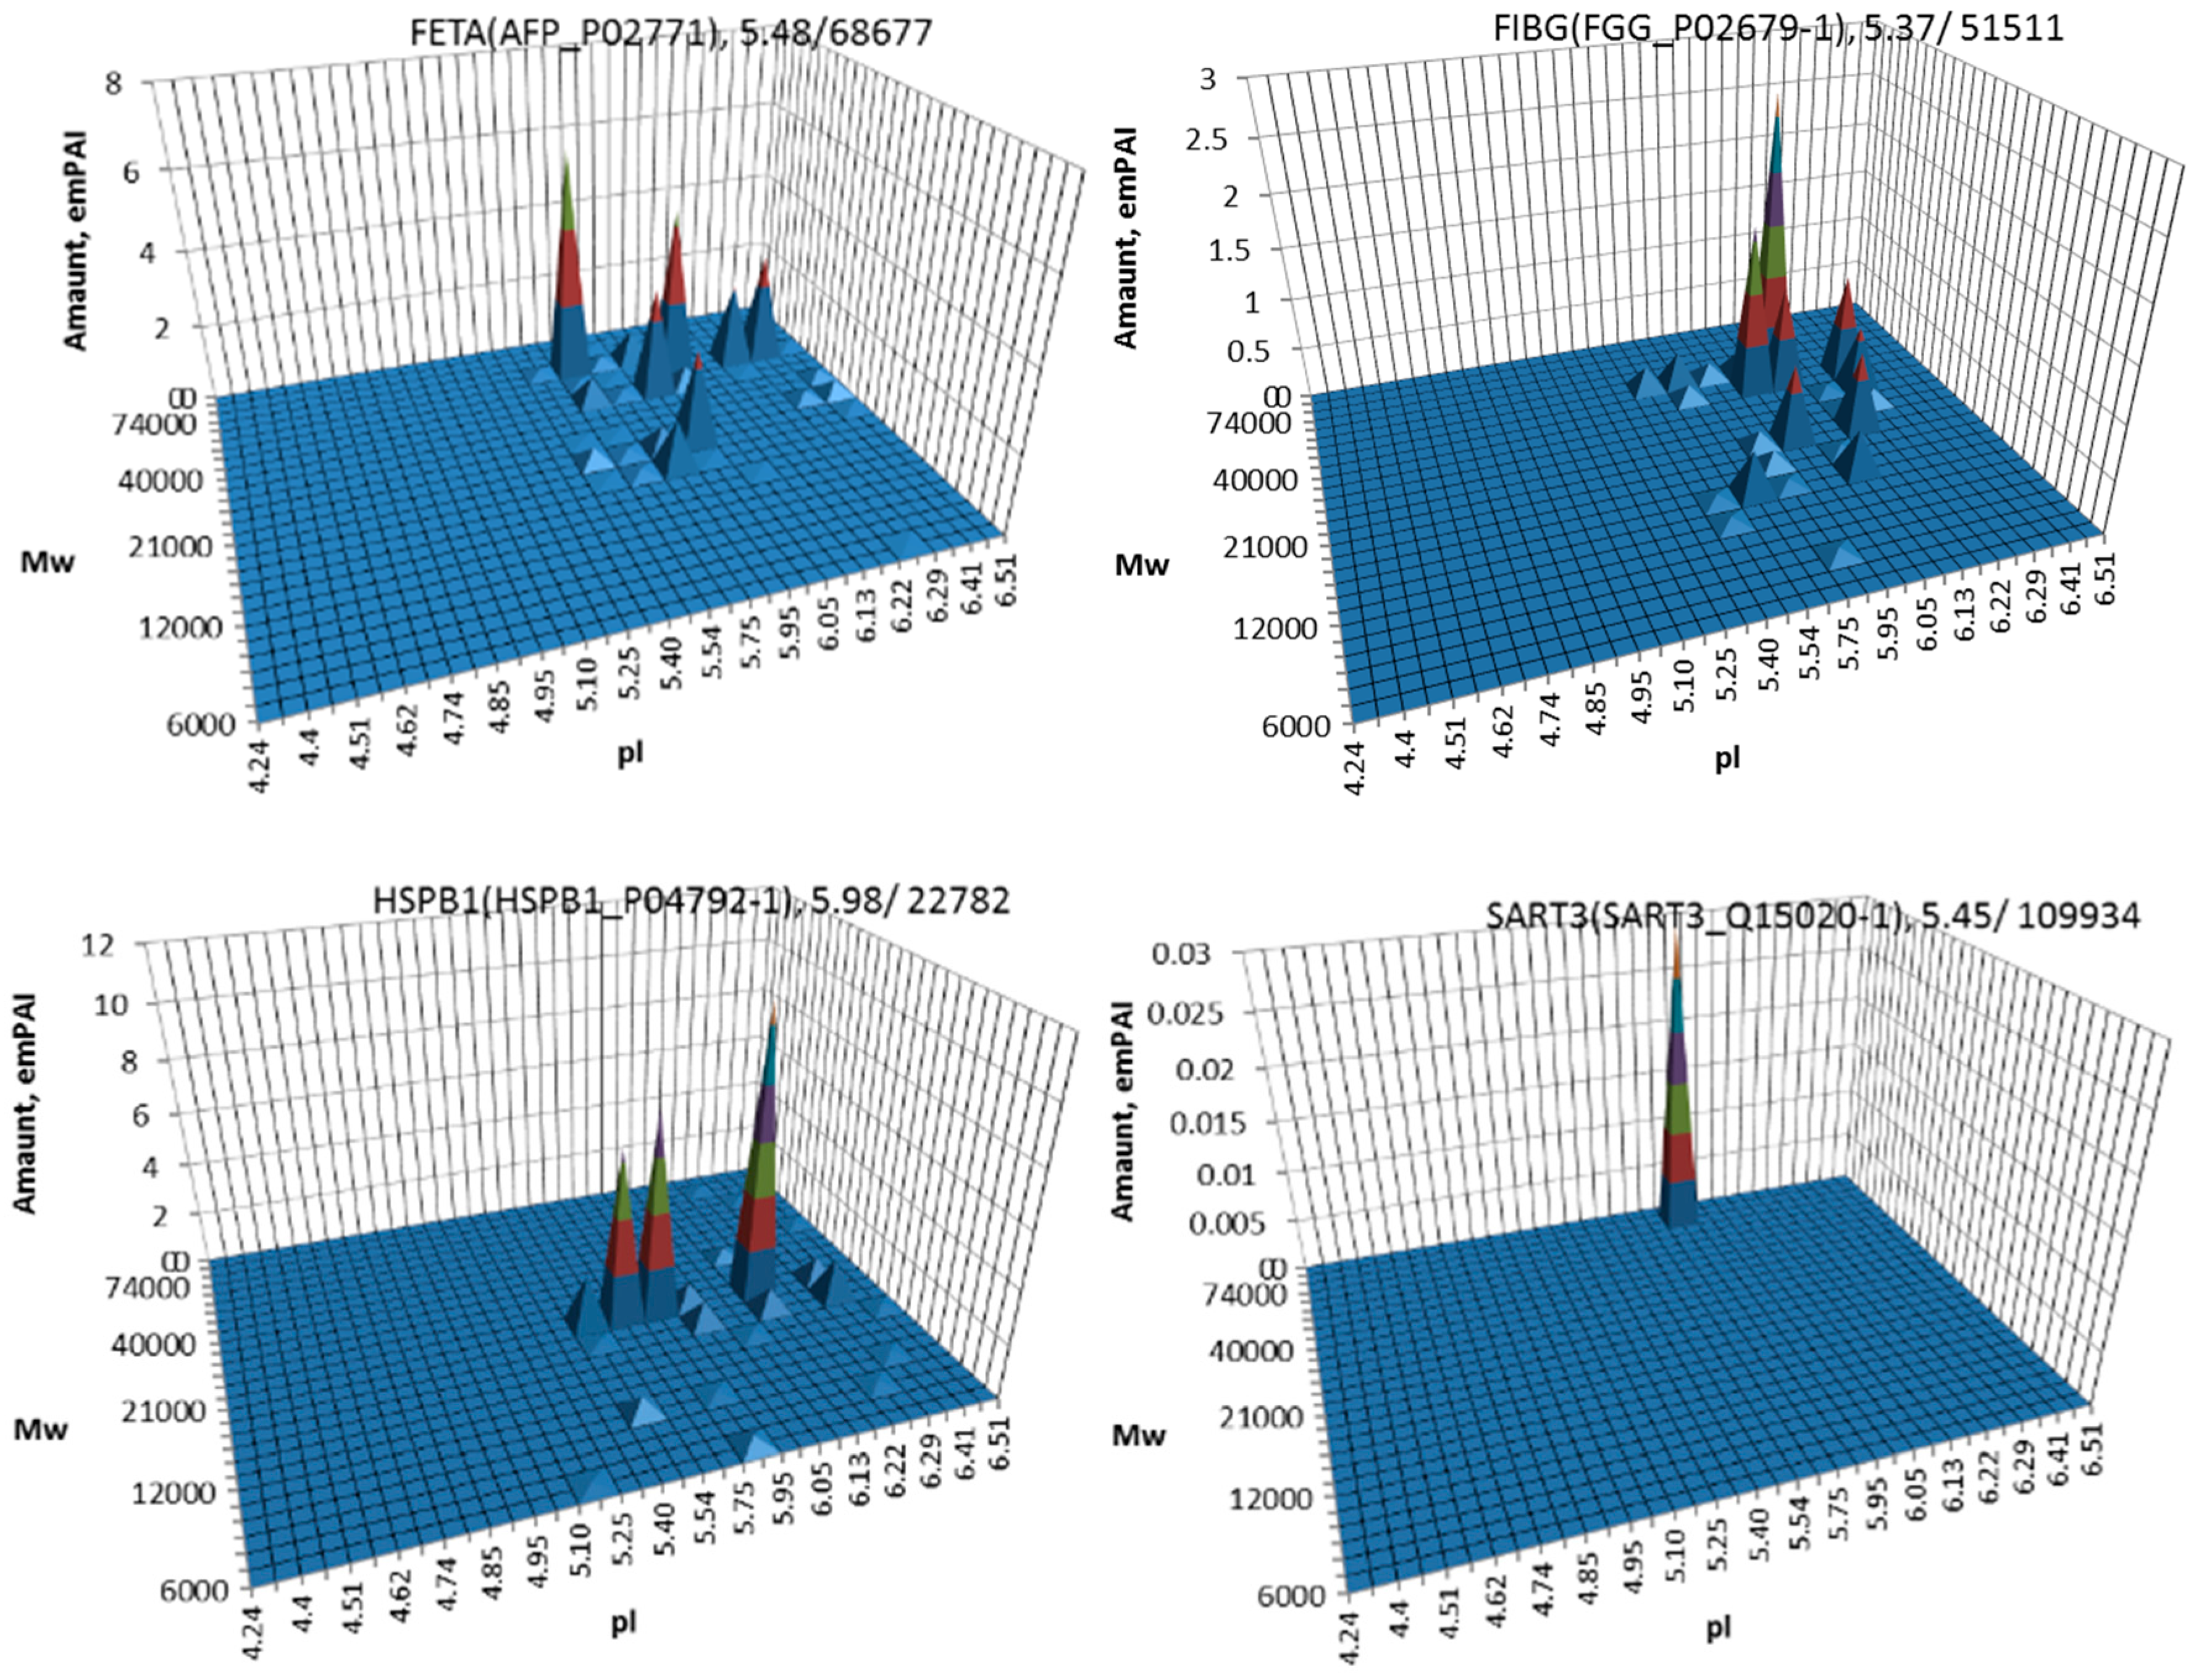
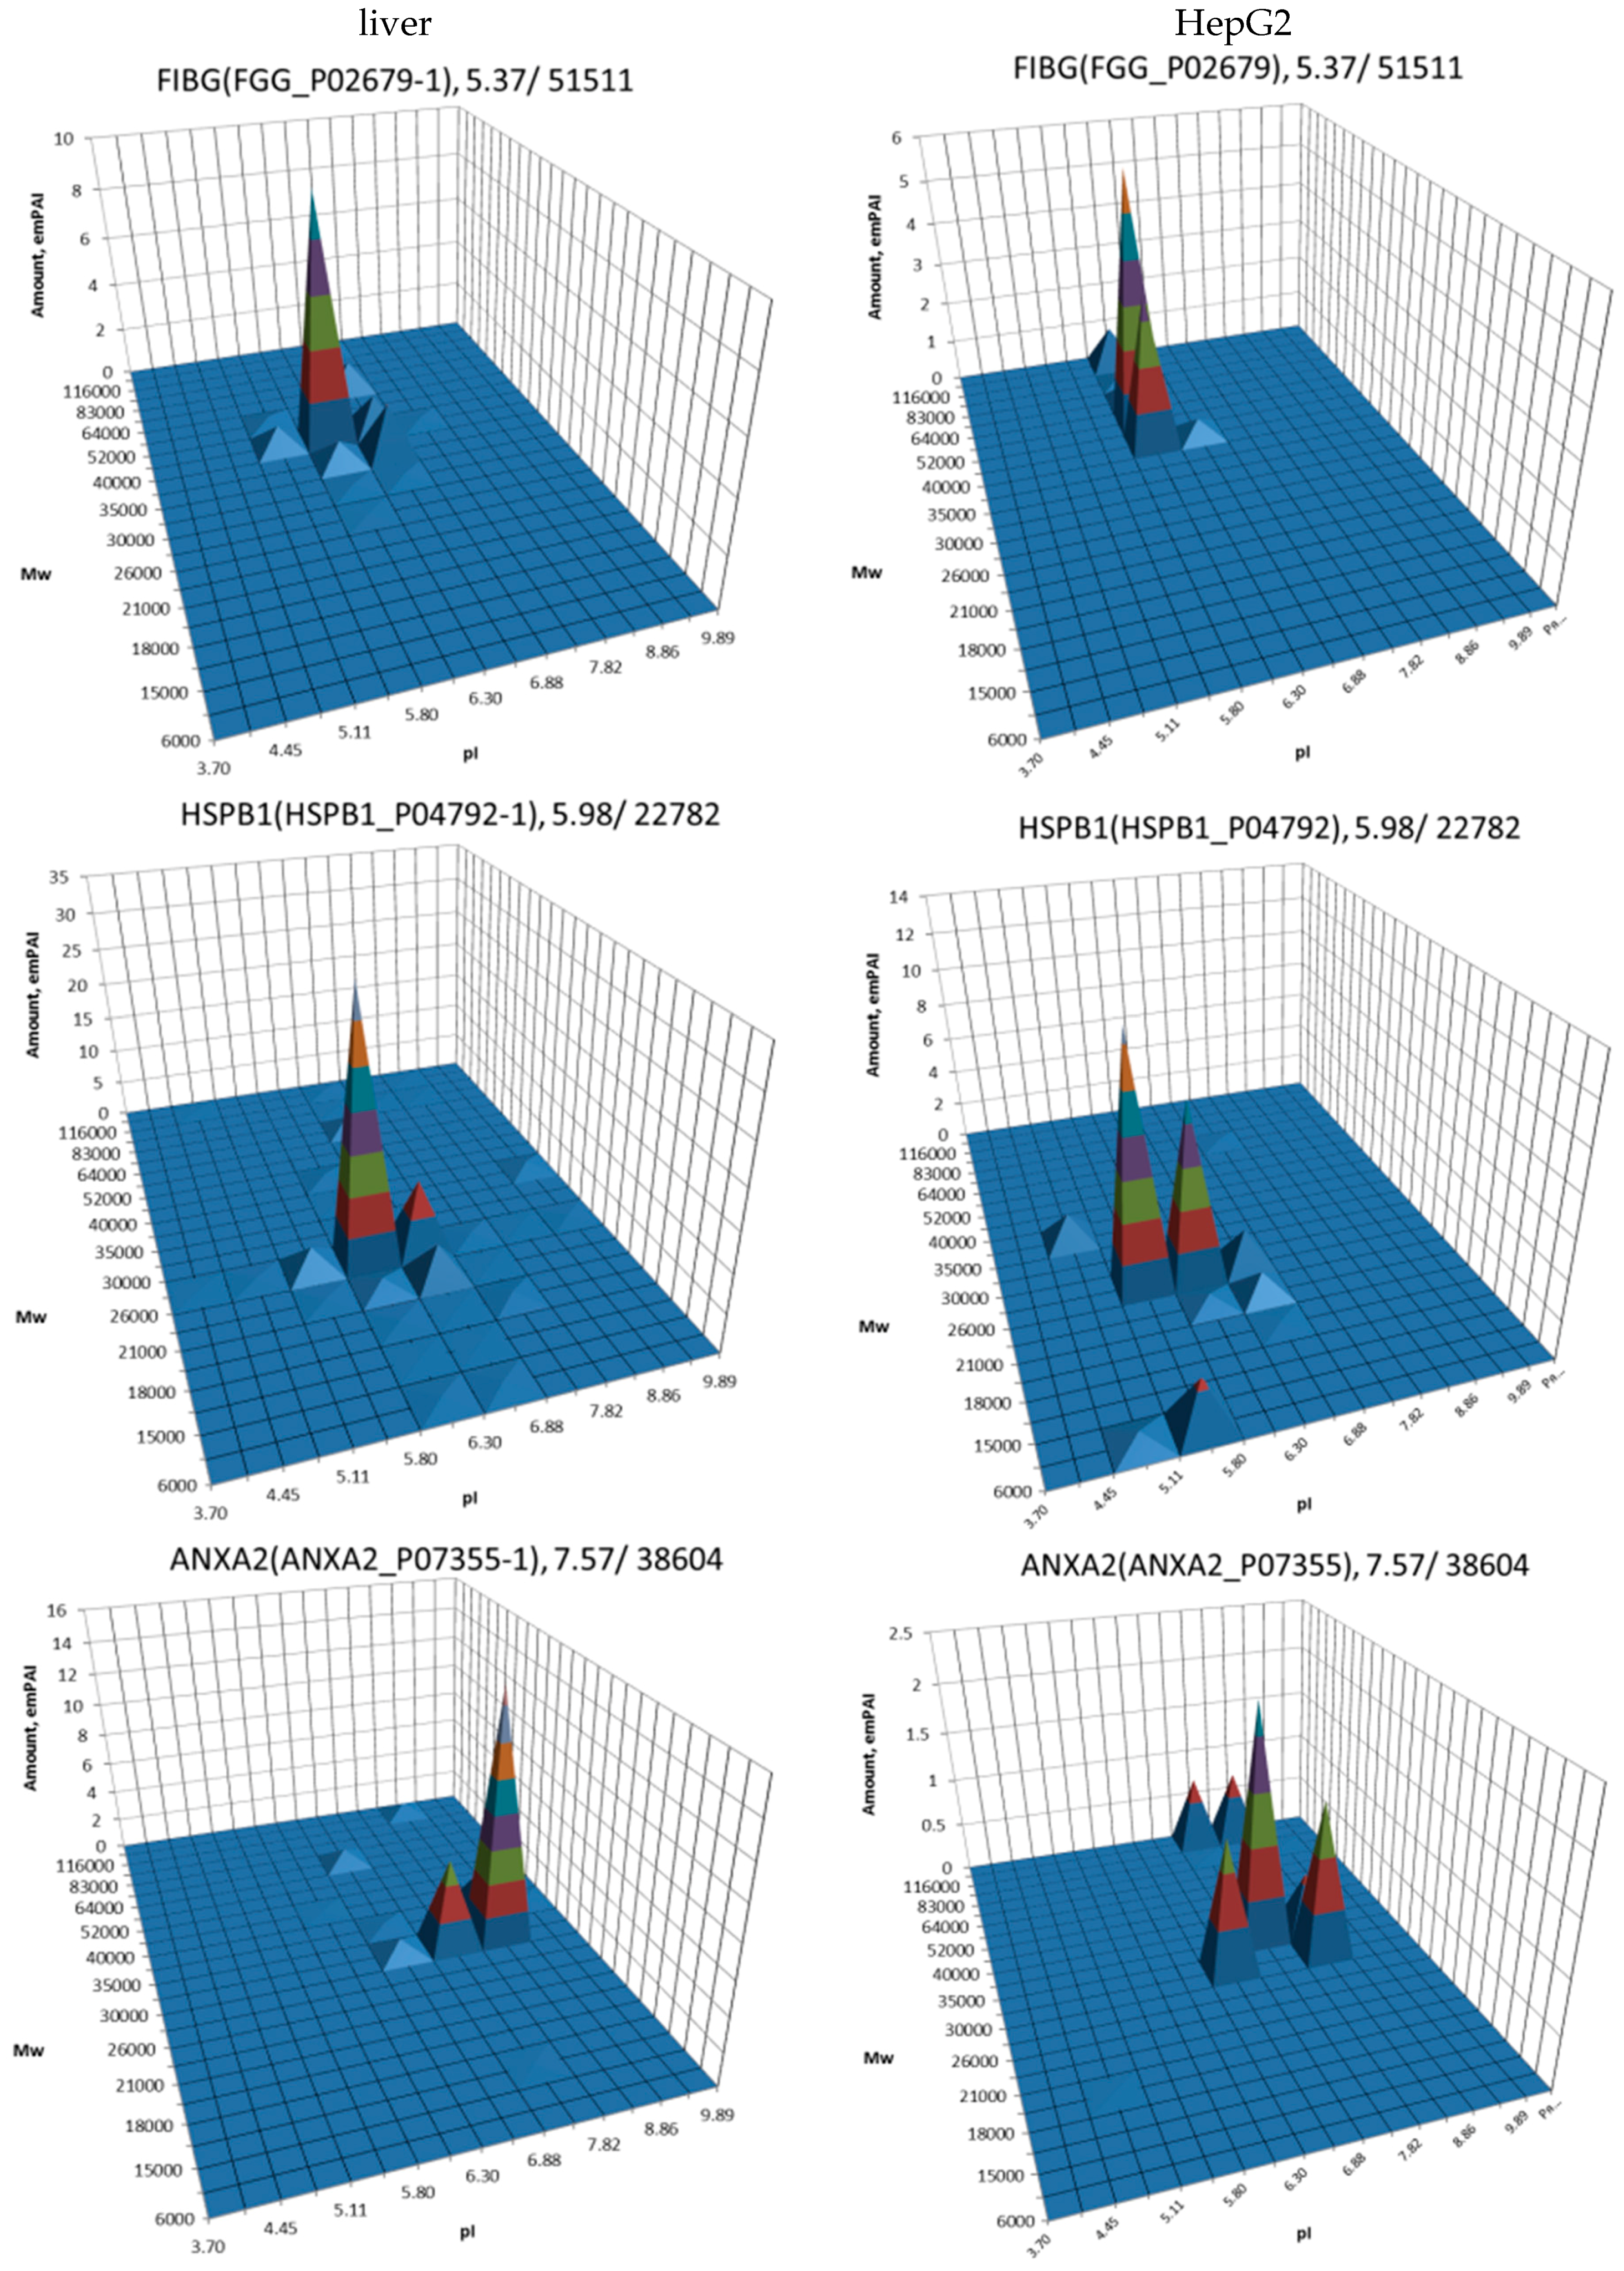
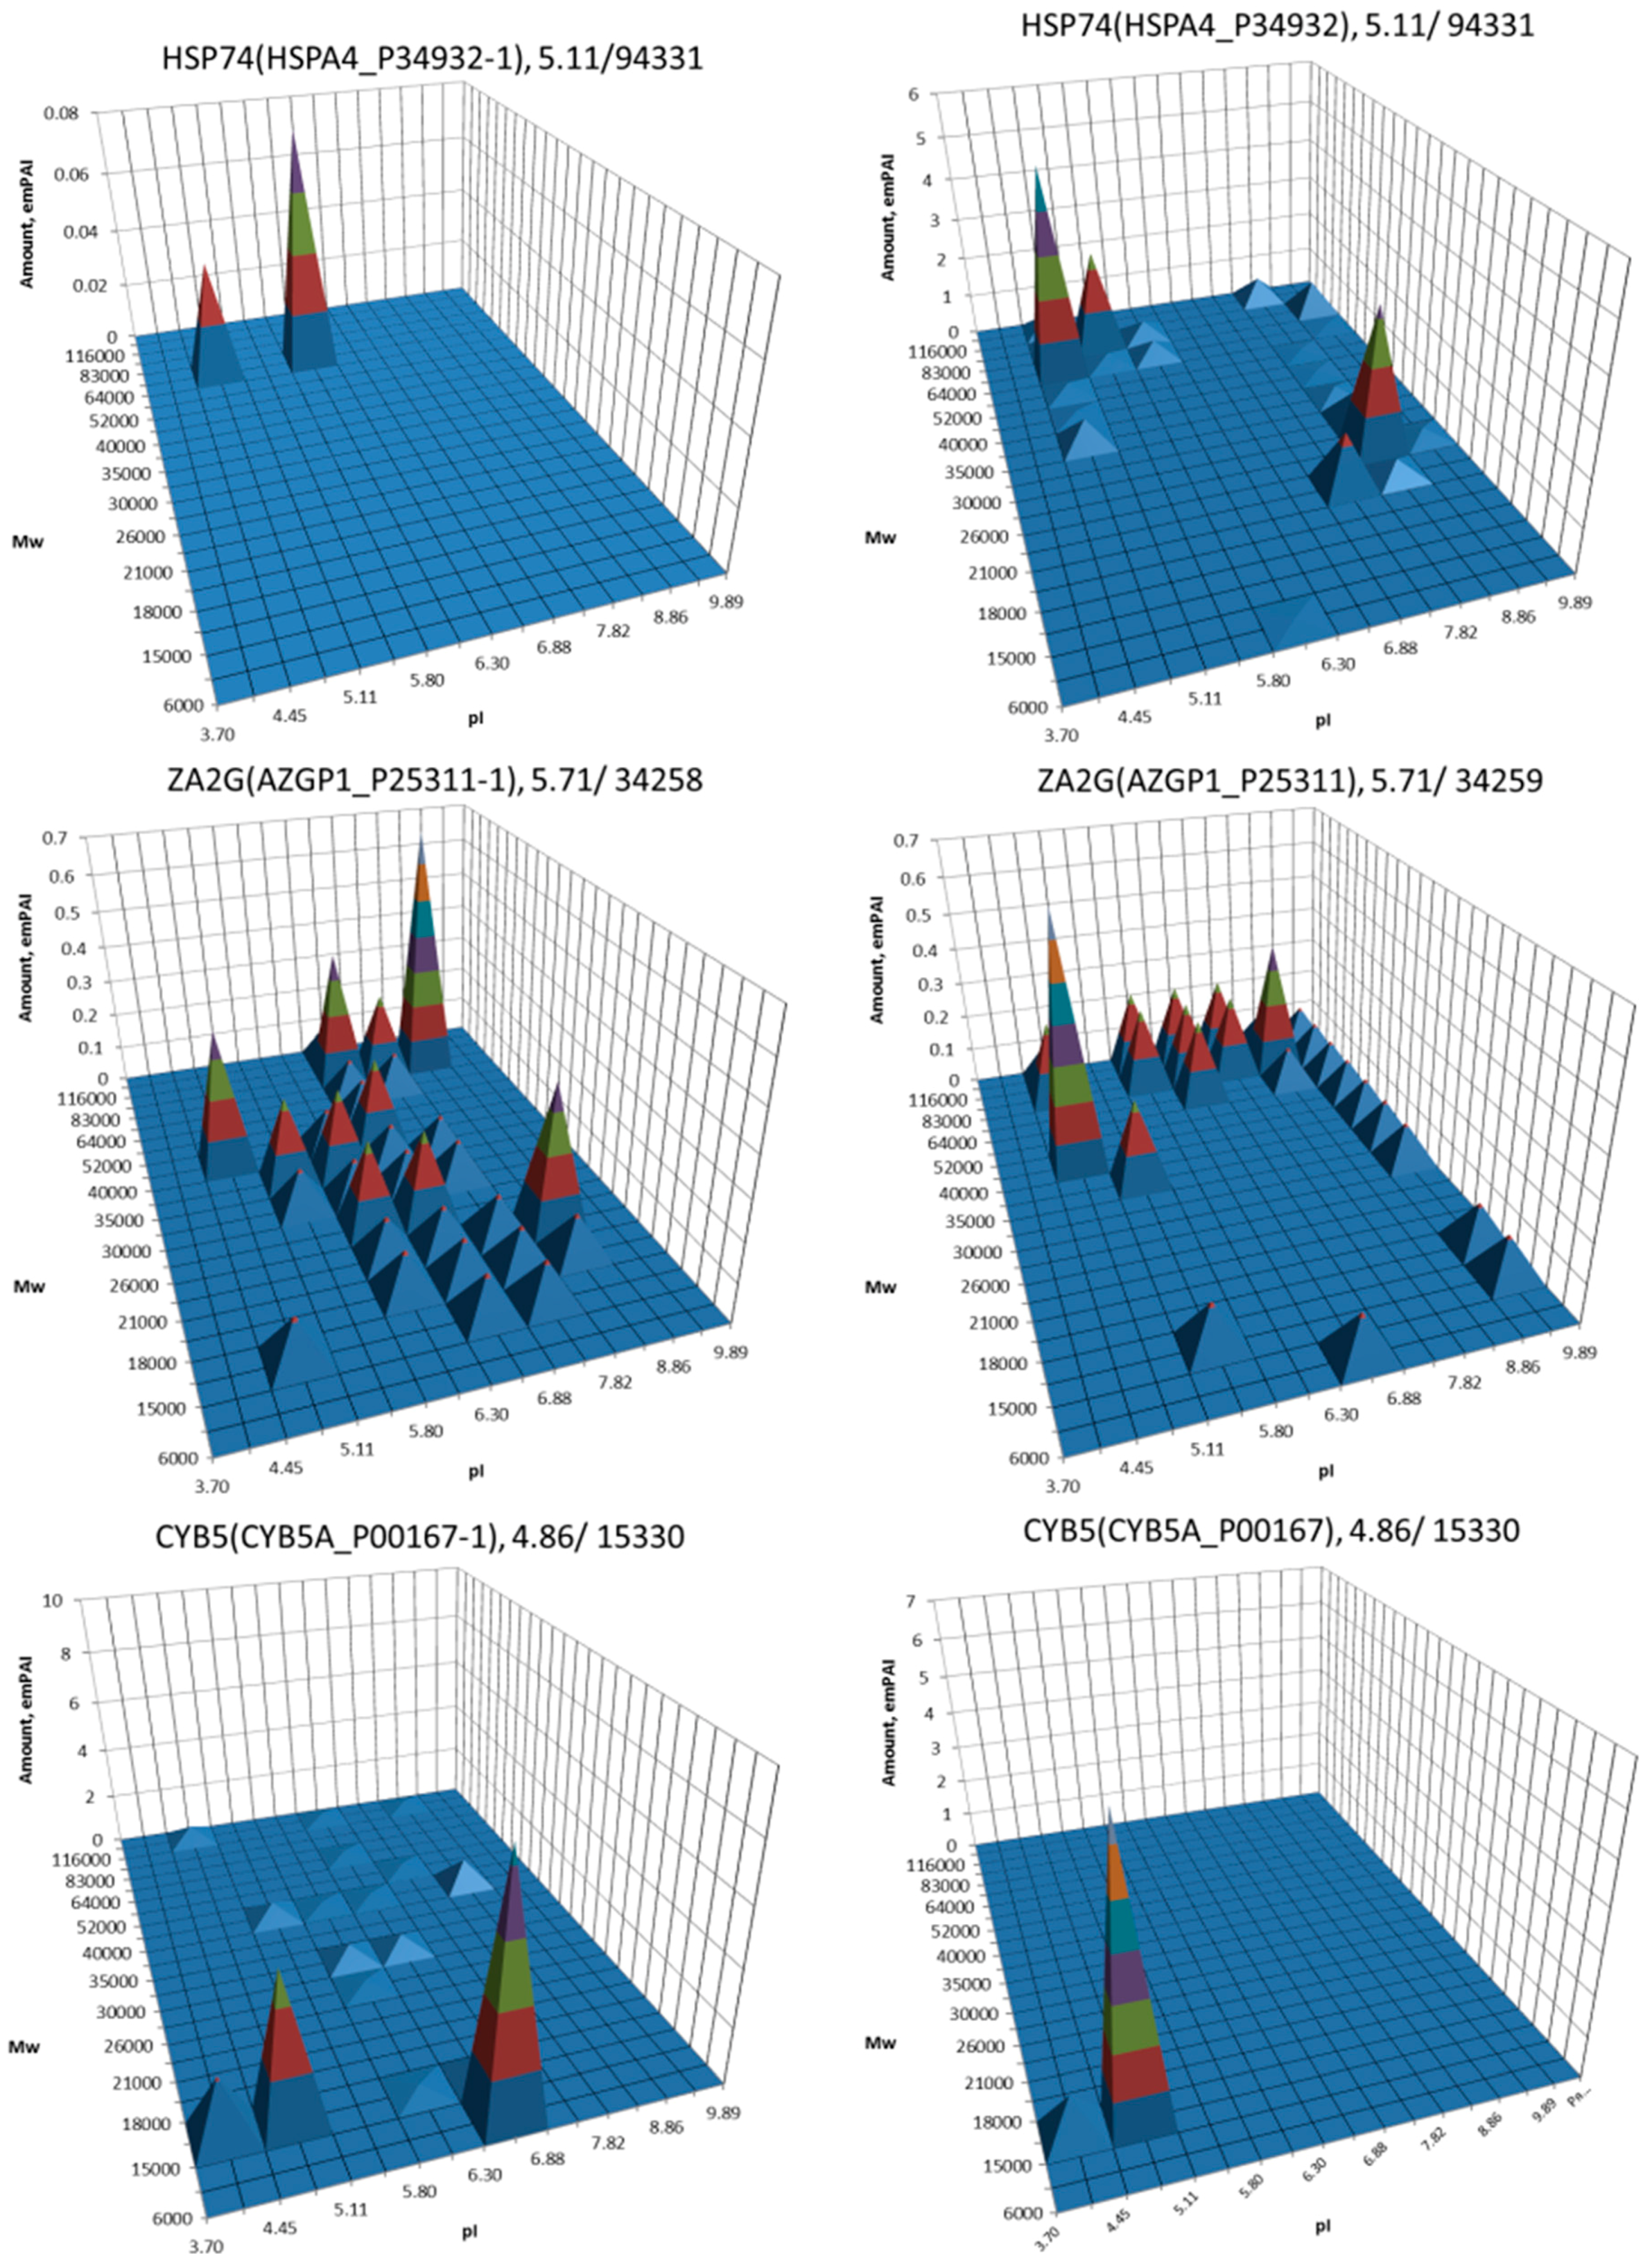
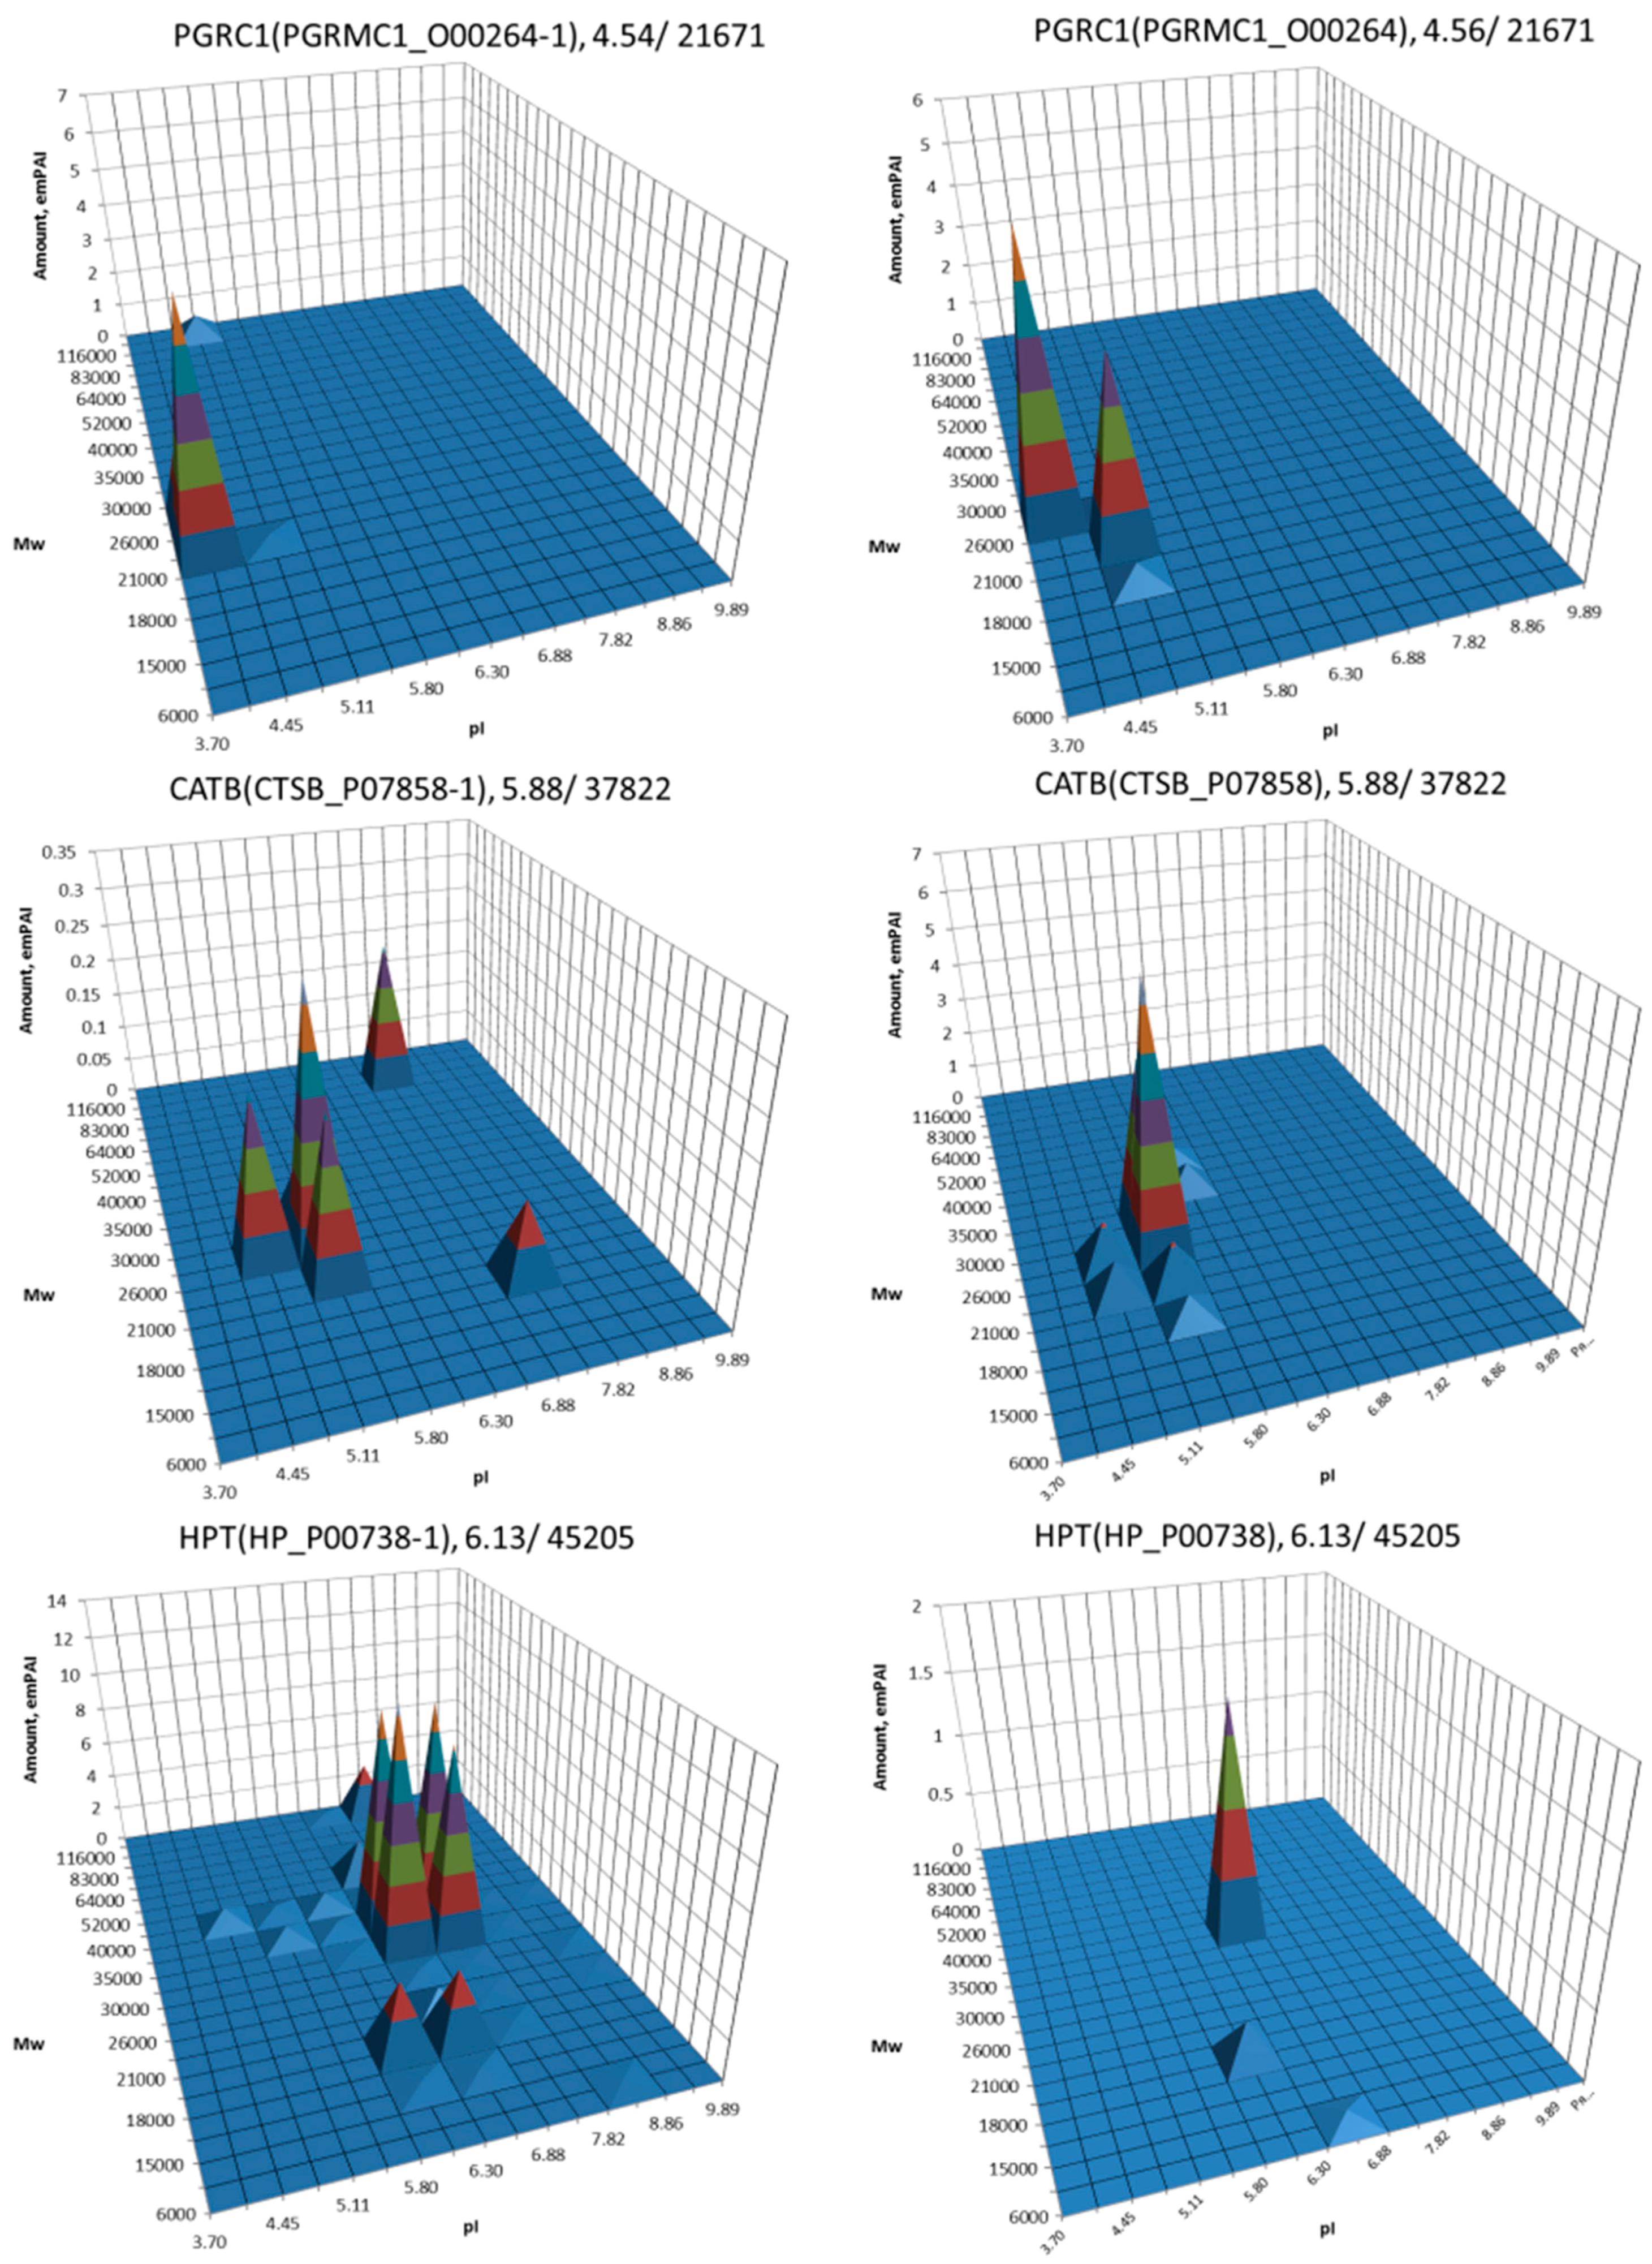
| No. | Gene | UniProt | Protein Name | Reference |
|---|---|---|---|---|
| 1 | AFP | P02771 | Alpha-fetoprotein | [10,11,27,28,29,30,31,32,33] |
| 2 | GPC3 | P51654 | Glypican-3 | [10,11,33] |
| 3 | F2 | P00734 | Prothrombin | [10,11] |
| 4 | SPP1 | P10451 | Osteopontin | [28,34] |
| 5 | HSPB1 | P04792 | Heat shock protein beta-1 | [11,33] |
| 6 | HSPA4 | P34932 | Heat shock 70 kDa protein 4 | [33] |
| 7 | FUCA2 | Q9BTY2 | Plasma alpha-l-fucosidase | [35] |
| 8 | SART3 | Q15020 | Squamous cell carcinoma antigen recognized by T-cells 3 | [36] |
| 9 | GOLM1 | Q8NBJ4 | Golgi membrane protein 1 | [37] |
| 10 | ANXA2 | P07355 | Annexin A2 | [27] |
| 11 | AZGP1 | P25311 | Zinc-alpha-2-glycoprotein | [33] |
| 12 | SRC | P12931 | Proto-oncogene tyrosine-protein kinase Src | [38] |
| 13 | SRPK1 | Q96SB4 | SRSF protein kinase 1 | [39] |
| 14 | FGG | P02679 | Fibrinogen gamma chain | [40] |
| 15 | PGRMC1 | O00264 | Membrane-associated progesterone receptor component 1 | [11] |
| 16 | CYB5A | P00167 | Cytochrome b5 | [11] |
| 17 | CTSB | P07858 | Cathepsin B | [11] |
| 18 | HP | P00738 | Haptoglobin | [11] |
| 19 | TK1 | P04183 | Thymidine kinase, cytosolic | [35] |
© 2017 by the authors. Licensee MDPI, Basel, Switzerland. This article is an open access article distributed under the terms and conditions of the Creative Commons Attribution (CC BY) license (http://creativecommons.org/licenses/by/4.0/).
Share and Cite
Naryzhny, S.; Zgoda, V.; Kopylov, A.; Petrenko, E.; Kleist, O.; Archakov, А. Variety and Dynamics of Proteoforms in the Human Proteome: Aspects of Markers for Hepatocellular Carcinoma. Proteomes 2017, 5, 33. https://doi.org/10.3390/proteomes5040033
Naryzhny S, Zgoda V, Kopylov A, Petrenko E, Kleist O, Archakov А. Variety and Dynamics of Proteoforms in the Human Proteome: Aspects of Markers for Hepatocellular Carcinoma. Proteomes. 2017; 5(4):33. https://doi.org/10.3390/proteomes5040033
Chicago/Turabian StyleNaryzhny, Stanislav, Victor Zgoda, Artur Kopylov, Elena Petrenko, Olga Kleist, and Аlexander Archakov. 2017. "Variety and Dynamics of Proteoforms in the Human Proteome: Aspects of Markers for Hepatocellular Carcinoma" Proteomes 5, no. 4: 33. https://doi.org/10.3390/proteomes5040033
APA StyleNaryzhny, S., Zgoda, V., Kopylov, A., Petrenko, E., Kleist, O., & Archakov, А. (2017). Variety and Dynamics of Proteoforms in the Human Proteome: Aspects of Markers for Hepatocellular Carcinoma. Proteomes, 5(4), 33. https://doi.org/10.3390/proteomes5040033


