1. Introduction
When President Obama publicly announced the Computer Science for All initiative in January 2016 [
1], it consolidated a growing movement within the computing education community in the United States (U.S.) to bring computing into schools prior to university [
2]. Since that time, there has been a growth in the number of states in the U.S. adopting standards for computing education in primary and secondary (K–12) schools, with all but six states having adopted some sort of computing policy or standards as of the
2018 State of Computer Science Education report compiled by Code.org [
3]. Organizations such as the Computer Science Teachers Association (CSTA) and ISTE have released standards for learning not just about technology, but about computing and computational thinking at the K–12 level [
4,
5]. This effort is not localized to the U.S., and there are examples of organizations and standards in other parts of the world that mirror these efforts [
6,
7,
8].
However, prior to and even when standards are approved and adopted, there is a wide variety of ways in which the content is being delivered, including activities both within and outside the classroom [
9,
10,
11,
12]. It remains unclear from the computing education literature what the most effective practices are for engaging students with this material as well as the long-term effectiveness of these activities, particularly with regard to claims of fostering student interest in the discipline [
13,
14]. With increasing effort, time, money, and resources being invested in pre-college computing education, being able to determine empirically the best interventions for a specific target demographic or environment can be valuable to the community.
Further, credible research and findings rely on two important indicators—replication and generalizability. Replication is needed in order to determine whether the results of a study are robust or whether they were merely an anomaly [
15]. Due to the newness of computing education, replication studies in educational research are still lacking and the data that are reported are incomplete [
14,
16,
17]. However, other STEM education fields (e.g., chemistry, medicine, and psychology) have similar issues with lack of replication [
18,
19,
20]. This limits how confident researchers can be about the results of educational research studies, with the U.S. National Science Foundation recognizing this and publishing Companion Guidelines for Replication and Reproducibility in Education Research in November 2018 [
21]. In it, there is a call for more transparency in research, open data access policies, and full documentation of the features of the study, including population, context, and fidelity of implementation. Interventions and populations need to be reported in a consistent manner to allow for better comparison amongst the findings and allow for better replication of the studies, providing researchers with the critical empirical evidence needed to identify best practices among various demographic groups of learners.
Unlike computing, most of the other STEM fields, including their many subdisciplines, have a long-standing and strong presence in the formal pre-college curriculum. While computing is just starting to become part of state standards of education, other disciplines have been part of the standards for decades. Based on previous research showing a deficiency of reporting on many important variables in computing education and the need to report elements of a study design adequately for replication, the researchers considered whether more established STEM fields reported data from pre-college educational activities more holistically in educational research and whether insight could be gained from the reporting of data in these fields [
13,
14,
16]. Therefore, the following research questions guide this part of the work:
[R1] What type of longitudinal and sequential data collection techniques have been used in the formal, peer-reviewed research that has been conducted on pre-college computing activities for the years 2014–2016?
[R2] What type of longitudinal and sequential data collection techniques have been used in the formal, peer-reviewed research that has been conducted on STEM activities for the years 2014–2016?
[R3] What are the similarities and differences between the reporting of pre-college computing activities and other STEM disciplines?
This work is important for K–12 education researchers in computing, K–12 education researchers in STEM fields, K–12 education evaluators, and other stakeholders invested in improving computing education as the K–12 community starts teaching computing to a wide variety of students. It is also important in identifying best practices and is, therefore, impactful on the work being performed by curriculum designers to bring computing into K–12 classrooms. Other stakeholders are institutions such as the U.S. National Science Foundation, Department of Education, and other policymakers who are recognizing the need for more replication of education research to increase the confidence of research findings that inform best practices.
The remainder of this paper is organized as follows.
Section 2 discusses the framework and steps undertaken to conduct the systematic literature reviews.
Section 3 describes the study results, including demographic information as well as data reported on the activities.
Section 4 is a discussion of these results put into the context of previous research.
Section 5 provides a high-level overview and its potential impact on future work.
2. Materials and Methods
To answer the research questions, the researchers undertook a systematic literature review following the framework developed by Khan, Kunz, Kleijnen, and Antes [
22]. The framework has five foundational steps: frame the question, identify relevant work, assess the quality of the studies, summarize the evidence, and interpret the findings.
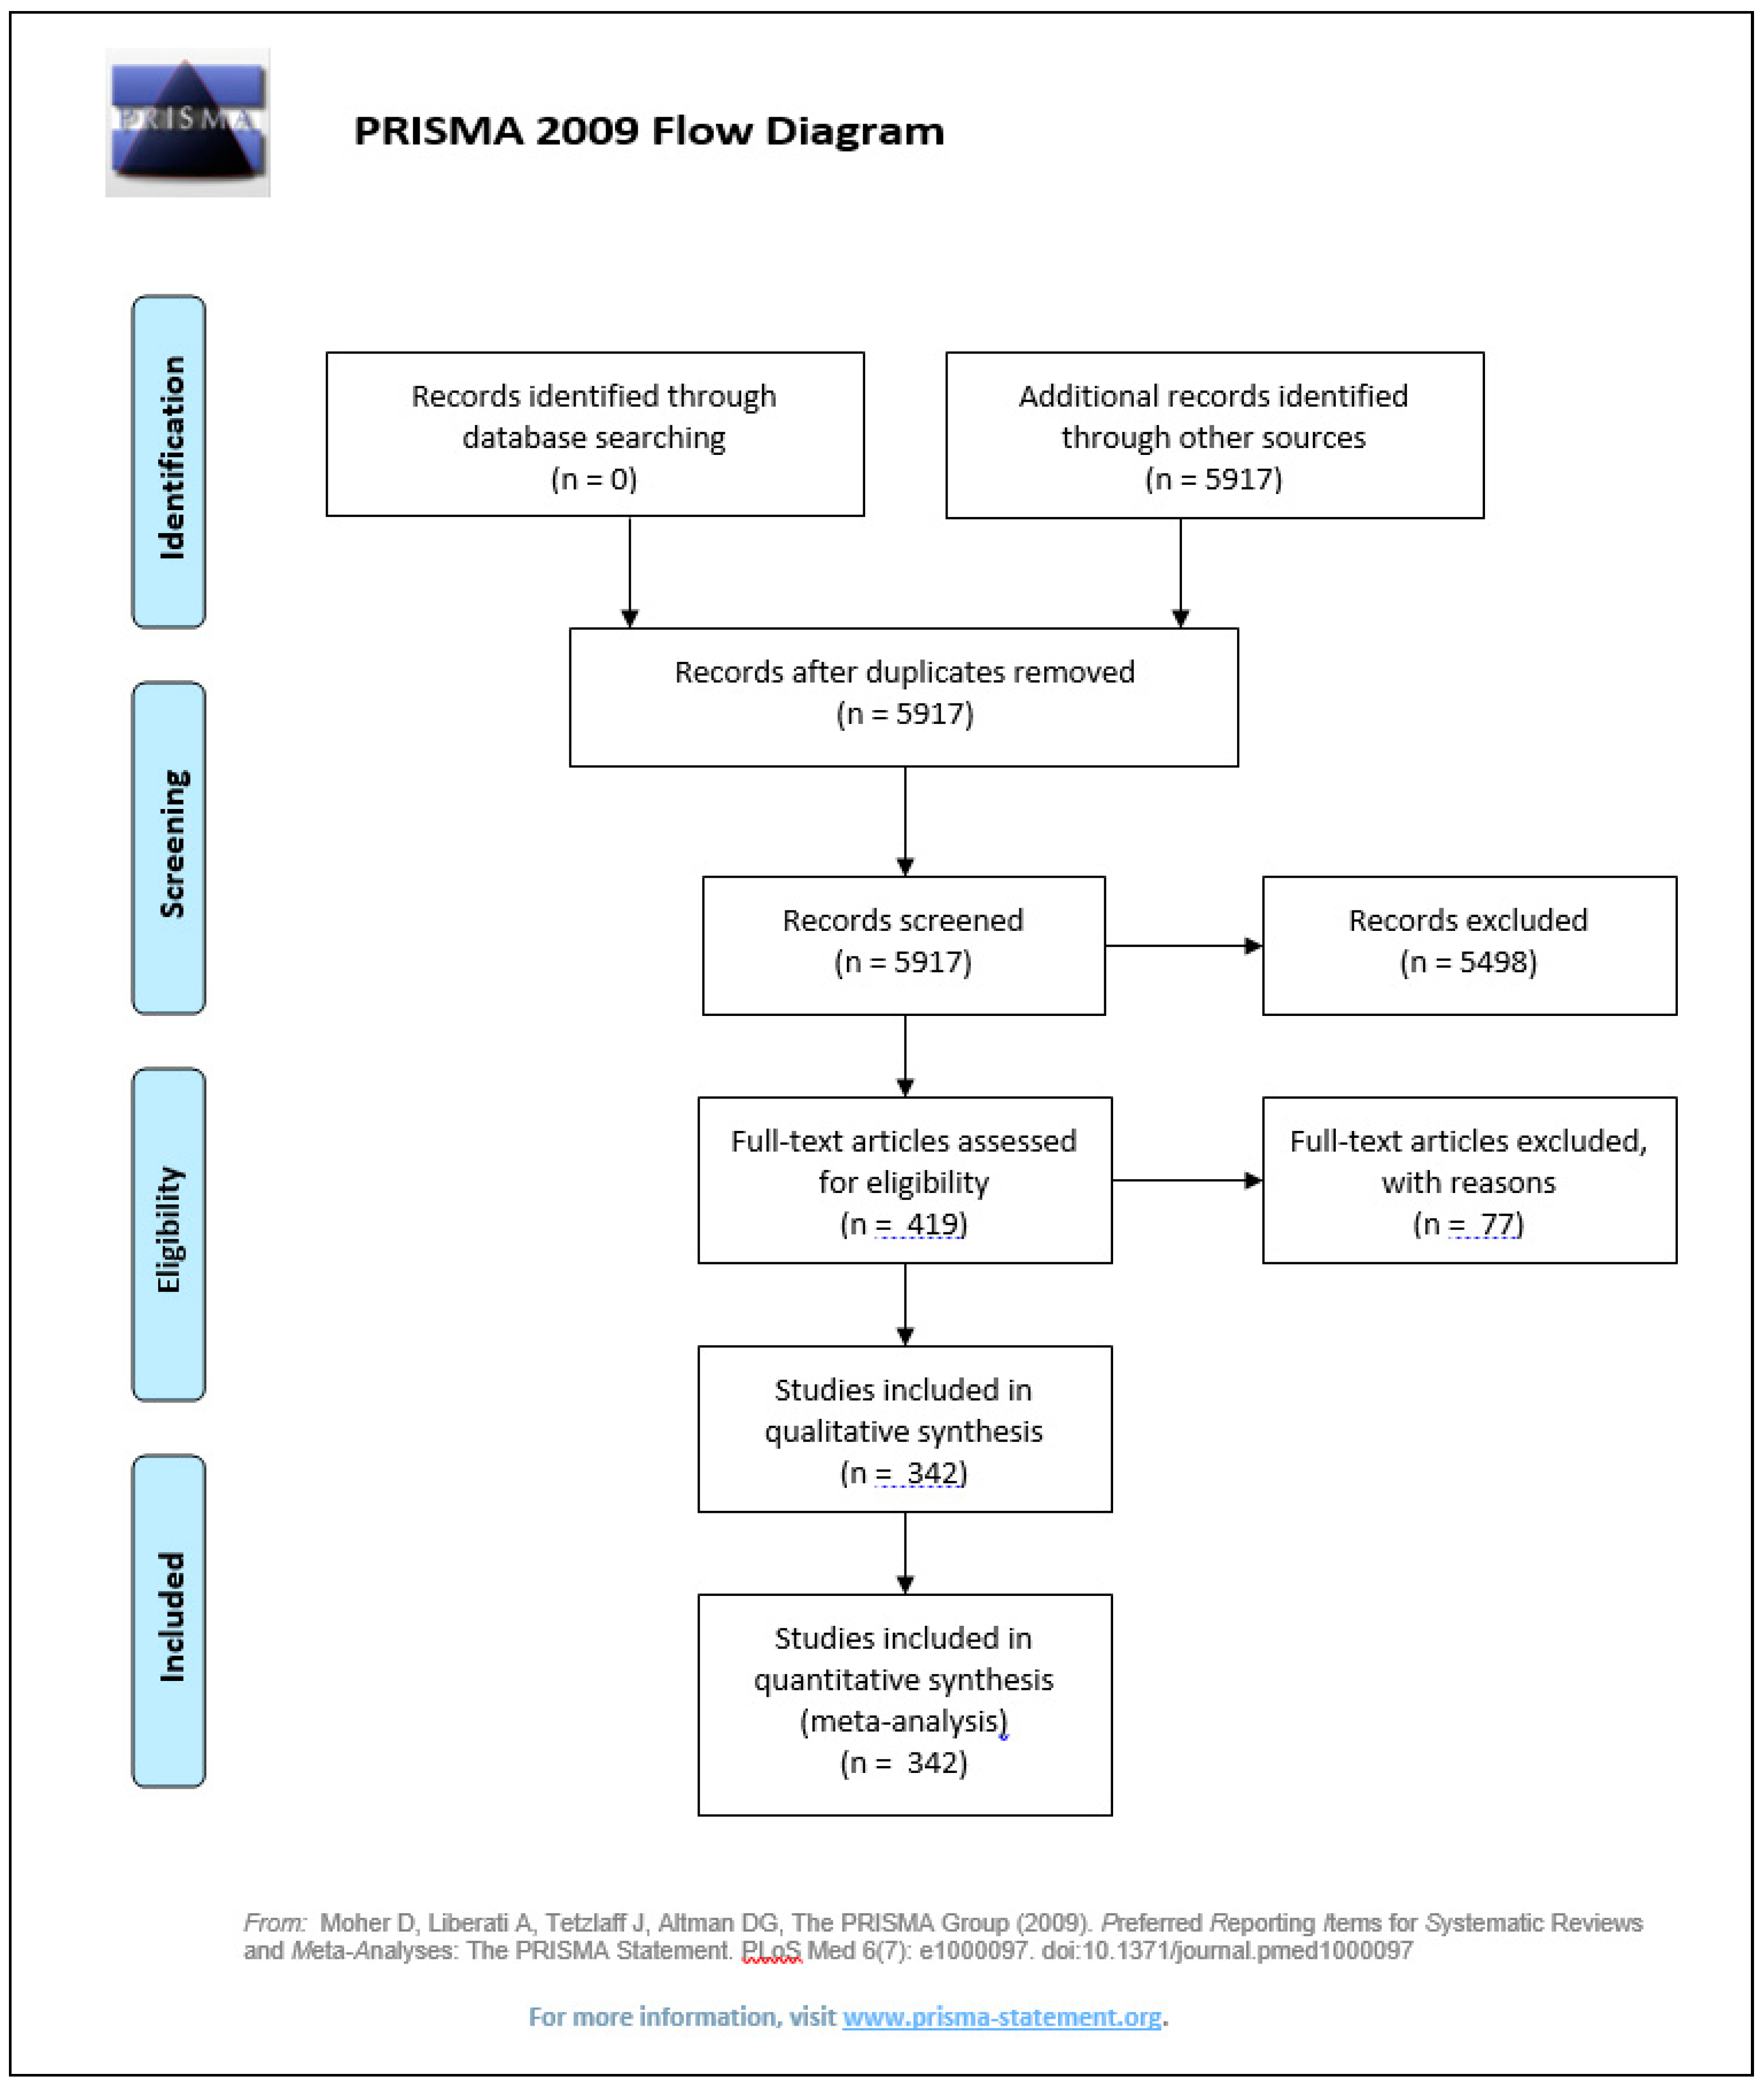
Although there was not a protocol pre-registered for this study,
Figure 1 shows the Preferred Reporting Items for Systematic Reviews and Meta-Analyses (PRISMA) 2009 flow diagram of the process. It is referenced throughout the discussion of the methods when describing how the initial set of 5917 articles was reduced to 342 articles for inclusion in this study via the five steps of the systematic literature review.
2.1. Framing the Question
While the research questions guide this work overall, it is important to further define some of the aspects of this work and the guiding principles for determining what type of educational activity qualifies for this analysis. For this analysis, only activities that are created and administered outside of the formal in-class curriculum are considered. For purposes of this work, the formal in-class curriculum refers to curricula that fulfill state/national education requirements and/or content that is offered as part of a school’s required or elective course or module. Some examples of the types of activities that are not part of the formal in-class curriculum include outreach activities, summer camps, and after school programs. Also, since the research questions are looking for data collection techniques and reporting, the articles must provide the data collected and the analysis or evaluation of the educational activity.
To summarize, the following criteria was used for inclusion:
Computing or STEM activity
Designed for K–12 participants (students or teachers)
Designed to teach computing, computational thinking, STEM concepts
Outside of standardized curriculum or courses
Provides information about participants, data collected, assessment and/or evaluation
2.2. Identifying Relevant Work
This section, explains how the sources were identified for both computing and STEM research venues for this study as well as how the articles were subsequently identified within these venues.
2.2.1. Venue Identification Procedures
Since there were two sets of data collected, one on computing activities and one on STEM activities, this methodology for identifying relevant educational research is presented in separate sections.
Computing Education
In the academic discipline of computing (or computer science), publishing in journals is not as common as publishing in conference proceedings. The Association for Computing Machinery (ACM) and Institute of Electrical and Electronics Engineers (IEEE) are the premier international associations for publishing computing education research. Both sponsor conference and journal publications that are considered the most reliable sources for formal, blind, peer-reviewed computing education research. Also included in the set of sources are any additional venues (conferences or journals) from outside of those two organizations that are recognized within the computing education community as presenting relevant and high-quality work.
Table 1 shows the final list of venues for inclusion in this literature review.
Closely Related STEM Disciplines
In order to identify relevant work in closely related STEM areas, a working definition of STEM is needed. In
Science, Technology, Engineering, and Mathematics (STEM) Education: A Primer STEM is defined as “Some federal agencies, such as the NSF, use a broader definition of STEM that includes psychology and the social sciences (e.g., political science, economics) as well as the so-called core sciences and engineering (e.g., physics, chemistry, mathematics). Others, including the Department of Homeland Security (DHS), U.S. Immigration and Customs Enforcement (ICE), use a narrower definition that generally excludes social sciences and focuses on mathematics, chemistry, physics, computer and information sciences, and engineering. Some analysts argue that field-specific definitions such as these are too static and that definitions of STEM should focus on “an assemblage of practices and processes that transcend disciplinary lines and from which knowledge and learning of a particular kind emerges.” [
23] (p. 2)
Further analysis led to an article by Freeman et al. [
24] which indicates that in their literature review “We used four approaches (35) to find articles for consideration: hand-searching every issue in 55 STEM education journals from June 1, 1998 to January 1, 2010 … searching seven online databases using an array of terms, mining reviews and bibliographies (SI Materials and Methods), and “snowballing” from references in articles admitted to the study (SI Materials and Methods).” (p. 8414). The researchers chose to adopt the 55 journals listed in Table S3 of [
24], which mirrored the process undertaken to define computing venues. Of these 55 journals, journals that focused on undergraduate education as noted by its title, aim, and/or scope were removed (
Journal of Undergraduate Neuroscience Education, Research in Collegiate Mathematics Education, Chemistry Education: Research and Practice (UnivChemEdu), Journal of College Science Teaching, Active Learning in Higher Education, Advances in Engineering Education, Chemical Engineering Education, International Journal of Electrical Engineering Education, International Journal of Mechanical Engineering Education, American Journal of Physics).
Then, journals that focused on computing education and/or were already evaluated were removed: ACM SIGCSE Bulletin, Computer Science Education, and Journal of Educational Computing Research.
Next, the description of each journal along with the titles and abstracts of the articles in the most current issue were evaluated. If these appeared to be focused on post-secondary education, they were then removed from the list (Advances in Physiology Education, Bioscience, Journal of Food Science Education, Journal of Microbiology and Biology Education, International Journal of Engineering Education).
Additional journals were removed due to the lack of a focus on education (BioScience (only one education related article in Jan–April 2017)), no articles during the 2014–2016 time period (Chemical Education International, Engineering Science and Education Journal, Mathematics Education Review, Astronomy Education Review), or for being solely curriculum and activity focused (with no assessment/evaluations or data about the activity provided) (Physics Education).
After these journals were removed, 31 journals remained. The size of this set was three times the size of the set of computing venues. To create a set of venues of similar size to the number of computing venues, sampling was needed. Looking at the number of venues for each subdiscipline for those that were over-represented, a systematic sampling technique, where every
nth sample from a list is included was used [
25].
The first aim of the sampling was to create an almost equivalent number of venues focused on each of the subdisciplines of STEM to not have one subdiscipline dominate the results. Chemistry, Geology, and Psychology each had one venue. Engineering had two venues that encompassed all of the subdisciplines of engineering, which the researchers considered to be an appropriate number in relation to the others. Biology had three venues, which were also deemed an acceptable number. Physics had four venues, which would cause it to be the largest sample in the sciences. To bring this number in alignment with Biology, one venue needed to be removed. A random number generator was used to determine which of the venues (1–4) should be eliminated. The number three was chosen and the third venue was eliminated.
For Mathematics, there were ten venues. A systematic sampling of every other would yield five venues which may have over-skewed the sample to mathematics education. A systematic sampling of every third would yield four venues. While this is higher than the other subdisciplines, mathematics is taught more broadly than the specific sciences in the pre-college curriculum and this was deemed acceptable by the researchers for the sample. There were also ten General STEM venues and a systematic sampling of every other venue would yield five venues. Since these were general STEM venues encompassing any part of STEM, five seemed reasonable. This systematic sampling yielded 19 venues, which was still almost double the amount of computing venues, but seemed to accurately represent the subdisciplines of STEM. The included and excluded venues are shown in
Table 2.
Additionally, some of the venues that were identified for computing education also had articles relating to general STEM education and in the review process, articles from those venues were also included in the STEM set of articles as they were found. Additional STEM articles were found in IEEE EDUCON, IEEE FIE, IEEE TOE, and JECR.
2.2.2. Article Identification Procedures
The next step in the process was to determine which articles in each publication should be included in the literature review. To do this, a manual reading of each abstract was conducted to determine whether the content of the studies reflected in each article contained the following characteristics:
Designed for K–12 participants or teachers
STEM/Computing educational activity or process
Outside of standardized curriculum or courses
Provided information about participants, data collected, assessment and/or evaluation
Categorized as computing if designed to teach exclusively computer science or computational thinking
Categorized as STEM if designed to teach one or more categories in STEM other than computing
Because the process of reading each abstract does not rely on search terms or automation, the search has been limited to a range of three full calendar years, 2014–2016, which encompass the reporting of activities just prior to the announcement of major U.S. government funding for pre-college computing education. For the venues in that time, there were 2566 computing articles and 3351 STEM articles published, resulting in 5917 articles (as shown in the PRISMA chart in
Figure 1). A spreadsheet was created so that each row of the spreadsheet represented an article published in each of the venues for the years 2014–2016 inclusive. For each article, relevant bibliographic information was captured (e.g., title, author, venue, page numbers) including a hyperlink to the article for viewing. Most importantly, the article abstract was captured for each article as a key part of the first phase of this analysis.
The inclusion of an article for the final thorough review was a two-phase process. The first phase involved two independent coders reading each abstract and coding the article as relevant or not to the review. Relevance was determined by each coder by rating the information in the abstract against the criterion above. After the two coders independently coded the article abstracts, their results were compared and discrepancies were resolved through discussion. Inter-rater reliability on the coding of the abstracts for computing articles was 96.5% and for STEM articles was 96.4%. At this point, all identified articles (419) were moved onto the next stage of the process. The reading of the abstracts (or screening as indicated in
Figure 1) eliminated 5,498 articles.
2.3. Data Collection Process
The next stage involved a careful read of the 419 included articles to extract data for the previously identified program elements. The process that determined the program elements is described more fully in [
16]; to summarize, a random subset of 10 articles were read and notes were created about the types of information the articles reported about the research studies. After the initial set of articles were read, a set of 13 article/study characteristics and 24 program elements were created that represented the type of information that was being reported by the studies.
Table 3 gives the list of article/study characteristics while
Table 4 gives a listing of the program elements.
As the researchers progressed through the reading of each of the candidate articles, 29 computing articles and 48 STEM articles were removed from further analysis because upon reading the articles, they did not provide any formal evaluation or data about the intervention described. The articles may have fulfilled many or all of the other criteria (pre-college and outside formal curriculum), but did not present evidence of assessment or efficacy. These articles simply described the educational process or intervention.
After these articles were removed, 199 computing articles and 143 STEM articles were analyzed and the program elements were recorded. Both reserachers participated in the coding process. For the computing articles, a two-level review system was adopted. An initial coder categorized the elements from the articles listed in
Table 3 and
Table 4, and a second coder verified those categorizations. Roles were reversed frequently and discrepancies were discussed throughout the process. It is important to note that every attempt was made to capture the information as the authors published it and to not infer or interpret the information given in the articles. For this review, investigators or article authors were not contacted to provide missing information. The data for the STEM articles were coded by one of the researchers based on experience of coding the data in the computing articles. The coded data for the computing articles are housed on
https://csedresearch.org [
26]. The coded data for STEM articles are available from the authors upon request.
2.4. Synthesis of Results, Study Bias, Limitations
For this review, only descriptive statistics were calculated and reported. Counts and percentages of the data recorded are reported, but no further analysis of the data was conducted. Issues of bias of individual studies were not considered by this review. No codes were assigned to articles about the discussion of limitations or bias of the intervention and/or evaluation. However, it is recognized that this may be an interesting factor to look at in the future.
In terms of the aggregate bias for the entire study, there is a selection bias present in terms of the venues that have been chosen. For the computing venues, the set of venues was determined based on researcher experience as active members in this research community, previously published literature reviews in computing education on this topic, and information gathered from a focus group [
13,
14,
27]. There may be other venues publishing computing education research that would be relevant to this search.
For the STEM venues, it is outside the researchers’ domain of expertise and, thus, the search began using another literature review published in a highly respected venue (Proceedings of the National Academy of Science) to guide the identification of appropriate venues [
24]. From there, the venues were narrowed down to those focused in the pre-college domain and then a systematic sampling was conducted to create a more even distribution of the STEM disciplines. This process may have introduced bias into the sample. However, no additional venues were included in the set as the reserachers did not feel they had the expertise to judge the quality of the venue in the STEM domain. There may be other venues that publish STEM education-related articles that could be considered in this literature review. One example that was brought up during the review process was the American Society of Engineering Education (ASEE) which has an associated conference about topics in engineering education. There may be other additional venues not considered on the STEM side.
In terms of other larger systemic bias of the sample studied and the overall analysis, care was taken to report the data collected based on what the authors of the articles reported. Success of interventions was not considered, but rather whether or not the authors reported certain information about their study and participants. Thus, it is believed that the risk of bias in the recording of the data was low. There was no coding for impact on the academic achievement of the participants of the studies.
3. Results
This section will present the results of the analyses of the comparison of the data extracted from the articles considered. This corresponds to step 4, Summarize the Results, of the Khan, et al., framework [
22] that is being followed for this systematic literature review.
3.1. Report Type
Table 5 shows the report type for each article analyzed. Articles were coded as research, experience report, or literature review. An experience report is a common format in computing education conferences and contains information about an educational intervention and reports about its success or failure, but does not report the results of an actual research study. For computing articles, there is almost an even split between the number of articles that qualify as experience reports versus those that qualify as pure research. However, STEM articles are dominated by research reports. This is most likely due to the nature of the venues for the two categories of articles. For computing education conferences, experience reports are considered valuable and important, and are encouraged, accepted and presented at a similar rate as research articles. Journals in computing education tend to be focused on research articles. Because there was a mix of conference and journal venues, there is almost an even split of those types. For the STEM disciplines, however, the percentage is heavily skewed with journal venues which again accept and publish mostly research articles.
3.2. Study Characteristics
In this section, the characteristics of the studies described within the articles are reported upon. Information about the basic study design, research approach, research questions, duration of the study, types of comparative analyses, and evaluation are presented in the subsections.
3.2.1. What Is Being Studied
The type of educational intervention being studied is broken up into four main categories: activity, curriculum, evaluation instruments, and professional development. Professional development is any intervention designed specifically for teachers, either in-service or pre-service, generally for the purposes of training. Articles that report on the design and validation of evaluation instruments related to pre-college interventions are given the code evaluation instruments. The code curriculum is for those articles that discuss either the impact of the implementation of national curriculum or state curriculum standards; or localized curriculum efforts that span more than one activity, lesson, or unit. All other articles are coded as activity.
Table 6 gives a breakdown of each type of activity for computing and STEM articles. Literature reviews were not included in this analysis. The data show that for computing, the main focus of 85% of the articles is the activities and curriculum, almost evenly split. This is not the case for STEM that is 83% focused on activities.
3.2.2. Basic Study Design
Table 7 shows the categorized basic study design for each article. The studies described in each article were coded as cross-sectional, longitudinal, meta-study, retrospective, or not applicable. While it is not always the case that experience reports have a systematic study included in the article, many of them fall in line with the same study design characteristics as research articles. Some experience reports talk about a single intervention (cross-sectional), while others discuss an intervention over time and how it has evolved (longitudinal). Literature reviews were not included in this analysis. For some articles, it is not clear which of the two categories are being discussed and not applicable has been coded. When comparing computing to STEM, there is a similar pattern of distribution of the basic study design with cross-sectional making up a large majority of the studies. While the number of longitudinal studies found is similar between the groups, STEM has a slight lead when considered as a percentage of the whole.
3.2.3. Time Period for Longitudinal Studies
For each article that was coded as research and coded as longitudinal for its basic study design, the duration of the study as stated in the article was recorded. For the computing articles, the duration of the longitudinal study was reported in the range of one semester up to 10 years. The average duration of the longitudinal computing studies was computed to be two years. For STEM studies, the study duration was in the range of one year to 10 years and the average study duration was 3.36 years. The ranges for these two groups are arguably not different, but the average length of study is slightly higher for STEM studies.
3.2.4. Research Approach
For each article that was coded as research, the research approach was coded when described in the article. The codes used were quantitative, qualitative, mixed methods, or unspecified. The results of the coding are presented in
Table 8 and show that the computing articles are actually a majority of non-quantitative approaches with 29% using qualitative research techniques and 41% using a mixed methods approach. Only 27% of the computing articles describe studies that used strictly quantitative methods. For the STEM articles, it is the opposite with 50% using quantitative techniques and only 20% using a qualitative approach, with 29% using a mixed methods approach.
3.2.5. Research Questions
For each article that was coded as research, whether or not the article presented its research questions or research hypotheses was recorded. This was a binary coding and the results of the coding are presented in
Table 9 and show that computing articles present their research questions and/or hypotheses more often than the STEM articles and are reporting the research questions 80% of the time, compared to only 63% of the time for STEM articles.
Digging deeper into this data shows that for computing, those articles that did not report a research question were 20% qualitative studies, 30% quantitative studies, and 50% mixed methods studies. For STEM, articles that did not state research questions were 19% qualitative, 62% quantitative, and 19% mixed methods studies. Based on this analysis, there does not seem to be a pattern related to the type of research design and the reporting of research questions.
3.2.6. Analysis Based on Race, Gender, or Socioeconomic Status
For each article, three independent, binary codings were produced to answer the question of whether or not the article presented analyses based on differences in race, gender, and/or socioeconomic status. All articles were included in this analysis since many experience reports present either anecdotal data or observations about differences between these demographic groups. The results of the coding are presented in
Table 10 and show that the analysis of these demographics of participants is more common in the computing articles than in the STEM articles. Literature reviews were not included in this analysis.
Digging a little deeper, articles that did multiple analyses were examined (i.e., independent analysis on more than one of the categories). For STEM articles, only six articles did multiple analyses, but each of those articles only looked at two of the three demographic characteristics. For computing, 24 articles did analyses on two categories, and 10 articles looked at all three. The data show that interventions affecting those of a different gender, race/ethnicity, and/or socioeconomic status are a bigger part of the discussion in computing than in STEM.
3.2.7. Evaluation
For each research article, information about the evaluation methods and instruments was recorded. Appropriate evaluation is an area that has been explored by the researchers in the context of this same set of data and discussed in greater detail than presented here [
28,
29]. How and what was assessed across computing and STEM articles was compared.
The freeform text for what was measured was converted into a binary code for whether or not that information was stated in the article. For “how it was measured”, a yes was recorded if the article gave any information about measurement frequency, measurement type, or instrument used. Literature review articles were not in this part of the analysis, but all research and experience reports were included.
It was found that 182 out of 195 computing articles (93%) did specify in some way what the study intended to measure. Comparing research versus experience reports, 87 out of 97 experience reports (90%) specified what they intended to measure, and 96 out of 98 research reports (98%) made the same specification. It was found that 136 out of the 142 STEM articles (96%) specified what they intended to measure. Looking into the breakdown of research vs. experience reports shows that for experience reports, 13 out of 16 articles (81%) reported this information and 122 out of 126 research articles (97%) reported this information. Overall, the rates of reporting of this information are similar for computing and STEM.
For specifications for how it was measured, again, 182 out of 195 (93%) computing articles specified at least one of measurement frequency, measurement type, or instrument used for measurement. The breakdown for experience reports vs. research reports was the same as for the above paragraph on “what was measured”. It was found that 136 out of 142 STEM (96%) articles specified at least one of measurement frequency, measurement type, or instrument used for measurement. The breakdown for experience reports vs. research reports was that 14 out of 16 experience reports (88%) gave this information and 121 out of 126 research articles (96%) gave this information. So once again, computing and STEM articles are reporting this information at similar rates.
3.3. Study Participants
In this section, the results of the coding of information about the participants in the study as reported by the articles is presented. Information about number of participants, participants’ age, grade/level in school, gender, race and/or ethnicity, socioeconomic status, location, and disabilities are presented in the subsections.
3.3.1. Number of Study Participants
For each article, the number of participants as reported by the authors was recorded. Literature reviews are excluded from this analysis. For research articles, 27 computing articles (28%) and 13 STEM articles (10%) did not report the number of participants of the study. Therefore, the rate of non-report is almost three times as often for computing as STEM articles.
For experience reports, 39 computing articles (40%) and seven STEM articles (44%) did not report the number of participants in the educational interventions described. The rates of non-report are much higher in experience reports.
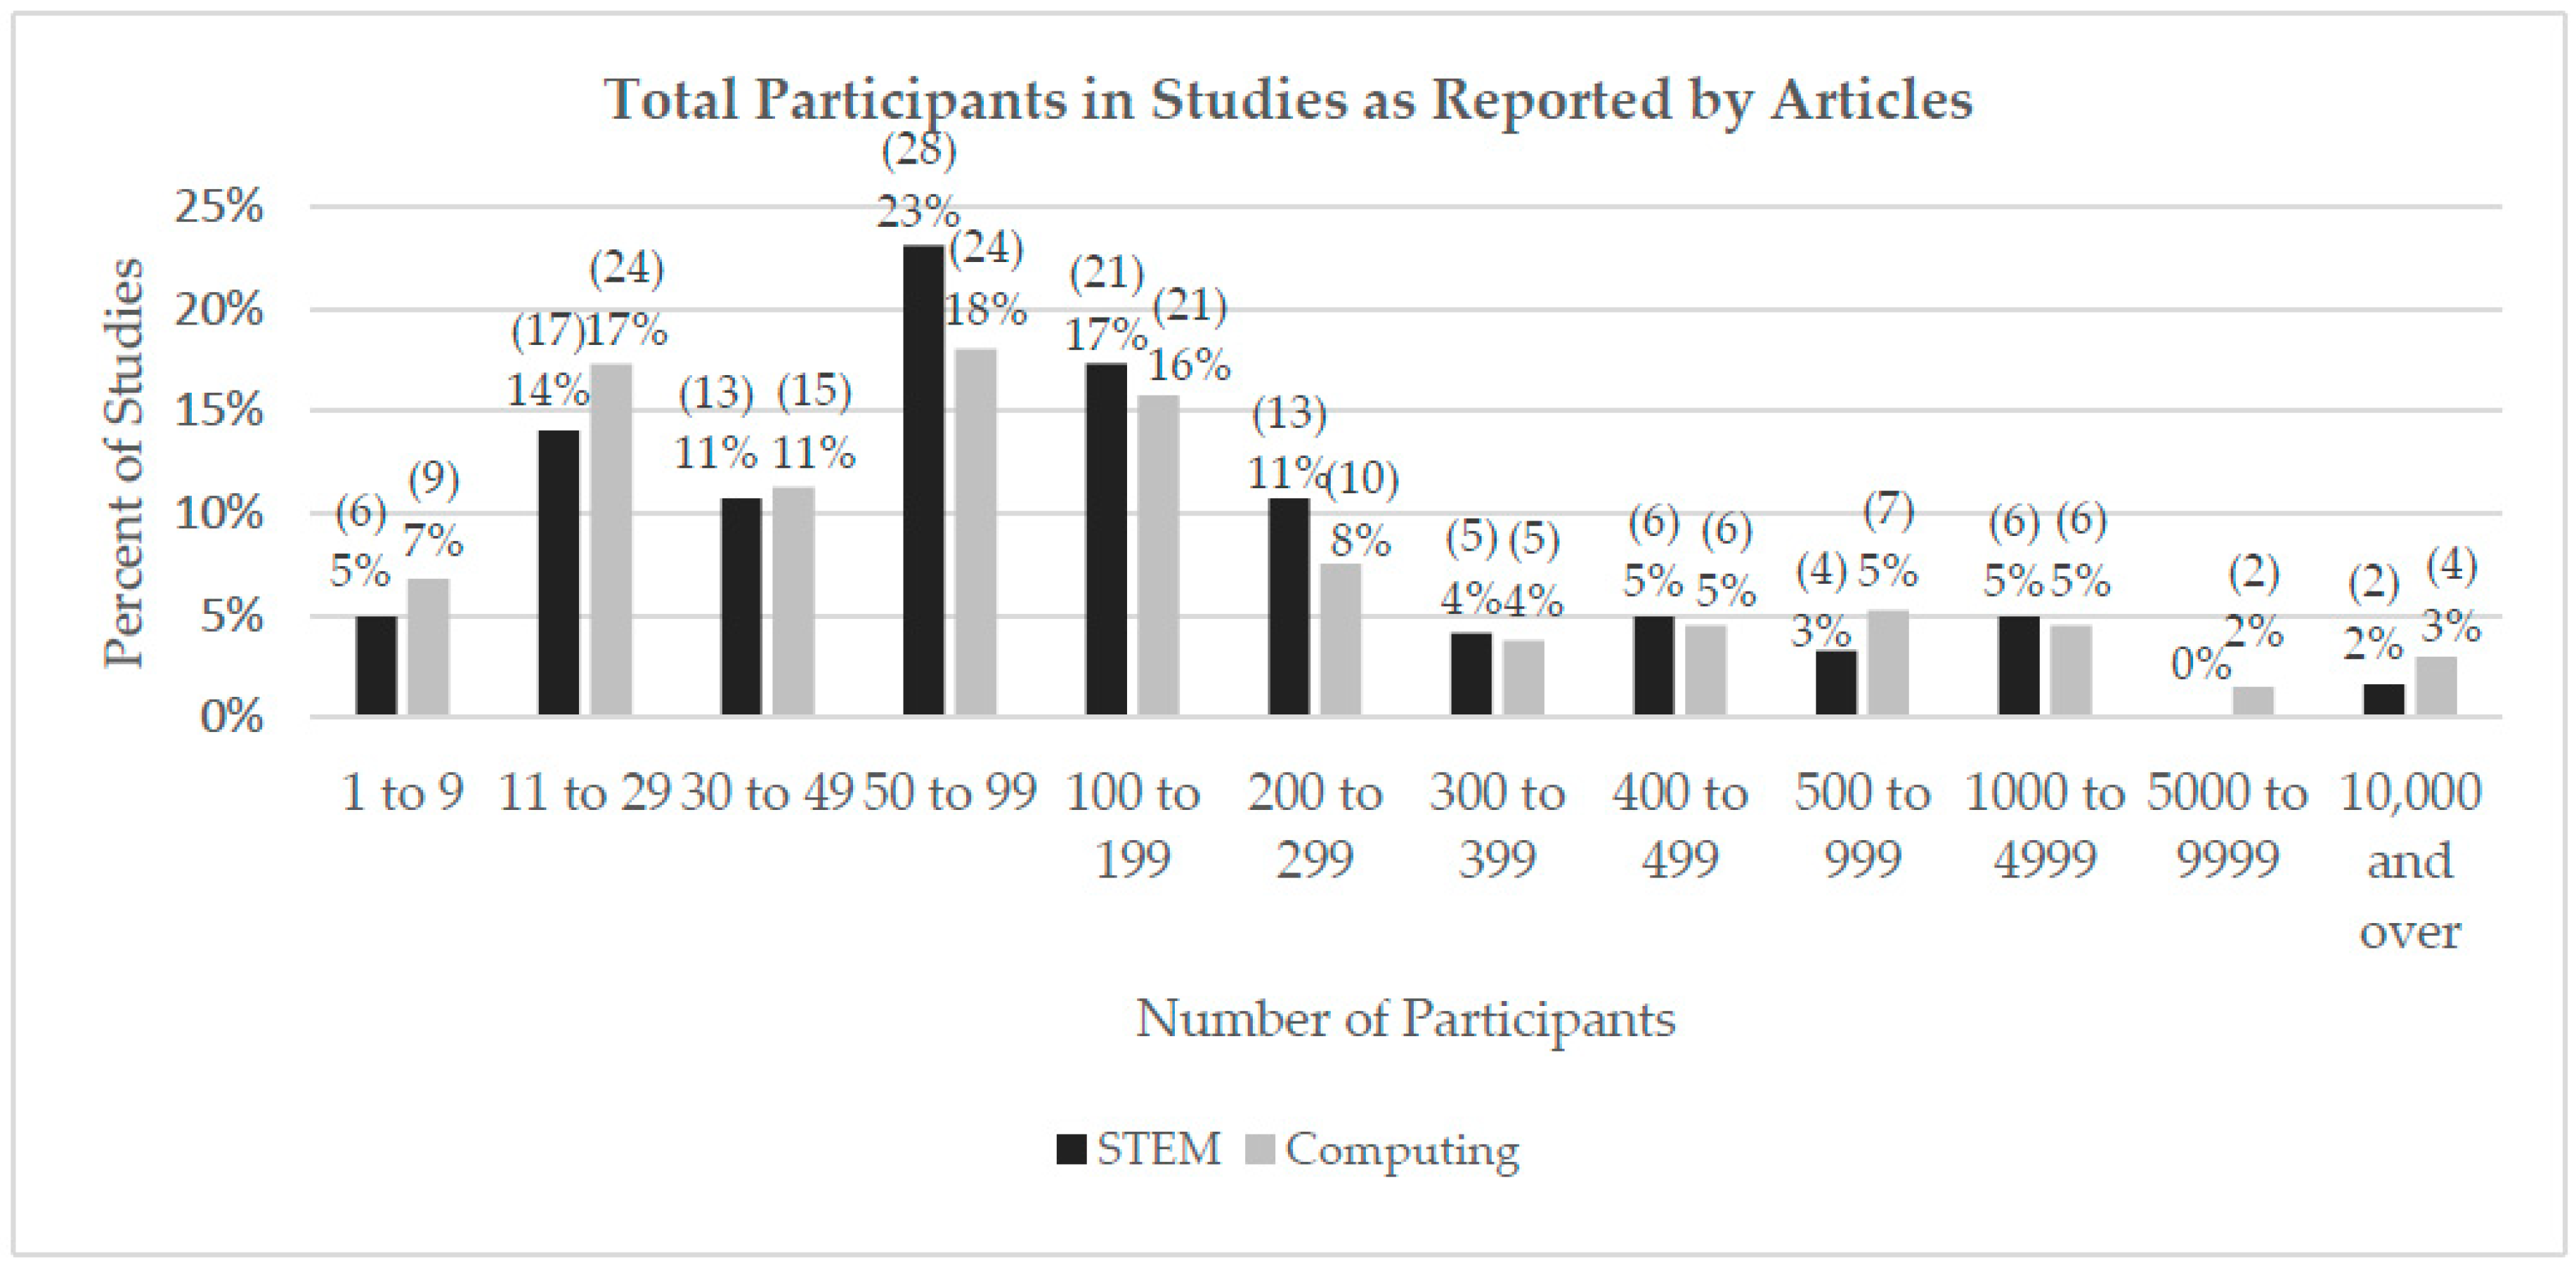
Figure 2 presents the data about the actual number of participants as a graph of the number of participants (in ranges) as a percentage of the overall. The numbers in parentheses are the actual number of articles to report the data. For this analysis, both research and experience reports were included. There is a great deal of similarity between the number of participants reported in studies in STEM articles and computing articles and the number of studies in each category reflects that. It is important to note that the ranges represented in the graph are not of equal size and reflect somewhat natural breaks and jumps in the number of participants.
3.3.2. Age and Year/Grade in School
The age as well as grade level of the study participants were recorded as reported by each article. For this analysis, research and experience reports were included, but those that were categorized as professional development were excluded.
The grade/year in school was converted to the U.S. system for purposes of reporting. Non-U.S. grade levels are recorded as listed by the authors; they were then converted to the U.S. system by looking up their equivalents using internet searches.
Table 11 shows the results of this coding for computing and STEM. The demographic most frequently reported was grade level, with 43% of computing articles and 62% of STEM articles reporting. The same percentage (22%) of computing and STEM articles reported both age and grade level.
However, the percentage of computing articles reporting neither piece of data is twice as high as the STEM articles. Of the computing articles that are reporting no information on age or grade level, only nine of the 30 are experience reports; so there are 21 research articles not reporting this information about the study participants. Only three out of 10 non-reporting STEM articles are experience reports; so even in STEM, seven research articles are not reporting this information.
Table 12 shows the number of articles reporting educational activities aimed at a specific grade level group. The data are grouped into common groupings for the U.S. system, Pre-K (before required formal schooling begins at age 5), K–4 (roughly ages 5 to 9 or 10), 5–8 (often called middle school, ages 10 or 11 to 13 or 14), and 9–12 (commonly called high school, ages 14 or 15 to 17 or 18). Articles could have been coded into more than one category if the study participants bridged the boundaries of these groups. At least one study reported participants from Pre-K to 12
th grade. For computing, the largest percentage of interventions is aimed at grades 5–8, followed closely by interventions for grades 9–12. However in STEM, the largest percentage of interventions target grades 9–12, followed by grades 5–8.
3.3.3. Gender
Information about the gender of the participants as reported by the authors was recorded. Looking only at research and experience reports that did not discuss professional development, in computing, 53% reported on the gender breakdown of the participants. For STEM, 49% reported on the gender breakdown of the participants.
Looking at research studies that reported results comparing gender, 30 out of 34 computing articles (88%) and 13 out of 14 STEM articles (93%) gave a detailed gender breakdown of the participants.
3.3.4. Race and/or Ethnicity
Information about the race/ethnicity of the participants as reported by the authors was recorded. Looking only at research and experience reports that did not discuss professional development, in computing, 25% reported on the race and/or ethnicity of participants. For STEM, 34% reported on the race and/or ethnicity breakdown of the participants.
Looking at research studies that reported results comparing race/ethnicity, 14 out of 17 computing articles (82%) and four out of five STEM articles (80%) gave a detailed race and/or ethnicity breakdown of the participants.
3.3.5. Socioeconomic Status
Information about the socioeconomic of the participants as reported by the authors was recorded. Looking only at research and experience reports that did not discuss professional development, in computing, 14% reported on the socioeconomic status of the participants. For STEM, 29% reported on the socioeconomic status of the participants.
Looking at research studies that reported results comparing socioeconomic status, four out of five computing articles (80%) and two out of three STEM articles (67%) gave a detailed breakdown of the socioeconomic status of the participants.
3.3.6. Disabilities
For each article, a binary code was produced as to whether or not the article mentions students with disabilities or accommodations for students with disabilities. It should be noted that these are, in fact, vastly different concerns, but for the purposes of this literature review, the lack of discussion of disability found in either set of articles did not seem to warrant further categorization. For computing, only two articles mention anything about the disability of the participants (1% of the research/experience articles that are not professional development). For STEM, five articles mention disability status (4% of the research/experience reports that are not professional development).
3.3.7. Participant Demographic reporting
3.4. Additional Study Information
In this section, the results of the coding of additional information about the study/intervention as reported by the articles is presented. As described in
Table 4, many different pieces of data about the instructors of the intervention and about the activity itself were recorded. The analysis for this section will focus on much of this data in aggregate. In particular, the focus is on the location of where the intervention/study took place, reporting about instructor demographics and reporting about activity demographics.
3.4.1. Location of Intervention/Activity
For each article, the location of the study was recorded when presented as part of the description of the study. The location of the intervention/activity was not assumed based on the location/institution of the authors of the article. For this analysis, literature review articles were removed. For computing, 126 out of 195 articles (65%) specified where the study/intervention took place. For STEM, 113 out of 142 articles (80%) specified where the study/intervention took place.
For both computing and STEM, 60% of the studies took place inside the U.S. No other country had more than 5% of the studies from either computing or STEM. There were 34 different countries represented in the computing articles and 29 different countries represented in the STEM articles. Countries from all continents except Antarctica were represented in the articles. There were two STEM articles that did give location information but it was not specific enough to a country. One study talked about a “town in South America” and another discussed that the participants were from 31 countries, but did not give a listing of those countries.
3.4.2. Instructor/Teacher Demographics
For each article, information about the teacher/instructor/leader of the intervention or activity was captured for the following demographic information: who the instructor was (i.e., classroom teacher, graduate student), number of instructors, prior experience of instructor in the teaching subject matter, gender of instructor, and race/ethnicity information of instructor. For this analysis, only articles that focused on an activity or professional development were considered because those are the types of articles that would be best suited to talk about an instructor.
The number of articles that gave any of the above information is at most 27% for computing articles, but 55% for STEM articles.
Table 14 shows the breakdown of how often instructor demographics were discussed.
3.4.3. Activity/Intervention Duration
In this literature review, information was recorded about the activities/interventions as described in the articles.
Table 4 describes the program elements that were recorded for activity demographics. For this analysis, the focus is on the following data:
Type of activity (e.g., informal classroom activity, formal classroom activity/curriculum)
Curriculum used
Tools/Language used
Delivery method (e.g., lab, lecture, project-based, team-based)
Learning objectives (or goals) of the intervention
Duration of the intervention
Freeform text entries were coded into binary
yes/no entries for this analysis. Only articles that described activities or professional development are included. Articles that describe curriculum are not included.
Table 15 provides a summary of these results. For computing, a high percentage of articles identify the type of activity that is being conducted (84%) as well as the curriculum and/or tools/languages used (87%). Computing articles do not report learning objectives for the activities at a high rate, with only 18% of the articles reporting learning objectives. However, expanding the definition of learning objective to include a statement about the general goals for the activity that may or may not be learning objectives, the number of articles reporting that information is 84 and removing for duplication, 92 out of 111 articles (83%) report either or both pieces of this information.
For STEM articles, a high percentage of articles identify the type of activity that is being conducted (86%), but the curriculum and/or tools/languages used are reported by only 53% of the articles. STEM articles are also less likely to contain learning objectives for the activities, with only 8% of the articles reporting learning objectives. However, if the definition is expanded to include any statement about the general goals for the activity that may or may not be learning objectives, the number of articles reporting that information is 47 and, removing for duplication, 43 out of 120 articles (36%) report either or both pieces of this information (36%). STEM articles still report less of this information than computing. STEM articles, however, report more frequently on the method of instruction for the activities at 83% compared to at 62% of computing articles reporting.
4. Discussion
The last step of the literature review framework, Step 5, defined in [
22], is to interpret the findings. This section discusses and interprets the findings of this literature review and the comparison of information reported within computing and STEM articles.
In response to the research questions, R1 was concerned with describing what data were collected/reported in computing education. R2 was similar in nature, but with a focus on closely related STEM fields. The third research question, R3, was concerned with the similarities and differences in the reporting between these two groups.
4.1. Techniques for Data Collection and Reporting in Computing versus STEM
To address the first research question, a majority of the STEM fields are using research approaches and styles similar to computing. A majority of the STEM studies are cross-sectional and more heavily skewed towards quantitative methods as opposed to computing. Because of the predominance of quantitative methods, the number of participants was analyzed to see if the studies being reported in STEM articles were of much larger size than those in computing articles. Looking at the reported data (see
Figure 2), there are no large differences, save for a slightly higher percentage of STEM studies that have participants in the 50–99 range. In terms of studies with greater than 100 participants, the percentages are nearly identical in all categories. Therefore, the use of quantitative methods is not directly influenced by the number of participants in the study. So, a key difference in the techniques is a stronger reliance on quantitative techniques for STEM articles, irrespective of the number of participants.
Based on previous work [
13,
14], it was hypothesized that in the more established STEM disciplines, a greater reliance on longitudinal studies was present. Unfortunately, that was not the case in this review with only 19 articles (13%) reporting on longitudinal studies. The article number is almost equal to the computing articles found (18), even if the percentages are not the same. Perhaps a key difference in the STEM articles is that the average length of the longitudinal studies reported upon is longer by over a full year. However, the maximum study duration is 10 years in both disciplines in these articles and this seems about correct. If a student participates in an activity around age 10 (which is where a significant proportion of activities seem to be targeted), then the study follows that student into a college/university. So, in the case of longitudinal work, there was not significant differences in duration or vastly different techniques employed found in this literature review.
One area where computing is doing something that did not appear in STEM disciplines is retrospective studies. Six percent (6%) of the studies in the computing literature were categorized as retrospective, or asking participants to look back on events that happened previously and answer questions about them at the current time. Often times these studies are used to determine how an event or activity influenced where the participant is in the present time. These types of studies differ from longitudinal studies in that the participants from an intervention are not tracked over time by the researchers, but rather participants are asked about something they may have experienced from a different group of researchers. There was no evidence of these types of studies in the STEM articles.
Another area in which computing is different to STEM is in the comparative analysis of the participants based on certain demographic characteristics (i.e., race, gender, socioeconomic status). Computing studies are twice to five times as likely to compare participants grouped by demographic characteristics as STEM studies. Broadening participation in computing has been a long-standing effort in the computing community, heavily supported and funded by government grants and programs [
30], which could explain some of this difference.
In terms of age/grade level studied, both groups presented studies focused primarily on middle and high school (grades 5–12), with around a quarter of the studies (28% for computing, 24% for STEM) looking at issues in grades K–4, and very few studies (3% or less for both groups) looking at students in the pre-kindergarten years. So, from this perspective, all the disciplines are focusing their efforts on students in the upper grade levels of primary and secondary education.
4.2. Similarities and Differences in Reporting for Computing and STEM
Turning to the second research question, identifying the similarities and differences in reporting, the two groups have strengths and weaknesses in different areas—some of them mutually strong or weak.
Table 16 summarizes the differences in reporting over the various categories analyzed by this literature review. What is important to remember, however, is that even when computing or STEM reports more frequently, or they are comparable, none of the categories was reporting the information 100% of the time and for many of the categories, reporting was actually very low. Since this study was borne out of a desire to improve replicability of educational research, it is important for both the computing education research community and STEM education research community and publication venues to work to improve overall reporting of the relevant information about their research studies [
16,
21].
4.3. More Frequent Reporting from Computing
4.3.1. Research Questions
It is vitally important for research articles to report their research questions in a manner which is clear and easily distinguishable in the text. Computing articles contain this information in 80% of the articles, but STEM only has a report rate of 63%.
4.3.2. Comparisons Based on Demographic Characteristics
Computing has more articles reporting on the comparisons of participants based on demographic groups of gender (28% vs. 10%), race/ethnicity (17% vs. 3%), and socioeconomic status (9% vs. 2%). While this is not a necessary feature of a study, it is interesting to note that computing simply is studying the impact of the interventions
4.4. More Frequent Reporting from STEM
4.4.1. Number of Participants
STEM reported the number of participants more frequently in research studies, with only 10% of the articles categorized as research not reporting. For computing, that number is 28% of research articles not reporting number of participants. In either case, it could be argued that this number should be 0% and that all research articles should report the number of participants in the study.
Computing has a significantly larger proportion of experience reports as compared to STEM (49% to 11%), and actually reports at a slightly higher rate in this category (60% reporting for computing, 56% reporting for STEM). For experience reports, it could be argued that reporting the number of participants is not required in the reporting because the article does not present a formal research study. However, this information plays an important role in a reader’s understanding of the intervention and the subsequent conclusions drawn. Having information about class size or how many students total participated in an activity helps the reader to understand how applicable the observations might be in their circumstance.
Looking at the data for research and experience reports in aggregate, STEM reports more frequently, with 91% of STEM articles containing such data (research or experience reporting), while computing has only 63% of articles reporting the number of participants.
4.4.2. Age, Grade, Level of Participants
Participant age and/or grade level in school was not reported by 7% of the STEM articles studied, and not reported by 18% of the computing articles. This information is extremely important to understand the context of the classroom the intervention takes place in. The environment of a secondary school is very different from that of early elementary/primary school. Furthermore, terminology is problematic when discussing grade and level in school due to the vast differences in educational systems and names. Even within the U.S., terms such as “middle school” and “high school” can mean different things to different school systems. When possible, it is always best to couple the reporting with ages of participants or typical age ranges of students in that level if explicit age data are not collected. Doing so will help all readers, especially those from regions in which the educational system is different to that studied by the researchers.
4.4.3. Socioeconomic Status
STEM articles were twice as likely to present information about participant socioeconomic status than computing articles (29% vs. 14%). Most often, this was done at the school/community level, which seems appropriate due to privacy concerns. Understanding the socioeconomic climate of where the intervention takes place can provide important insight to how or why an intervention does or does not work.
4.4.4. Disability Information
To say that STEM had more frequent reporting in this area hides the fact that at 4%, the reporting is still poor. The fact that computing only talks about this issue 1% of the time is the only thing that gives STEM the edge in this area. More work is needed in both areas to ensure that disability information and accommodation information becomes part of the discussion in the pre-college research space.
4.4.5. Location Where the Invention Took Place
STEM reports location of intervention at a slightly higher rate than computing (80% to 65%). However, looking at distribution of locations, the studies are still predominantly U.S. studies. The number of additional countries represented is roughly the same for computing and STEM. This predominance of U.S. studies could be the result of venue bias since only English-language venues were considered, bar the results of [
14], which expanded a literature review in computing to include many non-U.S.-based venues did not show significant differences in the proportion of studies taking place outside the U.S.
4.4.6. Instructor Demographics
For the five instructor demographics studied, summarized in
Table 14, STEM reported the information at a higher rate (at times double the rate) in all but two instances, instructor gender and instructor race/ethnicity, where computing reported at a 3% and 1% higher rate respectively. In this case, STEM reports this information more frequently, particularly about who actually led the intervention as part of the study. It may be the case that researchers assume that readers know that they led the intervention or that a classroom teacher would lead the intervention as created by the researcher, but this information should be stated so that readers understand the classroom environment.
4.5. Reporting Comparable Computing versus STEM
4.5.1. Evaluation
Both groups reported evaluation in terms of what they intended to measure equally well. The analysis for this study is somewhat superficial in terms of evaluation. The use of validated measures or rigor of evaluation protocol as described by the articles was not analyzed. Future work in this area would be needed to examine more closely the use of validated instruments and other best practice evaluation methods for the two groups.
4.5.2. Gender of Participants, Race/Ethnicity of Participants
Both groups reported on participant demographics in terms of gender and race/ethnicity with about the same frequency, but the percentages were barely at 50% for gender and slightly more than 25% for race/ethnicity. While the demographic breakdown of the participants may not be germane to the research questions being studied, understanding the context of the classroom environment is important to the understanding of the work. So being explicit about these demographic factors helps to situate the intervention. Even if the demographic information is reported for the school/community level, it helps create a picture of what the classroom looks like.
4.5.3. Activity Demographics
For the five activity demographics studied, summarized in
Table 15, computing reports more frequently for two of them, and STEM for three, but the differences in reporting are not as large as in other categories, and thus this was classified as being done equally well on both sides. The one area where computing is reporting more often is in the area of curriculum and tools/languages used. This is possibly an artifact of the discipline. Computing is incredibly focused on the technology and/or programming language used for instruction, so it is often discussed more often than the actual way in which the technology/tool/language is being presented, which computing is reporting less often. This could also be an artifact of the age of the discipline. As an example, mathematics decided a very long time ago to use Arabic numerals as opposed to Roman numerals (or others) as their language of expression. Computing has yet to adopt a universal language of expression for programming and is likely decades away from doing so, if it will happen at all. Therefore, there is a very important need to know about the language/tool when discussing these interventions.
4.6. Guides for Improving Reporting
This systematic literature review shows that there is room for improvement in the reporting of educational research in both computing and STEM education. Resources have been created for computing education researchers that can apply equally well to STEM education researchers. The first, a guide for reporting program elements (
https://csedresearch.org/guides/) [
31], is based on a comprehensive examination of 297 articles in computing education and was derived from noting the gaps in reporting as described in [
16].
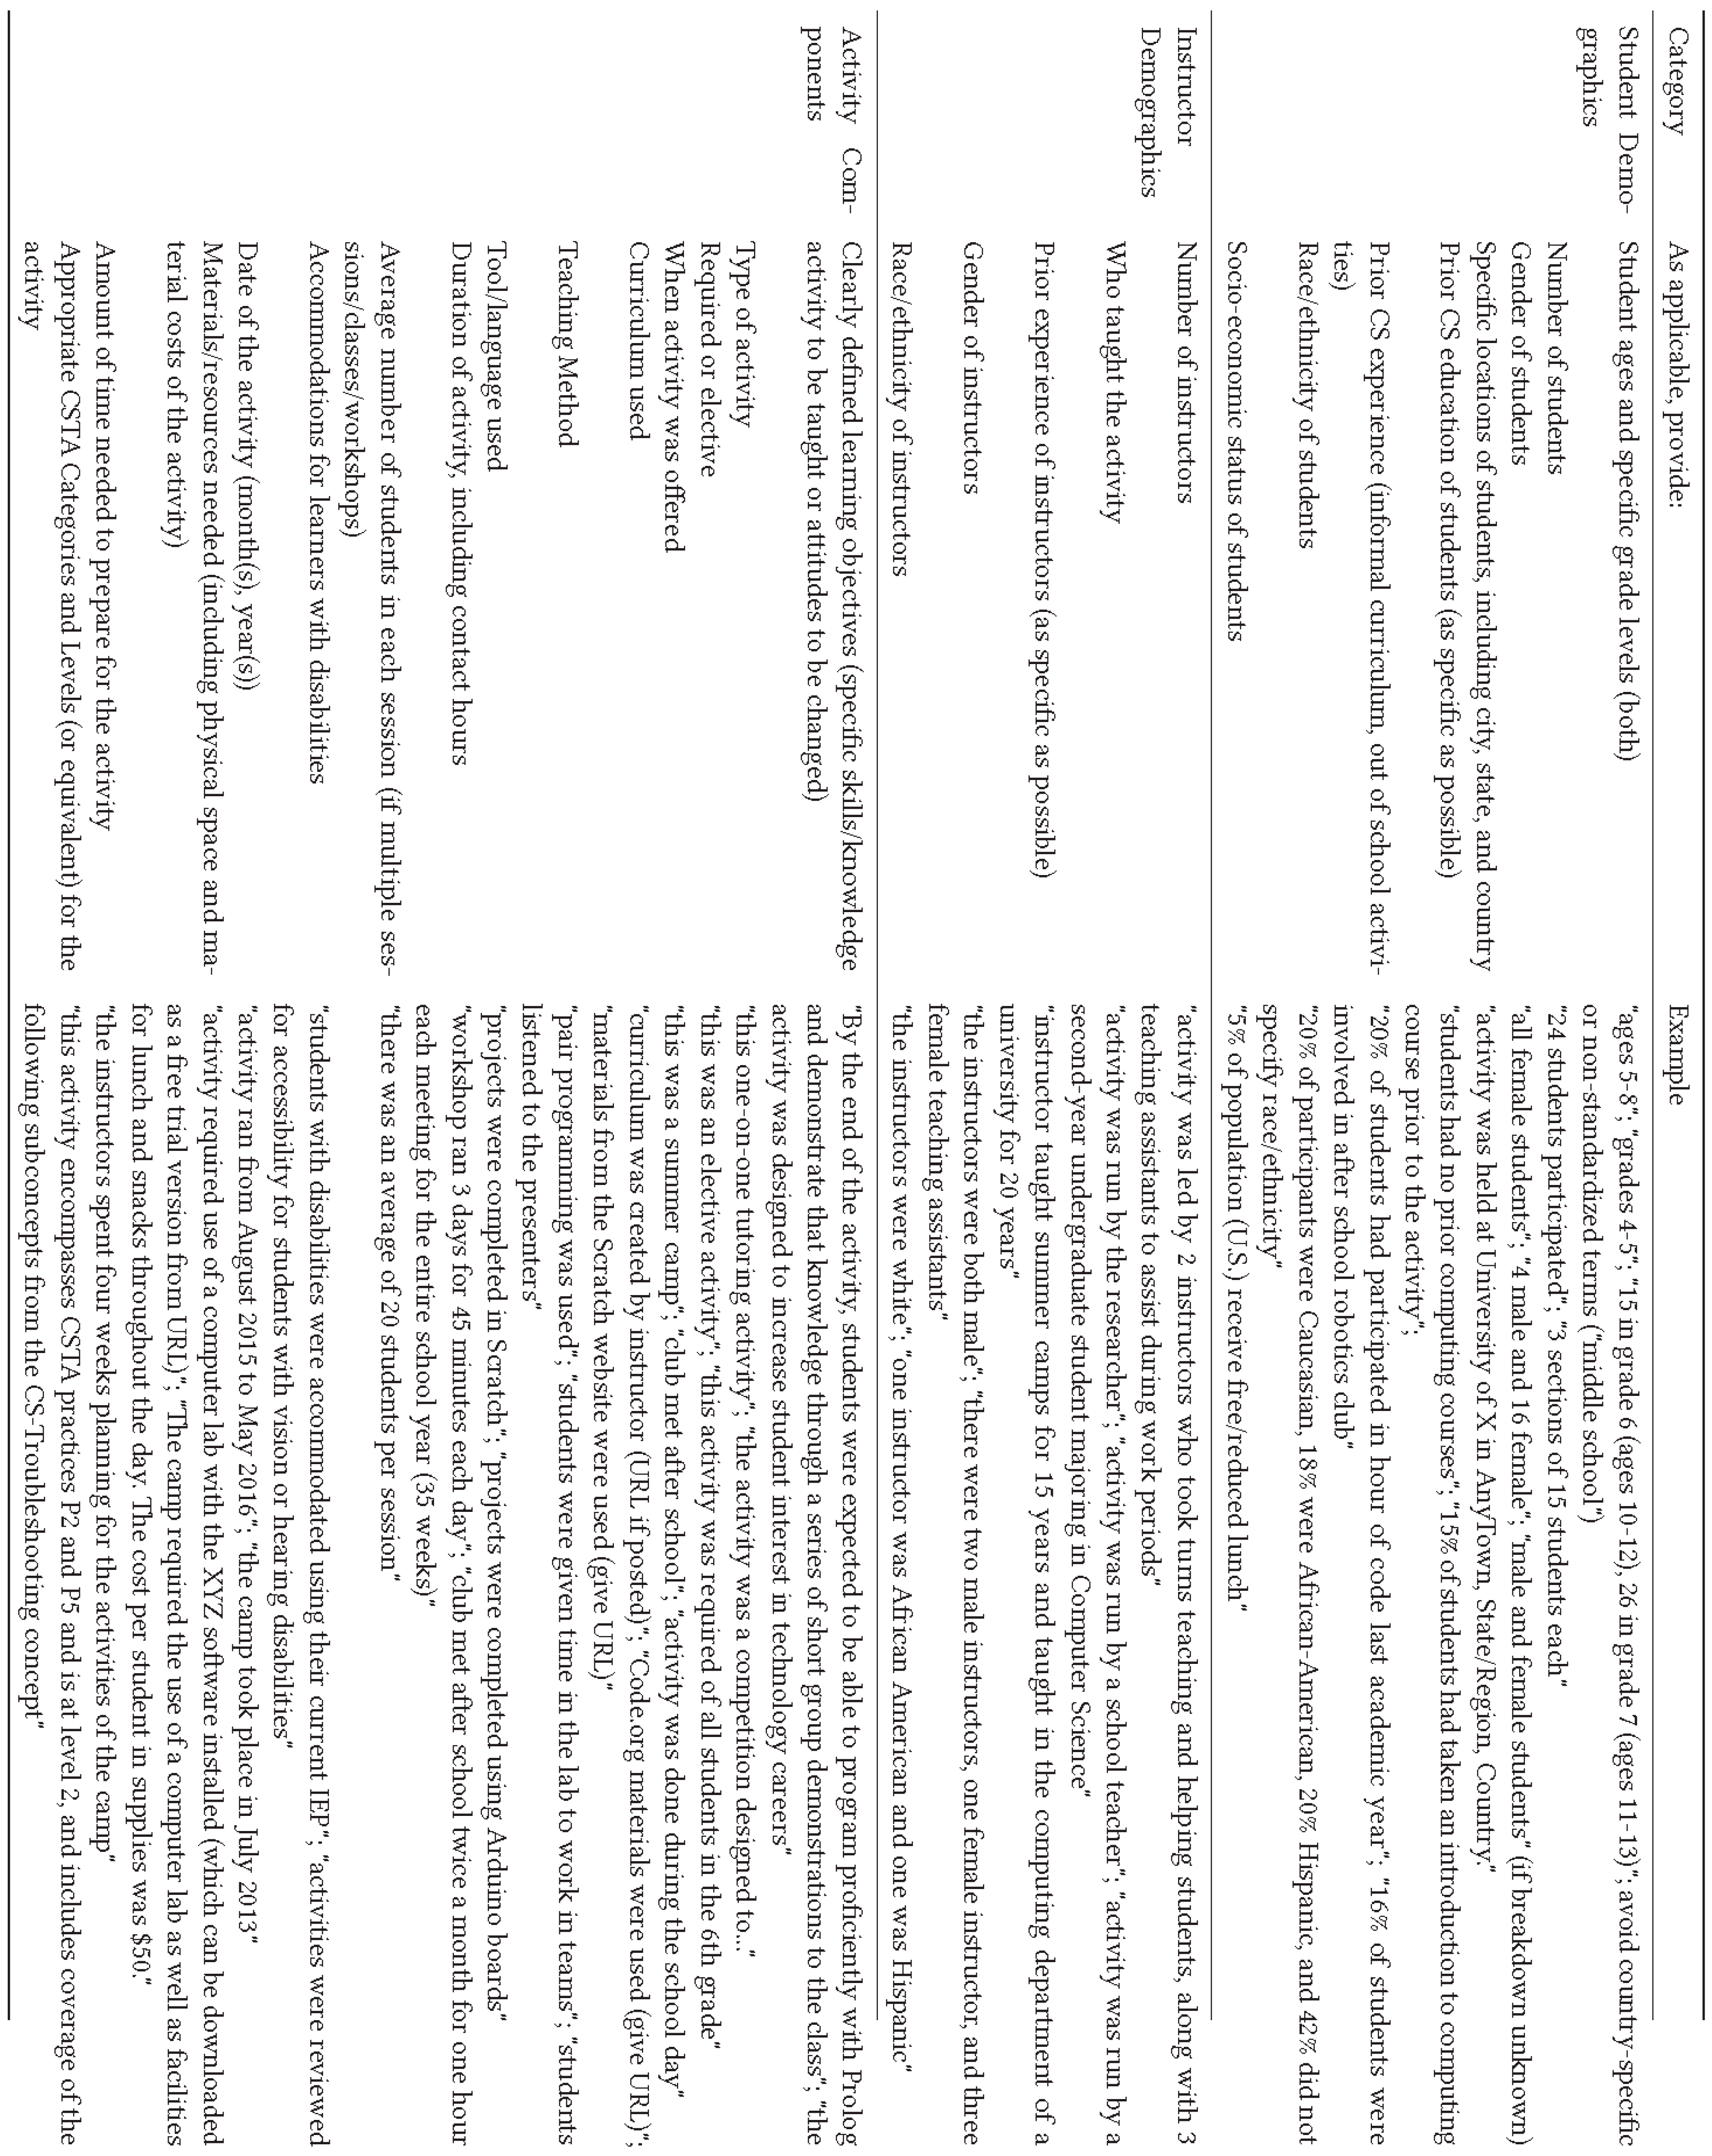
To encourage researchers to report data more fully and consistently, a list of recommendations for reporting on these interventions was also developed [
16]. These recommendations have been reprinted here as
Figure 3.
The second, a guide for reviewers to consider when reviewing articles (
https://csedresearch.org/check-articles/) [
32], was informed through the work in the initial design and creation of the site with a focus group of potential users (computing education researchers, practitioners, and evaluators) [
26]. Through the 10-week discussion period, one theme that emerged was how to assess the research quality of the items being included in the repository and the discussions resulted in the following framework [reprinted here as
Table 17].
4.7. Threats to Validity
Section 2.4 acknowledges some of the threats to the validity of this study, particularly around bias in sampling for the literature review. However, another important threat to the validity of this work is human error, both in the information that was overlooked or missed in the extraction of data from the articles as well as information that may have been misinterpreted. While every effort was made to record the actual text from the articles as the data were being extracted, there were times when the actual sentences needed to be summarized or rephrased to conform to the categories of data being collected.
The data curated for the computing articles have undergone a data extraction as well as a data verification process. The STEM articles underwent only a data extraction process with no secondary review. However, the extraction was done by a senior researcher working on the project who developed and coached others on the protocol, once again, to mitigate potential errors for this study.
In addition, the research team has a background in computing education and general education techniques, but not a background in other STEM education research. It is possible that this lack of knowledge could introduce interpretation error when extracting data from the STEM articles.
5. Conclusions
In order to improve the credibility of educational research in K–12 as well as undergraduate STEM+C, it is imperative for educational researchers to carefully record and report participant demographics as well as program elements of the intervention. This particular study was formed to determine whether computing education is lagging behind other STEM disciplines in terms of the accurate reporting of and study of these types of educational interventions at the pre-college level.
Overall, this comparative literature review answered a key question in terms of understanding the differences in reporting in the computing and STEM literature. As such, the researchers considered the possibility that other STEM disciplines may help understand how reporting demographic and program data in computing education research compares and what can be improved. While this review uncovered deficiencies on both sides, more often on the computing side, there were times when computing had a higher level of reporting.
The results bring forward possible questions for future consideration including what mechanisms can be employed to ensure more thorough reporting of these factors in research studies. Is there a way to bring more recognition of the importance of these issues to the community? With more investment in computing education in recent years, will a literature review 5 years from now still uncover the same deficiencies in reporting?
By bringing these issues of reporting into the conversation, there may be a shift in the way articles report on their experiments and findings. With stakeholders such as the U.S. National Science Foundation starting to make a push for more replication and reproducibility, it is anticipated that any such shift will lead to more utility in the research results and greater ability for others to replicate studies, thereby adding credibility to the results. By so doing, best practices can be better formed through an aggregation of higher integrity, empirical evidence.


