Article

Assessment of Competencies in Scientific Inquiry Through the Application of Rasch Measurement Techniques

1
Centre for Science and Technology Education, School of Education, University of Applied Sciences and Arts Northwestern Switzerland, 5210 Muttenz, Switzerland
2
Educational Psychology, Miami University, Oxford, OH 45056, USA
3
Biology Education, IPN-Leibniz Institute for Science and Mathematics Education at Kiel University, 24118 Kiel, Germany
4
Biology Education, Kassel University, 34125 Kassel, Germany
*
Author to whom correspondence should be addressed.
Educ. Sci. 2018, 8(4), 184; https://doi.org/10.3390/educsci8040184
Submission received: 30 June 2018 / Revised: 17 October 2018 / Accepted: 18 October 2018 / Published: 24 October 2018
(This article belongs to the Special Issue Biology Education)

Abstract

:
Achieving competence in scientific inquiry or mastering scientific practices is an essential element of scientific literacy. Clearly, if students’ Scientific Inquiry Competence (SIC) is to be improved, a critical step is to reliably measure it and provide from this measurement feedback for teaching. Although numerous instruments were presented in literature to assess SIC, the specific potential of Rasch measurement for the integration of research assessment and individual feedback onto SIC is so far underestimated. This article presents details regarding the design and evaluation of a test instrument using an open-response format to measure students’ SIC in content-rich biology contexts at the upper secondary level. First, a set of three sub-competences (“generating hypotheses”, “designing experiments” and “analyzing data”) each composed of five competence aspects is introduced from literature to define the SIC construct. The SIC instrument was then operationalized using six open-ended partial-credit items. After pilot testing, the instrument was administered to N = 220 students (ages 15–19) before and after an inquiry-based unit on enzymes. Instrument functioning was evaluated using the Rasch Partial-Credit Model and first results towards satisfactory instrument functioning (e.g., validity and reliability) are presented. Particularly noteworthy is that the observed pattern in competence difficulty matched the pattern predicted from theoretical considerations. We demonstrate how the SIC instrument can be used for competence assessment and the evaluation of the effectiveness of learning.

1. Introduction

To prepare for life and work in the 21st century students must understand, conduct, and critically evaluate scientific investigations [1,2,3]. Not surprisingly the K-12 Science Standards of many countries, states, and territories [4,5,6,7,8] emphasize the explicit teaching and learning of Scientific Inquiry Competence (SIC; also known as “scientific inquiry”, “inquiry skills” or “science practices”). Clearly, SIC is recognized as an important component of scientific literacy and a critical goal of science education efforts.
Adequate measurement and feedback is needed to assess students’ level (and development) of SIC and the effectiveness of learning materials. Several general scientific inquiry tests have been developed and used for formal and informal assessment (e.g., [9,10,11]; see Table S2), but many of these instruments were only developed for students up to 10th grade. Generally, they confound cognitive and manual skills and mostly these instruments, are not subject specific. However, subject-specificity is important since learners are dealing with a subject-specific knowledge base on the one hand (e.g., ecology, enzymology, ethology, neurophysiology), which pose specific demands e.g., on cognitive load or on conceptual knowledge [12,13] and with subject-specific objects (e.g., animals in biology) that need special handling [14] on the other hand. An additional feature of previously developed science inquiry instruments is that only a few of these tests (e.g., [9,15]) make use of open test formats. Open test formats represent a compromise between multiple-choice test formats (which are very practical and economic but unspecific), and performance assessments (which can capture the depth of inquiry [16], but are often very time-consuming, costly, and seldom practical for normal school use [17].
This paper aims to describe steps towards development, psychometric evaluation and use of an open-ended assessment format based on Rasch measurement analyses. With this way to assessment of SIC we want to demonstrate the potentials of Rasch measurement for the integration of theory and practice in teaching and learning of SIC and add instrumentation suggestions to the three described shortfalls in existing science inquiry instrumentation the need for an instrument that is suitable for upper secondary students, that is subject specific and uses open test formats.

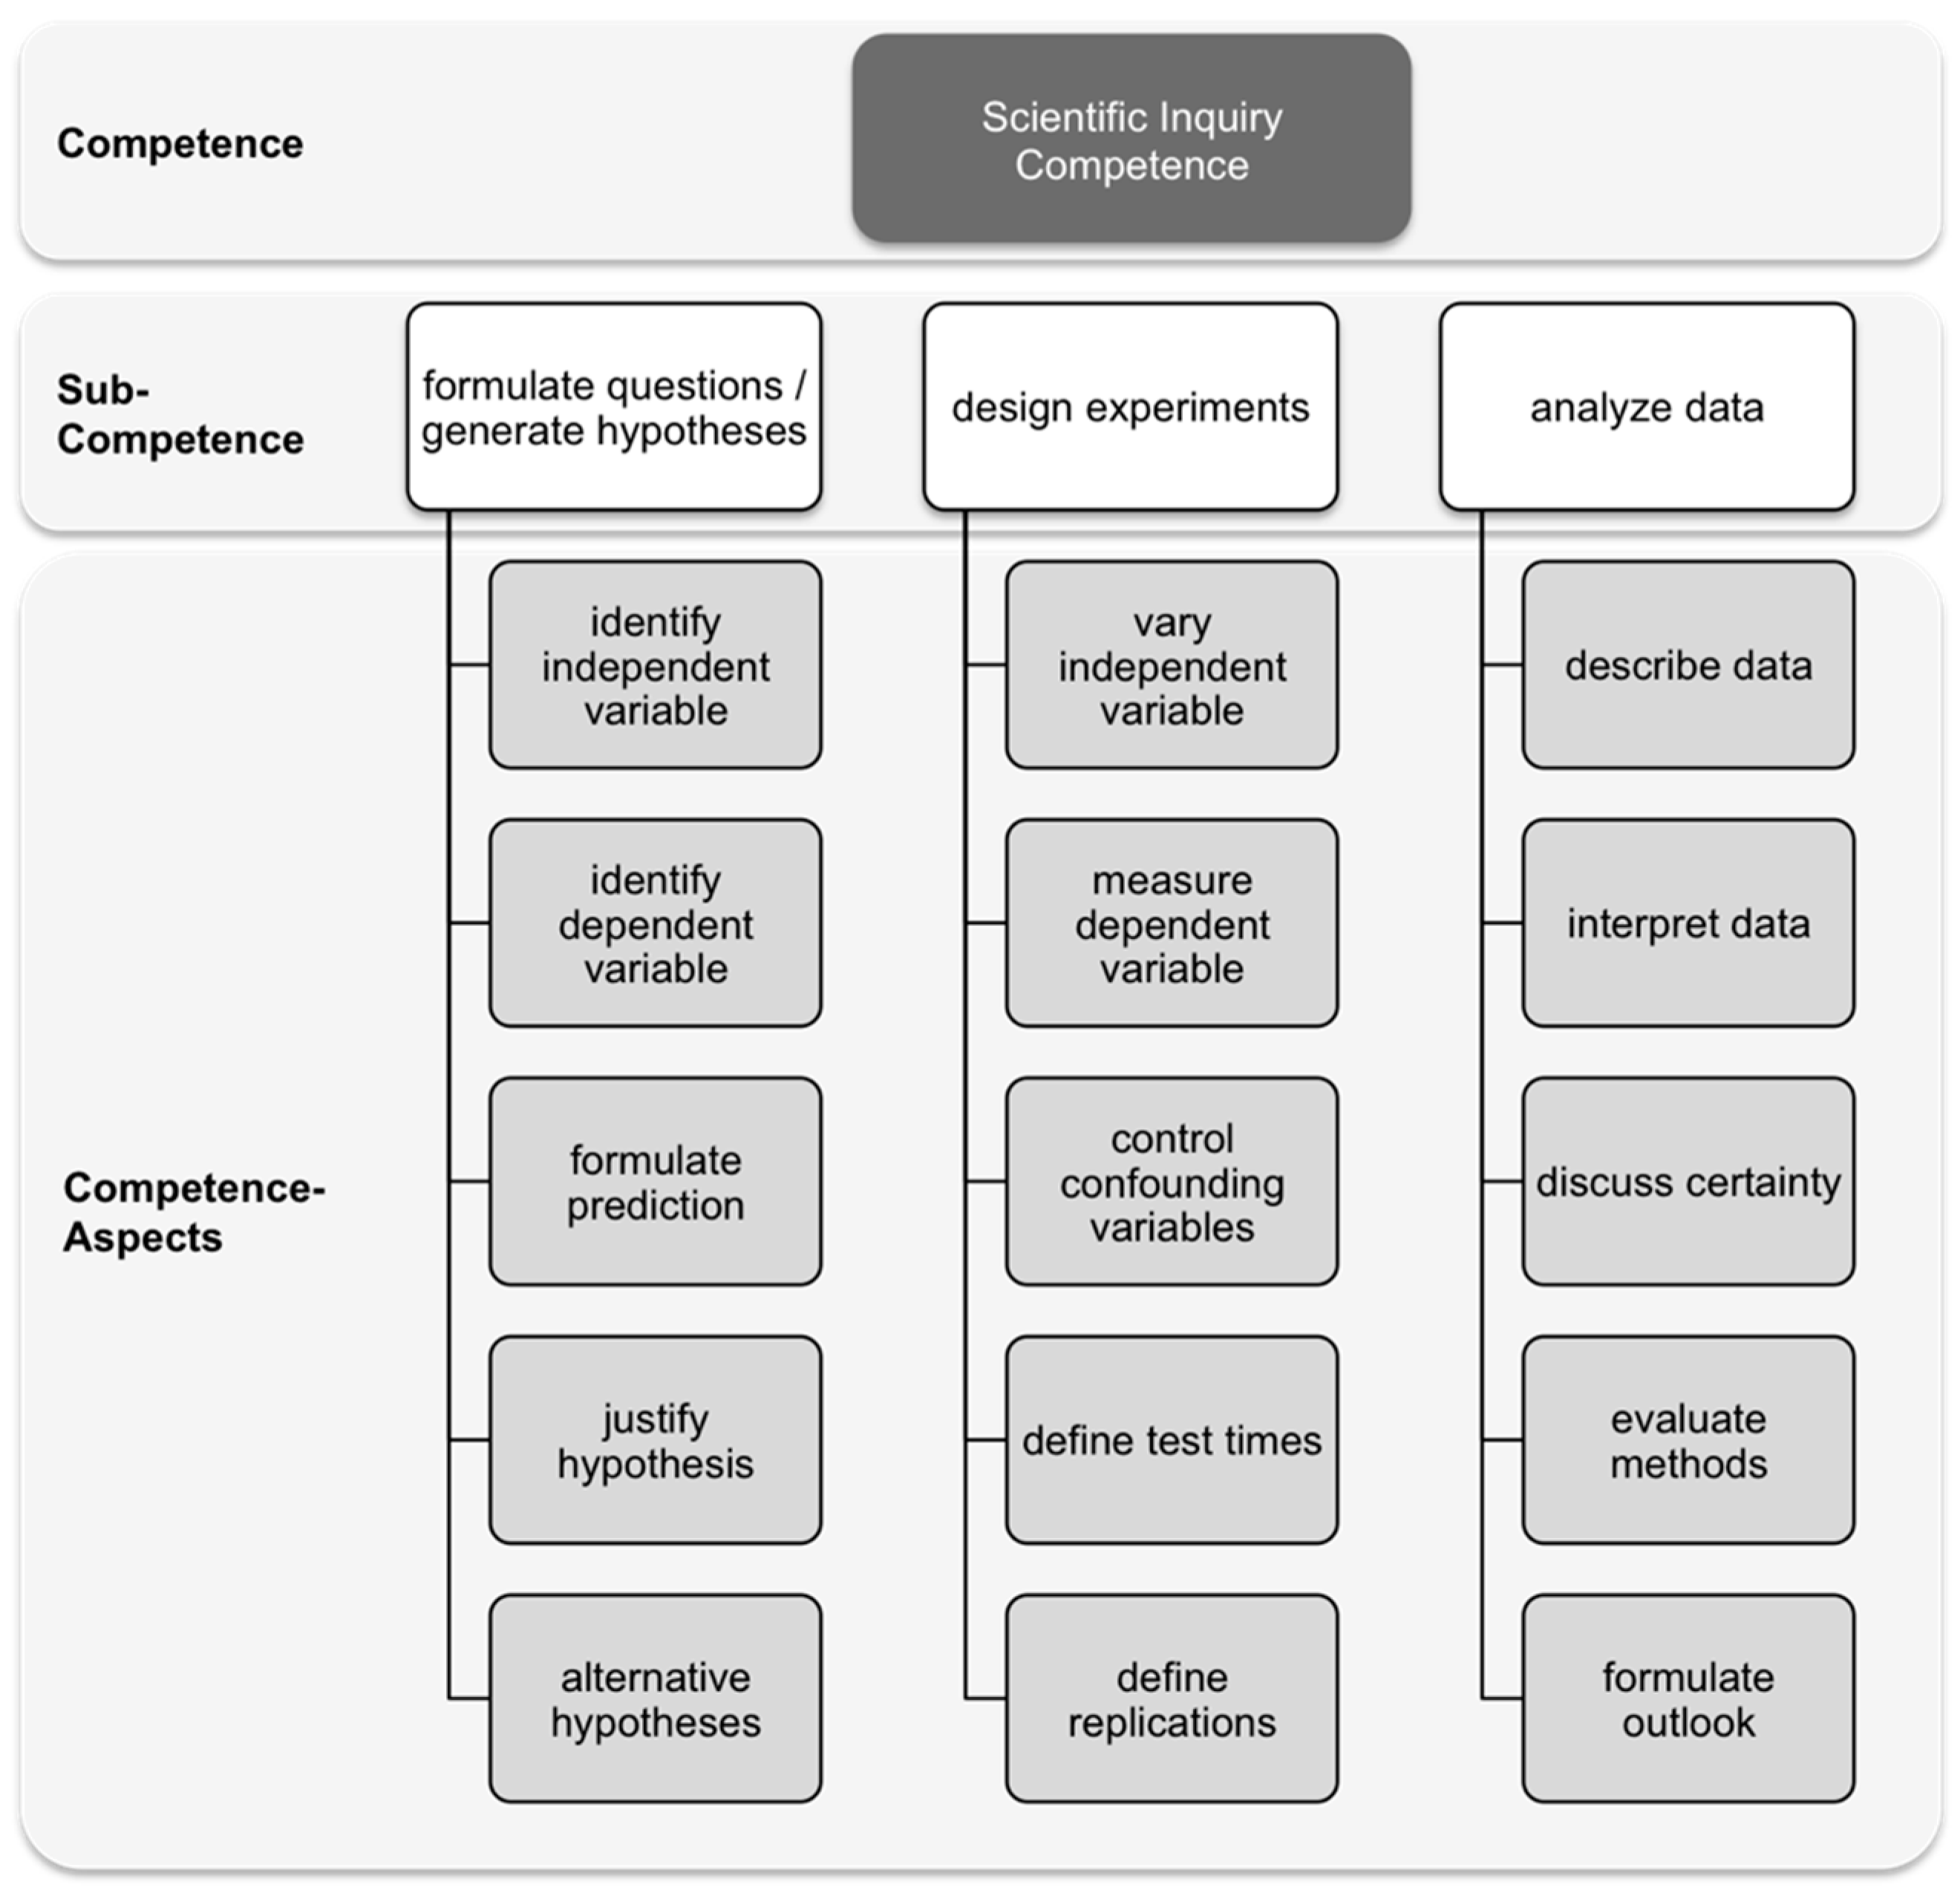
1.1. Scientific Inquiry Competence

To develop SIC assessment, it is important to detail the way the construct is defined, namely to detail what one must be able to do to be “competent” in scientific inquiry. Several authors [1,18,19] have pointed out that scientific inquiry is a problem-solving process, concerned with problems and phenomena in the natural world. Hence, in this manner SIC is defined as the ability to solve problems about the living natural world by using scientific methods. Regarding the broad topic of scientific inquiry, which encompasses many different scientific methods (e.g., observation, comparison, or experimentation; [20]). By using the term “competence” we seek to emphasize the cognitive aspects of the ability to use problem-solving procedures rather than manual skills [8,21]. The focus lies upon experimentation of causal relations, because the experiment is considered the central method of science [22]. Hence for this instrument SIC is defined as the ability to understand, conduct, and critically evaluate scientific experiments on causal relationships.
To foster and assess SIC it is necessary to define specific components of what it means to be competent. Certainly the scientific problem-solving process (the process of science inquiry as reflected by experiments on causal relations) is not a linear process with a defined order of steps [23,24,25], but if one attempts to measure competence (with respect to science inquiry through experimentation) a specific set of experimental procedures to be mastered have to be identified [26]. Table A1 provides an overview of how different authors (of tests, models, and learning materials) have conceptualized SIC regarding the realm of experimentation and requirements. The literature review suggests three key components (sub-competences) of experimentation regarding the cognitive aspects of inquiry to be met to competently master an experimentation task (Figure 1).
Students should be able to formulate scientific questions/generate testable hypotheses. Inquiry starts with a phenomenon and a resulting problem. Questions arise based on this problem and students should have the ability to formulate the problem [27] and/or generate adequate research questions (e.g., [20,28,29,30]). Questions addressing experimentation on causal relations must consider the relationship between dependent variables and independent variables [31,32,33]. To answer a scientific question, one must generate testable hypotheses (e.g., [10,11,29]). To generate testable hypotheses, one must identify or name the independent variables [34] and the dependent variables (e.g., [15,20]). These variables should be formulated as a prediction of the outcome of an experiment, e.g., the question is authored in an “if-then” mode (e.g., [9,31,35]). These hypotheses or predictions should be based on prior knowledge, analogies, theories, or principles and therefore justified (e.g., [18,20,36]). In addition, further hypotheses are needed including different independent variables or different predictions, each of which can then be ruled out (e.g., [32,33]).
Students should be able to design an experiment. To test each hypothesis, one must design and conduct an experiment. Therefore, students should be able to vary the independent variables, as well as be able to operationalize and measure the dependent variables (e.g., [15,20,29,30,37]) and control confounding variables (e.g., [33,38]). Furthermore, students need to be able to define test times (i.e., start, interval and duration of measurement; e.g., [20,30,32]) and students need to be able to use experimental replications (e.g., [20,34,39]).
Students should be able to analyze data. Regarding data analysis, students should be able to objectively describe data (e.g., [15,32,36]) before interpreting it with respect to hypotheses (e.g., [9,10,11,30,40]). Additionally, the certainty and the limitations of interpretations must be discussed (e.g., [20,33]). For example, the validity of results [27] must be discussed and considered [41]. Furthermore, the entire methodological design of the experiment must be evaluated critically to detect any flaws [29,42] and to provide guidance as to ways in which the experiment could be improved [34]. Data analysis often results in the generation of new questions and/or in the modification of hypotheses which then must be tested again. Hence, it is important for students to have the ability to provide an overview of what steps might follow a specific experiment. Students should also understand that research does not end with data interpretation [20,28,38].
Considering the identification of student abilities, a wide range of research has been conducted to explore the level of student competency. Author et al. [32], for instance, have found that most students (up to 10th grade) fail to formulate questions for a quantitative relation of variables. Hofstein et al. [28], found that particularly inexperienced students exhibit difficulties generating scientific questions. Another noteworthy shortfall in generating questions is that students often fail to focus on one single factor which might lead to confounded experiments [43]. Regarding the skill of “generating hypotheses” de Jong & van Joolingen [44] have pointed out that students simply “may not know, what a hypothesis should look like” [44] (p. 183) i.e., that it should be the description of the relationship of variables. Another common student misconception is that they often view hypotheses as statements that require confirmation rather than considering hypotheses as predictions to be tested. Students also often fail to formulate alternative hypotheses [18,45]. One result of this inability is that students often retain their original hypothesis even in face of conflicting data [46].
Studies have also suggested student difficulties with the design and conducting of experiments. Schauble and colleagues [47] found that students often consider only one variable and seem not to understand the relationship of the two variables explored in the experiment. Students also exhibit difficulties in understanding the operationalization of variables [47]. Another common problem is that students often design or conduct experiments with only one variant of the independent variable, i.e., studies are designed without a control [48]. A related problem is that students alter more than one independent variable at a time. As a result, students fail to plan unconfounded experiments [49]. In their research Duggan, Johnson, and Gott [50] commented on student difficulty regarding operationalizing the independent variable as continuous and controlling confounding variables. An additional shortfall in student understanding also concerns a lack of understanding the importance of repeated measurements [51,52].
Regarding the sub-competence of “data analysis”, Germann and Abram [41] describe that students often fail to take the hypothesis into consideration while interpreting data, but students still draw conclusions and students still provide reasons for their conclusions. Lubben & Millar [52] and Roberts & Gott [53] found that students often do not identify anomalous results and fail to critically evaluate anomalous results while drawing conclusions. Roberts & Gott [53] determined that students have problems considering sample size, representativeness, and design validity when drawing conclusions.
The problems and misconceptions detailed above occur among many students of a wide age range. Evidently some of these problems occur less often among older students; however, some problems can be observed among students of various ages. Tamir et al. [15] for example investigated older students. These researchers found that the majority of 12th graders can in some way solve new problems in the laboratory. Some student difficulties still involve accurate formulation of hypotheses and identification and definition of dependent and independent variables. Concerning experimental design, students exhibit weaknesses, such as not being able to adequately control variables. Additional findings include students exhibiting difficulties explaining research findings and often offer “intuitive explanations” or “explanations based on teleology and/or anthropomorphism” while analyzing data ([15], p. 49; [39]).

1.2. Assessments of Scientific Inquiry Competences

Several instruments were developed to attempt assessing SIC. Table A2 presents a summary of previous SIC instrumentation which was developed in the last 30+ years. Such instruments were developed for a range of grade levels using a variety of formats. Table A2 reveals that most of these instruments are designed for and used through grade 10. One result of this past age range of instrument targeting is that at this point only little is known about competences of older students. Nevertheless, knowledge about competences in this age-group remains important since this is the transition from school to possibly working in the scientific field.
Another factor to consider when reviewing past instruments is the test response format. Many tests make use of multiple-choice formats (e.g., [10,11,30,38,40]), which are economic regarding administration and scoring time, but do not allow for evaluation of students’ ability to construct and formulate an individual response [15,16,40]. Some past instruments have made use of hands-on activities (e.g., [9,15,31,36,37,41]). One reason for the common use of a more closed format may be that such authentic tasks are often complicated and require group-work, which complicates individual assessment [54].
Several instruments presented in Table A2, generally have more than one focus, i.e., combine testing practical skills and cognitive problem-solving abilities (e.g., [41]). An additional characteristic of many of the previous instruments is that often scenarios lacking in complexity are applied when using practical tasks (e.g., [41] ask students to mix hot and cold water). Such experiments are very time-consuming for the teacher, often require small groups of students to work together and often require physical materials for assessments—hence the lack of complex experiments in assessments. Although rare, Tamir et al. [15] for example use complex experiments. A final point, none of the existing instruments use the organizational framework of “aspects” (as provided in Figure 1) to guide what the instruments measure. Our research used these aspects to guide our instrument design, data analysis and interpretation of results.
To fill a research gap and an instrumentation gap, the purpose of this study is (1) to develop an assessment instrument to evaluate students’ SIC in biology suitable for Rasch Analyses and (2) to evaluate the instruments’ functioning to discuss instruments potential for research and teaching. Development of such an instrument will provide insight into the abilities of upper secondary students’ SIC using demanding and relevant contexts.

2. Materials and Methods

An open-ended paper-pencil SIC instrument was designed and then piloted [55]. The deduced version of the items can be found in the Supplementary File S1. The focus of the instrument was on the three sub-competences of “generating hypotheses”, “designing experiments” and “analyzing data”. Furthermore, the focus is on the type of experiments in which dependent and independent variables are continuous, and independent variables and possible confounding variables may be manipulated. This type of experiment was chosen because of its predominance in higher levels of scientific education, i.e., suitability for older students [39,56].
Each of the instrument items consisted of written text which provided (1) relevant information (“the context”) to the respondent and (2) “the task”, which asked students to generate hypotheses, design experiments or analyze data respectively (an example of an item is given in Figure 2).
The items were constructed according to the following guidelines:
  • Item contexts include challenging and curriculum relevant topics for biology instruction in upper grades, e.g., ecology, neurophysiology, ethology, enzymology.
  • Item contexts induce a student-relevant problem and research question (on causal relations) which requires an experimental investigation with continuous variables [39,56].
  • Students can answer items without having specific content knowledge. When content knowledge is needed, such information is provided in the item context [57].
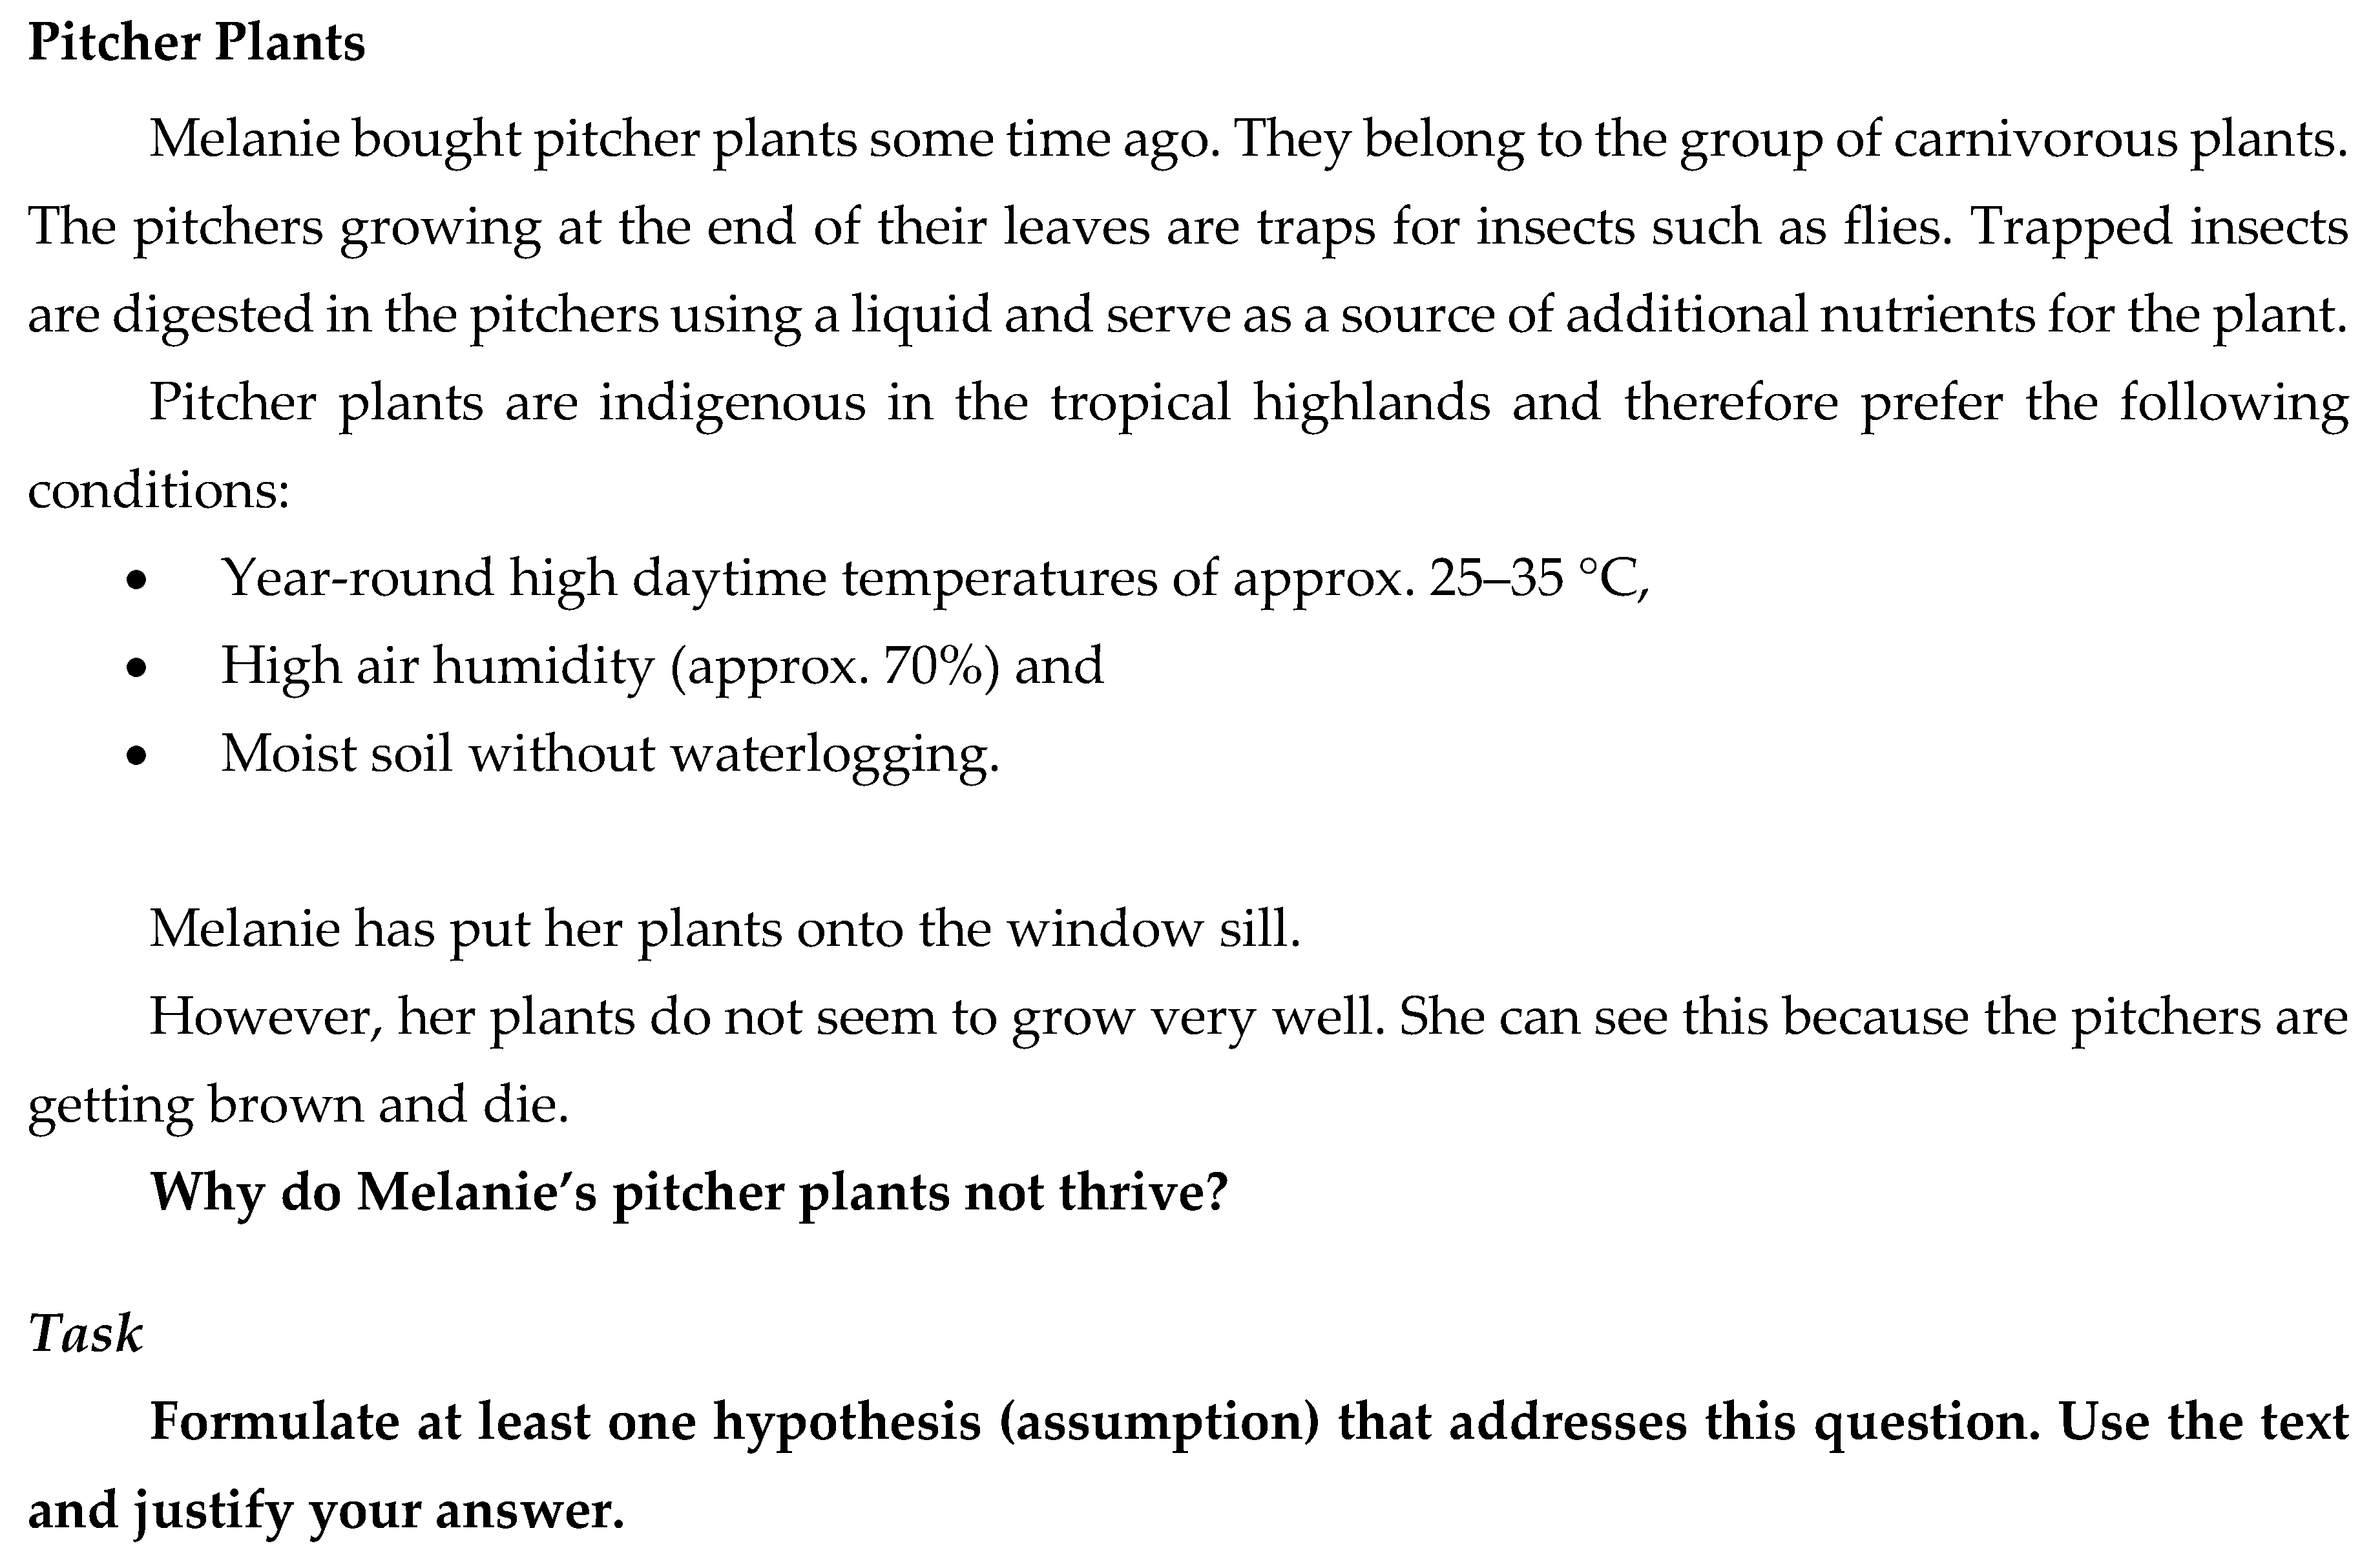
  • Items which concern “formulating hypotheses” have the research question presented in the item.
  • Items which emphasize “designing an experiment”, include both the research question and the hypothesis.
  • Items which emphasize “analyzing data”, include the hypothesis to be tested, the experimental design, and the data to be analyzed.
A set of six items was constructed and piloted using these six guidelines. Piloting was primarily done to investigate item clarity and whether the tasks were suitable with respect to the different “aspects” (Figure 1). The piloting procedure asked students to provide comments regarding the structure and clarity of the items. An item rubric manual was developed for the pilot. Initial rating categories derived from the literature (Table A3), were refined and informed by students’ answers from the pilot. The pilot established that a dichotomous rating was suitable for aspects of the sub-competences “generating hypotheses” and “analyzing data”, while rating scale of 0, 1, 2 and 3 was needed (polytomous rating) for the sub-competence “designing experiments”.

2.1. Final Instrument and Rubric

The final instrument (provided in the Instrument Supplement) consists of six items, with two items for each of the three sub-competence. As shown in Table 1, the instrument item contexts include the topics of ecology (“Pitcher Plant”), behavioral biology (“Dummy Experiment”), neurophysiology (“Nicotine”) and enzymology (“Apple Juice”, “Food Preservation” and “Fever”).
The rubric for the instrument is provided in Table A3. For example, in the case of dichotomous items (0, 1; sub-competences “generating hypotheses” and “designing experiments”) a rubric was created which defined the lowest quality answer provided by a student to receive one credit. Three rubrics or levels per aspect are described for the sub-competence “designing experiments” (polytomous items; 0, 1, 2, 3). Each rubric defines the minimum requirement needed to reach each level. Raters were schooled using student answers from the pilot. Fifteen percent of student answers were rated by two independent raters and Cohens Kappa coefficient was computed to evaluate each of the raters use of the item grading rubric. Kappa varied between 0.89 and 0.94 for the three sub-competences. Landis and Koch [59] classify the observed interrater-agreement as having a high level of agreement between raters and indicate that the rubrics are well defined.

2.2. Sample and Setting

To evaluate the instrument’s functioning, the items were administered to 220 students (11th grade) pre and post to an inquiry biology unit. Data used for the analyses of the final version of the instrument was collected prior to and following an inquiry-based unit on enzymes in grade eleven (N = 220; age 15–19, M = 16.68 years). The inquiry-based unit consisted of two experiments, one experiment concerned the topic of temperature-dependency of lipase-catalyzed reactions and the other experiment concerned the pH-value-dependency of catalase-catalyzed reactions. The research question was provided to students for each experiment. Students then had to generate hypotheses, design, and conduct the experiment, and analyze their experimental data. Students had approximately ten weeks of lessons for these tasks. Students were given 50 min to complete the pre- and the post- test of each administration of the instrument.

2.3. Psychometric Analysis and Rasch Partial-Credit Model

The Rasch partial-credit model was applied (using the Rasch software program Winsteps; Linacre [60]) to conduct a psychometric analysis of the data set, and thus a psychometric evaluation of test functioning. Analyses were conducted using student answers from both the pre-administration (N = 198) and the post-administration (N = 206) to investigate instrument functioning. This “stacking” of data (described by Wright [61]) provides an analysis as if 404 students of differing ability levels had answered the instrument. The stacking procedure is not without critique in terms of independency. First analyses towards validity and reliability of the here published instrument version were evaluated via commonly considered Rasch techniques such as item fit, item-difficulty order and reliability indices (person reliability, item reliability).

3. Results

3.1. Item Fit

One way the validity of the instrument can be evaluated is an assessment of Fit Validity [62,63]. One such analysis is the evaluation of Rasch item-fit statistics which can be examined to explore the degree to which items “fit” the model, and thus “fit” the concept of a single trait. When items fit, this provides evidence of the instrument items defining a single trait [14,62,63,64,65].
First, fit statistics for items were evaluated. Two fit-indices were reviewed: Infit MNSQ and Outfit MNSQ (mean-square). These indices “represent the differences between the Rasch model’s theoretical expectation of item performance and the performance actually encountered for that item in the data matrix” [66] (p. 57). The MNSQ values of items should be close to 1. Items of greater value are underfitting and therefore might degrade measurement, while items with lesser values (below 1) are overfitting and therefore too predictive [60]. The two fit-indices have different foci: while outfit “is more sensitive to unexpected observations by persons on items that are relatively very easy or very hard for them” [60] (p. 594), infit is more sensitive to unexpected patterns of observations by persons on items roughly targeted to them [60]. The key question remains if items appear to follow within a range of acceptable MNSQ values.
Table 2 shows item measures and fit statistics for “Enzyme” tasks and the other contexts (see “Final Instrument and Rubric”). Analysis of fit statistics revealed an average item Infit MNSQ of 1.02 for the aspects of “Enzyme” tasks (“Apple Juice”; “Food Preservation”; “Fever”) and 0.99 for “Other” tasks (“Pitcher Plant”; “Dummy Experiment”; “Nicotine”) and an average item Outfit MNSQ of 1.05 for “Enzyme” tasks and 0.95 for “Other” tasks. These average values are near 1 and therefore within the acceptable ranges of fit suggested by Author et al. [14] and Linacre [60]. It was found that nearly all aspects had acceptable MNSQ values (0.5 < MNSQ < 1.5). Only one item exhibited a MNSQ >1.5. This item was retained as it was one of the easiest items for respondents with a very low item difficulty (−4.29 logits). If only a few respondents (exhibiting an ability level above the difficulty of this item) unexpectedly answer this item incorrectly, an item can appear to misfit. For this reason, this item was reviewed and ultimately retained. In future, within data collections of this instrument this item will continue to be monitored.

3.2. Item-Difficulty Order

Validity of an instrument can further be examined by comparing the item hierarchy to a hypothesized hierarchy (in the case of a test instrument, if one reviews items from easy to difficult: is the observed ordering aligned to that which would be predicted from theory). If the difficulty of items and levels is of an order which comes close to match theory, this contributes to evidence of construct validity [63,64].
Previous studies concerning SIC using operationalization of aspects similar to that used for TOSSIC-B provide some theoretical predictions of item difficulties as a function of the test instrument’s sub-competences (“generating hypotheses”, “designing experiments” and “analyzing data”). For “generating hypotheses” Germann & Aram [31] found that identifying the independent variable is easier than identifying the dependent variable, however; however, Mayer et al. [32] suggested a reverse pattern. Another important observation informing an assessment construct validity was made by Temiz et al. [36]. Those authors found it was more difficult to predict the general outcome of experiments than to formulate testable hypotheses. The work of Mayer et al. [32] and Kremer et al. [67] provide added guidance with respect to what is predicted regarding the difficulty of “generating hypotheses” test items. These authors found that formulating testable hypothesis is predicted as being easier than justifying testable hypotheses. Also, those authors suggest that “justification” is predicted as being easier than “generating alternative hypotheses”. Germann et al. [37] suggest that with respect to the component of “designing an experiment” manipulating independent variables is easier than measuring a dependent variable. Furthermore, measuring a dependent variable is easier than considering confounding variables, and considering confounding variables is easier than considering different trials. In the 2008 work of Mayer et al. [32], in which these authors considered the levels of difficulty regarding the aspect of “designing experiments”, they suggest that identifying control variables is more demanding than the identification of dependent and independent variables. Even more demanding for students is considering sample size and repeating measurements and test time. With respect to “analyzing data” Germann & Aram [41] suggest that drawing conclusions seems easier than objectively describing the data. Mayer et al. [32] proposed describing data was easier than interpretation. Those researchers predicted that “evaluating conclusions from data, concerning limitations and certainty aspects” should be the most difficult level for students.
Below we present a listing of competence aspects (Figure 1) and relative aspect difficulty as predicted from theory and as presented in the literature (< means “easier”; <> means “easier or harder”, since previous literature has at times suggested unclear difficulty orderings and at times the literature has suggested equal difficulty). If the assessment has construct validity, then one would expect within measurement error that the ordering of item difficulty from easy to more difficult as revealed by the test data analysis should broadly match aspect difficulty as presented in the literature. If there is no match, such a result may (at one extreme) reveal a needed revision of the theory or (at the other extreme) a needed revision of the instrumentation [68]. Following the review of the literature the following order of aspect difficulties can be hypothesized:
  • ‘Generating hypotheses’: independent variable <> dependent variable < justification < alternative hypotheses. For “prediction” no prediction of item difficulty could be found in the literature, but we hypothesize this aspect to be more difficult than “independent variable” and “dependent variable” because students tend to think of possible causes first before mentioning a result.
  • ‘Designing Experiments’: independent variable <> dependent variable < confounding variables < test times <> replication.
  • ‘Analyzing Data’: interpretation <> description < certainty <> criticism. For “outlook” no prediction of item difficulty could be found in the literature, but we hypothesize this aspect to be more difficult than description and interpretation.
To compare theory to observed item difficulty, a visual plot of item difficulties was analyzed. The Rasch model allows for the construction of a Wright Map (see Figure 3), using item difficulty (in this case the difficulty of each competence-aspect).
In Figure 3 the difficulties of each competence-aspect are provided and (to maximize the clarity of this figure) only the person abilities mean and standard error are indicated by “M” and “S” on the left-hand side of the scale. The items of the Wright Map are organized as a function of SIC, its sub-competences (“hypothesis”, “design” and “data”) as well as competence aspects (e.g., “independent variable”, “dependent variable” or “justification”). Thus, for example, the test items of the sub-competence of “generating hypotheses” are presented in the first column from the easiest item at the base of the map to the most difficult item at the top of the Wright Map. The item measures used in this Wright Map are Rasch-Thurstone thresholds [66]. The thresholds represent 50% chance of persons at the height of that aspect to be rated at that aspect [60]. This means that a person who has an ability of zero has a 50% probability to be rated 1 at an aspect with threshold zero. For competence aspects with positive measures (e.g., PR2), probabilities decline, for items with negative measures (e.g., AH2), probabilities rise, accordingly. The sub-competence “analyzing data”, on the right side of the map, is evaluated in the same manner. For polytomous aspects (sub-competence “designing experiments” in the middle) there were three different levels of quality (Table S3). The 50% probabilities of being rated at a specific level are represented in the Wright Map. Hence, the competence aspects of the sub-competence “designing experiments” are displayed three times in the map, once for each level. That means that a person who has an ability of zero would have a slightly more than 50% probability of being rated 2 at aspect DV (Dependent Variable) (Level 2), an even greater probability of being rated 1 (Level 1) and a probability less than 50% of being rated 3 (Level 3).
The location of each item threshold for the polytomous items and the location of the right/wrong items (dichotomous items) are informative in terms of evaluating the manner in which the test items define the trait of SIC. Review of the distribution of item difficulties suggest an order from easy to more difficult of item thresholds aligned to theory (the theory that has been postulated by other researchers). This supports the assertion that the instrument items mark and help measure the trait of SIC.
In conclusion, the empirical data of aspect difficulty align with the hypothesized ordering detailed in theory and previous research. This suggests that the variable one is attempting to measure is behaving in a manner matching theory. This match of theory and analysis results (item difficulty) provides evidence of the construct validity of the instrument.

3.3. Reliability and Sensitivity

Reliability is an additional aspect of evaluating an instrument’s quality. Rasch measurement provides reliabilities for both persons and items. Person reliability provides an assessment of the replicability of person ordering, item reliability provides a technique by which the replicability of item ordering can be evaluated [66]. Person reliability (test-reliability; [60]), is analogous to internal consistency coefficients such as Cronbach α and KR-20 [60]. It is a measure of reproducibility [60], hence it represents the probability that the same sample would act in the same way if they were to take a similar test [66,69]. It is computed as “true person variance/observed person variance”, since the “true person variance” cannot be known, Winsteps approximates it using the measure standard errors [60]. One reason for the computation of Rasch reliabilities is that raw data is not assumed to be linear and since traditional reliability coefficients such as Cronbach α and KR-20 use raw data they may be flawed [67]. The Rasch item reliability index has no traditional equivalent and refers to “the ability to define a distinct hierarchy of items along the measured variable and the replicability of item placement within the hierarchy across other samples.” [70] (p. 36). It ranges from 0 to 1. If item reliability is low, the “sample is not big enough to precisely locate the items on the latent variable” [60] (p. 618). Both, reliability estimates for persons and items were calculated.
For this instrument, moderate person reliabilities of 0.68 (model reliability) were observed. According to Linacre [60], Rasch usually underestimates reliability, while Cronbach α overestimates it as can be seen by the Cronbach α of 0.73 also computed by Winsteps. Item reliability was found to be 0.99 which indicates that the item ordering is very reliable.
Additionally, since competence-instrumentation should be usable for measuring development (e.g., in intervention studies a test instrument should be sensitive enough to detect whether an intervention helped foster competences), assessing the instrument’s sensitivity to detect pre-post change remains a crucial validity-issue to explore. Since the unit taught students (see “Sample and Setting”) aimed to foster inquiry competence, one would predict post-test person measures significantly higher than pre-test measures. Hence, a dependent t-test was computed to evaluate differences in person abilities from pre to post intervention.
The statistical analysis suggested that post-test measures (M = 0.18; SE = 0.03) were statistically higher than pre-test measures (M = −0.61; SE = 0.03). The difference in pre and post measures was significant with a large effect size: t(190) = −20.907, p = 0.001, r = 0.83. This large effect size provides evidence supporting the sensitivity of the instrument in the present format.

4. Discussion

This paper aimed to report on the design and evaluation of a Rasch-based measuring of upper secondary students’ SIC in Biology and to discuss its use for research and teaching purposes. The instrument consists of six open-ended items measuring SIC with special emphasis upon experimentation with causal relations (variable-control strategy) with three sub-competences and five aspects for each sub-competence. These aspects were derived from theory. The instrument uses authentic biological contexts which facilitates the presentation of age-adequate items for the upper secondary level.

4.1. Instrument Evaluation

Different psychometric analyses were conducted to evaluate validity and reliability. Item fit was found to be within productive range. The lack of misfitting items provides evidence for the assertion that the items define a unidimensional trait. Additional types of validity were evaluated by considering item-difficulty order and comparing observed item-difficulty order to that which was observed and/or proposed in part in other studies (e.g., [31,32,36,37,41]. Generally, the pattern of item difficulty measure (Figure 3) matches that predicted by the literature theory review.
The values of item reliability suggest that the item ordering observed in the Wright Map gives first insights into reliability. The person reliability values observed are comparable to similar instruments [32,71] and taken into account that the use of open-response items [48] and missing data [60] decrease reliability. There are many issues which impact person reliability and item reliability. Generally, the more items a respondent can answer (when items cover a range of item difficulty) the higher the observed person reliability. Due to the limited number of test items which can be administered to a respondent it is not surprising that the person reliability was that observed in our analysis. Furthermore, the instrument was used in an intervention study and found sensitive enough to detect learning progress from pre to post-test.
The items so far mark a broad range of the latent trait and therefore can serve as a valid measure for the construct. Rasch Analysis allows us now to optimize this instrument. Adding items that further help mark the trait, while not duplicating regions of the trait already measured would help decrease person measurement error. For example, one could add items for generating hypotheses above medium difficulty and items for data analysis of medium difficulty. Additional data collection with added samples of students would allow comparing item ordering as a function of sample. In particular, it would be important to collect data from both higher-ability and lower-ability test takers.

4.2. Potentials Curricula Development and Teaching

The sample of 220 German 11th grade students can generally perform at least at a basic level of inquiry competence (e.g., formulate hypotheses using dependent and independent variables and justification; vary independent variable and observe dependent variable while planning an experiment and describing and interpret results while analyzing data). To move students towards mastery of higher levels of SIC (e.g., ability to formulate hypotheses as predictions, considering test times and replications while planning an experiment or critically evaluating the interpretation of results or the experimental design as well as formulating an outlook while analyzing data) teachers and developers of curricula or standards need to construct evidence-based and student-oriented learning and support material by considering the relative difficulty of “aspects”. We suggest that when evidence proves existence of a trait it is time/cost effective and optimizes learning when teaching is organized from the presentation of easiest topics first, then the more difficult topics. Benjamin Wright of the University of Chicago (personal communication with author, 1989) suggested this movement along a Wright Map (which is built using theory and confirmed through analysis of data) to optimize learning over 20 years ago. We suggest using the progressions detailed in the Wright Map for individual learning agreements (contracts) to help students define their goals for days, weeks, months or even years. We suggest using these results as a starting point for constructing a learning progression of experimentation. Certainly, further empirical information about the development of these “aspects” and hence longitudinal analysis is needed.

4.3. Potentials for Individual Diagnosis and Feedback

Practitioners in schools and teacher educators could use the Wright Map to explicitly teach scientific inquiry competence. Teachers could introduce the theoretical SIC model for important aspects of scientific thinking to students. In doing so (prospective) science teachers have a tool to diagnose students’ performance. We propose that the proposed way of Rasch evaluation facilitates individual diagnosis. Student individual learning status could be compared with the theoretically derived and empirically confirmed distribution pattern of the competence trait. The test items could be used to directly score individual students’ performances in SIC. Knowledge of the differing difficulty steps along a continuum of SIC and being able to compute student measures using the same scale as that used to express item difficulty, enables conducting an individual diagnosis of student standing even for classroom purposes. The data presented in this study provide useful insights into upper secondary students’ SIC and offers guidance to improve the teaching and student learning regarding SIC. By this means, an innovative way is proposed to combine teaching, diagnoses, and empirical assessment with reference to the same base model of theory and helped by Rasch analysis to optimize assessment and diagnosis of learning outcomes.

4.4. Limitations of the Study

We feel that as this assessment is used, and added data sets collected, there can be additional analyses conducted as well as possible new versions of the items developed. Some of the issues outlined below are those which we plan to consider as added analyses with the present instrument in a range of settings. Some of the study limitations concern analysis steps which were taken. To enlarge the data set, the data was “stacked” with each respondent appearing twice in the data set. Some details regarding the analytical steps of stacking (and a related technique of racking) are provided in resources such as [61]. There are some potential limitations with a Rasch stacking approach in certain situations. One requirement of the Rasch model is what is termed independency [68,72,73]. Sample Rasch articles that have used a Rasch stacking technique are [74,75,76,77,78]. Independency can be understood when a respondent attempts to solve an item on a test, that interaction of respondent and item should not impact the chance that the same respondent solves another item on the test. We feel that it is possible as a respondent attempts to solve some items, there might be an impact upon the chances of that same respondent solving other items.
Independency can also be considered from a second angle—namely that the chances of one respondent solving an item should be unrelated to the chances of another respondent solving the same item. As each respondent begins at a certain measure level on the instrument (based upon their responses to the set of items they attempt) at the pre-time point, one could also argue that respondents are not independent of each other. For example, one would predict that a respondent’s pre-measure on the test is related in some manner to the respondent’s post measure. This is a common issue with many tests when pre and post data is collected, analyzed, and interpreted. Due to the issue of independency, it is possible that racking of the data might be explored as well as continued investigation of stacking.
Further studies should also explore in more detail the issue of what is termed Differential Item Functioning (DIF). When DIF is explored, one considers in essence how items mark a trait as a function of sample (for example does that way in which items mark the trait differ for males and females, does the way in the way in which items mark the trait differ as a function of time point). For this, future analyses with broader sample size are needed.

Supplementary Materials

The following are available online at https://www.mdpi.com/2227-7102/8/4/184/s1, Instrument Supplement 1: Test Items to Measure Student Scientific Inquiry Competence in Biology (TOSSIC-B).

Author Contributions

Conceptualization, J.C.A., W.J.B., K.K. and J.M.; Data curation, J.C.A. and W.J.B.; Formal analysis, J.C.A. and W.J.B.; Investigation, J.C.A.; Methodology, J.C.A., W.J.B., K.K. and J.M.; Resources, K.K. and J.M.; Supervision, K.K. and J.M.; Visualization, J.C.A.; Writing—original draft, J.C.A., W.J.B. and J.M.

Funding

This research received no external funding.

Conflicts of Interest

The authors declare no conflict of interest.

Appendix A

Table A1. Overview of modeling scientific inquiry competence (sub-competences and aspects; Arnold, 2015).
Author(s) Beaumont-Walters & Soyibo (2001)Chinn & Malhotra (2002)Dillashaw & Okey (1980) & Burns, Okey & Wise (1985)Fraser (1980)Germann, Aram, & Burke (1996); Germann & Aram (1996a, 1996b)Harwood (2004)Hofstein, Navon, Kipnis, & Mamlok-Naaman (2005)Klahr & Dunbar (1988)Lin & Lehman (1999)Mayer et al. (2008)/ Kremer et al. (2013)Meier und Mayer (2011)Phillips & Germann (2002)Rönnebeck et al. (2016)Tamir, Nussinovitz & Friedler (1982)Temiz, Tasar & Tan (2006)Tobin & Capie (1982)Vorholzer et al. (2016)Wellnitz & Mayer (2013)
Sub-Competences
Aspects
Formulating questions X XXX XXXXXX XX
Dependent variable X X
Independent variable X X
Causal question X X X
Generating hypothesesX X XXXXXXXXXXX XX
Dependent variable X X X X X X
Independent variable X X XX X X X
PredictionX XX X XXXX
Justification X X XXXX X
Alternative hypotheses X X XX
Designing and conducting an experimentXXXXX XXXXXXXXXXXX
Dependent variableXXX X XXXXXXXXXXX
Independent variableXXX X XXX XXXXXXX
Confounding variablesXX X XX X XXXXX
Test times X X
Repetition X XX XX X
Analyzing DataXXXXXXXXXXXXXXXXXX
DescriptionX XX X X XX X
InterpretationXXXXXXXXXXXXXXXXXX
Certainty XX XXX XXX X
Criticism X XXX XXX
Outlook X X XX X X
Note: X means that sub-competence or aspect are considered in these publications.
Table A2. Examples of instruments of SIC (adopted from [36] p. 1010).
SourceInstrumentGrade-LevelTest FormatTest Theory
Beaumont-Walters & Soyibo (2001)Test of integrated Science Process Skills (TISPS)9–10Open-ended (Hands-on)CTT
Dillashaw & Okey (1980) & Burns, Okey & Wise (1985)Test of Integrated Process Skills (TIPS)7–12Multiple-choiceCTT
Fraser (1980)Test of Enquiry Skills (TOES)7–10Multiple-choiceCTT
Germann, Aram & Burke (1996)
Germann & Aram (1996a, 1996b)
Science Process Skills Inventory (SPSI)7Open-ended (Hands-on)CTT
Mayer et al. (2008)Biology in Context (BiK)5–10Open-endedIRT
Nowak et al. (2013)Model of cross-linking scientific inquiry between biology and chemistry (VerE)9–10Multiple-choiceIRT
Tamir, Nussinovitz & Friedler (1982)Practical Tests Assessment Inventory (PTAI)12Open-ended (Hands-on)CTT
Temiz, Tasar & Tan (2006)Multiple format test of science process skills (MFT-SPS)9Open-ended (Hands-on)CTT
Tobin & Capie (1982)Test of Integrated Science Processes (TISP)6–9Multiple-choiceCTT
Vorholzer et al. (2016)Experimantal Thinking and Working Methods Test (EDAWT)11Multiple-choiceIRT
Kremer et al. (2012)Evaluation of National Educational Standards (ESNaS)9–10Multiple-choice, short answers & open-endedIRT
Note: CTT = Classical Test Theory; IRT = Item Response Theory.
Table A3. Partial-Credit Item Rubrics [25].
Aspect
(and level)
Description
Sub-competence: Hypotheses
Dependent VariableThe variable to be observed or measured is named.
Independent variableOne variable that might cause change in the dependent variable is named.
PredictionThe relationship between dependent and independent variable is formulated as a conditional sentence (e.g., using „if” and „then”)
JustificationThe choice of independent variable is justified
Alternative HypothesisAt least one alternative hypothesis/independent variable is named.
Sub-competence: Design
Dependent variableISomething is observed unspecifically without mentioning or operationalizing any specific dependent variable.
IISpecific dependent variable is named, but not operationalized quantitatively.
IIISpecific dependent variable is named and operationalized quantitatively.
Independent variableIIndependent variable is varied without any specification.
IIIndependent variable is varied using qualitative specifications of variation.
IIIIndependent variable is varied using at least one quantitative specifications of variation.
Confounding variablesIGlobal mentioning of controlling confounding variables.
IIOne or two specific confounding variables are named/controlled.
IIIMore than two specific confounding variables are named/controlled.
Test timesIOne specification about test times is given (start, duration or intervals of measurement).
IITwo specifications about test times are given (start and/or duration and/or intervals of measurement).
IIIThree specifications about test times are given (start and duration and intervals of measurement).
RepetitionIPlanning repetition of the test using other objects.
IIPlanning repetition the test using the same object.
IIIPlanning repetition of the test using the same object and other objects.
Sub-competence: Data
DescriptionData is described objectively.
InterpretationData is interpreted with respect to hypothesis.
CertaintyInterpretation is evaluated critically/limited to some extent.
CriticismProcedure is evaluated critically/ideas for improvement are given.
OutlookImplications for further research/further research questions are formulated.

References

  1. Abd-El-Khalick, F.; BouJaoude, S.; Duschl, R.; Lederman, N.G.; Mamlok-Naaman, R.; Hofstein, A.; Niaz, M.; Treagust, D.; Tuan, H.L. Inquiry in Science Education: International Perspectives. Sci. Educ. 2004, 88, 397–419. [Google Scholar] [CrossRef]
  2. Schwartz, R.; Lederman, N.; Crawford, B. Developing views of nature of science in an authentic context: An explicit approach to bridging the gap between nature of science and scientific inquiry. Sci. Educ. 2004, 88, 610–645. [Google Scholar] [CrossRef] [Green Version]
  3. Arnold, J.C.; Kremer, K.; Mayer, J. Understanding Students’ Experiments—What kind of support do they need in inquiry tasks? Int. J. Sci. Educ. 2014, 36, 2719–2749. [Google Scholar] [CrossRef]
  4. DfES/QCA (Department for Education and Skills/Qualification and Curriculum Authority). Science—The National Curriculum for England; HMSO: London, UK, 2004. [Google Scholar]
  5. Kultusminister Konferenz (KMK). Beschlüsse der Kultusministerkonferenz—Bildungsstandards im Fach Biologie für den Mittleren Schulabschluss; Luchterhand: München, Germany, 2005. [Google Scholar]
  6. NRC/National Research Council. National Science Education Standards; National Academy Press: Washington, DC, USA, 1996. [Google Scholar]
  7. NRC/National Research Council. Inquiry and the National Science Education Standards; National Academy Press: Washington, DC, USA, 2000. [Google Scholar]
  8. NGSS Lead States. Next Generation Science Standards: For States. Available online: http://www.nextgenscience.org/next-generation-science-standards (accessed on 12 January 2013).
  9. Beaumont-Walters, Y.; Soyibo, K. An Analysis of High School Students’ Performance on Five Integrated Science Process Skills. Res. Sci. Technol. Educ. 2001, 19, 133–145. [Google Scholar] [CrossRef]
  10. Burns, J.C.; Okey, J.R.; Wise, K.C. Development of an Integrated Process Skill Test: TIPS II. J. Res. Sci. Teach. 1985, 22, 169–177. [Google Scholar] [CrossRef]
  11. Dillashaw, F.G.; Okey, J.R. Test of the Integrated Science Process Skills for Secondary Science Students. Sci. Educ. 1980, 64, 601–608. [Google Scholar] [CrossRef]
  12. Nehring, A.; Nowak, K.H.; zu Belzen, A.U.; Tiemann, R. Predicting Students’ Skills in the Context of Scientific Inquiry with Cognitive, Motivational, and Sociodemographic Variables. Int. J. Sci. Educ. 2015, 37, 1343–1363. [Google Scholar] [CrossRef]
  13. Nehring, A.; Nowak, K.H.; zu Belzen, A.U.; Tiemann, R. Doing Inquiry in Chemistry and Biology—The Context’s Influence on the Students’ Cognitive Load. La Chimica Nella Scuola XXXIV-3 2012, 3, 227–258. [Google Scholar]
  14. Mayer, J.; Wellnitz, N. Die Entwicklung von Kompetenzstrukturmodellen. In Methoden in der Naturwissenschaftsdidaktischen Forschung; Krüger, D., Parchmann, I., Schecker, H., Eds.; Springer: Berlin, Germany, 2014; pp. 19–29. [Google Scholar]
  15. Tamir, P.; Nussinovitz, R.; Friedler, Y. The design and use of a Practical Tests Assessment Inventory. J. Boil. Educ. 1982, 16, 42–50. [Google Scholar] [CrossRef]
  16. Liu, O.L.; Lee, H.-S.; Linn, M.C. Measuring knowledge integration: Validation of four-year assessments. J. Res. Sci. Teach. 2011, 48, 1079–1107. [Google Scholar] [CrossRef]
  17. Stecher, B.M.; Klein, S.P. The cost of Science Performance Assessments in Large-Scale Testing Programs. Educ. Eval. Policy Anal. 1997, 19, 1–14. [Google Scholar] [CrossRef]
  18. Klahr, D.; Dunbar, K. Dual space search during scientific reasoning. Cogn. Sci. 1988, 12, 1–48. [Google Scholar] [CrossRef]
  19. Mayer, J. Erkenntnisgewinnung als wissenschaftliches Problemlösen. In Theorien in der Biologiedidaktischen Forschung; Krüger, D., Vogt, H., Eds.; Springer: Berlin, Germany, 2007; pp. 177–186. [Google Scholar]
  20. Wellnitz, N.; Mayer, J. Modelling and Assessing Scientific Methods. In Proceedings of the Annual Meeting of the National Association of Research in Science Teaching (NARST), Olandor, FL, USA, 3–6 April 2011. [Google Scholar]
  21. Kremer, K.; Fischer, H.E.; Kauertz, A.; Mayer, J.; Sumfleth, E.; Walpuski, M. Assessment of Standard-based Learning Outcomes in Science Education: Perspectives from the German Project ESNaS. In Making It Tangible—Learning Outcomes in Science Education; Bernholt, S., Neumann, K., Nentwig, P., Eds.; Waxmann: Münster, Germany, 2012; pp. 217–235. [Google Scholar]
  22. Osborne, J.; Collins, S.; Ratcliffe, M.; Millar, R.; Duschl, R. What ‘Ideas-about-Science’ Should Be Taught in School Science? A Delphi Study of the Expert Community. J. Res. Sci. Teach. 2003, 40, 692–720. [Google Scholar] [CrossRef]
  23. Bauer, H.H. Scientific Literacy and the Myth of the Scientific Method; University of Illinois Press: Chicago, IL, USA, 1994. [Google Scholar]
  24. McComas, W.F. Ten myths of science: Reexamining what we think we know about the nature of science. Sch. Sci. Math. 1996, 96, 10–15. [Google Scholar] [CrossRef]
  25. Arnold, J.; Kremer, K.; Mayer, J. Wissenschaftliches Denken beim Experimentieren—Kompetenzdiagnose in der Sekundarstufe II. In Erkenntnisweg Biologiedidaktik 11; Krüger, D., Upmeier zu Belzen, A., Schmiemann, P., Möller, A., Elster, D., Eds.; Universitätsdruckerei: Kassel, Germany, 2013; pp. 7–20. [Google Scholar]
  26. Zimmerman, C. The Development of Scientific Reasoning Skills. Dev. Rev. 2000, 20, 99–149. [Google Scholar] [CrossRef]
  27. Harwood, W.S. A New Model for Inquiry—Is the Scientific Method Dead? J. Coll. Sci. Teach. 2004, 33, 29–33. [Google Scholar]
  28. Hofstein, A.; Navon, O.; Kipnis, M.; Mamlok-Naaman, R. Developing students’ ability to ask more and better questions resulting from inquiry-type chemistry laboratories. J. Res. Sci. Teach. 2005, 42, 791–806. [Google Scholar] [CrossRef]
  29. Rönnebeck, S.; Bernholt, S.; Ropohl, M. Searching for a common ground—A literature review of empirical research on scientific inquiry activities. Stud. Sci. Educ. 2016, 52, 161–197. [Google Scholar] [CrossRef]
  30. Vorholzer, A.; von Aufschnaiter CKirschner, S. Entwicklung und Erprobung eines Tests zur Erfassung des Verständnisses experimenteller Denk- und Arbeitsweisen. Z. Für Didakt. Der Naturwiss. 2016, 22, 25–41. [Google Scholar] [CrossRef]
  31. Germann, P.J.; Aram, R.J. Student Performance on Asking Questions, Identifying Variables, and Formulating Hypotheses. Sch. Sci. Math. 1996, 4, 192–201. [Google Scholar] [CrossRef]
  32. Mayer, J.; Grube, C.; Möller, A. Kompetenzmodell naturwissenschaftlicher Erkenntnisgewinnung. In Lehr-und Lernforschung in der Biologiedidaktik; Harms, U., Sandmann, A., Eds.; Studienverlag: Innsbruck, Austria, 2008; pp. 63–79. [Google Scholar]
  33. Phillips, K.A.; Germann, P.J. The Inquiry ‘I’: A Tool for Learning Scientific Inquiry. Am. Boil. Teach. 2002, 64, 512–520. [Google Scholar] [CrossRef]
  34. Lin, X.; Lehman, J.D. Supporting learning of variable control in a computer-based biology environment: Effects of prompting college students to reflect on their own thinking. J. Res. Sci. Teach. 1999, 36, 837–858. [Google Scholar] [CrossRef]
  35. Lawson, A.E. The Generality of Hypothetico-Deductive Reasoning: Making Scientific Thinking Explicit. Am. Boil. Teach. 2000, 62, 482–495. [Google Scholar] [CrossRef]
  36. Temiz, B.K.; Tasar, M.F.; Tan, M. Development and validation of a multiple format test of science process skills. Int. Educ. J. 2006, 7, 1007–1027. [Google Scholar]
  37. Germann, P.J.; Aram, R.; Burke, G. Identifying Patterns and Relationships among the Responses of Seventh-Grade Students to the Science Process Skill of Designing Experiments. J. Res. Sci. Teach. 1996, 33, 79–99. [Google Scholar] [CrossRef]
  38. Tobin, K.G.; Capie, W. Development and Validation of a Group Test of Integrated Science Processes. J. Res. Sci. Teach. 1982, 19, 133–141. [Google Scholar] [CrossRef]
  39. Meier, M.; Mayer, J. Selbständiges Experimentieren: Entwicklung und Einsatz eines anwendungsbezogenen Aufgabendesigns. Mathematisch und naturwissenschaftlicher Unterricht 2014, 67, 4–10. [Google Scholar]
  40. Fraser, B.J. Development and Validation of a Test of Enquiry Skills. J. Res. Sci. Teach. 1980, 17, 7–16. [Google Scholar] [CrossRef]
  41. Germann, P.J.; Aram, R.J. Student Performances on the Science Processes of Recording Data, Analyzing Data, Drawing Conclusions, and Providing Evidence. J. Res. Sci. Teach. 1996, 33, 773–798. [Google Scholar] [CrossRef]
  42. Chinn, C.A.; Malhotra, B.A. Epistemologically authentic inquiry in schools: A theoretical framework for evaluating inquiry tasks. Sci. Educ. 2002, 86, 175–218. [Google Scholar] [CrossRef] [Green Version]
  43. Kuhn, D.; Dean, D. Is developing scientific thinking all about learning to control variables? Psychol. Sci. 2005, 16, 866. [Google Scholar] [CrossRef] [PubMed]
  44. de Jong, T.; van Joolingen, W.R. Scientific discovery learning with computer simulations of conceptual domains. Rev. Educ. Res. 1998, 68, 179–201. [Google Scholar] [CrossRef]
  45. Klahr, D.; Fay, A.L.; Dunbar, K. Heuristics for Scientific Experimentation: A Developmental Study. Cogn. Psychol. 1993, 25, 111–146. [Google Scholar] [CrossRef] [PubMed]
  46. Dunbar, K. Concept Discovery in a Scientific Domain. Cogn. Sci. 1993, 17, 397–434. [Google Scholar] [CrossRef] [Green Version]
  47. Schauble, L.; Glaser, R.; Duschl, R.A.; Schulze, S.; John, J. Students’ Understanding of the Objectives and Procedures of Experimentation in the Science Classroom. J. Learn. Sci. 1995, 4, 131–166. [Google Scholar] [CrossRef]
  48. Hammann, M.; Hoi Phan, T.T.; Ehmer, M.; Grimm, T. Assessing pupils’ skills in experimentation. J. Boil. Educ. 2008, 42, 66–72. [Google Scholar] [CrossRef]
  49. Chen, Z.; Klahr, D. All Other Things Being Equal: Acquisition and Transfer of the Control of Variables Strategy. Child Dev. 1999, 70, 1098–1120. [Google Scholar] [CrossRef] [PubMed] [Green Version]
  50. Duggan, S.; Johnson, P.; Gott, R. A critical point in investigative work: Defining variables. J. Res. Sci. Teach. 1996, 33, 461–474. [Google Scholar] [CrossRef]
  51. Duggan, S.; Gott, R. Intermediate General National Vocational Qualification (GNVQ) Science: A Missed Opportunity for a Focus on Procedural Understanding? Res. Sci. Technol. Educ. 2000, 18, 201–214. [Google Scholar] [CrossRef]
  52. Lubben, F.; Millar, R. Children’s ideas about the reliability of experimental data. Int. J. Sci. Educ. 1996, 18, 955–968. [Google Scholar] [CrossRef]
  53. Roberts, R.; Gott, R. A written test for procedural understanding: A way forward for assessment in the UK science curriculum? Res. Sci. Technol. Educ. 2004, 22, 5–21. [Google Scholar] [CrossRef]
  54. Enger, S.K.; Yager, R.E. The Iowa Assessment Handbook; The Iowa-SS&C Project, The University of Iowa: Iowa City, IA, USA, 1998. [Google Scholar]
  55. Arnold, J. Die Wirksamkeit von Lernunterstützungen beim Forschenden Lernen: Eine Interventionsstudie zur Förderung des Wissenschaftlichen Denkens in der Gymnasialen Oberstufe; Logos: Berlin, Germany, 2015. [Google Scholar]
  56. Roberts, R.; Gott, R. Assessment of Biology Investigations. J. Boil. Educ. 2003, 37, 114–121. [Google Scholar] [CrossRef]
  57. Harlen, W. Purposes and Procedures for Assessing Science Process Skills. Assessment in Education. Princ. Policy Pract. 1999, 6, 129–144. [Google Scholar]
  58. Arnold, J.; Kremer, K. Hilfe für Kannenpflanzen. In Experimentieren Sie! Biologieunterricht mit Aha-Effekt—Selbstständiges, kompetenzorientiertes Erarbeiten von Lehrplaninhalten; Schmiemann, P., Mayer, J., Eds.; Cornelsen: Berlin, Germany, 2013; pp. 26–28. [Google Scholar]
  59. Landis, J.R.; Koch, G.G. The Measurement of Observer Agreement for Categorical Data. Biometrics 1977, 33, 159–174. [Google Scholar] [CrossRef] [PubMed]
  60. Linacre, J.M. Winsteps® Rasch Measurement Computer Program User’s Guide; Winsteps.com: Beaverton, OR, USA, 2015. [Google Scholar]
  61. Wright, B.D. Rack and Stack: Time 1 vs. Time 2 or Pre-Test vs. Post-Test. Rasch Meas. Trans. 2003, 17, 905–906. [Google Scholar]
  62. Baghaei, P. The Rasch Model as a Construct Validation Tool. Rasch Meas. Trans. 2008, 22, 1145–1146. [Google Scholar]
  63. Linacre, J.M. Test Validity and Rasch Measurement: Construct, Content, etc. Rasch Meas. Trans. 2004, 18, 970–971. [Google Scholar]
  64. Boone, W.J.; Staver, J.R.; Yale, M.S. Rasch Analysis in the Human Sciences; Springer: Dordrecht, The Netherlands, 2014. [Google Scholar]
  65. Boone, W.J.; Scantlebury, K. The Role of Rasch Analysis When Conducting Science Education Research Utilizing Multiple-Choice Tests. Sci. Educ. 2006, 90, 253–269. [Google Scholar] [CrossRef]
  66. Bond, T.G.; Fox, C.M. Applying the Rasch Model—Fundamental Measurement in the Human Sciences, 2nd ed.; Routledge: New York, NY, USA, 2012. [Google Scholar]
  67. Kremer, K.; Specht, C.; Urhahne, D.; Mayer, J. The relationship in biology between the nature of science and scientific inquiry. J. Biol. Educ. 2013, 48, 1–8. [Google Scholar] [CrossRef]
  68. Wright, B.D.; Stone, M.H. Best Test Design—Rasch Measurement; MESA Press: Chicago, IL, USA, 1979. [Google Scholar]
  69. Boone, W.; Rogan, J. Rigour in quantitative analysis: The promise of Rasch analysis techniques. Afr. J. Res. SMT Educ. 2005, 9, 25–38. [Google Scholar] [CrossRef]
  70. Fox, C.M.; Jones, J.A. Uses of Rasch Modeling in Counseling Psychology Research. J. Couns. Psychol. 1998, 45, 30–45. [Google Scholar] [CrossRef]
  71. Nowak, K.H.; Nehring, A.; Tiemann, R.; zu Belzen, A.U. Assessing students’ abilities in processes of scientific inquiry in biology using a paper-and-pencil test. J. Boil. Educ. 2013, 47, 182–188. [Google Scholar] [CrossRef]
  72. Wright, B.D.; Masters, G.N. Rating Scale Analysis; MESA Press: Chicago, IL, USA, 1982. [Google Scholar]
  73. Andrich, D. Rasch Models for Measurement. Quantitative Applications in the Social Sciences; Sage Publications: Thousand Oaks, CA, USA, 1988. [Google Scholar]
  74. Combrinck, C.; Scherman, V.; Maree, D. Evaluating anchor items and reframing assessment results through a practical application of the Rasch measurement model. S. Afr. J. Psychol. 2017, 47, 316–329. [Google Scholar] [CrossRef]
  75. Cunningham, J.D.; Bradley, K.D. Applying the Rasch model to measure change in student performance over time. In Proceedings of the American Educational Research Association Annual Meeting, Denver, CO, USA, 30 April–4 May 2010. [Google Scholar]
  76. Doyle, P.J.; Hula, W.D.; McNeil, M.; Mikolic, J.M.; Mathews, C. An application of Rasch analysis to the measurement of communicative functioning. J. Speech Lang. Hear. Res. 2005, 48, 1412–1428. [Google Scholar] [CrossRef]
  77. Lundgren-Nilsson, A.; Tennant, A.; Grimby, G.; Sunnerhagen, K.S. Cross-diagnostic validity in a generic instrument: An example from the functional independence measure in Scandinavia. Health Qual. Life Outcomes 2006, 23, 4–55. [Google Scholar]
  78. Miller, K.J.; Slade, A.L.; Pallant, J.F.; Galea, M.P. Evaluation of the psychometric properties of the upper limb subscales of the motor assessment scale using a Rasch analysis model. J. Rehabil. Med. 2010, 42, 315–322. [Google Scholar] [CrossRef] [PubMed] [Green Version]
Figure 1. Overview of Sub-Competences and Competence Aspects of Scientific Inquiry Competence (SIC).
Education 08 00184 g001
Figure 2. Sample test item “Pitcher Plants”; sub-competence “hypothesis” ([58]; translated).
Education 08 00184 g002
Figure 3. Wright Map of competence aspects. The Wright Map presents the item difficulty ordering of each item as a function of “aspect”. For example, JU1 is used to indicate the difficulty of the aspect “justification of hypothesis” for a specific context, which we name context “1”. JU2 presents the item difficulty for the same aspect but for a different context, which we name “2”. This coding allows a review of the Wright Map as a function of aspect difficulty and context. Note. Hypotheses: IV = Independent Variable, DV = Dependent Variable, JU = Justification, AH = Alternative Hypotheses, PR = Prediction; Design: IV = Independent Variable, DV = Dependent Variable, CV = Confounding Variables, TT = Test Times, RE = Replication; Data: DE = Description, IN = Interpretation, CE = Certainty, CR = Criticism, OU = Outlook, Contexts: 1 = Enzymes, 2 = Other.
Education 08 00184 g003
Table 1. Overview of Items.
Sub-CompetenceItems (Context)
HypothesisPitcher Plant (Ecology); Apple Juice (Enzymology)
DesignDummy Experiment (Ethology); Food Preservation (Enzymology)
DataNicotine (Neurophysiology); Fever (Enzymology)
Table 2. Item/Aspect statistics.
Item ContextMeasureErrorInfit MNSQOutfit MNSQMeasureErrorInfit MNSQOutfit MNSQ
EnzymesOther
Min.−4.290.050.940.66−5.150.060.840.64
Max.3.640.381.071.844.050.581.151.22
Mean0.150.161.021.05−0.150.170.990.95

