Abstract
Education, together with science and technology, is the main driver of the progress and transformations of a country. The use of new technologies of learning can be applied to the classroom. Computer learning supports meaningful and long-term learning. Therefore, in the era of digital society and environmental issues, a relevant role is provided by open source software and free data that promote universality of knowledge. Earth observation (EO) data and remote sensing technologies are increasingly used to address the sustainable development goals. An important step for a full exploitation of this technology is to guarantee open software supporting a more universal use. The development of image processing plugins, which are able to be incorporated in Geographical Information System (GIS) software, is one of the strategies used on that front. The necessity of an intuitive and simple application, which allows the students to learn remote sensing, leads us to develop a GIS open source tool, which is integrated in an open source GIS software (QGIS), in order to automatically process and classify remote sensing images from a set of satellite input data. The application was tested in Vila Nova de Gaia municipality (Porto, Portugal) and Aveiro district (Portugal) considering Landsat 8 Operational Land Imager (OLI) data.
1. Introduction
Inclusive and equitable quality education, and lifelong learning opportunities for citizens are major sustainable development goals to face planetary changes [1]. Education, together with science and technology, is the main driver of progress and transformations of a country [2]. In the engineer area, the professionals can play an important role in industry or in teaching classes as supervisors or mentors. The use of new technologies of learning can be applied to the classroom. This type of interaction increases the motivation in the classrooms [3]. Consequently, computer learning supports meaningful and long-term learning [3]. Therefore, in the era of digital society and environmental issues, a relevant role is provided by open source software and free data that promote universality of knowledge [4]. In this context, Earth Observation (EO) data, remote sensing and Geographical Information Systems (GIS) technologies are crucial to monitor and support the management of natural environment [5]. However, their use to track progress towards global and national targets is still restricted by limited access to open learning and technology [6].
The implementation of open source software in teaching classes allows students to apply different methods and different experimental approaches and share them with other users. This contribute to scientific progress is only possible with the access to unlimited free and open source software [7].
In the education domain, both proprietary and open source GIS software are equally important. Open source software has recently become a stronger player in the GIS field, since it can be accessed, used or modified by their users or developers [8]. Moreover, as proprietary software, it allows exploring the individual GIS functions, such as database management, web mapping, remote sensing data and spatial analysis. However, the license costs, the software technical support and the sustainability are the main differences between open source and proprietary software. In the purpose of GIS/remote sensing classes, both are relevant. The proprietary solutions ensure a professional technical support; and the open source solutions are free, so the students can install and use them in their personal computers, and also have the possibility to modify and distribute the application. The development of System for Automated Geo-Scientific Analyses (SAGA GIS), Geographic Resources Analysis Support System (GRASS GIS) and QGIS are great examples [9,10,11]. In particular, QGIS software is a significant contributor to the use of EO data and on-line support, e.g., tutorials, forums and code platforms, because of its easy and intuitive use [12].
The development of open source image processing plugins and their inclusion in new capabilities/functionalities in a GIS environment has been the main strategy to tackle inclusiveness in the use of EO data. Plugin development is increasing, and several studies presented different applications/tools with specific objectives in multidisciplinary areas [13,14,15,16,17,18,19,20,21,22]. For instance, Garcia-Haro et al. [23] present a teaching tool, which has been designed to enhance the learning in remote sensing. This software is implemented in Interactive Data Language (IDL) language and it is composed of a modular Graphic User Interface (GUI). This tool has been designed in support of remote sensing teaching activities in the University of Valencia. The GUI allows the students to generate several synthetic images that imitate complex ecosystems with several types of trees and shrubs.
EO data are usually used in several teaching areas, such as geology, climate, biology and environment [24,25]. Some open source remote sensing applications are available for that purpose: (i) SAGA GIS software contains a rich library grid, imagery and terrain processing modules [26]; (ii) Orfeo Toolbox (OTB) has a complete image processing library for high spatial resolution data, such as radiometry, Principal Component Analysis (PCA), change detection, pan-sharpening, image segmentation, classification and filtering [27]; (iii) GRASS GIS software contains functions to classification, PCA, edge detection, radiometric corrections, 3 Dimensions (3D) geostatistics analysis and filtering options [28]; (iv) pktools are a suite of utilities written in C++ for image processing with a focus on remote sensing applications, relying on the GDAL and OGR [29]; and (v) the Semi-Automatic Classification Plugin (SCP) composed of several functions for optical images processing, which is a powerful package for QGIS software [30].
In image pre-processing and classification, the SCP, developed by Luca Congedo for QGIS, is particularly interesting. It allows semi-automatic classification through a set of supervised classification algorithms for remote sensed images, the calculation of vegetation indices, such as the Normalized Difference Vegetation Index (NDVI) and Enhanced Vegetation Index (EVI), and other image operations, such as the automatic conversion to surface reflectance for different sensors and Region Of Interest (ROI) creation. It also processes data from Landsat, Sentinel-2A, Advanced Spaceborne Thermal Emission and Reflection Radiometer (ASTER) and Moderate Resolution Imaging Spectroradiometer (MODIS).
QGIS software provides some of the tools required to manipulate and analyze remote sensed imagery in Processing Toolbox external algorithms (GRASS, SAGA or OTB). However, these tools are dispersed in the software, and some of them don’t exist as a single tool (Table 1). A drawback is the manual intervention required to run each single tool, which may be a barrier for non-experts. All operations gathered in a unique application could therefore help to overcome this barrier. The inclusion of the possibility of histogram visualization, filter application, assessment of different image correction techniques, unsupervised classification, and computation of several environmental indices can be a relevant contribution to image processing functionalities in QGIS software. Compared to the SCP plugin, Processing Image To Geographical Information System (PI2GIS) has the advantage of combining a set of image processing procedures in a unique tool. Moreover, the steps to process a satellite image are sequentially implemented/presented in PI2GIS.

Table 1.
Image processing functionalities available in QGIS.
The main objective of this work was to contribute to the use of EO data in GIS environment in university teaching courses by creating the PI2GIS, including a new set of image processing operations. This application was implemented in QGIS software using the Python programming language, and it can be divided into three groups of operations: pre-processing, processing, and classification. This application is composed of: (i) creation and histogram visualization; (ii) low, median and high filter application; (iii) atmospheric corrections; (iv) contrast and brightness corrections, including histogram equalization; (v) unsupervised classification algorithm, specifically K-means algorithm; and (vi) the computation of Normalized Difference Water Index (NDWI) in addition to NDVI and EVI. Two Landsat 8 OLI images from Vila Nova de Gaia (VNG) and Aveiro were used to test the application.
2. Methodology
2.1. The PI2GIS Application
PI2GIS was created in the open source QGIS software (version 2.18), licensed by GNU General Public License (GPL), developed in Python language (Python 2.7) and could be installed easily using Plugins menu presented in QGIS software [31,32]. QGIS was chosen to develop the application, since it has an Application Programming Interface (API) and Python libraries, such as QGIS API, PyQt4 API and GDAL/OGR library, which support plugin development [33,34,35]. In order to extract valuable information from EO satellite data, pre-processing and classification steps are essential. Under this circumstance, several operations should be employed: (i) color composite, which consists of a band combination, and it can be false color composite or true color composite; (ii) image enhancement, consisting of the contrast or brightness adjustment, so that the image can be efficiently displayed; (iii) spatial filtering to emphasize some image features; and (iv) image classification in order to group the pixels in land cover classes. The application interacts with the user through three main modules: pre-processing, processing, and classification accessed through a graphic interface and presented individually hereafter. Figure 1 shows the PI2GIS plugin workflow considering all operations involved in the three module groups. The GUI was created with Qt Designer, which is a tool that allows the design and build of GUI (Figure 2) [36].
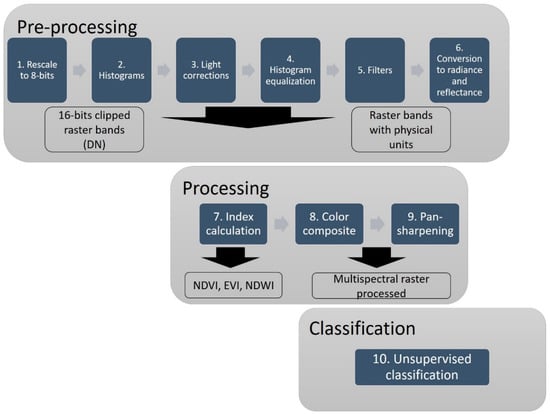
Figure 1.
PI2GIS workflow.
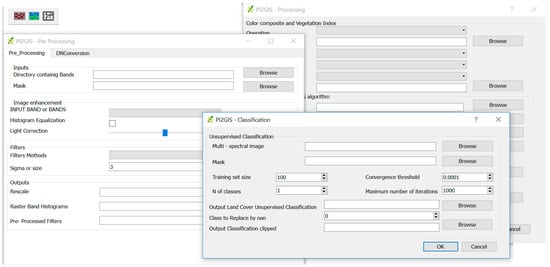
Figure 2.
PI2GIS graphic interface.
2.1.1. PI2GIS Pre-Processing Module
The Pre-processing module allows data rescaling, image enhancement, radiometric conversion and atmospheric correction. The graphic interface was composed of two tabs: Pre-processing and conversionDN. The Pre-processing tab allows users to deal with image noise by analyzing histograms and enabling the application of histogram equalization or filters. Band histograms were implemented through the function hist and created a histogram per image band stored in 8-bits format. To implement this functionality, the Matplotlib, a plotting library for Python was used [37].
In order to reduce the image noise, a group of three operations are available: Light correction, Histogram equalization and Filter methods. These operations can be applied to a single band or to all bands (selected through a combo box). The Light correction option allows applying brightness corrections with the support of the widget QSlider [34]. By moving the slider, it is possible to increase or decrease the brightness, considering the range between −200 and +200. The results are automatically visualized in the QGIS interface through Preview button. The Histogram equalization option allows improving the image contrast (in 8-bits) and it is implemented with the support of QcheckBox widget [34]. This method flattens the grey level histogram of an image in order to equalize all intensities with the aim to normalize image intensity. This transform function is, in this case, a Cumulative Distribution Function (CDF) of the pixel in the image (normalizes the range of pixel values to the desire range). The CDF was applied using the cumsum() function from Numpy library [38]. To normalize the data, Equation (1) was applied:
(255 × CDF)/CDF[−1]
Different types of filters (median, low pass and high pass) were implemented. A median filter is a non-linear filter that allows smoothing the images. This filter is based on a moving-window (matrix), typically with 3 × 3 size, which moves along the image and recalculates the pixel values by taking the pixels median value. In this application, the median_filter function, from Scipy library (version 0.19), was used considering a moving-window of 3 × 3 by default [38]. A low pass filter is a linear filter that smooths the image by removing high frequencies and keeping the low frequencies. Gaussian_filter, also from Scipy library, with a sigma value of 3, was considered by default (standard deviation for Gaussian Kernel) [38]. A high pass filter was also implemented for contour detection, and it consisted of subtracting the original values of pixels by the values obtained in the low pass filter. It was also based on Gaussian_filter, but, in the end, the result was obtained from the subtraction of the original image by the Gaussian filter result.
The conversionDN tab was intended to perform a conversion from Digital Numbers (DN) to radiance or reflectance considering or not the atmospheric correction (16-bits). In conversionDN, a for loop defined in a specific directory was used. The bands 1 to 8 of Landsat 8 OLI image are required as input. This function was inspired on a code obtained from GitHub, which uses GDAL and Numpy libraries, and all the rescaling factors were based on Landsat 8 Data Users Handbook [39,40,41,42]. To perform the DN to Top-Of-Atmosphere (TOA) reflectance conversion, the function calls and reads the metadata file (MTL) available in text format, and uses the line.split function (from Python library [32]) to create a dictionary, which links the Landsat 8 band number and the value in the MTL variable for each specific band.
The effects of the atmosphere must be considered to obtain surface reflectance. Therefore, due to the easy computation, the Dark-Object-Subtraction-1 (DOS1) atmospheric correction algorithm was chosen and implemented to improve the estimation of land surface reflectance [43]. The DOS1 is an image-based atmospheric correction defined by Chavez (1996) as follows: “basic assumption is that within the image some pixels are in complete shadow and their radiances received at the satellite are due to atmospheric scattering (path radiance)” [43]. The code implemented was based on the SCP manual [30].
2.1.2. PI2GIS Processing Module
The Processing group includes color composite, vegetation index calculation and multi-spectral resolution improvement (pan-sharpening) operations. The Processing button allows performing a color composite scene followed by pan-sharpening in order to improve spatial resolution. To perform the pan-sharpening, two tools from OTB were implemented: Superimpose sensor and Pan-sharpening Ratio Component Substitution (RCS) [27]. The pan-sharpening is a process of merging the panchromatic band with the multispectral bands to create a single high-resolution color image [27]. Different algorithms can be applied. The spatial resolution of input data is one of the major factors that influence the algorithm choice [44]. For instance, Landsat 8 can be combined with Sentinel 2 data for long-term high-frequency monitoring [45]. The Superimpose performs the projection of an image into the geometry of another one with the same extension [27]. The Processing module also allows the calculation of different environmental indices focusing vegetation and water components: NDVI, EVI and NDWI [46,47,48]. In the graphic interface, a combo box was created with four options: color composite, NDVI, NDWI and EVI. In order to create the color composite, the gdalogr:merge, algorithm from GDAL library was used [35]. The vegetation indices (Equations (2)–(4)) were implemented through gdalogr:rastercalculator, which was an algorithm from GDAL library:
where NIR, RED, BLUE and GREEN are the near-infrared reflectance surface, red reflectance surface, blue reflectance surface and green reflectance surface, respectively; L (L = 1) is a canopy background adjustment term; C1 (C1 = 6) and C2 (C2 = 7.5) are the coefficients of the aerosol resistance term and G is a gain or scale factor (G = 2.5) [46].
NDVI = (NIR − RED)/(NIR + RED)
EVI = G × (NIR − RED)/(NIR + C1 × RED − C2 × BLUE + L)
NDWI = (GREEN − NIR)/(GREEN + NIR)
2.1.3. PI2GIS Classification Module
The Classification group was defined with the aim to perform an unsupervised classification with the color composition image obtained from the Processing group. The Classification button incorporates the K-means algorithm available in the OTB library, which has the advantage of not requiring the definition of training classes [27]. K-means is an unsupervised classification algorithm that solves the clustering problem. Clustering is the process of finding a structure in a collection of unlabeled data by organizing objects, of which members are similar in some way. K-means is an algorithm, which slits the image into different clusters of pixels in the feature space, and each of them defined by its center and pixel is allocated to the nearest cluster [49]. In this interface, it is necessary to define a set of parameters which are existent in the OTB algorithm: training set size (clusters size, value 100 by default) is part of the original image that is used to train the model, the convergence threshold (value 0.0001 by default) is assessed when the K-means algorithm has converged on a good solution and should be stopped, the maximum number of iterations (value 1000 by default) and the number of classes. To support the definition of those parameters, the widgets QspinBox and QdoubleSpinBox were used [34]. The input image is the resulting multispectral high-resolution image from the pan-sharpening process obtained through RCS. As a result of the unsupervised classification, several classes were defined according to their spectral properties. The algorithm considered Nodata values as a class. To remove the Nodata values, the gdalwarp was used [35].
2.2. Demonstration of PI2GIS
Dataset and Study Area
A satellite scene from the Landsat 8 OLI (date: 22 July 2016; path: 204, Row 32), delivered in tiff format (16 bits) by the Earth Explorer—U.S. Geological Survey [50] and projected on Universal Transverse Mercator (UTM)-WGS84 29N (EPSG: 32,629), was used to demonstrate the applicability and evaluate PI2GIS performance. The scene was re-projected to the official Portuguese coordinate system Portugal Transverse Mercator 2006—European Terrestrial Reference System 1989 (PTTM06—ETRS89, EPSG: 3763). The municipality of VNG (168 km2) and Aveiro district (2800 km2) are located in Northwest Portugal (Figure 3). The VNG municipality belongs to Porto district and is mainly occupied by urban, industrial and rural land uses. The elevation ranges from a sea level to 261 m with rugged terrain. Aveiro district is characterized by flat terrain with the majority of the territory above 100 m of altitude and the coast with about 40 km width in the South.
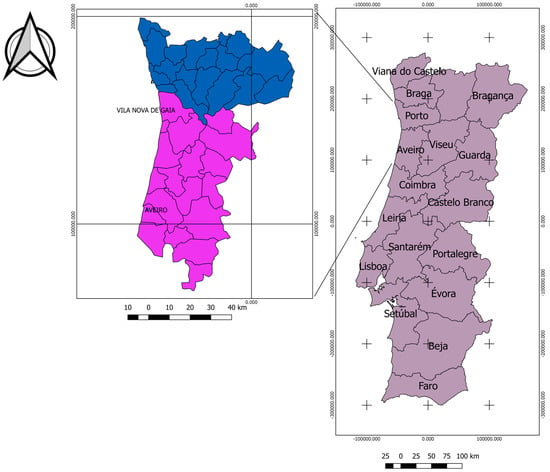
Figure 3.
VNG and Aveiro location.
3. Results
3.1. Pre-Processing Module
To test the Pre-processing group, the band 2 (B2-blue band) of Landsat 8 OLI image was selected. In this group, the images were rescaled from 16-bits to 8-bits. Then, the histogram for each band was created. The histogram creation was easy, and the user only needed to choose one band or all the bands. The histograms were created and immediately shown, in addition to being saved in a specific chosen folder. Figure 4 presents the B2 histogram for each study area.
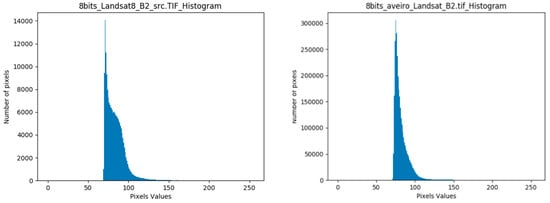
Figure 4.
Histogram of Landsat B2 from VNG (left) and Aveiro (right).
The histogram equalization was also tested, as well as all the filter types. Figure 5 presents the comparison between (a) the original 8-bits image, (b) with the image resulted from the histogram equalization, examples of (c) increasing brightness, (d) a low pass filter, (e) a median pass filter and (f) a high pass filter.
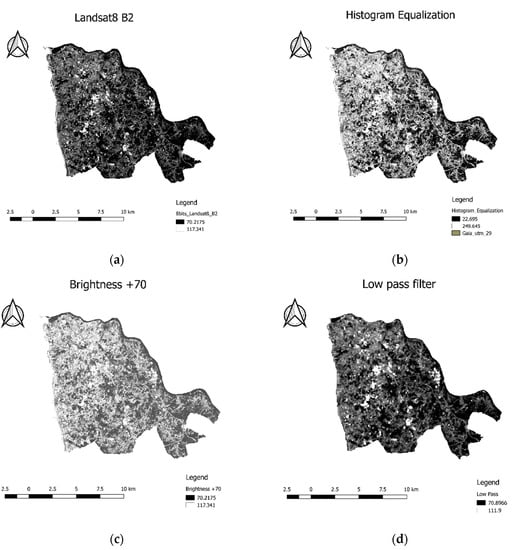
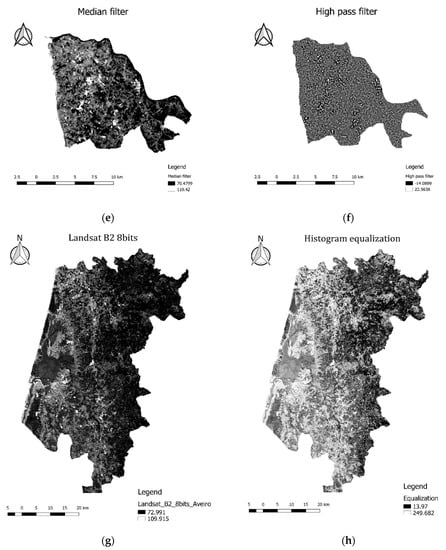
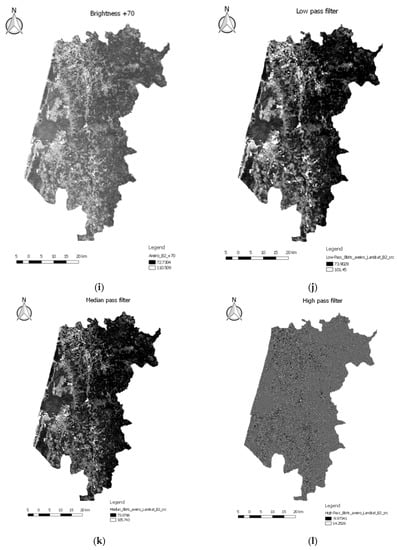
Figure 5.
(a) Landsat B2; (b) histogram equalization of Landsat B2; (c) Landsat B2 with increasing brightness; (d) Landsat B2 with a low pass filter applied; (e) Landsat B2 with a medium pass filter applied; (f) Landsat B2 with a high pass filter applied to VNG; and (g–l) the same procedures applied to Aveiro district.
A zoom was applied considering the low pass filter application to VNG. Figure 6 illustrates the differences between the original B2 image and the image after the filter application. As expected, by analyzing Figure 6, it is possible to verify a smoothing effect.
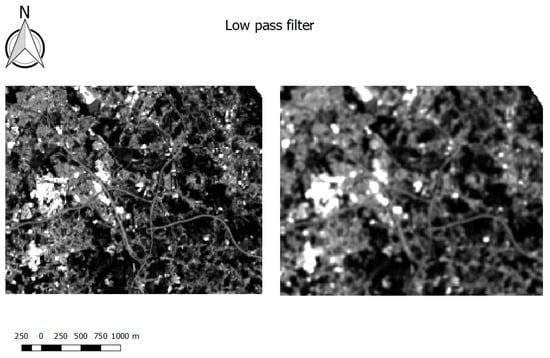
Figure 6.
Zoom before- (left) and after-the application (right) of the low pass filter.
3.2. Processing Module
In the Processing group, RGB composite, NDVI, EVI and NDWI were generated (Figure 7). NDVI and EVI presented higher values in the spring and summer season. The image considered was obtained in July 2016. EVI presented lower values compared to NDVI, as EVI corrected some distortions in the reflected light caused by the particles in the air, as well as the ground cover below the vegetation [50]. NDWI was designed to maximize the reflectance of water. Thus, Douro River and several water bodies were easily identified.
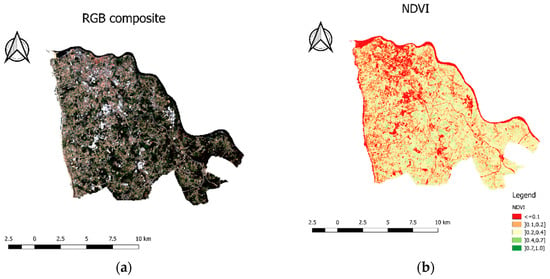
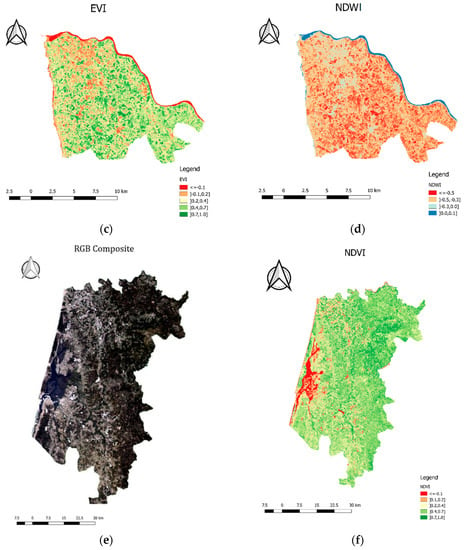
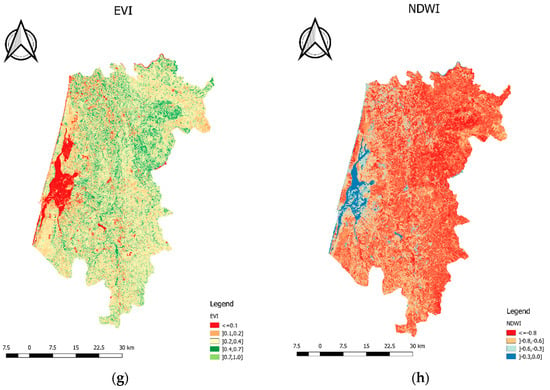
Figure 7.
(a) RGB composite; (b) NDVI map; (c) EVI map; (d) NDWI map applied to VNG; and (e–h) the same procedures applied to Aveiro.
After obtaining the indices, the pan-sharpening functionality was tested. Figure 8 illustrates before and after pan-sharpening operation for VNG. The input files used were the multispectral image obtained using the color composite tool with 30 m of spatial resolution and the panchromatic band with 15 m of spatial resolution. By mere visual inspection, it is possible to identify the differences between the original multispectral lower-resolution image (30 m) and the pan-sharpening (15 m) image obtained by merging the original bands with the high-resolution panchromatic band.
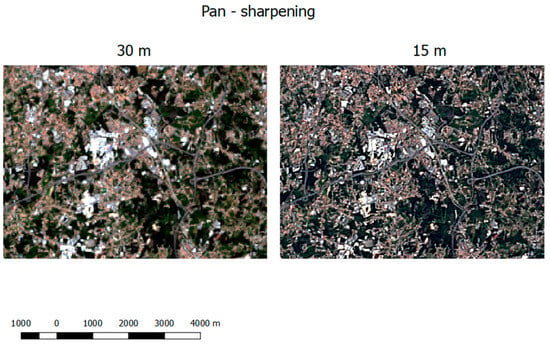
Figure 8.
Pan-sharpening example.
3.3. Classification Module
The classification module was tested by performing an unsupervised classification, considering the K-means algorithm and the RGB combination (RGB543) as input (Figure 9). In the false color composition, the vegetation regions are displayed in red (Figure 9). Unsupervised classification is the only classification option available in the current version of PI2GIS (Figure 10).
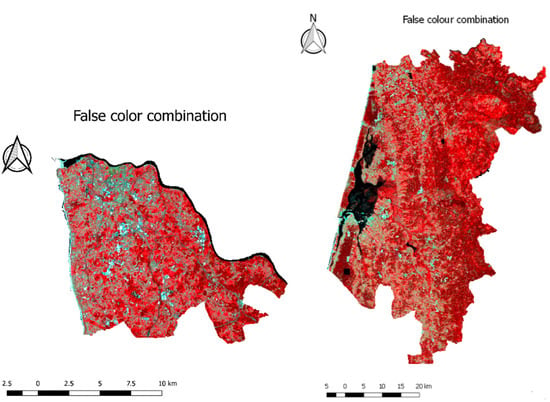
Figure 9.
False color combination (RGB543) for VNG (left) and Aveiro (right).
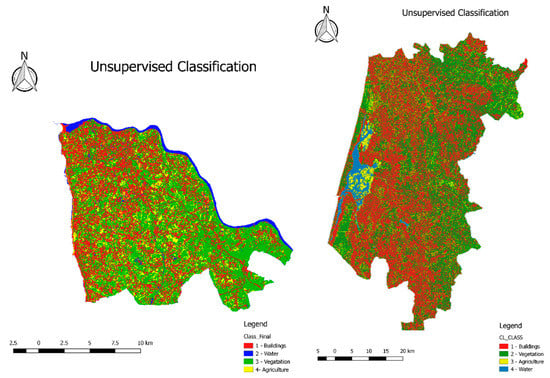
Figure 10.
Unsupervised classification for VNG (left) and Aveiro (right).
4. Discussion and Conclusions
This study proposed PI2GIS, a new plugin, as an integrated and friendly open source tool to process satellite imagery in QGIS, an open source environment. PI2GIS was created as a new tool to support the remote sensing course at an university level, and it can be a useful contribute to the easy and modern education, since it was developed under the open source concept and it is expected to be simpler to use than other remote sensing software, considering the positive feedback given by the master degree students that have already tested it. PI2GIS emerged as a new teaching tool to improve the usage of EO data. The usage of new technologies, such as open source software, can stimulate the students to gain responsibility in their profession of engineers, to work independently with new modern tools, and to apply and adapt their knowledge to unexpected new situations, such as the necessity to create a new application (e.g. PI2GIS). This work provides two approaches in new learning methods: the possibility of development of GIS open source applications and the use of these new tools in the classroom. PI2GIS has been tested with a few Master Degree students in remote sensing, who verified the limitations and drawbacks of the tool, and gave us the feedback. Moreover, the application was already improved. In the future, PI2GIS will be used in the remote sensing Master Degree classes.
PI2GIS was developed to reduce barriers considering high education in environmental sciences and more specifically in the use of GIS and remote sensing data to monitoring environmental change. A free and open source tool for basic remote sensing operations, available everywhere, also in less developed countries, can be a great contribution to equity issues, and will help to prepare young generations for environmental changes.
PI2GIS is available in www.fc.up.pt/pessoas/liaduarte/PI2GIS.rar. The attempt was to contribute to inclusive and equitable education and lifelong learning on environmental management and sustainable development, since this application can be used in remote sensing classes, in which some of the students are not familiar with remote sensing specific software. Therefore, a tool composed of the main processing image algorithms can be very useful to teach the main steps of satellite image processing.
The plugin modules were individually tested and PI2GIS can be considered operational. All expected outputs were created correctly with Landsat-8 satellite imagery data, and VNG municipality and Aveiro district were chosen to test the application. Therefore, the user-friendly interface of PI2GIS is a valid option to open learning and technology to monitoring and management of natural environment. Furthermore, PI2GIS takes advantage of all the GIS and remote sensing algorithms presented in the Processing Toolbox. Therefore, in terms of the user profile of PI2GIS, this can be a great advantage. In addition, the easiness in the creation or/and improvement of applications, such as PI2GIS, enhanced its performance. PI2GIS is not only a plugin with a set of QGIS algorithms. PI2GIS includes several procedures that are not so intuitive when QGIS is used.
Certainly, PI2GIS will be improved in the future, adding new functionalities and considering the feedback given by the users. For instance, in the Pre-processing group, the data processing, such as the transformation to PTTM06—ETRS89 (EPSG: 3763) or any other coordinate system, could be included. Further enhancement methods to improve contrast could also be included, such as optimal linear transformation or Gama correction. Furthermore, PI2GIS intended to process Sentinel-2 images. The calculation of other indices, such as Soil Moisture Index (SMI) and ISODATA method for unsupervised classification, are also being implemented in PI2GIS.
This work proposed PI2GIS as an open integrated and user-friendly remote sensing application implemented in QGIS software to remote sensing imagery analysis. The integration and releasing of remote sensing imagery operations through a user-friendly interface may constitute an added value of PI2GIS, regarding sparse open solutions available to deal with imagery processing in a GIS environment. The open access of PI2GIS contributes towards the millennium sustainable development goals, including access to equitable quality education and lifelong learning opportunities for citizens. PI2GIS can contribute to the quality of education by simplification of the usage remote sensing data in a GIS environment in environmental management and teaching. The graphic interface is very friendly, especially to non-familiarized users with GIS/remote sensing software, so the basic remote sensing data can be generated and interpreted. PI2GIS aims to contribute and not to invalidate existing GIS/remote sensing tools.
Author Contributions
R.C., A.C.T. and L.D. conceived and designed the experiments; R.C. performed the experiments; A.C.T. and L.D. analyzed the data; A.M. contributed reagents/materials/analysis tools; R.C., A.C.T., L.D. and A.M. wrote the paper.
Conflicts of Interest
The author declares no conflicts of interest.
References
- United Nations, Economic and Social Council. Progress towards the Sustainable Development Goals Report of the Secretary-General. 2017. Available online: https://unstats.un.org/sdgs/files/report/2017/secretary-general-sdg-report-2017--EN.pdf (accessed on 15 March 2018).
- Zaldívar-Colado, A.; Alvarado-Vázquez, R.I.; Rubio-Patrón, D.E. Evaluation of Using Mathematics Educational Software for the Learning of First-Year Primary School Students. Educ. Sci. 2017, 7, 79. [Google Scholar] [CrossRef]
- Conradty, C.; Bogner, F.X. Hypertext or Textbook: Effects on Motivation and Gain in Knowledge. Educ. Sci. 2016, 6, 29. [Google Scholar] [CrossRef]
- Khan, A.W. Universal Access to Knowledge as a Global Public Good. Global Economic Symposium, 2009. Available online: https://www.globalpolicy.org/social-and-economic-policy/global-public-goods-1-101/50437-universal-access-to-knowledge-as-a-global-public-good.html (accessed on 15 March 2018).
- Bush, A.; Sollmann, R.; Wilting, A.; Bohmann, K.; Cole, B.; Balzter, H.; Martius, C.; Zlinszky, A.; Calvignac-Spencer, S.; Cobbold, C.A.; et al. Connecting Earth observation to high-throughput biodiversity data. Nat. Ecol. Evol. 2017, 1, 0176. [Google Scholar] [CrossRef] [PubMed]
- Doldirina, C. Open Data and Earth Observations. The Case of Opening up Access to and Use of Earth Observation Data through the Global Earth Observation System of Systems. Open Data Earth Obs. 2015, 6, 73. Available online: https://www.jipitec.eu/issues/jipitec-6-1-2015/4174/doldirina.pdf (accessed on 15 March 2018).
- Rocchini, D.; Petras, V.; Petrasova, A.; Horning, N.; Furtkevicova, L.; Neteler, M.; Leutner, B.; Wegmann, M. Open data and open source for remote sensing training in ecology. Ecol. Inform. 2017, 40, 57–61. [Google Scholar] [CrossRef]
- Tsou, M.-H.; Smith, J. Free and Open Source Software for GIS Education. Department of Geography, San Diego State University, 2011. Available online: http://www.geotechcenter.org/uploads/2/4/8/8/24886299/tsou_free-gis-for-educators-whitepaper-final-draft-jan281.pdf (accessed on 21 November 2017).
- Di Palma, F.; Amato, F.; Nolè, G.; Martellozzo, F.; Murgante, B. A SMAP Supervised Classification of Landsat Images for Urban Sprawl Evaluation. ISPRS Int. J. Geo-Inf. 2016, 5, 109. [Google Scholar] [CrossRef]
- Huth, J.; Kuenzer, C.; Wehrmann, T.; Gebhardt, S.; Tuan, V.Q.; Dech, S. Land Cover and Land Use Classification with TWOPAC: Towards Automated Processing for Pixel—And Object-Based Image Classification. Remote Sens. 2012, 4, 2530–2553. [Google Scholar] [CrossRef]
- Usha, M.; Anitha, K.; Iyappan, L. Landuse Change Detection through Image Processing and Remote Sensing Approach: A Case Study of Palladam Taluk, Tamil Nadu. Int. J. Eng. Res. Appl. 2012, 2, 289–294. [Google Scholar]
- QGIS Development Team. QGIS Geographic Information System. Open Source Geospatial Foundation Project, 2017. Available online: https://www.qgis.org/en/site/ (accessed on 21 November 2017).
- Becker, D.; Willmes, C.; Bareth, G.; Weniger, G.-C. A plugin to interface openmodeller from QGIS for species’ potential distribution modelling. ISPRS Ann. Photogramm. Remote Sens. Spat. Inf. Sci. 2016, 3, 251–256. [Google Scholar] [CrossRef]
- Jiang, Y.; Sun, M.; Yang, C. A Generic Framework for Using Multi-Dimensional Earth Observation Data in GIS. Remote Sens. 2016, 8, 382. [Google Scholar] [CrossRef]
- Jung, M. LecoS—A python plugin for automated landscape ecology analysis. Ecol. Inform. 2016, 31, 18–21. [Google Scholar] [CrossRef]
- Teodoro, A.C.; Duarte, L. Forest fire risk maps: A GIS open source application—A case study in Norwest of Portugal. Int. J. Geogr. Inf. Sci. 2013, 27, 699–720. [Google Scholar] [CrossRef]
- Duarte, L.; Teodoro, A.C.; Gonçalves, J.A.; Guerner Dias, A.J.; Espinha Marques, J. A dynamic map application for the assessment of groundwater vulnerability to pollution. Environ. Earth Sci. 2015, 74, 2315–2327. [Google Scholar] [CrossRef]
- Duarte, L.; Teodoro, A.C.; Gonçalves, J.A.; Soares, D.; Cunha, M. Assessing soil erosion risk using RUSLE through a GIS open source desktop and web application. Environ. Monit. Assess. 2016, 188. [Google Scholar] [CrossRef] [PubMed]
- Duarte, L.; Teodoro, A.C. An easy, accurate and efficient procedure to create Forest Fire Risk Maps using Modeler (SEXTANTE plugin). J. For. Res. 2016, 27, 1361–1372. [Google Scholar] [CrossRef]
- Duarte, L.; Teodoro, A.C.; Maia, D.; Barbosa, D. Radio Astronomy Demonstrator: Assessment of the Appropriate Sites through a GIS Open Source Application. ISPRS Int. J. Geo-Inf. 2016, 5, 209. [Google Scholar] [CrossRef]
- Duarte, L.; Teodoro, A.C.; Gonçalves, J.A.; Moutinho, O. Open-source GIS application for UAV photogrammetry based on MicMac. Int. J. Remote Sens. 2016, 38, 8–10. [Google Scholar] [CrossRef]
- Duarte, L.; Teodoro, A.C.; Moutinho, O.; Gonçalves, J.A. Distributed Temperature Measurement in a Self-Burning Coal Waste Pile through a GIS Open Source Desktop Application. ISPRS Int. J. Geo-Inf. 2017, 6, 87. [Google Scholar] [CrossRef]
- Garcia-Haro, F.J.; Martinez, B.; Gilabert, M.A. An educational software for remote sensing. In Proceedings of the 10th International Technology, Education and Development Conference (INTED), Valencia, Spain, 7–9 March 2016; pp. 5072–5079. [Google Scholar]
- Wang, X.; Chen, N.; Chen, Z.; Yang, X.; Li, J. Earth observation metadata ontology model for spatiotemporal-spectral semantic-enhanced satellite observation discovery: A case study of soil moisture monitoring. GISci. Remote Sens. 2016, 53, 22–44. [Google Scholar] [CrossRef]
- Song, Y.; Wu, C. Examining human heat stress with remote sensing technology. GISci. Remote Sens. 2018, 55, 19–37. [Google Scholar] [CrossRef]
- SAGA GIS. SAGA Software. 2017. Available online: http://www.saga-gis.org/ (accessed on 21 November 2017).
- OTB (OrfeoToolbox). Pan-Sharpening Description. 2017. Available online: https://www.orfeo-toolbox.org/Applications/Pansharpening.html (accessed on 22 November 2017).
- Nikolakopoulos, K.; Oikonomidis, D. Quality assessment of ten fusion techniques applied on Worldview-2. Eur. J. Remote Sens. 2015, 48, 141–167. [Google Scholar] [CrossRef]
- Mandanici, E.; Bitelli, G. Preliminary Comparison of Sentinel-2 and Landsat 8 Imagery for a Combined Use. Remote Sens. 2016, 8, 1014. [Google Scholar] [CrossRef]
- GRASS GIS. 2017. Available online: https://grass.osgeo.org/ (accessed on 22 November 2017).
- Pktools. Pktools Documentation. 2017. Available online: http://pktools.nongnu.org/html/index.html (accessed on 16 March 2018).
- Congedo, L. Semi-Automatic Classification Plugin Documentation. 2016. Available online: https://fromgistors.blogspot.com/p/semi-automatic-classification-plugin.html (accessed on 21 November 2017). [CrossRef]
- GNU Operating System. GNU General Public License. 2017. Available online: https://www.gnu.org/licenses/gpl-3.0.en.html (accessed on 21 November 2017).
- Python. Python Programming Language. 2017. Available online: http://python.org/ (accessed on 22 November 2017).
- QGIS API. QGIS API Documentation. 2017. Available online: http://www.qgis.org/api/ (accessed on 20 November 2017).
- PyQt4 API. PyQt Class Reference. 2017. Available online: http://pyqt.sourceforge.net/Docs/PyQt4/classes.html (accessed on 20 November 2017).
- GDAL. Geospatial Data Abstraction Library. 2017. Available online: http://www.gdal.org/ (accessed on 20 November 2017).
- Qt Designer. Qt Documentation, Qt Designer Manual. 2017. Available online: http://doc.qt.io/qt-4.8/designer-manual.html (accessed on 21 November 2017).
- Matplotlib. 2017. Available online: http://matplotlib.org/ (accessed on 22 November 2017).
- Numpy. 2017. Available online: http://www.numpy.org/ (accessed on 22 November 2017).
- Scipy. 2017. Available online: https://www.scipy.org/ (accessed on 21 November 2017).
- Solem, J.E. Programming Computer Vision with Python. Creative Commons, 2012. Available online: http://programmingcomputervision.com/downloads/ProgrammingComputerVision_CCdraft.pdf (accessed on 21 November 2017).
- Gomez-Dans, J. Landsat DN to Radiance Script Using GDAL and Numpy. 2017. Available online: https://gist.github.com/jgomezdans/5488682 (accessed on 20 November 2017).
- Landsat 8 Data Users Handbook. USGS, 2017. Available online: https://landsat.usgs.gov/sites/default/files/documents/Landsat8DataUsersHandbook.pdf (accessed on 21 November 2017).
- Chavez, P.S. Image-Based Atmospheric Corrections—Revisited and Improved Photogrammetric Engineering and Remote Sensing, [Falls Church, Va.]. Am. Soc. Photogramm. 1996, 62, 1025–1036. [Google Scholar]
- Reed, B.C.; Brown, J.F.; VanderZee, D.; Loveland, T.R.; Merchant, J.W.; Ohlen, D.O. Measuring phenological variability from satellite imagery. J. Veg. Sci. 1994, 5, 703–714. [Google Scholar] [CrossRef]
- Huete, A.; Justice, C.; Van Leeuwen, W. MODIS Vegetation Index (MOD 13). Algorithm Theor. Basis Doc. 1999, 3, 213. [Google Scholar]
- Gao, B.-C. NDWI A Normalized Difference Water Index for Remote Sensing of Vegetation Liquid Water from Space. Remote Sens. Environ. 1996, 58, 257–266. [Google Scholar]
- Lillesand, T.; Kiefer, R.W.; Chipman, J. Remote Sensing and Image Interpretation, 7th ed.; Wiley: New York, NY, USA, 2015; 768p, ISBN 978-1-118-34328-9. [Google Scholar]
- USGS. U.S. Geological Survey. 2017. Available online: https://www.usgs.gov/ (accessed on 21 November 2017).
© 2018 by the authors. Licensee MDPI, Basel, Switzerland. This article is an open access article distributed under the terms and conditions of the Creative Commons Attribution (CC BY) license (http://creativecommons.org/licenses/by/4.0/).