Abstract
This research investigates higher education admission outcomes at Hungarian universities for ethnic Hungarian minority students residing in countries within the Carpathian Basin. The region is distinguished by a variety of national policies that impact minority education. By analyzing extensive data on the availability of mother tongue education, the status of minority rights, advanced level examination performance, and types of settlement using a wide range of statistical methods, our study reveals significant cross-national differences in the distribution of admission scores and central tendencies. Compared to lower and more varied scores for students from Ukraine and Romania, ethnic Hungarian students from Serbia and Slovakia achieved high average admission scores. Performance was notably more consistent among students from EU member states compared to non-EU regions, strongly linking outcomes to the more robust implementation of minority rights and better access to mother-tongue education within the EU framework. A critical finding is the strong positive correlation (Pearson r = 0.837) between admission scores and advanced level examination results, highlighting the pivotal role of these exams for the academic progression of these minority students. The Jonckheere-Terpstra test (p < 0.05) further confirmed significant performance differences between ranked country groups, with Serbian and Slovak students generally outperforming their Ukrainian and Romanian counterparts. Counterintuitively, settlement type (urban vs. rural) exhibited a negligible relationship with admission scores (r = 0.150), explaining only 2% of score variability. This challenges common assumptions and suggests other factors specific to the Hungarian minority context are more influential. This study provides crucial insights into the complex dynamics influencing Hungarian minority students’ access to higher education, underscoring cross-country educational inequalities, and informing the development of equitable minority rights and mother-tongue education policies in Central Europe for these often-marginalized communities.
1. Introduction
Modern higher education systems are constantly evolving to address societal needs and support diverse student populations. Governments frequently utilize international benchmarks to inform policy decisions and allocate resources effectively (OECD, 2024; Zhou, 2024). While this highlights the critical role of higher education in fostering competencies, it also underscores that access and success are shaped by varied student backgrounds (OECD, 2021) However, these broad international frameworks often overlook the unique challenges faced by cross-border ethnic minority students, whose educational pathways are influenced by distinct historical, linguistic, and political factors not typically captured in large-scale comparisons. In addition to global trends, the Carpathian Basin has specific contexts of inequalities in access to higher education, and it is important to consider these when analysing the region. The present study focuses specifically on ethnic Hungarian students from neighbouring countries in Hungary (namely, Slovakia, Ukraine, Romania, Serbia, Croatia, and Slovenia) who admitted to higher education institutions in Hungary.
Higher education plays a critical role in developing young adults’ competencies and promoting societal contributions, yet admission outcomes are profoundly shaped by diverse student backgrounds and socio-economic factors (OECD, 2021) Research consistently shows that factors such as social class, secondary school type, and parental education significantly influence university admission probabilities and academic performance (Mirashrafi et al., 2013; Park et al., 2024; Prakhov & Yudkevich, 2012; Tomul & Polat, 2013). While these factors are well documented in a general context, their differential impact in ethnic minority contexts remains largely unexplored. This is particularly the case for students aspiring to higher education in other national systems.
Regional disparities in higher education admissions reveal significant differences in success rates and educational migration patterns. The literature consistently shows that urban students tend to achieve better enrolment results due to better quality educational resources, improved infrastructure and better access to digital competences (Dale & Miller, 1972; Opoku-Asare & Siaw, 2015; Tomczyk, 2024). This geographical inequality is reflected not only in admission results, but also in further education opportunities, shaping students’ overall educational trajectories (Braun & Dwenger, 2008; Chankseliani, 2013; Tam & Jiang, 2015) However, these studies rarely examine how this general urban-rural divide plays out in specific cross-border minority contexts where linguistic and cultural factors can override purely geographic differences.
While educational migration and regional disparities are critical for higher education planning (Dozhdikov & Kornilova, 2023) research on urban-rural academic performance provides inconsistent and often contradictory findings. Some studies indicate that urban students hold a distinct advantage in grades and retention (Felder et al., 1998), yet others report that rural students achieve similar or even superior outcomes (Hutten-Czapski et al., 2005; Liao et al., 2013). The complexity of this relationship is further highlighted by research demonstrating that simple metrics like median scores can be misleading, as overall performance distributions may show no significant discrepancy between urban and rural groups (Jakaitiene et al., 2020). There is a lack of understanding about whether the usual urban-rural divide applies to a specific cross-border ethnic minority group. This is because factors like language, community and minority identity might change or even cancel out the effect of where people live.
Geographical factors significantly influence disparities in university admission scores (Cui et al., 2024), with distance from educational institutions playing a critical role in enrollment decisions and access to higher education. Research demonstrates that greater geographical distance from universities reduces the likelihood of enrollment (Kjellström & Regnér, 1999). This effect is not limited to rural-urban divides but extends to variations within urban areas, such as differences between affluent neighborhoods and inner-city districts (Verdis et al., 2019). Proximity to universities provides economic and informational benefits, which are particularly impactful in competitive fields (Cui et al., 2024; Guzi & Franta, 2008; Weßling & Bechler, 2019; White & Lee, 2020). However, the impact of geographical factors is debated. Some studies argue that distance has minimal influence on higher education engagement (Gibbons & Vignoles, 2009; Sørensen & Høst, 2016). Addressing these disparities requires nuanced strategies that consider the interplay of geographical, social, and economic factors. Comprehensive approaches are essential for ensuring equitable access to higher education across diverse regions. Policymakers must prioritize fair admission practices and resource allocation to bridge these gaps and promote inclusivity in higher education systems.
The Carpathian Basin is a unique context for investigating higher education admission outcomes among ethnic Hungarian students, shaped by a complex interplay of historical, cultural, and socio-economic factors, including a pronounced west-southeast gradient (Péti et al., 2021; Szirmai et al., 2016; Tóth, 2010). Ethnic Hungarians, recognized as an indigenous minority since 1920 (Tolcsvai Nagy, 2021), face diverse language policies ranging from exclusion to official recognition (Marácz, 2016), with bilingual education and mother tongue rights playing a crucial role in identity preservation and academic success (Kemény-Gombkötő & Popova, 2021; Vančo & Kondratieva, 2021; Wiczanowska & Szoszkiewicz, 2018) However, outside the EU, such as in Ukraine and Serbia, the use of Hungarian in education is limited or declining, negatively impacting student performance (Papp, 2014; Pusztai & Márkus, 2019; Todorov, 2020; Trombitás & Szügyi, 2019) Socio-economic disparities further shape opportunities, with Hungary providing scholarships and a unified higher education system to support ethnic Hungarian students (Hordósy & Szanyi, 2020; Kálóczy & Kulcsár-Szabó, 2016; Kincses & Papp, 2020; Takács et al., 2013; Takács & Szügyi, 2015).
Urban-rural differences exacerbate these challenges: urban students consistently outperform rural peers due to better resources and infrastructure, while smaller municipalities have higher proportions of low-performing students (Barabás, 2024; Buza & Istrate, 2022; Hegedűs & Sebestyén, 2019; Kryst et al., 2015); Although some studies highlight the adaptability and resilience of rural students (Urbonienė & Koverienė, 2018), research finding no significant urban-rural performance difference is rare (Ristić et al., 2021).
Despite extensive research on minority education and regional disparities, there is a paucity of comprehensive, cross-country analyses focusing specifically on the combined effects of language policy, socio-economic context, and settlement type on the higher education admission outcomes of ethnic Hungarian students in the Carpathian Basin. This study aims to address this gap in literature.
Based on the literature presented, this study examines the admission outcomes of ethnic Hungarian students in the Carpathian Basin within a theoretical framework based on three main pillars. To guide our investigation, we formulated the following research questions: 1. To what extent do the institutional framework and access to mother-tongue education correlate with the university admission scores of ethnic Hungarian students from different countries? 2. What is the relationship between the prevalence of advanced-level examinations and weighted average admission scores, and how do these factors contribute to regional performance disparities? 3. Does settlement type significantly predict university admission outcomes for this specific ethnic minority population, or are other factors more influential? From this triple theoretical lens, the following hypotheses are formulated:
Hypothesis 1 (H1).
Students perform better in terms of tertiary enrolment in countries with an institutional framework supported by the EU and access to education in their mother tongue (Kemény-Gombkötő & Popova, 2021; Vančo & Kondratieva, 2021; Wiczanowska & Szoszkiewicz, 2018), than in regions (Serbia, Ukraine) where these comprehensive support systems are limited or absent (Kincses & Papp, 2020; Papp, 2014; Pusztai & Márkus, 2019).
Hypothesis 2 (H2).
Data ranked by country group and weighted averages of admission scores reveal regional disparities. However, students from countries with higher participation in the Hungarian national system and better pass rates on advanced level exams tend to achieve more stable and improved result (Demeter et al., 2024; Jakaitiene et al., 2020).
Hypothesis 3 (H3).
The type of municipality does not serve as a significant predictor of admission outcomes, and no notable correlation can be identified between place of residence and scores (Buza & Istrate, 2022; Ristić et al., 2021; Urbonienė & Koverienė, 2018).
2. Materials and Methods
This study used a quantitative, cross-sectional research design involving the secondary analysis of a university admissions database. The aim was to examine spatial disparities and the factors influencing the academic performance of ethnic Hungarian minority students.
2.1. Presentation of the Area
The Carpathian Basin is a significant geographical region in Hungarian consciousness, circumscribed by the Carpathians, Dinaric Mountains, and Alps. It is synonymous with historical Hungary and is considered a level of the homeland by many Hungarians (Molnár & Papp, 2022). Several Hungarian communities reside in neighboring countries, with the largest populations of ethnic Hungarians abroad found in Slovakia, Ukraine, Romania, and Serbia. A smaller number of Hungarians also reside in parts of Slovenia, Croatia, and Austria that border Hungary (Péti et al., 2020). Over the past few decades, the number of Hungarians in the Carpathian Basin has declined from 12.9 million in 1990 to 11.5 million between 2012 and 2016. As of recent data, approximately 16% of Hungarians live in bordering countries (Kapitány, 2015). The key factors determining student mobility in the region include the quality of the academic environment, the capacity for educational migration, and institutional conditions (Semiv et al., 2023).
During the 2023/2024 academic year, Hungary provided educational opportunities to approximately 37,500 foreign students, with over 5500 of these students being of ethnic Hungarian descent (Hungarian Central Statistical Office, 2023). The significant presence of ethnic Hungarian students in Hungary underscores the country’s pivotal role in providing higher education to Hungarian minorities from neighboring countries, reflecting strong cultural and educational connections across borders. Our database focuses on ethnic Hungarian students enrolled in undivided (5-year) and bachelor (3-year) programs at Hungarian higher education institutions. The dataset comes from Márton Áron Special College’s admissions database (ELTE, 2024) and mostly includes Hungarian students from abroad on the Hunyadi János Scholarship (Wolters Kluwer, 2024).
The initial database comprised the records of 1911 students. Following data reduction in MS Excel, the sample size was refined to 859 (N = 859), resulting in a representative database for subsequent analyses. The data set, collected over a seven-year period from 2017 to 2023, exhibits a balanced annual distribution, with an average of 122 participants per year. The number of participants was the lowest in 2021 with a total of 94 individuals, and the highest in 2017 with 160 participants.
A detailed analysis of the circular bar plot (Figure 1) reveals significant differences between and within groups. The color of the columns indicates the country represented, while the length of the columns represents the proportion of students from that country. The proportion of counties per country is equivalent to 100%. Notably, Ukraine and Romania exhibit a significant spatial dispersion of students. The chart is divided into multiple sections, demonstrating that the student population originates from a diverse range of regions. In contrast, Croatia, Slovakia, and Slovenia show a more pronounced territorial concentration, with Romania being the only country displaying an even regional distribution. The most prominent regions are Harghita, with 21%, and Bihor, with 18%. Following closely behind are Satu Mare and Covasna, with 16% and 13%, respectively. In other countries, at least one region dominates in terms of student representation. The highest regional concentration is found in Croatia, where 89% of students come from the Osjecko-Baranjska region. From Serbia, significant student data is available from the Severno Bački (42%) and Severno-Banatski (39%) regions. In Slovakia, the Nitriansky region provides substantial data (64%). In Slovenia, the Lendava region contributes a considerable portion of student information (58%). In Ukraine, the Beregovsky region accounts for most of the available student data (51%). The students’ places of residence were also visualized using a heat map combined with cluster points (Figure 2).
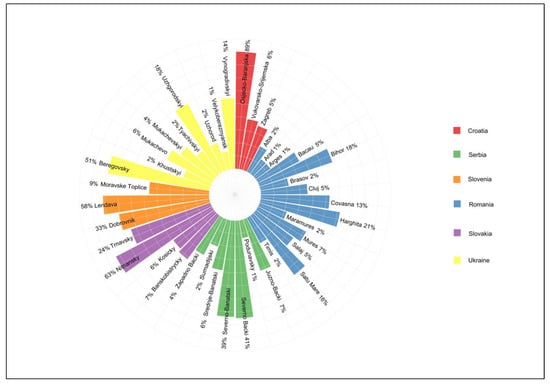
Figure 1.
Percentage distribution of students studying at universities in Hungary (at county/district level) plotted on a logarithmic scale.
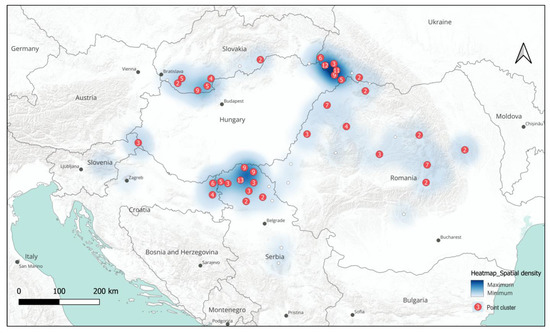
Figure 2.
Visualization of the spatial density and clustering of the student population.
The map uses blue shades to represent student density distribution, with darker colors indicating higher concentrations. Red-circled clusters show settlement groupings within regions, with numbers denoting affiliated settlements. White points mark outliers settlements with significant spatial deviation from centroids. Major clusters appear in Ukraine (12, 11) and Serbia (13, 9), where substantial student data originates. Romania and Slovakia show moderate settlement concentrations, while Slovenia and Croatia data reflect smaller diaspora Hungarian communities. The map clearly identifies Hungarian community distributions beyond borders: Highland (Slovakia), Transylvania and Partium (Romania), Transcarpathia (Ukraine), and Vojvodina (Serbia). This distribution aligns with the historical and demographic context of Hungarian minorities. Larger clusters appear in areas with sizeable Hungarian populations, while smaller, dispersed data points indicate regions with fewer or more scattered Hungarian communities (Kocsis & Kocsisné Hodosi, 1998).
2.2. Methods
Areas with diverse socio-economic and linguistic backgrounds can have a significant impact on students’ educational outcomes. Therefore, It is essential to employ methods that can accurately analyze these complex relationships. These factors not only affect students’ academic performance, but also their ability to navigate the higher education admissions process, as exemplified by the Hungarian system. Admission scores for Hungarian bachelor’s, undivided programs, and vocational training are calculated based on several factors. The score is determined by high school grades, final exam results, and in some cases professional exam results for vocational qualifications. Furthermore, if the applicant already holds a degree obtained in higher education or vocational training, its results may also contribute to the final score. In some fields of study, the results of mandatory practical examinations are also considered. A maximum of 400 points can be obtained from the results mentioned above, with 200 points coming from final examination results and 200 points from academic performance. In addition, up to 100 institutional points and extra points for voluntary military reserve service can be added. The way scores are calculated can vary according to regulations, and the total admission score will automatically be considered the most favorable outcome for the applicant. (Education Authority of Hungary, 2024) In the case of ethnic Hungarian students, the same regulations apply as for applicants with Hungarian citizenship. However, they also have the option to apply for higher education based on the scores of their matriculation certificate obtained in their home country. In our previous study, we defined this latter case as the “Native Country School-Leaving Examination” (Demeter et al., 2024).
The study’s primary dependent variable was the university admission score. The key independent variables included the student’s country of origin (as a proxy for institutional and linguistic frameworks), the proportion of advanced-level examinations taken, and the population size of the student’s home settlement (as a proxy for urban-rural status). To test our hypotheses, a multi-step statistical analysis was conducted in R and Quantum GIS. H1 was tested using descriptive statistics (e.g., box plots) and the Jonckheere-Terpstra test to compare performance across country groups. H2 was investigated using Pearson correlation and linear regression to assess the relationship between advanced-level exams and admission scores. Finally, H3 was examined using Spearman’s rank correlation to determine the association between settlement size and scores, chosen due to the non-normal distribution of the data.
In presenting the area, we created a circular bar plot diagram to represent the proportion of students at the county level, using a natural logarithm (ln) scale to determine column heights. The transformation applies the function ln(x + 1) to handle zero values and differentiate smaller values (1–10%) while reducing the dominance of larger values (>50%), resulting in a balanced visual representation. This method is effective for wide ranges (1–89%). The diagram was generated in R. Additionally, settlement-level student residence data was visualized using an automatic clustering method based on proximity to centroids, implemented in Quantum GIS 3.40.1.
The project began with data cleaning and preparation in MS Excel. Admission results were analyzed by county, district, and municipality of origin using univariate analysis to describe variables and examine data structure. Visualizations were created in R, starting with loading libraries (ggplot2, dplyr, tidyr, gridExtra) and preparing data from a .csv file. A custom color palette and theme ensured consistency. The code iteratively generated nationality-specific plots combining histograms (binwidth = 8), density curves, and boxplots, annotated with quartiles (Q1, Q3) and medians. Annotation placement was optimized using horizontal (x_offset = 2) and vertical offsets (y_offset = max(density(subset_data$score)$y)/10). The x-axis range was standardized (270–500) via coord_cartesian(). Final outputs were arranged in 2 columns for cross-nationality score comparisons.
We assessed the relationship between admission scores and advanced-level examinations using a Pearson correlation matrix, assuming normal data distribution. The R code calculated Pearson correlations (cor()) and a linear regression model (lm()) between advanced-level and median scores. The visualization features a scatter plot, where each point represents a country. Point size and color (using the “viridis” palette) indicate median scores, while country names are positioned with geom_text_repel() to prevent overlaps. The plot includes a regression line (geom_smooth(method = “lm”)) with a confidence interval, density contour lines (geom_density_2d()), and dashed lines marking mean values with annotations. The correlation coefficient and R2 value are displayed in the upper left corner.
We used the Jonckheere-Terpstra test to analyze significant differences between country groups and visualized the results with a scatter plot created using R’s “ggplot2” and “reshape2” packages. The code loaded the necessary libraries and defined a dataset containing statistical comparisons of 15 sample pairs. Geometric layers were added with geom_tile() for the tiles and geom_text() for annotations. Visual enhancements included a dashed blue line at the 0.05 significance level (geom_vline()), gray grid lines, and axes scaled appropriately: the x-axis ranged from 0 to 0.5 in 0.05 increments, while the y-axis spanned the standard test statistic’s range with a one-unit offset. Point colors reflected test statistic values using a blue-gray-red gradient (scale_color_gradient2()). The dcast() function converted data from long to wide format, enabling easier plotting of standard errors against test statistics. By examining p-values and asymptotic significance levels, we ensured precise assessment of statistical reliability in our analysis.
Our team analyzed county-level admission results using a statistical approach that incorporated student number weighting, implemented in R with specialized packages. Data was imported via read_excel() from the “readxl” package and processed using “dplyr” functions like group_by() and summarise() for efficient grouping and aggregation by county. Weighted averages were calculated as simple means, while weighted standard deviations were computed using the wtd.var() function from the “Hmisc” package, ensuring accurate variability representation across group sizes. The weighted coefficient of variation (standard deviation/mean, expressed as a percentage) provided a standardized dispersion measure. Key metrics, student numbers, weighted averages, weighted standard deviations, and coefficients of variation, were calculated for each county to offer a comprehensive view of admission score distributions. The results were exported to Excel using write_xlsx() from the “writexl” package for further manipulation and visualization. Choropleth maps were created in Quantum GIS 3.40.1 by converting tables to “.csv” format and importing them into the GIS environment. These maps used color gradients (areal visualization) and circles (point-based visualization), with gray representing areas without data. Settlement-level data was aggregated to larger administrative units for clearer pattern visualization. Scale bars and north arrows ensured consistent geographical reference. To enhance clarity, Adobe Photoshop 2022 was used to adjust transparency and improve interpretability. The final maps provided an intuitive geographical representation of admission score patterns across counties, combining statistical precision with visual accessibility. The maps combine areal (color gradients) and point-based (circles) visualization techniques. Areas without data are shown in gray. Scale bars and north arrows are consistently placed for geographical reference. Settlement-level data is aggregated to larger administrative units to facilitate the visualization of clearer patterns.
We investigated the relationship between settlement size (population) and admission scores using linear regression in R, leveraging the “tidyverse” ecosystem for data processing. Normality was assessed with the Shapiro-Wilk test (shapiro.test()), applied to both variables for each country. Correlation analysis was performed using the cor.test() function, with Spearman’s rank correlation (method = ‘spearman’) chosen due to the non-normal data distribution. Results were exported to XLSX format using the “openxlsx” package and presented in tabular form in the paper.
AI techniques were used to debug and optimize R code, enhancing the quality of visuals. Our study employed data validation and interpretation methods to highlight territorial differences in admission performance among students in Hungary’s border regions. Beyond data collection, we emphasized contextual analysis to ensure result relevance. By combining statistical methods, we robustly examined relationships across national contexts.
3. Results
3.1. Univariate Statistical Data Analysis Based on Admission Scores
The text describes the statistical methods and results, explaining the distribution of student performance across groups. The analysis of admission scores revealed significant performance differences across the six countries examined (Figure 3). The most notable patterns relate to the variability and central tendency of the scores.
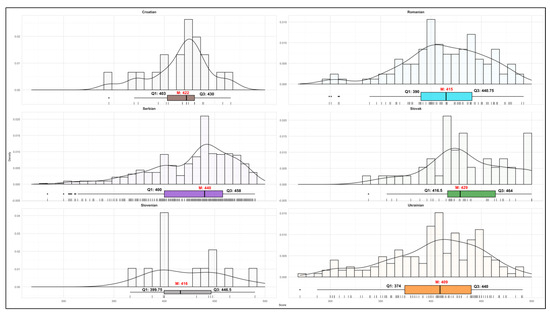
Figure 3.
Distribution of admission scores by country of origin.
The Ukrainian cohort demonstrates the widest score range (270–491) with a mean of 402.78 and a median of 409, indicating considerable performance variability. The distribution’s negative skewness and substantial standard deviation reflect a predominance of lower scores, with an interquartile range between 374 and 440 points. This pattern suggests significant heterogeneity in student preparedness levels within the Ukrainian educational system. Serbian students exhibit a similarly broad score range, but achieve notably higher performance metrics. The distribution’s negative skewness and concentration of scores between 420 and 450 indicates variability in student achievement levels. The Slovak group presents a balanced distribution, with an interquartile range of 415–465 and moderate standard deviation, indicating consistent performance levels despite some exceptional scores. Croatian students demonstrate the most homogeneous performance pattern, with scores concentrated between 345 and 466. The distribution’s negative skewness and lowest standard deviation reflect stable performance levels across the cohort. Romanian student performance spans a wide range, with the mean and median closely aligned. The distribution’s negative skewness and broader interquartile range suggest moderate variability in student achievement levels.
Uniquely, the Slovenian group shows slight positive skewness (0.2874), with scores ranging from 366 to 490 and a mean of 423.17. The median (416) approximates the mean, while the narrow interquartile range (399–447) and moderate standard deviation (36.39) indicate consistent performance levels. The admission results reveal distinct patterns across countries. Ukraine, Serbia, and Romania show larger variations in student preparedness, while Croatia and Slovenia demonstrate more homogeneous results.
3.2. Relationship Between Average Weighted Scores and Advanced Level Exams
To investigate the impact of advanced-level examinations on admission performance, we categorized students’ school-leaving qualifications based on the school leaving qualification background (Demeter et al., 2024). Our previous analysis revealed significant differences between students who followed the Hungarian national system and those who adhered to foreign systems for their final examinations. Table 1 presents a detailed breakdown of the results by country, expressing the data in percentages.

Table 1.
Secondary Education Background and School-Leaving Qualification Background by Country.
The highest proportion of candidates taking advanced-level exams was in Slovakia (85%), followed by Slovenia (75%) and Serbia (74%). In Croatia and Ukraine, 68% of students selected this examination type, while in Romania, a slightly lower percentage of 65% opted for it. The proportion of intermediate-level examinations was highest in Croatia (27%), followed by Ukraine (17%), with Serbia having the lowest at 8%. It is noteworthy that no students in Slovenia sat for these examinations. With respect to students electing to undertake native country examinations, Slovenia demonstrated the highest proportion (25%), followed by Serbia and Romania (both at 18%). Ukraine reported 16%, while Croatia and Slovakia showed 5% and 4%, respectively. These statistics clearly indicate distinct preferences for examination levels across countries. There is an upward trend with a favorable slope in the regression line (Figure 4).
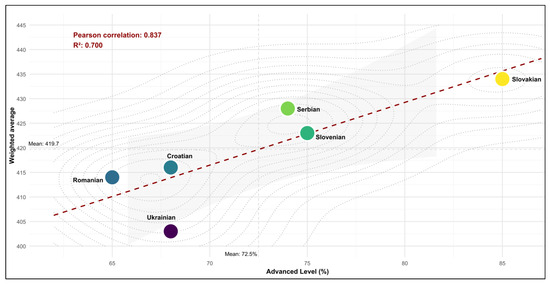
Figure 4.
The weighted arithmetic average of admission results and the relationship with tertiary examinations.
This finding suggests a positive correlation between the proportion of advanced-level examinations and the weighted average admission scores. The gray confidence interval band surrounding the regression line indicates the uncertainty of the regression estimate. Density contour lines in the graph connect points of equal data density. A comparison of weighted average scores with advanced-level examination participation reveals those countries with higher advanced-level examination rates—such as Serbia (74%), Slovakia (85%), and Slovenia (75%)—demonstrate notably superior average scores compared to other nations. In contrast, Romania (65%), Croatia (68%), and Ukraine (68%) exhibit lower examination results, correlating with weaker averages. Following normality distribution analysis, the Pearson correlation coefficient (r = 0.837) indicates a strong positive correlation.
The R-squared value (0.700) confirms that advanced-level exams significantly influence admission scores. A strong statistical association exists between the proportion of candidates taking advanced-level examinations and weighted admission results. However, 30% of the variability stems from other factors, indicating that advanced-level exam participation is not the sole determinant. Country-specific factors add nuance to the statistics, with Serbia showing exceptionally high results and Ukraine demonstrating an inadequate examination ratio. This comparative framework enhances understanding of the relationship between advanced-level examination participation and weighted average scores across nations. Visual analysis complements the statistical data, providing intuitive insight into performance distribution while highlighting advanced-level examination participation as a potential academic success indicator.
3.3. Analysis of Intergroup Differences and Ranked Trends
To identify significant performance trends between country groups, we employed the Jonckheere-Terpstra test. The analysis revealed statistically significant, ordered differences among several country pairs, as illustrated by the relationship between the test statistic and p-values (Figure 5).
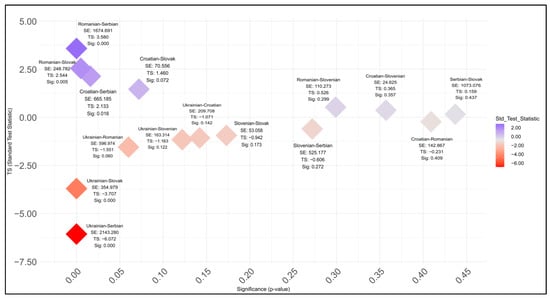
Figure 5.
The relationship between the standard test statistic and its significance.
The most prominent finding is that students from Serbia and Slovakia significantly outperformed their counterparts from other nations. Specifically, Serbian students’ results were statistically superior to those of Ukrainian, Romanian, and Croatian students (p < 0.05), while Slovakian students also scored significantly higher than their Ukrainian and Romanian peers (p < 0.05).
In contrast, some comparisons with large test statistics, such as Ukrainian vs. Romanian, approached but did not reach the conventional 5% significance threshold, and no measurable differences were observed among several other groups. These results indicate a clear performance hierarchy, with Serbian and Slovak students at the top, and Ukrainian and Romanian students demonstrating lower results in multiple comparisons.
The plot clearly illustrates a gradient from darker shades on the left to lighter shades on the right, corresponding to decreasing significance levels, regardless of sign. There were significant differences (p < 0.05) with high test statistics between several groups: Croatian vs. Serbian (TS = 2.133), Romanian vs. Slovakian (TS = 2.544), Ukrainian vs. Slovakian (TS = −3.707), Ukrainian vs. Serbian (TS = −6.072), and Romanian vs. Serbian (TS = 3.580). Serbian students’ results were statistically superior to those of Ukrainian, Romanian, and Croatian students. Similarly, Slovakian students demonstrated significantly higher scores compared to their Ukrainian and Romanian counterparts. Although some comparisons, such as Ukrainian vs. Romanian (TS = −1.551, p = 0.060) and Croatian vs. Slovakian (TS = 1.460, p = 0.072), exhibited large test statistics, their significance levels approached but did not reach the 5% threshold. No measurable differences were observed among the remaining groups. Serbian and Slovak students performed well, while Ukrainian and Romanian students showed lower results in several comparisons. Interpreting these findings requires caution due to distributional anomalies. Statistically significant differences exist, but their practical significance in admission scores may require further investigation.
3.4. Geographic Variation in Student Distribution and Regional Differences in the Weighted Average of Admission Scores
Examining the spatial patterns of higher education performance and student distribution is crucial for educational policy and regional development. This issue is particularly relevant in the case of Hungarian minority communities residing beyond national borders, where educational opportunities and outcomes can significantly impact the future trajectory of these communities.
The spatial analysis of admission scores and student distribution reveals significant regional disparities across the Carpathian Basin (Figure 6). Distinct high- and low-performing clusters emerged, often independent of national borders. Several regions demonstrated outstanding performance, with weighted average admission scores exceeding 430 points.
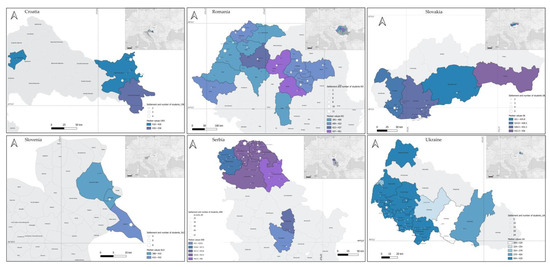
Figure 6.
Regional distribution of students and spatial differences in weighted average admission scores.
Through scientific analysis of the results, we identified several noteworthy patterns. Romania and Serbia demonstrated outstanding performance, with both countries achieving average admission scores above 450 points. Particularly noteworthy is the Srednje-Banatski region in Serbia, where students’ results ranged between 442.4 and 450 points.
Additionally, three other Serbian areas (Severno-Bački, Severno-Banatski, Juzno- Bački) also excelled, producing weighted averages between 438–442.4 points. The Vojvodina region in Serbia performs well, with many settlements showing large student populations, represented by larger white circles on the map. In Romania, the Transylvanian regions of Mureș and Brașov stood out with weighted averages ranging from 437 to 451 points, although caution is warranted in interpreting Brasov’s results due to the low sample size. The map reveals several major student concentration centers across Romania, particularly in the central and northern regions, as shown by the larger white circles. In Slovakia, the Košický area exhibited exceptional performance with an average of 432.3–436 points, despite its low student population. Conversely, the Nitriansky region, which provided the most data, also achieved a high average of 428–432.3 points, considered outstanding in regional comparison. A clear east-west pattern is evident in Slovakia’s performance distribution. In Slovenia, the performance range is between 388–432 points in two distinct regions, with small student populations indicated by small white circles. Croatia also displays two clearly differentiated regions in terms of performance, with scores ranging from 418–438 points, suggesting moderate regional variation. The results revealed that Ukraine has the lowest average scores, significantly lagging other examined areas. A spatial pattern is observable within Transcarpathia. In regions bordering Hungary (Uzhgorodskyi, Beregovskyi, Vynohradivskyi, and Mukachevskyi), students achieved higher average scores (404–429), while other regions performed below this level. The Khustskyi region had the lowest average scores (304–329), which is approximately 100 points below the best-performing areas. Regarding score dispersion, Romania (395–451), Serbia (412–450), and Ukraine (304–429) showed the greatest variability, indicating extreme differences in student performance. In contrast, Slovakia (421–436) and Croatia (418–438) produced results within a much narrower range, suggesting a higher degree of homogeneity in educational performance in these countries. The visualization through color gradients clearly demonstrates these regional disparities, with darker shades of blue and purple indicating higher performance areas and lighter shades showing lower-performing regions.
3.5. Analysis of the Correlation Between Admission Scores and the Number of Populations in a Municipality
Throughout this chapter, we have examined the relationship between admission scores and settlement size with the objective of determining whether demographic factors influence admission results. To test our third hypothesis (H3), we examined the relationship between students’ admission scores and the population size of their home settlement. The overall analysis of the aggregated data revealed a statistically significant (p < 0.001) but negligible positive correlation, with settlement size explaining only 2.2% of the variability in admission scores (r = 0.150, R2 = 0.022).
A more detailed, country-level analysis further reinforces that settlement size is not a meaningful predictor of performance. The key finding, detailed in Table 2, is that none of the country-specific correlations were statistically significant at the conventional α = 0.05 level. Correlation coefficients were consistently weak, ranging from a slight negative correlation in Ukraine (rho = −0.072) to a weak positive correlation in Slovakia (rho = 0.126).
Table 2.
Correlation between the population size of the municipality and the admission score (Ad. score) of students.
Looking at the data by country, we observed different patterns. The correlation coefficients ranged from −0.0723 (Ukraine) to 0.126 (Slovakia), and all countries showed a weak or very weak correlation between enrolment scores and population size. None of the country-specific correlations were statistically significant at the conventional α = 0.05 level, with p-values ranging from 0.231 (Romania) to 0.941 (Slovenia). For admission scores, most countries showed a non-normal distribution (p < 0.05), with the exception of Croatia (p = 0.2432) and Slovakia (p = 0.124). All countries showed a non-normal population distribution (p < 0.001 or p < 0.05). While most countries showed a slight positive correlation, Ukraine showed a weak negative correlation (−0.0723). The link between settlement size and admission scores is weak and inconsistent across countries. Country-specific analyses show limited predictive power of settlement size on academic performance. Non-normal distributions indicate that admission scores are influenced by complex factors beyond settlement size. While some countries show a modest increase in scores with settlement size, this association is not robust enough to predict performance reliably
4. Discussion
The complex historical, cultural, and sociodemographic context of the Carpathian Basin offers an exceptional opportunity to examine the higher education admission performance of students of Hungarian ethnicity. In this multiethnic region, where the Hungarian language plays a dominant role, the investigation of the correlation between linguistic diversity and educational outcomes is particularly relevant. Research by (Vančo & Kondratieva, 2021) shows that language is key to identity for Hungarian communities, and its preservation is associated with minority education issues. The study by (Hordósy & Szanyi, 2020) emphasizes that a fundamental aspect of minority education policy is the development and implementation of a bilingual education system, which has a significant impact on further education trajectories.
The findings pertaining to the initial hypothesis demonstrate that students hailing from countries that possess well-developed institutional frameworks for mother-tongue education, notably within the European Union, tend to attain higher and more consistent admission scores. This finding lends substantial empirical support to the theoretical proposition that the institutional recognition of minority linguistic rights directly correlates with enhanced educational outcomes. This association has been emphasised in research on minority education in Europe ((Kemény-Gombkötő & Popova, 2021; Wiczanowska & Szoszkiewicz, 2018). Specifically, the superior performance observed among students from Slovakia, Croatia, and Slovenia aligns with studies indicating that a robust mother-tongue school network positively impacts academic success, while the predominance of the state language can exert a negative effect (Papp, 2014; Pusztai & Márkus, 2019; Spangler & Adriansen, 2021) The lower and more varied scores from Ukraine, a non-EU country with a more constrained framework for minority education, further underscore this relationship. However, Romania’s deviation from this otherwise clear pattern suggests that while institutional support is crucial, other unmeasured country-specific factors may also play a significant role in shaping student performance.
The analysis for our second hypothesis confirmed a strong, positive correlation between the proportion of students taking advanced-level examinations and their university admission scores. This finding highlights the strategic importance of the Hungarian national examination system as a primary pathway to academic success for this cross-border student population. Our results empirically validate previous research suggesting that students educated within the Hungarian national system demonstrate superior performance (Demeter et al., 2024; Takács & Szügyi, 2015) The observed spatial inequalities, where high-performing regions like Mureș (Romania) or Srednje-Banatski (Serbia) coincide with higher rates of advanced-level exam participation, suggest that access to secondary schools that effectively prepare students for these specific exams is a key driver of regional disparities. This reinforces the argument that policymakers must look beyond simple averages and consider the full distribution of performance data to develop effective strategies for reducing educational inequalities, a point also emphasized by (Jakaitiene et al., 2020).
The most significant finding of our study is the confirmation of our third hypothesis. Our analysis revealed a negligible relationship between settlement type and university admission scores. This finding is in contrast to a substantial body of literature that consistently reports an “urban advantage” in educational outcomes, both on a global scale and within the Carpathian Basin (Barabás, 2024; Chankseliani, 2013; Dale & Miller, 1972; Hegedűs & Sebestyén, 2019; Opoku-Asare & Siaw, 2015; Tomczyk, 2024) The confirmation of our hypothesis suggests that, for this specific cross-border ethnic Hungarian population, conventional geographic determinants of performance may be superseded by more powerful, context-specific factors. It can be hypothesised that the strength and cohesion of the Hungarian-language school network, as well as the cultural capital embedded within the community, may exert a more significant influence on educational outcomes than the infrastructural differences between urban and rural settings. The present findings are consistent with those of a small number of other studies which, too, found no significant urban-rural performance gaps in specific contexts (Liao et al., 2013; Ristić et al., 2021). This, in turn, points to the need to question universal assumptions and to investigate the unique variables that shape educational success within distinct minority communities.
This study’s findings directly impact educational policy and practice. Policymakers should prioritize the expansion and consistent quality assurance of mother-tongue education. Targeted financial support, scholarships and teacher training can reduce disparities. Collaboration should be strengthened within and outside the EU to share best practices and protect minority rights. Authorities should implement monitoring systems to identify inequalities and enable timely interventions.
The limited power of settlement type merits attention. In this minority context, the cohesion of the Hungarian-language school network and community support may overcome urban-rural divides. Robust minority institutions can negate expected urban advantages in academic performance. Digitalization, increased mobility and flexible learning opportunities may reduce geographic barriers. It is recommended that future research endeavours focus on a more thorough exploration of these mediating factors. This exploration should be facilitated by qualitative and mixed-methods approaches, with the objective of elucidating the mechanisms that underpin the observed counterintuitive results.
The following text is intended to provide a comprehensive overview of the subject matter.
Limitations and Future Research Directions
While this study provides valuable insights into the educational landscape of ethnic Hungarian students, several limitations must be acknowledged when interpreting the findings.
First, our analysis is based on an admissions database that, while extensive, lacks granular data on individual students’ socio-economic status (SES), parental educational background, or the specific quality of their secondary schools. The absence of these variables, prevents a more nuanced exploration of the factors mediating performance and may obscure the underlying causes of the regional disparities we observed.
Second, the cross-sectional nature of the data does not allow for the establishment of causal relationships or the tracking of student performance trajectories over their academic careers. A longitudinal study would be necessary to explore how initial advantages or disadvantages evolve over time.
Finally, the sample sizes for some countries, notably Slovenia and Croatia, were relatively small. While statistically significant findings were still obtained, the results from these regions should be interpreted with caution, as they may not be fully representative of the entire ethnic Hungarian student population in those nations and may have limited statistical power.
Future research should address data uncertainty and sample size impacts on statistical inferences. The employment of Bootstrap techniques and Bayesian methods can improve statistical estimates, especially for regions with small populations. Expanding data collection is crucial for achieving more accurate and reliable results. Creating comprehensive databases with greater coverage, particularly from underrepresented regions, would increase analysis reliability and allow for a more nuanced understanding of regional differences. Combining advanced statistical techniques, expanded data collection, and longitudinal perspectives can provide a more robust understanding of regional educational disparities. This enhanced insight will be vital for developing evidence-based policies to reduce inequalities and improve educational outcomes across diverse geographical contexts.
5. Conclusions
Higher education pathways are shaped by spatial and social factors, including residence, economic background, and infrastructure, which significantly influence academic success. Spatial inequalities in education are not solely geographical but also structural, with international studies demonstrating their context-dependent nature. This research analyzed the admission outcomes of Hungarian ethnic minority students in the Carpathian Basin, offering insights into the interplay of spatial and social mechanisms affecting their performance.
Our findings showed that mother-tongue education and robust minority rights frameworks were associated with higher and more balanced admission results—most notably in Slovakia, Croatia, and Slovenia—while countries with limited support, such as Ukraine and Serbia, exhibited lower and more variable scores. However, this effect was not uniform: for example, Romania deviated from the expected pattern, and thus H1 was only partially confirmed. A strong positive correlation was observed between advanced-level examination participation and admission scores (Pearson r = 0.837, R2 = 0.700), confirming H2 and highlighting the pivotal role of these exams in academic progression. Contrary to common assumptions and much of the literature, settlement type (urban vs. rural) was not a decisive factor in admission outcomes (overall correlation r = 0.150, R2 = 0.022; all country-specific correlations non-significant), fully confirming H3. This suggests that other factors, such as community cohesion or school quality, may be more influential in this context.
Limitations included small sample sizes from certain regions, emphasizing the need for longitudinal studies to explore temporal changes and deeper correlations. Future research should apply advanced statistical techniques to address small sample sizes, incorporate variables like family background and infrastructure, and expand databases to cover underrepresented regions. This study underscores the complexity of minority education success, requiring multifactorial approaches that consider territorial disparities, institutional contexts, and socio-economic factors. Evidence-based programs are essential for addressing challenges in minority education across the Carpathian Basin.
Author Contributions
Conceptualization: J.D. and K.T.; methodology, J.D.; formal analysis, J.D.; investigation, J.D.; data curation, J.D., K.C. and K.T.; writing—original draft preparation, J.D., K.C. and K.T.; writing—review and editing, J.D., K.C. and K.T.; visualization, J.D.; supervision, K.T.; project administration, K.C. All authors have read and agreed to the published version of the manuscript.
Funding
This research received no external funding.
Institutional Review Board Statement
Not applicable.
Informed Consent Statement
Not applicable.
Data Availability Statement
Data are available only on request due to ethical restrictions.
Conflicts of Interest
The authors declare no conflicts of interest.
References
- Barabás, A. (2024). Factors influencing student performance in Hungarian minority education in Romania. University of Debrecen. [Google Scholar]
- Braun, S. T., & Dwenger, N. (2008). Success in the university admission process in Germany: Regional provenance matters (April 2008). DIW Berlin Discussion Paper No. 789, 17p. SSRN Electronic Journal. [Google Scholar] [CrossRef]
- Buza, V., & Istrate, M. (2022). Equality and quality in education. A multidimensional analysis of the results of the 2021 national assessment examination in the north-east region, Romania. Proceedings 2022, 289–301. [Google Scholar] [CrossRef]
- Chankseliani, M. (2013). Rural disadvantage in Georgian higher education admissions: A mixed-methods study. Comparative Education Review, 57(Suppl. S3), 424–456. [Google Scholar] [CrossRef]
- Cui, C., Yu, C., Chen, N., & Deng, X. (2024). Moving into higher education: An examination of student mobility under the Independent Freshman Admission Program in China. Population, Space and Place, 30(8), e2812. [Google Scholar] [CrossRef]
- Dale, R. R., & Miller, P. M. (1972). The urban or rural background of first-year university students in relation to their academic performance. British Journal of Educational Psychology, 42(2), 152–158. [Google Scholar] [CrossRef]
- Demeter, J., Czimre, K., & Teperics, K. (2024). A quantitative analysis of university admission results for hungarian ethnic minority students in the Carpathian Basin. Education Sciences, 14(11), 1253. [Google Scholar] [CrossRef]
- Dozhdikov, A. V., & Kornilova, E. V. (2023). Educational migration of applicants among regions of the russian federation as a data source for planning the higher education system development. Vysshee Obrazovanie v Rossii, 32(3), 67–83. [Google Scholar] [CrossRef]
- Education Authority of Hungary. (2024). Felsőoktatási statisztikák. [Higher education statistics]. Available online: https://kir.oktatas.hu/firstat.index (accessed on 17 January 2025).
- ELTE. (2024). Márton Áron Special College. Available online: https://martonaron.elte.hu/ (accessed on 10 January 2025).
- Felder, R. M., Felder, G. N., & Dietz, E. J. (1998). A longitudinal study of engineering student performance and retention. v. comparisons with traditionally-taught students. Journal of Engineering Education, 87(4), 469–480. [Google Scholar] [CrossRef]
- Gibbons, S., & Vignoles, A. (2009). Access, choice and participation in higher education. Centre for the Economics of Education, London School of Economics. [Google Scholar]
- Guzi, M., & Franta, M. (2008). Unequal access to higher education in the Czech Republic: The role of spatial distribution of universities. CERGE-EI Working Paper No. 350, ISSN 1211-3298, 61p. SSRN Electronic Journal. [Google Scholar] [CrossRef]
- Hegedűs, R., & Sebestyén, K. (2019). A case study about regional differences of Hungarian pupils’ achievement. HERJ Hungarian Educational Research Journal, 9(1), 123–127. [Google Scholar]
- Hordósy, R., & Szanyi, F. E. (2020). Moving through and moving away. Intersections. East European Journal of Society and Politics, 6(4), 34–62. [Google Scholar] [CrossRef]
- Hungarian Central Statistical Office. (2023). Helyzetkép. 2023 [Snapshots, 2023]. In Helyzetkép 2023. Available online: https://www.ksh.hu/s/helyzetkep-2023/#/ (accessed on 10 July 2024).
- Hutten-Czapski, P., Pitblado, R., & Rourke, J. (2005). Who gets into medical school? Can Fam Physician, 51, 1240–1241. [Google Scholar] [PubMed]
- Jakaitiene, A., Želvys, R., Dukynaitė, R., & Vaitekaitis, J. (2020, November 9–11). School location and student achievement: Results of lithuanian maturity examinations in mathematics. 13th Annual International Conference of Education, Seville, Spain. [Google Scholar] [CrossRef]
- Kapitány, B. (2015). Külhoni magyar közösségek [Hungarian communities living abroad]. In J. Monostori, P. Őri, & Z. Spéder (Eds.), Vol. Demográfiai portré [Hungarian Demographic Portrait]. Hungarian Demographic Research Institute. Available online: https://www.demografia.hu/kiadvanyokonline/index.php/demografiaiportre/article/view/2485/2483 (accessed on 10 July 2024).
- Kálóczy, K., & Kulcsár-Szabó, E. (2016). A határon túli magyar oktatás, kultúra és tudományosság magyarországi támogatása az 1990-es években [Hungarian support for Hungarian education, culture and science beyond the borders in the 1990s]. In C. Fedinec (Ed.), A Nemzet Mint Tudományos Közösség [The Nation as a Scientific Community] (pp. 13–24). MTA MTK EB. ISBN 978-963-508-818-8. [Google Scholar]
- Kemény-Gombkötő, K., & Popova, Z. (2021). Minority rights in education: The perception of autochthonous national minorities in Europe. FUEN. Available online: https://fuen.org/assets/upload/editor/docs/doc_LEGu3N4d_210925%20Minority%20rights%20in%20Education_EN.pdf (accessed on 30 January 2025).
- Kincses, B., & Papp, S. (2020). Examination of the motivation for further education among Hungarian high school students in Vojvodina. DETUROPE—The Central European Journal of Tourism and Regional Development, 12(3), 151–168. [Google Scholar] [CrossRef]
- Kjellström, C., & Regnér, H. (1999). The effects of geographical distance on the decision to enrol in university education. Scandinavian Journal of Educational Research, 43(4), 335–348. [Google Scholar] [CrossRef]
- Kocsis, K., & Kocsisné Hodosi, E. (1998). Ethnic geography of the Hungarian minorities in the Carpathian Basin. Geographical Research Institute, Research Centre and Earth Sciences. [Google Scholar]
- Kryst, E. L., Kotok, S., & Bodovski, K. (2015). Rural/urban disparities in science achievement in post-socialist countries: The evolving influence of socioeconomic status. Global Education Review, 2(4), 60–77. [Google Scholar]
- Liao, P. A., Chang, H. H., Wang, J. H., & Horng, T. H. (2013). Do rural students really perform worse than urban students do? Empirical evidence from a university entrance program in Taiwan. Rural Sociology, 78(1), 109–131. [Google Scholar] [CrossRef]
- Marácz, L. (2016). Empowering Hungarian ethno-linguistic minorities in Central-and Eastern Europe. Belvedere Meridionale, 28(2), 21–37. [Google Scholar] [CrossRef]
- Mirashrafi, S. B., Bol, G., & Nakhaiezadeh, G. (2013). The effect of individual factors, family background and socioeconomic status on university. Literacy Information and Computer Education Journal, 4(2), 1133–1139. [Google Scholar] [CrossRef]
- Molnár, J., & Papp, G. (2022). A Kárpát-medence földrajza: Természet, társadalom, gazdaság, néprajz [Geography of the carpathian basin: Nature, society, economy, ethnography]. Ferenc Rákóczi II Transcarpathian Hungarian College of Higher Education. [Google Scholar]
- OECD. (2021). Education at a Glance 2021: OECD Indicators. OECD. [Google Scholar] [CrossRef]
- OECD. (2024). Education at a Glance 2024: OECD Indicators. OECD. [Google Scholar] [CrossRef]
- Opoku-Asare, N. A. A., & Siaw, A. O. (2015). Rural–Urban disparity in students’ academic performance in visual arts education: Evidence from six senior high schools in Kumasi, Ghana. SAGE Open, 5(4), 1–14. [Google Scholar] [CrossRef]
- Papp, Z. A. (2014). Hidden ethnic inequalities. A possible global educational exploration using Pisa. Ethnicity, 10(2014), 184–197. Available online: https://real.mtak.hu/36939/7/1_PZA_pza_ethinicity_2014_10.pdf (accessed on 20 July 2024).
- Park, Y., Yim, S., Jang, W., Kim, J., & Song, Y. (2024). Analysis of factors influencing university admission type preferences: The case of a university. Korean Association For Learner-Centered Curriculum And Instruction, 24(11), 523–542. [Google Scholar] [CrossRef]
- Péti, M., Csata, Z., Schwarz, G., & Borbély, M. (2021). Hogy élnek a magyarok? A Kárpát-medencei magyarság életminőségének átfogó vizsgálata • How do hungarians live? A comprehensive study on the quality of life of the Hungarians in the carpathian basin. Magyar Tudomány, 186, 755–768. [Google Scholar] [CrossRef]
- Péti, M., Nagy, S., & Szabó, B. (2020). A Kárpát-medencei külhoni magyarság főbb helyi önkormányzati és településszerkezeti jellemzői [The main local government and settlement structure characteristics of Hungarians living abroad in the Carpathian Basin]. Területi Statisztika, 60(3), 277–308. [Google Scholar] [CrossRef]
- Prakhov, I., & Yudkevich, M. (2012). University admission in Russia: Do the wealthier benefit from standardized exams? (February 16, 2012). Higher School of Economics Research Paper No. WP BRP 04/EDU/2012. SSRN Electronic Journal. [Google Scholar] [CrossRef]
- Pusztai, G., & Márkus, Z. (2019). Paradox of assimilation among indigenous higher education students in four central European countries. Diaspora, Indigenous, and Minority Education, 13(4), 201–216. [Google Scholar] [CrossRef]
- Ristić, I., Popović, D., & Milovanović, B. (2021). Indicators of the wider social context and academic performance of the deaf and hard of hearing students. International Journal of Cognitive Research in Science, Engineering and Education, 9(2), 265–274. [Google Scholar] [CrossRef]
- Semiv, L., Danylyshyn, B., Bachynska, M., Batkovets, N., Piatnychuk, I., & Popadynets, N. (2023). Educational migration environment in carpathian region: Major process management directions. Management Theory and Studies for Rural Business and Infrastructure Development, 44(4), 406–420. [Google Scholar] [CrossRef]
- Sørensen, E. S., & Høst, A. K. (2016). Does distance determine who is in higher education? Munich Personal RePEc Archive, MPRA Paper No. 74517 . Available online: https://mpra.ub.uni-muenchen.de/74517/ (accessed on 17 January 2025).
- Spangler, V., & Adriansen, H. K. (2021). Space, place and internationalisation of higher education: Exploring everyday social practices in the ‘international’ classroom. Population, Space and Place, 27(8). [Google Scholar] [CrossRef]
- Szirmai, V., Schuchmann, J., & Halász, L. (2016). Posztszocialista jóllét és területi egyenlőtlenség a Kárpát-medencében [Post-socialist welfare and territorial inequality in the Carpathian Basin]. Tér És Társadalom, 30(4), 110–128. [Google Scholar] [CrossRef]
- Takács, Z., & Szügyi, É. (2015). Student mobility or emigration flow? The case of students commuting from Serbia to Hungary. DETUROPE—The Central European Journal of Tourism and Regional Development, 7(1), 120–136. [Google Scholar] [CrossRef]
- Takács, Z., Tátrai, P., & Erőss, Á. (2013). A Vajdaságból Magyarországra irányuló tanulmányi célú migráció [Student migration from Vojvodina to Hungary]. Tér És Társadalom, 27(2), 77–95. [Google Scholar] [CrossRef]
- Tam, T., & Jiang, J. (2015). Divergent urban-rural trends in college attendance: State policy bias and structural exclusion in China. Sociology of Education, 88(2), 160–180. [Google Scholar] [CrossRef]
- Todorov, I. (2020). Ukrainian-hungarian relations in the context of Ukraine’s euro-atlantic aspirations. Diplomatic Ukraine, XXI, 645–657. [Google Scholar] [CrossRef]
- Tolcsvai Nagy, G. (2021). The indigenous status of the hungarian language community in the Carpathian Basin: A historical and contemporary interpretation. Foreign Policy Review, 14(2), 47–61. [Google Scholar] [CrossRef]
- Tomczyk, Ł. (2024). Digital transformation and digital competences of urban and rural polish youths. Politics and Governance, 12, 7381. [Google Scholar] [CrossRef]
- Tomul, E., & Polat, G. (2013). The effects of socioeconomic characteristics of students on their academic achievement in higher education. American Journal of Educational Research, 1(10), 449–455. [Google Scholar] [CrossRef]
- Tóth, V. (2010). Strata of ethnics, languages and settlement names in the Carpathian Basin. Namenkundliche Informationen, 98, 135–146. [Google Scholar] [CrossRef]
- Trombitás, T., & Szügyi, É. (2019). Education language choice of hungarian ethnic diaspora communities in Vojvodina (Serbia). DETUROPE—The Central European Journal of Tourism and Regional Development, 11(2), 54–74. [Google Scholar] [CrossRef]
- Urbonienė, J., & Koverienė, I. (2018, February 15). A comparative investigation of English language proficiency and academic performance of current undergrad-uate students with special reference to Generation Z: Rural versus urban students. Proceedings of International Scientific Conference “RURAL DEVELOPMENT 2017”, Kaunas, Lithuania. [Google Scholar] [CrossRef]
- Vančo, I., & Kondratieva, N. V. (2021). The main factors of Hungarian-Slovak Bilingualism. Yearbook of Finno-Ugric Studies, 15(2), 222–227. [Google Scholar] [CrossRef]
- Verdis, A., Kalogeropoulos, K., & Chalkias, C. (2019). Regional disparities in access to higher education in Greece. Research in Comparative and International Education, 14(2), 318–335. [Google Scholar] [CrossRef]
- Weßling, K., & Bechler, N. (2019). Where do regional influences matter? The impact of socio-spatial indicators on transitions from secondary school to university. Review of Regional Research, 39(2), 163–188. [Google Scholar] [CrossRef]
- White, P. M., & Lee, D. M. (2020). Geographic inequalities and access to higher education: Is the proximity to higher education institution associated with the probability of attendance in England? Research in Higher Education, 61(7), 825–848. [Google Scholar] [CrossRef]
- Wiczanowska, H., & Szoszkiewicz, Ł. (2018). The protection of the right to education in minority language: The council of Europe’s standards. Polish Political Science Yearbook, 4(47), 742–751. [Google Scholar] [CrossRef]
- Wolters Kluwer. (2024). 423/2012. (XII. 29.) Kormányrendelet a felsőoktatási felvételi eljárásról—Hatályos Jogszabályok Gyűjteménye [Government decree on the higher education admission procedure—Collection of Legislation in force]. Available online: https://net.jogtar.hu/jogszabaly?docid=a1200423.kor (accessed on 30 January 2025).
- Zhou, B. (2024). Thoughts on education under great changes. Journal of Higher Education Teaching, 1(2), 105–110. [Google Scholar] [CrossRef]
Disclaimer/Publisher’s Note: The statements, opinions and data contained in all publications are solely those of the individual author(s) and contributor(s) and not of MDPI and/or the editor(s). MDPI and/or the editor(s) disclaim responsibility for any injury to people or property resulting from any ideas, methods, instructions or products referred to in the content. |
© 2025 by the authors. Licensee MDPI, Basel, Switzerland. This article is an open access article distributed under the terms and conditions of the Creative Commons Attribution (CC BY) license (https://creativecommons.org/licenses/by/4.0/).