Systematic Review

The Application of Machine Learning to Educational Process Data Analysis: A Systematic Review

Department of Educational Studies, College of Education, Purdue University, 100 North University Street, West Lafayette, IN 47906, USA
*
Author to whom correspondence should be addressed.
Educ. Sci. 2025, 15(7), 888; https://doi.org/10.3390/educsci15070888
Submission received: 8 May 2025 / Revised: 30 May 2025 / Accepted: 9 July 2025 / Published: 11 July 2025
(This article belongs to the Section Special and Inclusive Education)

Abstract

Educational process data offers valuable opportunities to enhance teaching and learning by providing more detailed insights into students’ learning and problem-solving processes. However, its large size, unstructured format, and inherent noise pose significant challenges for effective analysis. Machine learning (ML) has emerged as a powerful tool for tackling such complexities. Despite growing interest, a comprehensive review of ML applications in process data analysis remains lacking. This study contributes to the literature by systematically reviewing 38 peer-reviewed publications, dated from 2013 to 2024, following PRISMA 2020 guidelines. The findings of this review indicate that (1) clickstream data is the most widely used processing data type, (2) process data analysis offers actionable insights to support differentiated instruction and address diverse student needs, and (3) ML typically serves as a tool for coding process data or estimating student ability. Persistent challenges, including feature extraction and interpreting results for practical applications, are also discussed. Finally, implications for future research and practice are discussed with a focus on enhancing personalized learning, improving assessment accuracy, and promoting test fairness.

1. Introduction

Educational assessment and teaching methods are rapidly evolving in today’s digital age. The transition from traditional paper-based assessments to digital assessments (Salles et al., 2020; Alsuwaiket et al., 2020), the widespread adoption of online education models (S. Li et al., 2021; Singh, 2023), and the growing reliance on eLearning systems (Cetintas et al., 2009; Estacio & Raga, 2017; Rohani et al., 2024; Qiu et al., 2022) have reshaped how we evaluate and support student learning. These shifts have resulted in the collection of large volumes of process data, such as mouse movement and clickstreams, which provide richer and more detailed insights than traditional item responses or final scores. This data captures granular actions that reflect cognitive, metacognitive, and noncognitive processes, providing valuable feedback to educators and policymakers to enhance teaching and learning practices (Chang et al., 2021; Tang et al., 2021; Guo et al., 2024).
For instance, in online arithmetic word problem-solving tasks, researchers have used eye-tracking technology to collect students’ eye movement data, such as fixation and saccade. These measures helped identify off-task behaviors like staring into space and chatting. Based on this data, educators can provide targeted attention guidance by giving visual cues to help students with mathematical learning difficulties back on track, enriched with personalized support (Wei et al., 2023). Consequently, the use of learners’ process data or log file data in digital assessments is emerging as a prevailing trend (Tang et al., 2021; Chen & Cui, 2020).
However, the exploration of process data has faced significant challenges due to its large scale, heterogeneity, burstiness, dynamic nature, unstructured format, and the presence of “noise” (Tang et al., 2020; Wang et al., 2023; Han et al., 2019; Requena et al., 2020). Consider, for instance, a typical log file dataset with over 36,000 examinees, each assigned one or more in-unit assignments (Rohani et al., 2024). The clickstream data generated from these assignments can include multiple types of actions, like starting and finishing an assignment, or requesting a hint or explanation. The sheer volume and variety of actions, along with the difficulty of linking them to meaningful learning patterns, limit the effectiveness of traditional data analysis tools (Salles et al., 2020; Tang et al., 2021; Chen & Cui, 2020; Requena et al., 2020). Pioneering studies suggest that machine learning (ML) techniques have emerged as powerful tools for handling complex and large datasets (Chen & Cui, 2020; Liao & Wu, 2022; Sun et al., 2019). More specifically, in large-scale personalized learning or testing digital environments, ML has been used to discover learning structures, implement automatic scoring systems, develop computer-aided tutorials, and more (Bosch & Paquette, 2017).
Despite the growing application of ML techniques for educational challenges and assessments, there remains a lack of comprehensive analysis focused on process data. A systematic review is therefore needed to synthesize current research, identify key studies, and highlight effective ML applications in process data analysis.
This study aims to review the relevant literature at the intersection of ML and educational process data. This review provides an evidence-based overview of how ML-based analyses can deliver targeted, diagnostic insights to support instructional strategies. It also seeks to clarify the field’s current landscape and contribute to the theoretical development of process data analysis in education. Specifically, this review addresses the following questions:
  • RQ1. Which type of process data is the most used based on the current literature?
  • RQ2. What specific measurement issues can be effectively addressed through the use of process data?
  • RQ3. How can ML approaches be employed to fully leverage the information derived from process data?
By answering these questions, we aim to uncover the challenges of applying ML to educational process data, explore its pedagogical benefits, and identify promising directions for future research.
The remainder of this paper is organized as follows: First, we define the core concepts of process data and ML. Next, we describe the methodology used to conduct the systematic review. The results section presents (1) demographic trends across studies, (2) a thematic mapping of the included articles, and (3) findings addressing each research question (RQ1–RQ3). We then discuss key challenges, including the gap between current ML applications and traditional educational measurement standards. Finally, we conclude with a synthesis of the findings, acknowledge limitations, and offer informed recommendations for future work.

2. Materials and Methods

2.1. Definition of Process Data

Process data, in the context of education and assessment, refers to recorded sequences of actions or interactions undertaken by students as they engage with educational content or evaluation tasks (Salles et al., 2020; S. Li et al., 2021; Chang et al., 2021). This data may include keypresses, mouse movements, eye tracking patterns, response times, learner dialog, high-frequency mobile sensing data, and the number of attempts made (Salles et al., 2020; S. Li et al., 2021; Liao & Wu, 2022; Sun et al., 2019; Bosch & Paquette, 2017; Cao et al., 2020; Ahadi et al., 2015). For instance, in an interactive mathematical task designed to assess students’ conceptual understanding of nonlinear functions and their representations in tables and graphs (Salles et al., 2020), students could interact with the platform in various ways to explore the problem. They could enter numerical values, click the “Calculate and graph” button to visualize results, and use a digital pencil to draw lines by selecting a starting point and tracing with the mouse. Throughout the task, all actions—including clickstream logs, mouse movements, and entered numerical values—were recorded as process data. Such data might reveal latent cognitive processes. For instance, deliberate use of the pencil tool to draw lines may indicate a structured approach to understanding functions as mathematical objects with defined properties.
Process data can be intentionally collected using devices like video cameras, audio recorders, smartwatches, or bracelets that monitor various aspects of student behavior. Alternatively, it can also be captured passively as learners interact with educational technologies and digital learning platforms (Guan et al., 2022). This paper excludes data types such as neurophysiological data, longitudinal response data devoid of behavioral actions and specific tasks since they do not directly capture the observable interactions and behaviors that are central to our definition of educational process data.

2.2. Operational Definition of Machine Learning

In this study, machine learning (ML) refers to the process where computers are “taught” to interpret data patterns and are “trained” to execute predefined actions based on these patterns (Bleidorn & Hopwood, 2019). ML includes a wide range of algorithms, typically categorized into unsupervised learning and supervised learning methods.
Unsupervised learning, such as clustering and dimension reduction, enables computers to detect patterns in large datasets without predefined labels. These patterns are later interpreted by human experts. In contrast, supervised learning algorithms—such as support vector machines—use labeled datasets, where each observation includes input features and corresponding target values. The goal is to accurately predict the target values based on the input features (Ahadi et al., 2015; Gardner et al., 2021). To illustrate, in a large-scale national mathematics assessment conducted in France, both supervised and unsupervised ML approaches were applied. Supervised methods, such as random forests (RF), were used to predict student achievement and identify key features associated with success. Meanwhile, unsupervised methods, such as density-based spatial clustering of applications with noise (DBSCAN), grouped students based on distinct problem-solving strategies (Salles et al., 2020).

2.3. Literature Search Strategy

This review was conducted in accordance with the PRISMA 2020 guidelines. It was not registered in a review database. A completed PRISMA checklist is provided in the Supplementary Materials. Data from the included studies were extracted manually and independently by the first author, without the use of automation tools.
To be more specific, to retrieve systematic review articles reflected the study’s focus on the interaction of educational process data and ML, a search was executed using targeted keywords combination, including “machine learning” or “deep learning”, “process data” or “response time” or “logfile”, “education”, or “measurement” within the parameters of titles, abstracts, and keywords. The search was performed using the Scopus database for its comprehensive collection of multidisciplinary content and advanced search capabilities. Compared to other databases such as Web of Science (Mongeon & Paul-Hus, 2016), it is more likely to cover a wider range of relevant studies. The temporal scope from 1 January 2013, to 1 December 2024, was selected to encompass recent advancements in machine learning applications to educational process data, ensuring the inclusion of the latest research in this rapidly evolving field. The included publications were limited to English-language peer-reviewed articles.
Two supplementary search strategies were implemented to identify potential research studies that may not have been captured through the electronic search method. First, ancestry searches were performed according to the reference list of the included studies and recently published literature reviews on related topics. Second, hand searches were conducted in the following journals: Journal of Educational Data Mining, Journal of Educational Psychology, Behavior Research Methods, Applied Measurement in Education, British Journal of Mathematical and Statistical Psychology, Psychometrika, Journal of Educational and Behavioral Statistics, and ETS Research Report Series.

2.4. Inclusion and Exclusion Criteria

The abstract of each article was reviewed first. If the abstract did not provide enough information for a decision, the full article was retrieved for a more comprehensive evaluation. In sum, the article’s inclusion in this review was determined based on the inclusion and exclusion criteria outlined below.
Articles were included in this review if they met the following criteria: (a) published as a peer-reviewed article in English, and (b) an empirical study using ML to analyze process data pertinent to academic learning. Articles were excluded if they (a) were duplicates, (b) were erroneously returned by Scopus, (c) used data that did not align with this study’s definition of process data, or (d) mentioned ML without truly applying it.
Figure 1 presents the PRISMA flowchart (Page et al., 2021), which illustrates the process we followed to identify the articles included in this review.

3. Results

A total of 38 articles were retrieved and reviewed in this study (see Appendix A table for a complete list of references). This section presents the demographic trends, undertakes thematic mapping of the selected publications, and addresses the three research questions.

3.1. Research Landscape Analysis

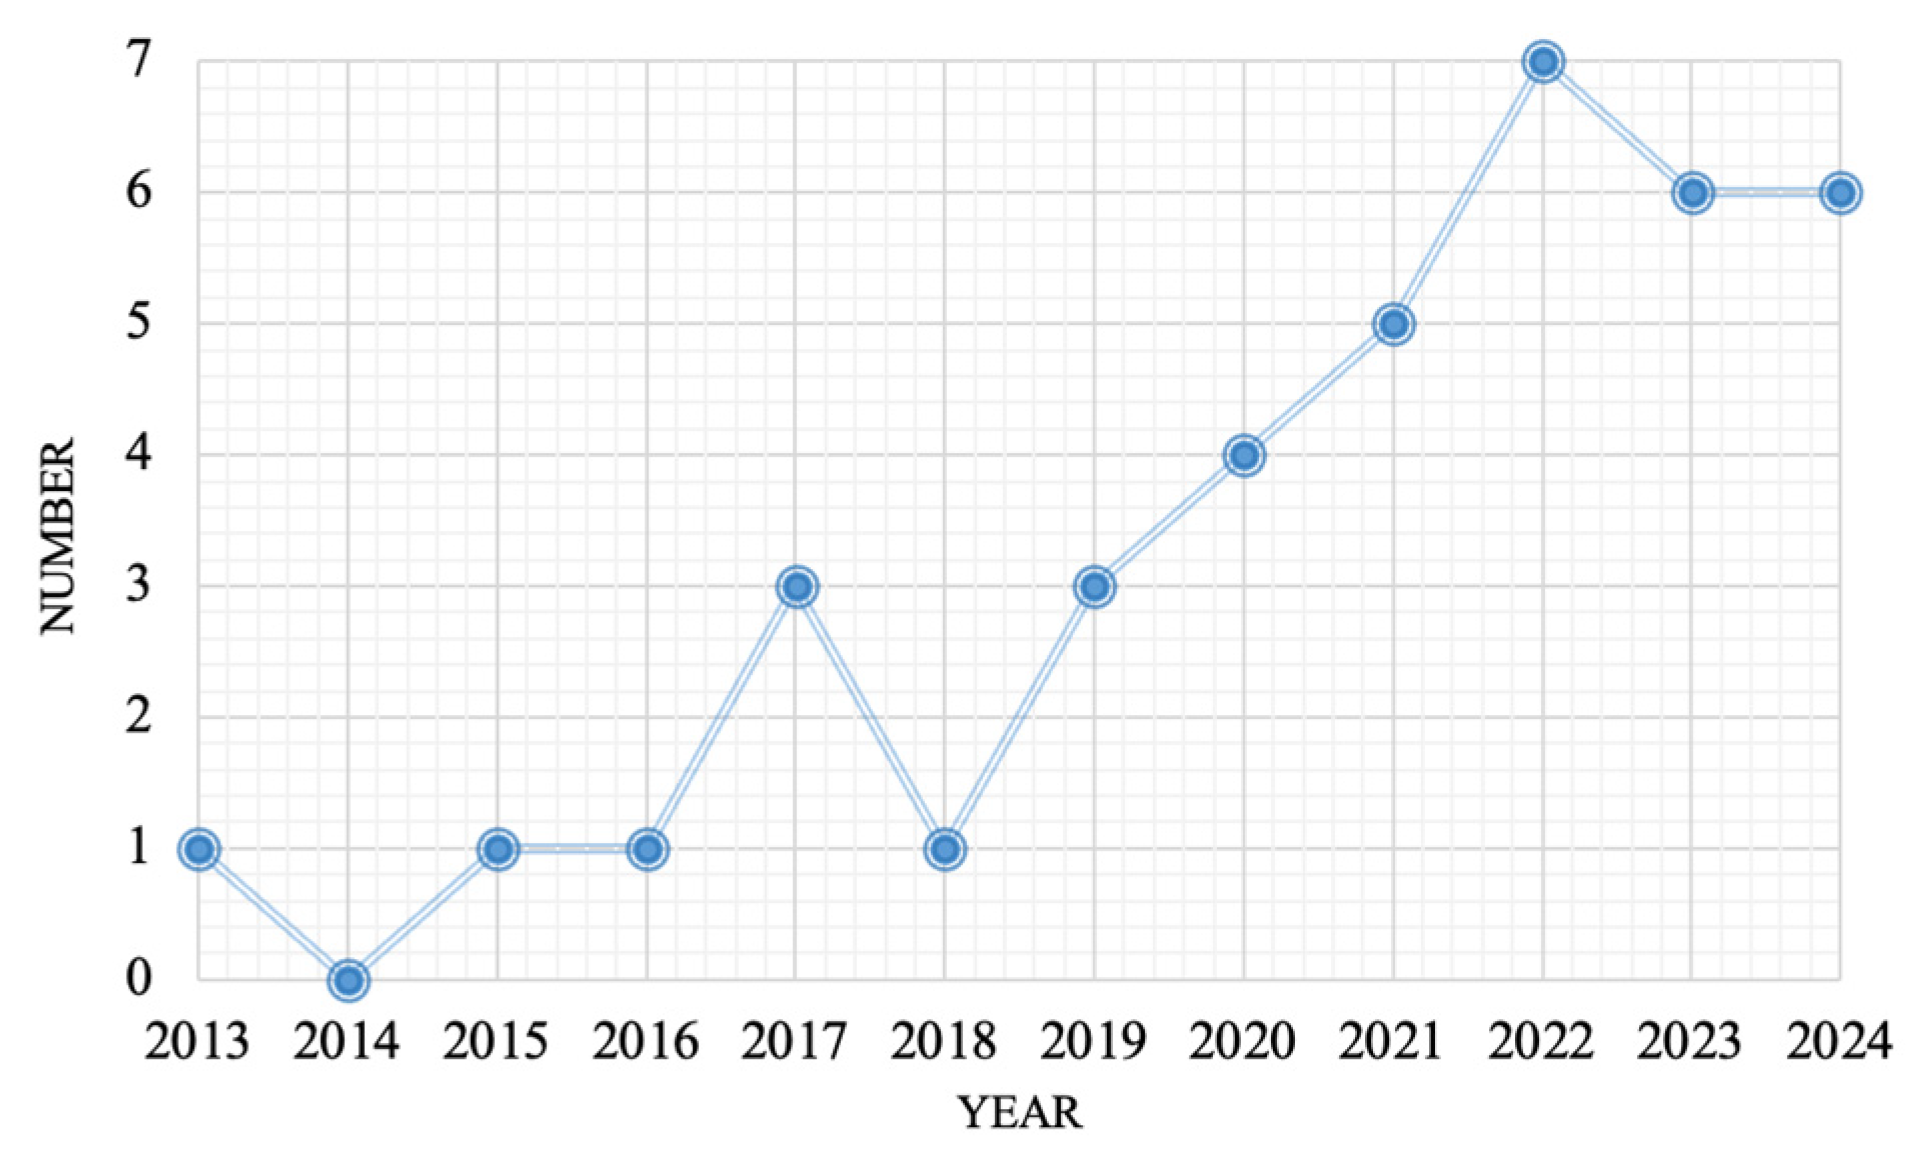
3.1.1. Demographic Trends

Figure 2 illustrates the publication timeline of the 38 reviewed articles. Between 2013 and 2016, research activity was minimal, with zero publications or one publication per year. A noticeable increase occurred in 2017, with three publications, signaling the start of more consistent scholarly attention. Although there was a brief dip in 2018, the trend resumed in 2019 with another three publications. From there, output steadily increased: four studies were published in 2020, and five were published in 2021, with a peak of seven in 2022. In both 2023 and 2024, six studies were published each year. This upward trend reflects sustained and growing interest in the application of process data analysis in educational research.
Table 1 displays the publication venues, revealing that nearly one-third of the publications are proceedings papers. Notably, the Journal of Educational Data Mining emerges as the most productive venue, accounting for 9 publications. It is followed by the British Journal of Mathematical and Statistical Psychology, which has 3 publications. Additionally, both Computers & Education and Large-scale Assessments in Education each contribute 2 publications.
The application of ML in these studies varies widely by sample size, ranging from small-scale studies with 32 participants (Guan et al., 2022) to large-scale investigations involving 40,230 participants (Wang et al., 2023). However, even in studies with a modest sample size of 32 participants, the detailed data from their response processes introduces complexity to the data structure. This highlights the nuanced nature of information obtained, even when derived from smaller participant cohorts.

3.1.2. Thematic Mapping

Figure 3 indicates the current thematic structure and research hotspots identified in the selected literature. This thematic map is based on author-keyword clustering using the Walktrap community detection algorithm.
Motor themes are both central and well-developed, representing foundational areas in the field. The largest and most prominent is “deep learning”, which aligns with the core focus of this review. In addition, “MOOC” emerges as another mature and relevant subdomain. This suggests that some researchers have focused on predicting students’ performance in MOOC environments (Al-Azazi & Ghurab, 2023; Pardos et al., 2017), reflecting sustained interest in large-scale, data-rich learning platforms where ML techniques are widely applied. Niche Themes include the ML method “extreme gradient boosting” (Ulitzsch et al., 2023; Levin, 2021; J. Zhang et al., 2022; Hoq et al., 2024), which is highly developed yet less integrated into the broader research network.
“Student modeling” appears in the basic themes quadrant, showing that it is a widely used concept across studies but still developing in methodological sophistication. Further clustering of this topic shows that student modeling is often discussed together with “autoencoders” and “feature engineering” (Salles et al., 2020; Tang et al., 2021; Chen & Cui, 2020; Han et al., 2019; Bosch & Paquette, 2017; Cao et al., 2020; Levin, 2021; Bosch, 2021). This indicates that student modeling is becoming increasingly integrated into advanced ML workflows, where automated feature extraction plays a key role in representing and predicting student behaviors.
Emerging or declining themes are located in the bottom-left quadrant, including “data mining”, “feature selection”, “knowledge tracing”, and “simulations”. According to the reviewed studies, several unsupervised learning methods are used in this area, such as singular value decomposition (SVD) (Lu et al., 2024) and abstract syntax tree (AST) (N. Zhang et al., 2022). This topic sits near the center, indicating that unsupervised ML methods are not yet deeply integrated into mainstream research. Meanwhile, “feature selection” (Salles et al., 2020; Tang et al., 2021; Chen & Cui, 2020; Han et al., 2019; Bosch & Paquette, 2017; Cao et al., 2020; Levin, 2021; Bosch, 2021) and “knowledge tracing” (S. Li et al., 2021; Sun et al., 2019) stand out as promising directions for future work. For deeper analysis of “simulation” using the cluster network method, the results indicate that simulation is strongly related to logfile and diagnostic reasoning process analysis, especially in research focusing on 21st-century skills like collaboration (Chen & Cui, 2020; Richters et al., 2023; Ohmoto et al., 2024).

3.2. Research Questions

3.2.1. RQ1: Which Type of Process Data Is the Most Used Based on the Current Literature?

According to the 38 recorded studies, clickstream data was the most prevalent data source, appearing in 31 studies (81.58%). This type of data focuses on users’ clicks and navigation paths, capturing students’ interactions with online learning or testing platforms. It includes page visit sequences, time allocations for each page, and specific actions taken in order (Salles et al., 2020; Singh, 2023; Rohani et al., 2024; Qiu et al., 2022; Tang et al., 2021; Chen & Cui, 2020; Wang et al., 2023; Liao & Wu, 2022; Ludwig et al., 2024; Sun et al., 2019; Richters et al., 2023; Pejić & Molcer, 2021; Xu et al., 2020; N. Zhang et al., 2022; Levin, 2021; Bosch, 2021; Hoq et al., 2024; Yu et al., 2018; Pardos et al., 2017). Clickstream data provides objective insights into students’ decision-making and problem-solving processes. For instance, Levin (2021) used the log-file data from the 8th NAEP (National Assessment of Educational Progress) mathematics assessment to predict students’ time-use efficiency. Each row in the dataset represented a single action taken by a student, such as mouse clicks, keyboard input, opening an equation editor, clearing an answer, hiding a timer, or leaving a section. Metadata like timestamps and student IDs were also included.
Clickstream data is typically analyzed in two ways (Baker et al., 2020). The first approach involves aggregate, non-temporal representations, where each student is represented as a multidimensional vector. For example, researchers might create histograms showing how often a student performed specific actions during a task (e.g., number of clicks on a specific button, frequency of accessing certain resources) (Han et al., 2019). This method supports traditional statistical analyses, such as multivariate regression, to predict outcomes. However, it does not capture the sequential or temporal dynamics of students’ behavior.
In contrast, the second method utilizes time-dependent or sequence-based representations, which include both the type and timing of actions. Techniques like n-gram analysis are often used to segment action sequences into smaller, ordered units (mini-sequences) and analyze their frequencies (Ludwig et al., 2024). While these representations are more complex and might require specialized analysis tools, they can reveal subtler sequential patterns in examinees’ actions that can be indicative of problem-solving strategies, hesitations, or common approaches to a task. For instance, the mini-sequence “read instruction → answer question → check answer” provides meaningful insight into student thinking. It shows a strategic approach, not just guessing, and helps researchers spot differences between high- and low-performing students.
Keystroke logging data, which tracks text input from a keyboard, was used in four studies (10.53%). Cao et al. (2020) and Sinharay et al. (2019) examined keystroke logging data during the writing process, providing detailed records of keystroke sequences and timing. Similarly, Ahadi et al. (2015) recorded every key press and related information, such as the time during students’ programming tasks. Some studies combined multiple data types, like Ludwig et al. (2024) considered both clickstream and keystroke data in their study.
Other process data types appeared less frequently. Response time data, which emphasizes how quickly examinees perform actions at the item or test level, was used in only two studies (5.26%). These studies identified careless respondents (Schroeders et al., 2022) and rapid-guessing (RG) behaviors (Guo et al., 2024). By categorizing response times (e.g., ‘rapid’ vs. ‘prolonged’), researchers can better interpret a student’s engagement or difficulty with items (Guo et al., 2024).
Eye tracking data appeared in only one study (2.63%), focusing on students’ visual behaviors, revealing where they looked, how long they focused, and what was the movement patterns of their gaze. More specifically, to analyze students’ English reading skills, Guan et al. (2022) recorded the examinees’ eye gaze locations, fixation frequency on page i, and fixation rates in line j on that page.
Fernández-Fontelo et al. (2023) explored mouse movements (2.63%) in web surveys, particularly capturing metrics such as Euclidean distance traveled by the mouse, maximum movement acceleration, and changes in movement direction along horizontal or vertical axes, among others. Their findings showed that excessive or erratic mouse activity correlated with low-quality responses, while specific behaviors like hovering or regressive movement were linked to task difficulty.
While most data focus on human–computer interactions, a few incorporate human–human interactions. For example, Ohmoto et al. (2024) captured participants’ gaze, speech, and facial expressions during collaborative tasks, creating multimodal data that combines different interaction types to estimate learners’ ICAP (interactive–constructive–active–passive) states.

3.2.2. RQ2: What Specific Measurement Issues Can Be Effectively Addressed Through the Use of Process Data?

Process data plays a vital role in addressing various measurement challenges in educational contexts. One major application is predicting learning outcomes (Alsuwaiket et al., 2020; Rohani et al., 2024; Chen & Cui, 2020; Ludwig et al., 2024; Sinharay et al., 2019). For example, Rohani et al. (2024) employed a CatBoost classifier to predict students’ binary scores on each mathematical problem of end-unit assignments, using clickstream data as input. Such predictive models help identify topics students struggle with, enabling teachers to adjust content pacing and provide timely, targeted interventions.
The richness of process data also extends to understanding cognitive skills and problem-solving or learning processes (Salles et al., 2020; Guan et al., 2022; Pejić & Molcer, 2021; Ohmoto et al., 2024). For example, learners’ interaction states in collaborative learning can be explored based on multimodal data (Ohmoto et al., 2024). Ohmoto et al. (2024) investigated a method for estimating learners’ states using nonverbal cues from multimodal interactions, including gaze, speech (utterances), facial expressions, and voice, during collaborative concept-map tasks. The results suggest a performance hierarchy of interactive > constructive > active > passive. Similarly, Sun et al. (2019) incorporated variables such as the number of attempts, response time, and hint requests to analyze students’ learning processes and estimate their evolving knowledge states over time. These insights guide teachers to design more effective collaborative activities that foster higher-order thinking and engagement.
In addition, process data helps reveal behavioral patterns and problem-solving strategies (Salles et al., 2020; Rohani et al., 2024; Ludwig et al., 2024; N. Zhang et al., 2022). One example is Ludwig et al. (2024)’s study, the authors examined problem-solving behaviors among students with varying success levels, distinguishing more and less success groups based on a threshold score of 53 on a sum scale ranging from 7 to 80. They found that taking notes and thoroughly exploring the learning environment were identified as potentially beneficial strategies associated with success. Conversely, patterns of engagement limited to only the first document suggested a less successful approach. These findings demonstrated how specific behavioral patterns contribute to successful outcomes.
Furthermore, process data analysis aids in exploring how and why students disengage from educational software, and enabling timely interventions (Liao & Wu, 2022; Schroeders et al., 2022; Sabourin et al., 2013). Reduced interaction frequency, delayed response times, and repetitive or unproductive actions can be identified as symptoms of disengagement (Guo et al., 2024; Sabourin et al., 2013). For example, Ulitzsch et al. (2023) used early-window clickstream data and machine learning to predict potential task failure, showing how early behavior patterns can be used for timely intervention.
In summary, these analyses directly contribute to improving educational outcomes by capturing individual differences in learning progress and study strategies, enabling educators to devise effective, personalized approaches for scaffolding student behaviors. They also provide more precise guidance and feedback, and establish early detection to identify students most at risk (Yu et al., 2018).

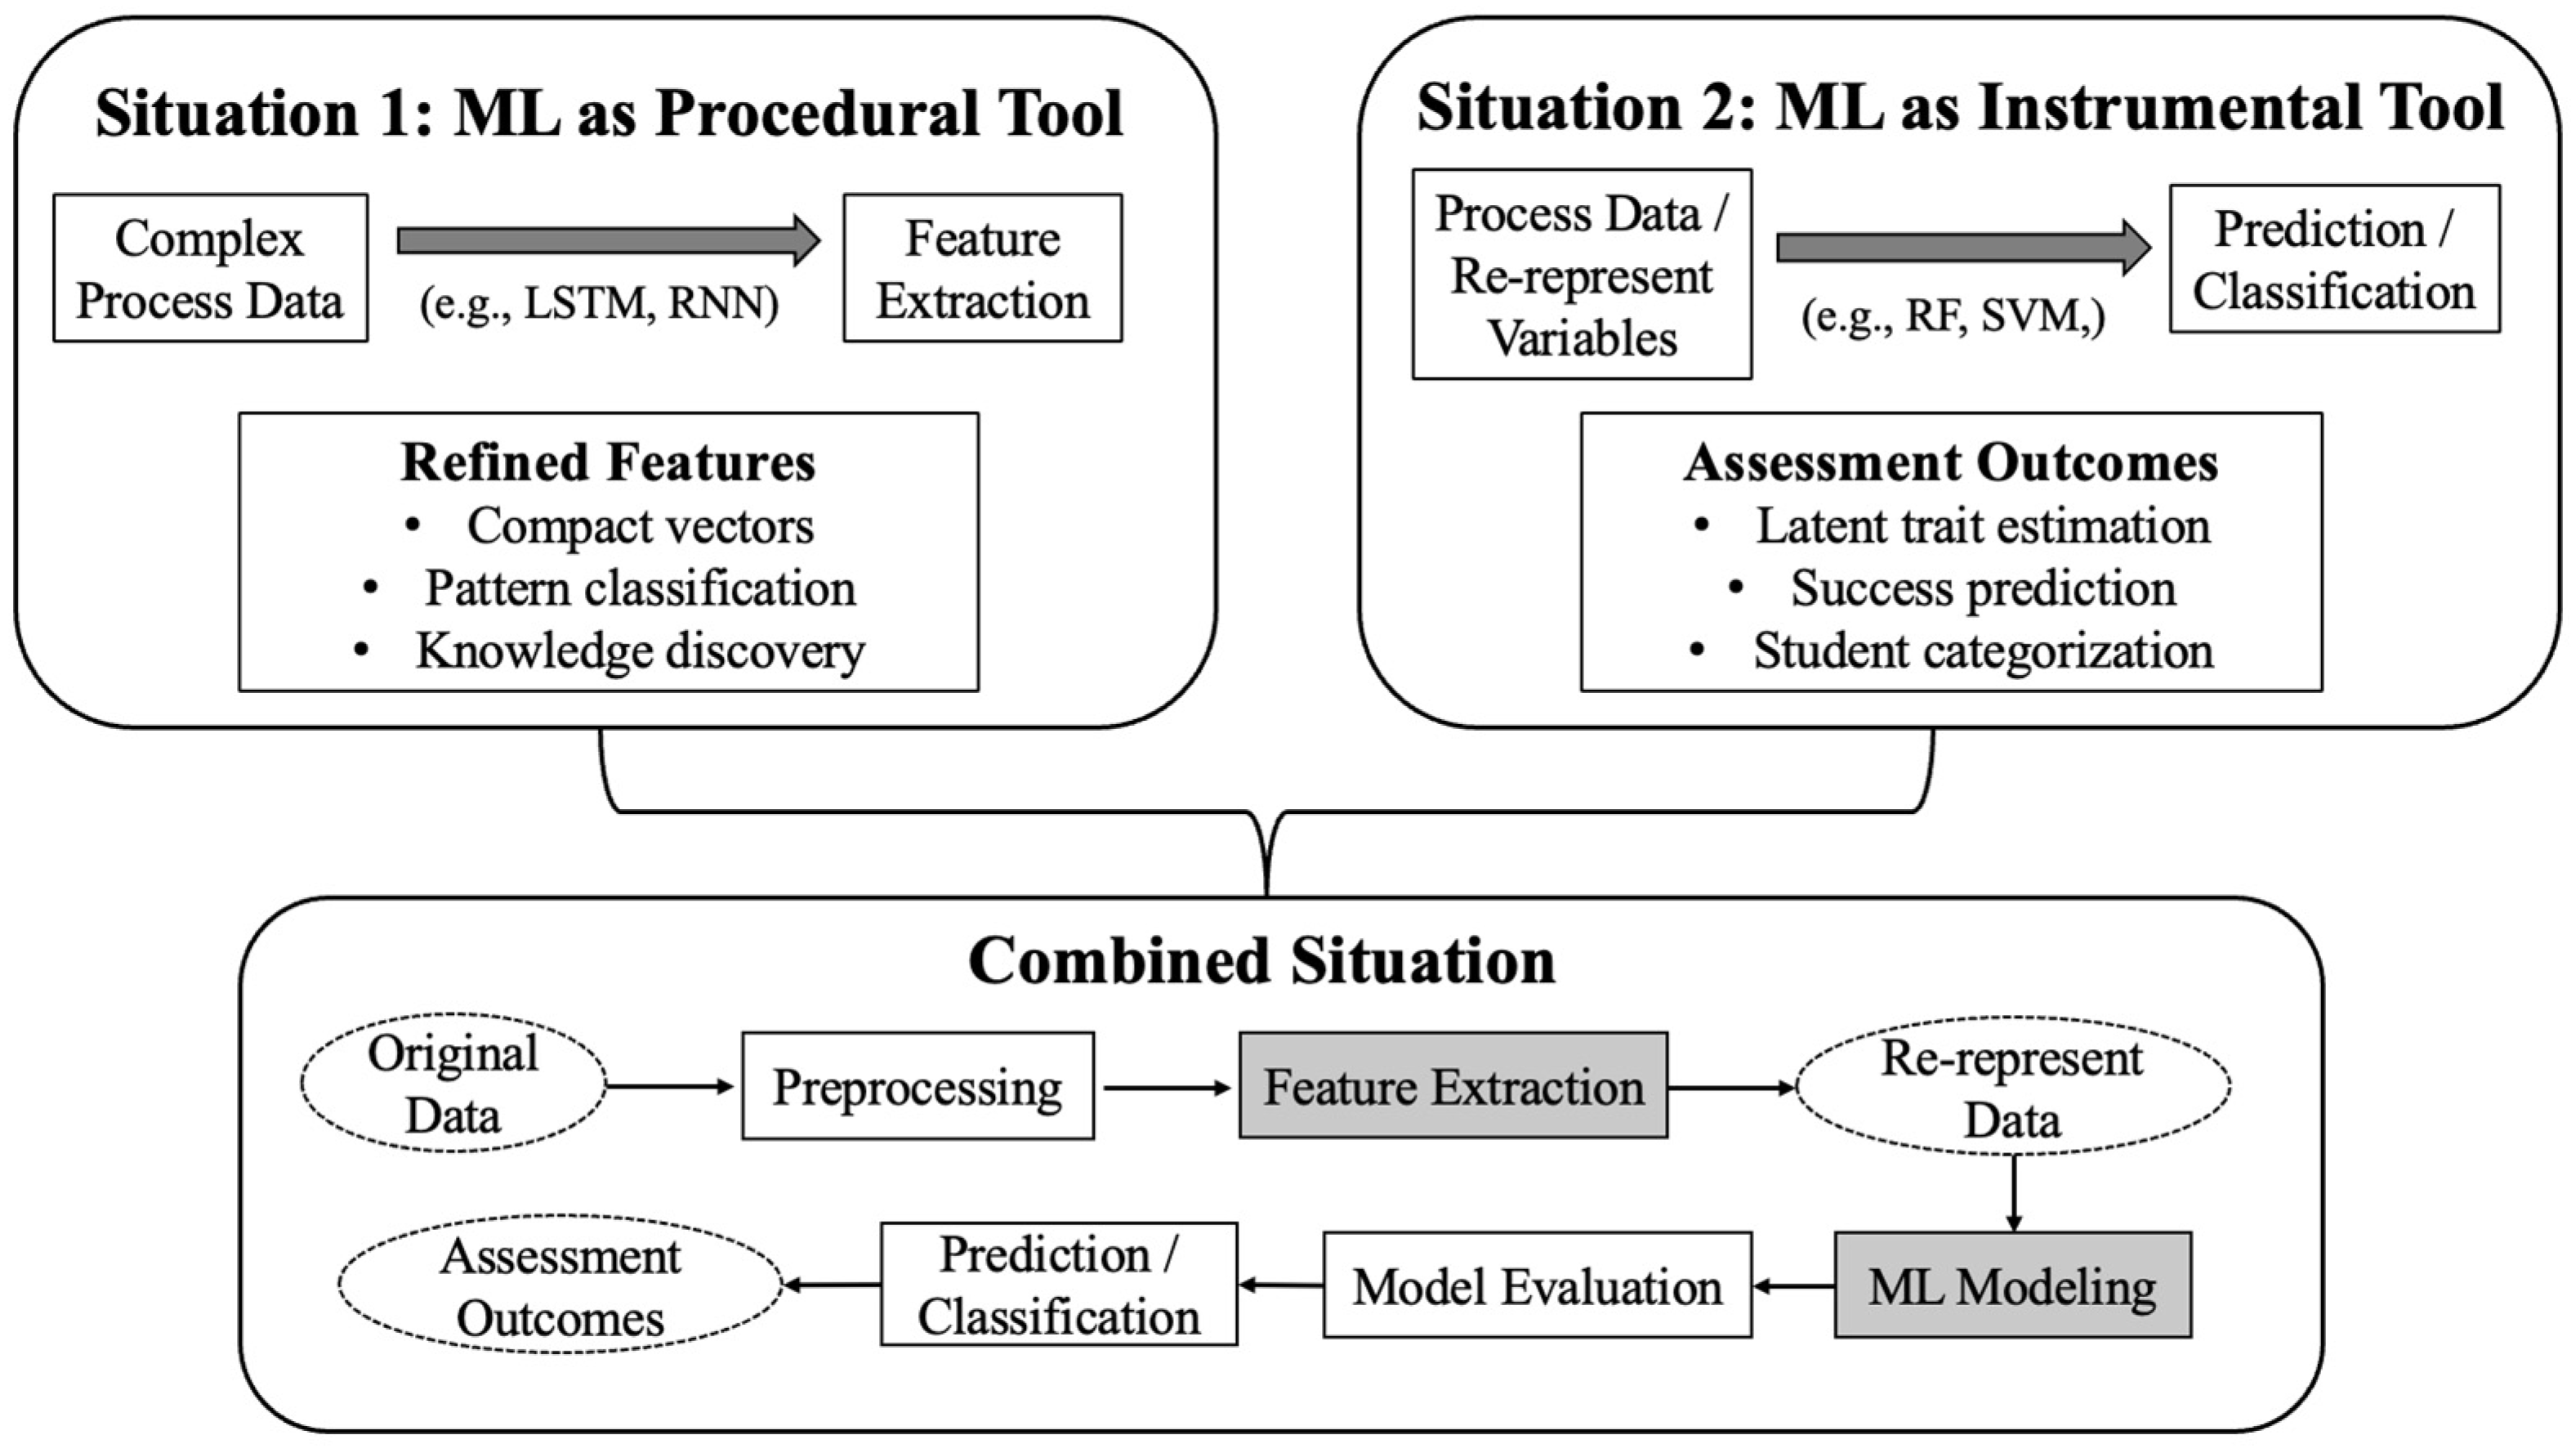
3.2.3. RQ3: How Can ML Approaches Be Employed to Fully Leverage the Information Derived from Process Data?

The application of ML demonstrates significant potential for enhancing instruction and learning, especially in areas where human knowledge about learner behavior is limited (Yu et al., 2018). Based on the reviewed literature, ML applications generally fall into two main categories, as shown in Figure 4.
In Situation 1, ML is used as a procedural tool, essentially acting like a coder or part of that to re-represent variables for clarity and relevance. Specifically, convert complex and high-dimensional input—the original process data—into more compact and manageable vectors. This process facilitates knowledge discovery and pattern classification among numerous redundant or irrelevant features, and extracts useful features as the refined input to gather further assessment outcomes (Salles et al., 2020; Tang et al., 2021; Chen & Cui, 2020; Han et al., 2019; Cao et al., 2020; Guan et al., 2022; Xu et al., 2020; J. Zhang et al., 2022; Lu et al., 2024; Petkovic et al., 2016; Y. Li et al., 2017). For example, Tang et al. (2021) developed an autoencoder with recurrent neural networks (RNN), this autoencoder can compress original unstructured response processes into a consistent format with a fixed set of numerical values. By identifying key variables, teachers can gain insights into student behaviors that would be difficult to observe without the aid of ML.
Conversely, in situation 2, ML methods serve as instrumental tools to estimate students’ latent traits or other practical measurement purposes (related to the answers for question 2). This is exemplified by endeavors such as estimating learners’ proficiency in latent skills, including learning outcome modeling or predicting the successfulness of task solving (Salles et al., 2020; Rohani et al., 2024; Chen & Cui, 2020; Ahadi et al., 2015; Sinharay et al., 2019; Ulitzsch et al., 2023; Hoq et al., 2024; Al-Azazi & Ghurab, 2023; Bertović et al., 2022). For example, Pejić and Molcer (2021) used several ML (e.g., Naïve Bayes) models to predict students’ problem-solving success by uncovering the relationship between the strategies and the problem-solving capabilities of students. Furthermore, ML is also useful for categorizing different respondents in situation 2. For example, based on mouse-tracking data, tree-based models and a support vector machine (SVM) were used to classify respondents according to their difficulty in understanding questions’ intent (Fernández-Fontelo et al., 2023). These predictions empower educators to adjust their teaching approach in real time, offering tailored feedback or guidance to struggling students.
In some research, both situations are combined. For example, Y. Li et al. (2017) first used neural networks to generate effective feature representations. Then, an SVM was applied as a classifier to predict the learning state for students in the next two consecutive weeks.
When considering the most feasible methods across studies, Random Forest (RF) appeared most frequently. It was primarily used for predicting learning outcomes (Ludwig et al., 2024; Guan et al., 2022; Pejić & Molcer, 2021; Petkovic et al., 2016), classifying learners (Salles et al., 2020; Ahadi et al., 2015), and selecting important features (Han et al., 2019). RF has been widely applied in contexts such as mathematics (Salles et al., 2020; J. Zhang et al., 2022), programming (Ahadi et al., 2015), problem-solving (Han et al., 2019; Ludwig et al., 2024; Pejić & Molcer, 2021), and collaborative learning (Richters et al., 2023). Support Vector Machine (SVM/SVC) and Long Short-Term Memory (LSTM) models also appeared frequently. SVM/SVC serves similar functions to RF, particularly in tasks requiring robust classification (Singh, 2023; Qiu et al., 2022; Sun et al., 2019; Fernández-Fontelo et al., 2023; Hoq et al., 2024; Ohmoto et al., 2024; Y. Li et al., 2017). In contrast, LSTM is mainly used to model sequential or time-based student behaviors (Guo et al., 2024; Al-Azazi & Ghurab, 2023; Pardos et al., 2017) and is commonly applied in knowledge tracing (S. Li et al., 2021), learning path prediction (Chen & Cui, 2020), and problem-solving process analysis (Tang et al., 2021).

4. Discussion

According to the analyses presented above, among various types of process data, clickstream data stands out for its widespread use, particularly in machine learning applications. One reason is that clickstream naturally fits into the way students interact with digital content on most learning or testing systems. It records events like clicks, navigation, and timestamps without requiring any additional hardware. Compared to other data types, clickstream data might be easier to collect at scale, less intrusive, and more privacy-friendly. Eye-tracking, for instance, requires specialized equipment and controlled environments, making it less practical for large-scale educational settings. Keystroke data, while useful, often lacks contextual information about task navigation or resource use. In contrast, clickstream data provides a rich sequence of learner actions that can be easily logged, analyzed, and interpreted using ML techniques. These advantages make clickstream data a practical and powerful choice for educational data mining and real-time learning analytics. This observation aligns with Figure 3, where “Clickstream” related themes such as “deep learning” and “MOOC” appear in mature positions.
Despite its complex structure and large volume, process data extends beyond final scores. It provides deep insights into students’ problem-solving strategies, engagement trajectories, and cognitive processes. Importantly, it can reveal early signs of disengagement or difficulty. Once such patterns emerge, targeted interventions can be deployed dynamically—either by instructors or through adaptive learning systems. For example, the systems may adjust difficulty levels, refine explanations, or deliver personalized resources to better support individual learners (Rohani et al., 2024; Guo et al., 2024; Hoq et al., 2024).
Applying ML to process data reflects a growing trend in psychometric research aimed at improving the precision and adaptability of educational assessment. While not without limitations, ML can support key stages of data analysis—such as feature extraction and predictive modeling—to inform instructional decision-making. In practice, ML-based systems may offer timely, data-driven support to learners. For example, when rapid guessing is detected, the system might prompt students to slow down; when prolonged effort is observed on a single item, it could suggest moving forward (Guo et al., 2024). Ludwig et al. (2024) further demonstrate that metacognitive prompts can support at-risk students by guiding them to access critical learning materials at appropriate stages. Ultimately, by integrating behavioral data into adaptive learning frameworks, the static, one-time assessments move toward continuous, data-informed educational interventions that optimize student learning trajectories. These applications suggest that process data, when thoughtfully interpreted, can contribute to more responsive and individualized educational experiences. However, their effectiveness still depends on the quality of data, the appropriateness of models, and alignment with pedagogical goals.

4.1. Challenges and Opportunities in This Field

The collective findings across these studies consistently underscore the considerable potential of ML in educational assessment within complex educational processes. However, despite these promising outcomes, challenges also persist within this field.

4.1.1. Challenges for Feature Extraction or Selection

Feature extraction is a critical step in organizing and interpreting process data, and it emerges as a promising and increasingly emphasized direction, as illustrated in Figure 3. However, this step can be time-consuming, costly, and labor-intensive due to the complexity of the data, the need for domain knowledge and the substantial human effort involved. In the context of teaching and learning, feature extraction is not just about gathering data, but about ensuring that the extracted features are meaningful and aligned with educational goals (Levin, 2021; Bosch, 2021; J. Zhang et al., 2022). While ML has great potential to streamline and enhance feature extraction compared to traditional methods, there are still significant challenges.
In practice, many prevalent ML approaches for feature extraction or selection are predominantly data-driven, with limited theoretical grounding (Tang et al., 2021; Hilbert et al., 2021). For instance, the selection of features often depends on statistical calculations such as Pearson correlation (Bosch, 2021) or optimization via a loss function (Tang et al., 2021; Chen & Cui, 2020; Hilbert et al., 2021). While these approaches successfully extract features from the large database, the extracted features may be an abstract representation of the original features (Y. Li et al., 2017), lacking the power to explain the relationship between behavior and individual ability levels, especially in establishing causal connections. Furthermore, the number of features extracted or selected can sometimes be set arbitrarily (Tang et al., 2021), without robust theoretical or empirical justification, potentially leading to overfitting or misinterpretation of learning behaviors.
Additionally, the importance of different features can be misjudged and may vary significantly across ML models. For instance, features that are initially considered less important based on statistical criteria may carry significant pedagogical value. When Bosch (2021) evaluated the selected features, it became clear that, without domain expertise and a deeper understanding of the learning processes, it was difficult to interpret what some of them represented. One such feature, “the event count for problem ID VH098740,” seemed irrelevant for most students, who had a single event count. However, the feature captured instances where students revisited the problem, indicating whether they (a) skimmed it initially and spent more time later or (b) spent time initially and reviewed it briefly later. Therefore, without a theoretical framework to guide the interpretation, it becomes more challenging to determine the true pedagogical significance of a feature (Rohani et al., 2024; Pejić & Molcer, 2021; Levin, 2021; Bosch, 2021; J. Zhang et al., 2022).
Moreover, excessive feature extraction can lead to overfitting and reduce model interpretability. Given the large volume of process data, it is common to extract an excessive number of features. For instance, the TSFRESH (Time Series Feature Extraction on basis of Scalable Hypothesis tests) applied in Bosch’s research (Bosch, 2021), is a tool designed for purely numeric sequence data, generates features like mean, standard deviation, linear slopes, and polynomial function coefficients. It extracted 476, 516, and 460 features from students’ 10-, 20-, and 30 min interaction data, respectively (Bosch, 2021). Many of these extracted features are likely to be irrelevant or highly correlated, resulting in the generation of inefficient decision trees. This can also lead to confusion, as teachers may find hard time to focus on the most important factors affecting student learning.
While data-driven ML offers powerful tools for processing large datasets, it is crucial to recognize its limitations and strive for a balanced approach that incorporates theoretical considerations and domain expertise to ensure the extracted features are not only predictive but also pedagogically sound, actionable and efficient.

4.1.2. Challenges for Estimation and Results Analysis

As shown in Figure 3, “student modeling” emerges as a widely discussed but still developing theme, reflecting the growing need for examinee-centered approaches in ML applications. In this context, the estimation and analysis of ML results are crucial for extracting meaningful insights, requiring both interpretability and clarity in communicating findings to teachers, students, and other relevant organizations or individuals. Traditional measurement models can provide some useful information, such as the item difficulties and the distribution of examinees’ abilities, and adhere to criteria that have been rigorously tested over the years. The integration of process data with ML introduces both opportunities and challenges regarding interpretability and alignment with these traditional standards (Levin, 2021; J. Zhang et al., 2022).
The first challenge lies in scalability. Traditional measurement aims to quantify and assess various educational attributes and provide a quantitative basis for understanding and evaluating an individual’s educational profile (Chang et al., 2021), such as the total score or latent ability. Presently, the predominant focus of many studies revolves around the application of supervised ML methods for classification and prediction instead of scaling, such as detecting careless responding (Schroeders et al., 2022), predicting student performance (pass/fail) in e-learning (Qiu et al., 2022), categorizing students into ‘low’ and ‘high’ groups (Lu et al., 2024) and more (Guo et al., 2024; Ludwig et al., 2024; Sun et al., 2019; Ahadi et al., 2015; Pejić & Molcer, 2021; Levin, 2021; Ohmoto et al., 2024; Y. Li et al., 2017). While ML techniques are powerful for identifying patterns and making predictions based on process data, there is a noted gap in their application to generate continuous, standardized scales, which are integral to traditional measurement models.
Another critical concern in the use of ML for education is replicability. Researchers have observed instances where results obtained in the training sample cannot be replicated with the test sample (Hilbert et al., 2021). Additionally, even a minor alteration in the data can lead to significantly different splits in decision tree methods, resulting in a tree that appears vastly different from the original one (Sinharay et al., 2019). Specifically, Ahadi et al. (2015) indicated that when a model built on spring semester data was tested on fall semester data within the same context, the results differed, highlighting that models are tuned to a specific context and dataset and may need adjustment if the context changes (e.g., teaching approach, materials). This lack of stability can reduce the reliability of ML models in educational settings, where consistent and dependable results are necessary to make informed teaching decisions. Without replicability, it becomes difficult for educators to trust that the insights from ML models will remain consistent over time and across different contexts.
In summary, while ML offers significant promise for analyzing educational process data, the challenges of scalability and replicability need to be addressed. Overcoming these challenges will ensure that ML-derived insights can be confidently used to inform teaching and learning practices, providing meaningful, actionable feedback for educators and students alike.

4.2. Implications for Future Studies

This study conducted a systematic literature review to infer more detailed information about an individual’s skill profile, underlying cognitive process, and therefore explore the potential for developing personalized and adaptive learning systems. Built upon the findings, several directions for future research hold promise.
Ensuring equity in ML models across diverse student groups: Within the realm of ML applications, it is worthwhile investigating whether these models demonstrate varying functionality for comparable students across different groups, as defined by process data. For example, N. Zhang et al. (2022) conducted a slicing analysis to evaluate model performance across different demographic subgroups of students based on gender and race/ethnicity. They found that most ML-based detectors function better for certain subgroups than others. Such subgroup analyses are similar to the concept of differential item functioning (DIF) in traditional measurement, as both examine model performance across groups to identify bias and unfairness.
Advancing multiclass models or process profiles: While current ML modeling based on educational process data primarily yields binary classification results, there is potential for advancement toward multiclass analysis. This shift could facilitate more precise educational interventions. For example, rather than labeling students as simply “high-performing” or “low-performing”, Al-Azazi and Ghurab (2023) proposed a day-wise multi-class model to predict students’ performance in MOOCs, which allows for the identification of students who might be “withdrawn,” “failing,” or performing at different levels of “passed.” Moreover, creating process profiles aims to provide a holistic view of students’ entire test-taking processes and link them to performance and perhaps student adaptive learning (Guo et al., 2024). While not necessarily resulting in a single continuous scale, these profiles could potentially offer a more nuanced and contextualized understanding of student performance. Both multiclass models and process profiles could be applied to more complex educational outcomes, such as mastery in different skill domains, making assessments more reflective of real-world educational scenarios.
Achieving personalized learning through student-centered features: ML feature attribution, based on general rules, is often heuristic and not individualized for each prediction. While some studies have attempted more detailed feature extraction, such as categorizing features into problem-, student- and assignment-levels (Rohani et al., 2024). These efforts remain limited in addressing individualization. To move towards personalized learning and assessment, future studies could incorporate individual characteristics such as learning styles and historical records. Monitoring each student’s learning progress dynamically, perhaps through methods like knowledge tracing, could enhance adaptive learning systems and improve personalization. For example, if we figure out that a student engages more deeply with visual aids (reflected by some extracted features), the learning tools could provide more learning materials that emphasize visual representations, such as geometric diagrams for geometry or conceptual models for mathematics problem solving. Additionally, forward supervised selection and backward elimination wrapper methods are recommended after feature extraction. These methods involve iterative processes to remove redundant features that are highly correlated with others. Alternatively, each feature could be evaluated individually by training a new one-feature ML model (Bosch, 2021).
Integrating human expertise with ML: The reliance on supervised ML methods introduces the need for specific standards to evaluate the classification accuracy of these models. While technological advancements enable more sophisticated assessments, human raters often remain essential, particularly in cases involving subjective judgment or complex skill evaluations, such as mathematical reasoning or the application of concepts in real-world contexts. Previous studies have proven that hybrid approaches that utilize both data mining techniques and expertly engineered features have even shown improved performance (Levin, 2021). To ensure that ML models produce robust and trustworthy results, future research should further explore hybrid systems where human expertise complements automated scoring, enhancing both efficiency and reliability in high-stakes educational assessments.
Strengthening pedagogical frameworks to guide ML applications: While data-driven approaches uncover hidden patterns and relationships within educational datasets, their pedagogical value is maximized when guided by strong theoretical frameworks. For example, the evidence-centered design (Hao et al., 2016) provides a framework for designing online/game-based assessments, enhancing our ability to draw meaningful inferences from process data by integrating sound test design principles from the outset. Or perhaps applying a model-based problem-solving framework to evaluate whether students understand mathematical relations in problem solving (Cetintas et al., 2009; Wei et al., 2023).

5. Conclusions

This systematic review synthesized 38 studies (2013–2024) on machine learning (ML) applications for educational process data analysis. The results reveal that this is an emerging and promising field. Although various ML methods have been explored, their use remains at an early stage. Topics such as feature engineering, knowledge tracing, and simulation are gaining traction and represent growing areas of interest. The main findings for answering the three research questions are summarized as follows:
Dominant Data Paradigm: Clickstream data (81.58% of studies) emerged as the primary form of process data due to its scalability and rich behavioral signals. Meanwhile, researchers have shown sustained interest in collecting such data from large-scale, data-rich learning environments, such as MOOCs.
Analytical Priorities: Process data have been used to support a range of objectives, including predicting learning outcomes, understanding cognitive skills and problem-solving or learning processes, revealing behavioral patterns and problem-solving strategies, and exploring how and why students disengage.
ML Applications: Both supervised and unsupervised ML methods were employed (e.g., RF, RNN, and SVM). These methods typically served two key roles: (1) as a procedural tool to re-represent raw variables into meaningful features, and (2) as an instrumental tool to support educational measurement objectives.
Given the above main findings, this review highlights the ongoing challenges related to feature extraction, latent trait estimation, and interpretability of results. To address these issues and enhance future research, we propose the following directions: (1) ensuring equity in ML models across diverse student groups, (2) advancing multiclass models or process profiles, (3) achieving personalized learning through student-centered features, (4) integrating human expertise with ML, and (5) strengthening pedagogical frameworks to guide ML applications.
A limitation of this systematic review is the possibility of missing relevant articles. This could be due to the omission of articles that do not explicitly include our search terms in their title, abstract, or keywords, and which may not have surfaced in the references or journals we consulted. Additionally, our search was limited to specific time frames and sources, which may lead to missing other relevant articles. A more expansive and ongoing review, incorporating additional databases and potentially overlooked sources, may provide a fuller picture of the current state of the field. As with all literature reviews, our findings should be interpreted with an awareness of these limitations, and we encourage future research to build upon and refine the insights presented here.

Author Contributions

Conceptualization, J.H.; methodology, J.H. and Y.P.X.; data curation, J.H.; writing—original draft preparation, J.H.; writing—review and editing, J.H., Y.P.X. and H.H.C.; visualization, J.H.; supervision, H.H.C. All the authors contributed to and have approved the final manuscript. All authors have read and agreed to the published version of the manuscript.

Funding

This research received no external funding.

Institutional Review Board Statement

Not applicable.

Informed Consent Statement

Not applicable.

Data Availability Statement

The original contributions presented in this study are included in the article and its appendix. Further inquiries can be directed to the corresponding author.

Conflicts of Interest

The authors declare no conflict of interest.

Appendix A

Ref. 1PD 2 TypeML 3 MethodsResearch Aims/ML FunctionsCompetency/Fulfilled
Salles et al. (2020)Clickstream RF, DBSCAN, K-means, K-means++Determining predictive power of models and most predictive features and categorizing students’ mathematical strategic behaviors and proceduresMathematics
S. Li et al. (2021)Clickstream LSTM, GRUCharacterizing temporary knowledge state; Knowledge tracingKnowledge Tracking
Singh (2023)ClickstreamSVM, DT, KNNPredicting students’ academic performanceInnovation
Rohani et al. (2024)ClickstreamClickTree, CatBoostPredicting students’ scoresMathematics
Qiu et al. (2022)ClickstreamSVC, NB, KNNPredicting online students’ behavior classificationLearning performance on 7 course modules
Tang et al. (2021)Clickstream RNN, LSTM, GRUCreating an autoencoder to extract features Problem-solving ability
Guo et al. (2024)Clickstream and Response TimeLSTM, RF, SVMCompressing the input sequential data and categorizing students into different process profilesMathematics
Chen and Cui (2020)Clickstream LSTMPredicting learning outcomes and analyzing the learner and item-skill associationsMathematics
Wang et al. (2023)Clickstream RNN, GRU, HMM, eHMMPredicting action sequences to decompose each response process into several subprocesses and identify corresponding subtasks Problem-solving strategies
Han et al. (2019)ClickstreamRFSelecting featuresProblem-solving ability
Liao and Wu (2022)Clickstream RF, SVM, FCNN, LSTM Categorizing discourse into statistics-relevant or -irrelevant messagesLearning engagement
Ludwig et al. (2024)Clickstream and KeystrokeRFPredicting students’ problem-solving successScenario-based problem-solving ability
Sun et al. (2019)Clickstream CART, SVMPredicting students’ correct answers; Knowledge tracingKnowledge Tracking
Bosch and Paquett (2017)Clickstream DNN, RNN, VAE, CNN, ANSExtracting embedded representations (embeddings)Learning engagement
Cao et al. (2020)Keystroke LoggingCARTEvaluating the effectiveness of key predictors on differentiating students’ writing performanceScenario-based writing processes
Ahadi et al. (2015)Keystroke Logging NB, BN, DT, RF, DSDetecting high- and low-performing studentsProgramming ability in Java
Fernández-Fontelo et al. (2023)Mouse MovementDT, RF, GBM, DNN, SVMPrediction for item difficultyEmployment research items
Richters et al. (2023)Clickstream SVC, RF, GBMPredicting diagnostic accuracyCollaborative diagnostic reasoning ability
Guan et al. (2022)Eye Tracking DT, RFCharacterizing the predictive effect of behavior indicators on reading performanceEnglish reading skill
Pejić and Molcer (2021)Clickstream NB, LR, DT, RF, GBM.Predicting the outcome of the Climate Control problem-solving taskProblem-solving ability
Sinharay et al. (2019)Keystroke LoggingCART, SGBMPredicting essay scoresWriting process ability
Ulitzsch et al. (2023)ClickstreamXGBoostPredicting the risk of failure at an early stage on interactive tasksProblem-solving ability
Xu et al. (2020)Clickstream HBCMClustering the event types Problem-solving ability
Schroeders et al. (2022)Response TimeSGBMIdentifying careless respondentsCareless/aberrant responding
N. Zhang et al. (2022)Clickstream AST, SPMPredicting students’ computational model-building performance and assessing students learning behaviorsStrategic Learning Behaviors
Sabourin et al. (2013)Clickstream DBNDetecting whether students’ off-task behaviors are cases of emotional self-regulationLearning engagement
Levin (2021)Clickstream XGBoostCategorizing students based on whether they would use their time efficientlyMathematics
Bosch (2021)Clickstream TSFRESH, Featuretools, CART, ETExtracting predictive and unique featuresMathematics
J. Zhang et al. (2022)Clickstream XGBoost, LR, Lasso, DT, RFDetecting self-regulated behaviors automatically; predicting the presence or absence of the self-regulated learning constructsMathematics
Hoq et al. (2024)ClickstreamStacked Ensemble Model (KNN, SVM, XGBoost)Predicting final programming exam gradesProgramming
Ohmoto et al. (2024)MultimodalSVMPredicting participants’ interactive-constructive-active-passive stateCollaborative state
Lu et al. (2024)ClickstreamUnsupervised ML (SVD et al.) Ensemble Learning (SVC, RF et al.)Conducting dimension reduction and identifying intersectional latent variables across feature sets and categorizing students into “Low” and “High” groupsProblem-solving ability
Al-Azazi and Ghurab (2023)ClickstreamLSTMPredicting the class of student performanceLearning performance on 7 course modules
Petkovic et al. (2016)Clickstream RFPredicting the effectiveness of software engineering teamwork learning and discovering factors that contribute to predictionStudent learning effectiveness in software engineering teamwork
Bertović et al. (2022)Clickstream SVC, RF, LR, Gaussian NB, DTPredicting students’ gradesProgramming ability in Python
Yu et al. (2018)Clickstream RNN, LSTM, GRUPredicting the next URL for each student Learning pathways
Pardos et al. (2017)ClickstreamRNN, LSTMModeling navigation behavior and predicting the most likely next course URLSelf-regulated learning
Y. Li et al. (2017)ClickstreamNN, RNN, SVMPredicting learners’ state for the next two consecutive weeksCourse engagement
Note: 1 Ref. means reference. 2 PD means process data. 3 ML means machine learning. For the ML (machine learning) methods, NN is neural network, NB is naive Bayes, BN is Bayesian network, DBN is dynamic Bayesian network, DNN is deep neural network, RNN is recurrent neural network, KNN is K-nearest neighbor, VAE is variational autoencoder, CNN is convolutional neural network, ANS is asymmetric network structure, HMM is hidden Markov model, eHMM is an extension of HMM, AST is abstract syntax tree, SPM is sequential pattern mining, SVC is support vector classifier, RF is random forest, ET is extra tree, LSTM is long short-term memory, GRU is gate recurrent unit, GBM is gradient boosting machine, SGBM is stochastic gradient boosting machine, FCNN is fully connected neural network, DT is decision tree, XGBoost is extreme gradient boosting, CART is classification and regression tree, LR is logistic regression, DBSCAN is density-based spatial clustering of applications with noise, DS is decision stump, DKT is deep knowledge tracing, TSFRESH is time series feature extraction on the basis of scalable hypothesis testing, HBCM is a hierarchical Bayesian continuous-time model, and SVD is singular value decomposition.

References

  1. Ahadi, A., Lister, R., Haapala, H., & Vihavainen, A. (2015, August 9–13). Exploring machine learning methods to automatically identify students in need of assistance. Eleventh Annual International Conference on International Computing Education Research (pp. 121–130), Omaha, NE, USA. [Google Scholar]
  2. Al-Azazi, F. A., & Ghurab, M. (2023). ANN-LSTM: A deep learning model for early student performance prediction in MOOC. Heliyon, 9(4), e15382. [Google Scholar] [CrossRef]
  3. Alsuwaiket, M., Blasi, A. H., & Al-Msie’deen, R. F. (2020). Formulating module assessment for improved academic performance predictability in higher education. arXiv, arXiv:2008.13255. [Google Scholar] [CrossRef]
  4. Baker, R., Xu, D., Park, J., Yu, R., Li, Q., Cung, B., Fischer, C., Rodriguez, F., Warschauer, M., & Smyth, P. (2020). The benefits and caveats of using clickstream data to understand student self-regulatory behaviors: Opening the black box of learning processes. International Journal of Educational Technology in Higher Education, 17, 1–24. [Google Scholar] [CrossRef]
  5. Bertović, D., Mravak, M., Nikolov, K., & Vidović, N. (2022, September 22–24). Using moodle test scores to predict success in an online course. 2022 International Conference on Software, Telecommunications and Computer Networks (SoftCOM) (pp. 1–7), Split, Croatia. [Google Scholar]
  6. Bleidorn, W., & Hopwood, C. J. (2019). Using machine learning to advance personality assessment and theory. Personality and Social Psychology Review, 23(2), 190–203. [Google Scholar] [CrossRef] [PubMed]
  7. Bosch, N. (2021). AutoML feature engineering for student modeling yields high accuracy, but limited interpretability. Journal of Educational Data Mining, 13(2), 55–79. [Google Scholar]
  8. Bosch, N., & Paquette, L. (2017, June 25–28). Unsupervised deep autoencoders for feature extraction with educational data. Deep Learning with Educational Data Workshop at the 10th International Conference on Educational Data Mining, Wuhan, China. [Google Scholar]
  9. Cao, Y., Chen, J., Zhang, M., & Li, C. (2020). Examining the writing processes in scenario—Based assessment using regression trees. ETS Research Report Series, 2020(1), 1–16. [Google Scholar] [CrossRef]
  10. Cetintas, S., Si, L., Xin, Y. P., & Hord, C. (2009, July 1–3). Predicting correctness of problem solving from low-level log data in intelligent tutoring systems. 2nd International Working Group on Educational Data Mining, Cordoba, Spain. Available online: https://files.eric.ed.gov/fulltext/ED539041.pdf (accessed on 7 May 2025).
  11. Chang, H. H., Wang, C., & Zhang, S. (2021). Statistical applications in educational measurement. Annual Review of Statistics and Its Application, 8(1), 439–461. [Google Scholar] [CrossRef]
  12. Chen, F., & Cui, Y. (2020). LogCF: Deep collaborative filtering with process data for enhanced learning outcome modeling. Journal of Educational Data Mining, 12(4), 66–99. [Google Scholar]
  13. Estacio, R. R., & Raga, R. C., Jr. (2017). Analyzing students online learning behavior in blended courses using Moodle. Asian Association of Open Universities Journal, 12(1), 52–68. [Google Scholar] [CrossRef]
  14. Fernández-Fontelo, A., Kieslich, P. J., Henninger, F., Kreuter, F., & Greven, S. (2023). Predicting question difficulty in web surveys: A machine learning approach based on mouse movement features. Social Science Computer Review, 41(1), 141–162. [Google Scholar] [CrossRef]
  15. Gardner, J., O’Leary, M., & Yuan, L. (2021). Artificial intelligence in educational assessment: ‘Breakthrough? Or buncombe and ballyhoo?’. Journal of Computer Assisted Learning, 37(5), 1207–1216. [Google Scholar] [CrossRef]
  16. Guan, X., Lei, C., Huang, Y., Chen, Y., Du, H., Zhang, S., & Feng, X. (2022, March 21–23). An analysis of reading process based on real-time eye-tracking data with web-camera—Focus on English reading at higher education level. Proceedings of the 4th Workshop on Predicting Performance Based on the Analysis of Reading Behavior, California, CA, USA. [Google Scholar]
  17. Guo, H., Johnson, M., Ercikan, K., Saldivia, L., & Worthington, M. (2024). Large-scale assessments for learning: A human-centred AI approach to contextualizing test performance. Journal of Learning Analytics, 11(2), 229–245. [Google Scholar] [CrossRef]
  18. Han, Z., He, Q., & Von Davier, M. (2019). Predictive feature generation and selection using process data from PISA interactive problem-solving items: An application of random forests. Frontiers in Psychology, 10, 2461. [Google Scholar] [CrossRef]
  19. Hao, J., Smith, L., Mislevy, R., von Davier, A., & Bauer, M. (2016). Taming log files from game/simulation—Based assessments: Data models and data analysis tools. ETS Research Report Series, 2016(1), 1–17. [Google Scholar] [CrossRef]
  20. Hilbert, S., Coors, S., Kraus, E., Bischl, B., Lindl, A., Frei, M., Wild, J., Krauss, S., Goretzko, D., & Stachl, C. (2021). Machine learning for the educational sciences. Review of Education, 9(3), e3310. [Google Scholar] [CrossRef]
  21. Hoq, M., Brusilovsky, P., & Akram, B. (2024). Explaining explainability: Early performance prediction with student programming pattern profiling. Journal of Educational Data Mining, 16(2), 115–148. [Google Scholar]
  22. Levin, N. A. (2021). Process mining combined with expert feature engineering to predict efficient use of time on high-stakes assessments. Journal of Educational Data Mining, 13(2), 1–15. [Google Scholar]
  23. Li, S., Xu, L., Wang, Y., & Xu, L. (2021, September 24–26). Self-learning tags and hybrid responses for deep knowledge tracing. Web Information Systems and Applications: 18th International Conference, WISA 2021 (Proceedings 18) (pp. 121–132), Kaifeng, China. [Google Scholar]
  24. Li, Y., Fu, C., & Zhang, Y. (2017, June 25–28). When and who at risk? Call back at these critical points. Proceedings of the International Educational Data Mining Society (pp. 25–28), Wuhan, China. [Google Scholar]
  25. Liao, C. H., & Wu, J. Y. (2022). Deploying multimodal learning analytics models to explore the impact of digital distraction and peer learning on student performance. Computers & Education, 190, 104599. [Google Scholar]
  26. Lu, W., Laffey, J., Sadler, T., Griffin, J., & Goggins, S. (2024). A scalable, flexible, and interpretable analytic pipeline for stealth assessment in complex digital game-based learning environments: Towards generalizability. Journal of Educational Data Mining, 16(2), 214–303. [Google Scholar]
  27. Ludwig, S., Rausch, A., Deutscher, V., & Seifried, J. (2024). Predicting problem-solving success in an office simulation applying N-grams and a random forest to behavioral process data. Computers & Education, 218, 105093. [Google Scholar]
  28. Mongeon, P., & Paul-Hus, A. (2016). The journal coverage of Web of Science and Scopus: A comparative analysis. Scientometrics, 106, 213–228. [Google Scholar] [CrossRef]
  29. Ohmoto, Y., Shimojo, S., Morita, J., & Hayashi, Y. (2024). Estimation of ICAP states based on interaction data during collaborative learning. Journal of Educational Data Mining, 16(2), 149–176. [Google Scholar]
  30. Page, M. J., McKenzie, J. E., Bossuyt, P. M., Boutron, I., Hoffmann, T. C., Mulrow, C. D., Shamseer, L., Tetzlaff, J. M., Akl, E. A., Brennan, S. E., Chou, R., Glanville, J., Grimshaw, J. M., Hróbjartsson, A., Lalu, M. M., Li, T., Loder, E. W., Mayo-Wilson, E., McDonald, S., … Moher, D. (2021). The PRISMA 2020 statement: An updated guideline for reporting systematic reviews. BMJ, 372, n71. [Google Scholar] [CrossRef]
  31. Pardos, Z. A., Tang, S., Davis, D., & Le, C. V. (2017, April 20–21). Enabling real-time adaptivity in MOOCs with a personalized next-step recommendation framework. Proceedings of the Fourth (2017) ACM Conference on Learning@ Scale (pp. 23–32), Cambridge, MA, USA. [Google Scholar]
  32. Pejić, A., & Molcer, P. S. (2021). Predictive machine learning approach for complex problem solving process data mining. Acta Polytechnica Hungarica, 18(1), 45–63. [Google Scholar] [CrossRef]
  33. Petkovic, D., Sosnick-Pérez, M., Okada, K., Todtenhoefer, R., Huang, S., Miglani, N., & Vigil, A. (2016, October 12–15). Using the random forest classifier to assess and predict student learning of software engineering teamwork. 2016 IEEE Frontiers in Education Conference (FIE) (pp. 1–7), Eire, PA, USA. [Google Scholar]
  34. Qiu, F., Zhang, G., Sheng, X., Jiang, L., Zhu, L., Xiang, Q., Jiang, B., & Chen, P. K. (2022). Predicting students’ performance in e-learning using learning process and behaviour data. Scientific Reports, 12(1), 453. [Google Scholar] [CrossRef] [PubMed]
  35. Requena, B., Cassani, G., Tagliabue, J., Greco, C., & Lacasa, L. (2020). Shopper intent prediction from clickstream e-commerce data with minimal browsing information. Scientific Reports, 10(1), 16983. [Google Scholar] [CrossRef]
  36. Richters, C., Stadler, M., Radkowitsch, A., Schmidmaier, R., Fischer, M. R., & Fischer, F. (2023). Who is on the right track? Behavior-based prediction of diagnostic success in a collaborative diagnostic reasoning simulation. Large-Scale Assessments in Education, 11(1), 3. [Google Scholar] [CrossRef]
  37. Rohani, N., Rohani, B., & Manataki, A. (2024). ClickTree: A tree-based method for predicting math students’ performance based on clickstream data. arXiv, arXiv:2403.14664. [Google Scholar]
  38. Sabourin, J. L., Rowe, J. P., Mott, B. W., & Lester, J. C. (2013). Considering alternate futures to classify off-task behavior as emotion self-regulation: A supervised learning approach. Journal of Educational Data Mining, 5(1), 9–38. [Google Scholar]
  39. Salles, F., Dos Santos, R., & Keskpaik, S. (2020). When didactics meet data science: Process data analysis in large-scale mathematics assessment in France. Large-Scale Assessments in Education, 8(1), 7. [Google Scholar] [CrossRef]
  40. Schroeders, U., Schmidt, C., & Gnambs, T. (2022). Detecting careless responding in survey data using stochastic gradient boosting. Educational and Psychological Measurement, 82(1), 29–56. [Google Scholar] [CrossRef] [PubMed]
  41. Singh, S. N. (2023, May 11–12). Creativity: Mining of innovative thinking using educational data. 2023 International Conference on Disruptive Technologies (ICDT) (pp. 445–449), Greater Noida, India. [Google Scholar]
  42. Sinharay, S., Zhang, M., & Deane, P. (2019). Prediction of essay scores from writing process and product features using data mining methods. Applied Measurement in Education, 32(2), 116–137. [Google Scholar] [CrossRef]
  43. Sun, X., Zhao, X., Ma, Y., Yuan, X., He, F., & Feng, J. (2019, May 17–19). Muti-behavior features based knowledge tracking using decision tree improved DKVMN. ACM Turing Celebration Conference-China (pp. 1–6), Chengdu, China. [Google Scholar]
  44. Tang, X., Wang, Z., He, Q., Liu, J., & Ying, Z. (2020). Latent feature extraction for process data via multidimensional scaling. Psychometrika, 85(2), 378–397. [Google Scholar] [CrossRef]
  45. Tang, X., Wang, Z., Liu, J., & Ying, Z. (2021). An exploratory analysis of the latent structure of process data via action sequence autoencoders. British Journal of Mathematical and Statistical Psychology, 74(1), 1–33. [Google Scholar] [CrossRef]
  46. Ulitzsch, E., Ulitzsch, V., He, Q., & Lüdtke, O. (2023). A machine learning-based procedure for leveraging clickstream data to investigate early predictability of failure on interactive tasks. Behavior Research Methods, 55(3), 1392–1412. [Google Scholar] [CrossRef] [PubMed]
  47. Wang, Z., Tang, X., Liu, J., & Ying, Z. (2023). Subtask analysis of process data through a predictive model. British Journal of Mathematical and Statistical Psychology, 76(1), 211–235. [Google Scholar] [CrossRef] [PubMed]
  48. Wei, S., Lei, Q., Chen, Y., & Xin, Y. P. (2023). The Effects of visual cueing on students with and without math learning difficulties in online problem solving: Evidence from eye movement. Behavioral Sciences, 13(11), 927. [Google Scholar] [CrossRef]
  49. Xu, H., Fang, G., & Ying, Z. (2020). A latent topic model with Markov transition for process data. British Journal of Mathematical and Statistical Psychology, 73(3), 474–505. [Google Scholar] [CrossRef]
  50. Yu, R., Jiang, D., & Warschauer, M. (2018, June 26–28). Representing and predicting student navigational pathways in online college courses. Fifth Annual ACM Conference on Learning at Scale (pp. 1–4), London, UK. [Google Scholar]
  51. Zhang, J., Andres, J. M. A. L., Hutt, S., Baker, R. S., Ocumpaugh, J., Nasiar, N., Mills, C., Brooks, J., Sethuaman, S., & Young, T. (2022). Using machine learning to detect SMART model cognitive operations in mathematical problem-solving process. Journal of Educational Data Mining, 14(3), 76–108. [Google Scholar]
  52. Zhang, N., Biswas, G., & Hutchins, N. (2022). Measuring and analyzing students’ strategic learning behaviors in open-ended learning environments. International Journal of Artificial Intelligence in Education, 32, 931–970. [Google Scholar] [CrossRef]
Figure 1. Flow diagram (following PRISMA 2020 guidelines flow diagram).
Education 15 00888 g001
Figure 2. The frequency of studies published per year.
Education 15 00888 g002
Figure 3. Thematic map of keyword-derived research themes.
Education 15 00888 g003
Figure 4. Two machine learning applications.
Education 15 00888 g004
Table 1. Number of papers per venue and their corresponding citations.
VenueNumberCitations
Acta Polytechnica Hungarica1(Pejić & Molcer, 2021)
Applied Measurement in Education1(Sinharay et al., 2019)
Behavior Research Methods1(Ulitzsch et al., 2023)
British Journal of Mathematical and Statistical Psychology3(Tang et al., 2021; Wang et al., 2023; Xu et al., 2020)
Computers & Education2(Liao & Wu, 2022; Ludwig et al., 2024)
Educational and psychological measurement1(Schroeders et al., 2022)
ETS Research Report Series1(Cao et al., 2020)
Frontiers in Psychology1(Han et al., 2019)
International Journal of Artificial Intelligence in Education1(N. Zhang et al., 2022)
Journal of Educational Data Mining9(Chen & Cui, 2020; Sabourin et al., 2013; Levin, 2021; Bosch, 2021; J. Zhang et al., 2022; Rohani et al., 2024; Hoq et al., 2024; Ohmoto et al., 2024; Lu et al., 2024)
Journal of Learning Analytics1(Guo et al., 2024)
Large-scale Assessments in Education2(Salles et al., 2020; Richters et al., 2023)
Scientific Reports1(Qiu et al., 2022)
Social Science Computer Review1(Fernández-Fontelo et al., 2023)
Heliyon1(Al-Azazi & Ghurab, 2023)
Conferences11(S. Li et al., 2021; Singh, 2023; Sun et al., 2019; Bosch & Paquette, 2017; Ahadi et al., 2015; Guan et al., 2022; Petkovic et al., 2016; Bertović et al., 2022; Yu et al., 2018; Pardos et al., 2017; Y. Li et al., 2017)
Disclaimer/Publisher’s Note: The statements, opinions and data contained in all publications are solely those of the individual author(s) and contributor(s) and not of MDPI and/or the editor(s). MDPI and/or the editor(s) disclaim responsibility for any injury to people or property resulting from any ideas, methods, instructions or products referred to in the content.

