Article

Validation of a Spanish-Language Scale on Data-Driven Decision-Making in Pre-Service Teachers

by
Fabián Sandoval-Ríos
1,2,*,
Carola Cabezas-Orellana
1 and
Juan Antonio López-Núñez
2
1
Exercise and Rehabilitation Sciences Institute, School of Speech Therapy, Faculty of Rehabilitation Sciences, Universidad Andres Bello, Santiago 7591538, Chile
2
Department of Didactics and School Organization, Faculty of Education Sciences, Universidad de Granada, Campus Universitario de Cartuja, 18071 Granada, Spain
*
Author to whom correspondence should be addressed.
Educ. Sci. 2025, 15(7), 789; https://doi.org/10.3390/educsci15070789
Submission received: 25 March 2025 / Revised: 7 June 2025 / Accepted: 11 June 2025 / Published: 20 June 2025

Abstract

:
This study validates a Spanish-language instrument designed to assess self-efficacy, digital competence, and anxiety in data-driven decision-making (DDDM) among pre-service teachers. Based on the 3D-MEA and the Beliefs about Basic ICT Competencies scale, the instrument was culturally adapted for Chile and Spain. A sample of 512 participants underwent exploratory factor analysis (EFA) and confirmatory factor analysis (CFA). Given the ordinal nature of the data and the assumption of non-normality, appropriate estimation methods were utilized. Results supported a well-defined four-factor structure: Interpretation and Application, Technology, Identification, and Anxiety. Factor loadings ranged from 0.678 to 0.869, and internal consistency was strong (α = 0.802–0.888). The CFA confirmed good model fit (χ2 (129) = 189.25, p < 0.001; CFI = 0.985; TLI = 0.981; RMSEA = 0.041; SRMR = 0.061). Measurement invariance was established across gender and nationality, reinforcing the validity of cross-group comparisons. The study is framed within an educational context aligned with socioformative principles and sustainable education goals, which support reflective and ethical data use. This validated tool addresses the lack of culturally adapted and psychometrically validated instruments for assessing DDDM competencies in Spanish-speaking contexts, offering a culturally and linguistically relevant instrument with strong internal consistency and a well-supported factor structure. It supports the design of formative strategies in teacher education, enabling the identification of training needs and promoting evidence-based pedagogical decision-making in diverse Hispanic contexts. Future studies should test factorial invariance across additional contexts and explore longitudinal applications.

1. Introduction

In recent years, data-driven decision-making (DDDM) has experienced global expansion, becoming a central component in improving educational processes and promoting evidence-informed pedagogical practices and equity (Fischer et al., 2020; Romero & Ventura, 2020; Gaftandzhieva et al., 2023). However, this trend poses specific challenges for Spanish-speaking education systems, which often lack validated and contextually appropriate tools to guide data use in teacher education. In this context, initial teacher education faces the challenge of preparing professionals who are not only aware of the pedagogical value of data, but also capable of interpreting and using it critically. Therefore, it is essential that pre-service teachers acquire strong data literacy skills from the early stages of their training.
Various international initiatives have demonstrated progress in developing these competencies; however, most studies have assessed only their short-term effectiveness (Hamilton et al., 2022; Miller-Bains et al., 2022; Neugebauer et al., 2020). There is a need for more in-depth research exploring the sustained impact of data literacy training on long-term educational improvement. Additionally, several studies have reported that pre-service teachers often exhibit low self-efficacy, high anxiety, and limited skills in using tools to collect, interpret, and apply information from diverse sources, including standardized tests, classroom assessments, observations, and data from families (Jimerson & Wayman, 2015; Mandinach & Schildkamp, 2021).
Despite increasing recognition of these challenges, there remains a significant empirical gap: few validated instruments are available in Spanish to rigorously assess key constructs such as self-efficacy, digital competence, and anxiety related to educational data use. Many of the existing instruments have been developed in contexts with different institutional and policy frameworks, which may limit their applicability in Spanish-speaking education systems.
In contrast, national data systems in Spanish-speaking countries such as Chile and Spain do not mirror those found in the U.S. or the Netherlands. The institutional conditions for teacher preparation and data use are structured differently, and the use of data in pedagogical decision-making is subject to different sociocultural and policy frameworks. These contextual differences suggest that directly translating international instruments may fail to capture the local realities of how pre-service teachers engage with educational data.
This study includes two Spanish-speaking countries—Spain and Chile—with the goal of developing an instrument that can be applied across diverse but culturally and linguistically connected educational systems. Although there are differences in institutional frameworks, both countries share a common language and several cultural traits that justify the development of a unified instrument. Comparative research has shown structural distinctions in teacher education and governance (Ortiz-Mallegas et al., 2025), yet both systems demonstrate a clear need for valid and reliable tools to assess future teachers’ readiness to engage with data in a pedagogical context.
Therefore, the objective of this study is to adapt and validate a Spanish-language scale that jointly measures three key constructs, self-efficacy, digital competence, and anxiety, related to data-driven decision-making in education. This instrument was carefully translated and culturally adapted to ensure conceptual equivalence, linguistic appropriateness, and contextual relevance for pre-service teachers in Spanish-speaking countries.
In educational systems, which are increasingly emphasizing data use for quality improvement and accountability, it is essential to have valid, culturally appropriate instruments that assess how future educators respond to this challenge (Fischer et al., 2020; Romero & Ventura, 2020). This study aims to contribute a useful assessment tool for both research and teacher education programs that seeks to strengthen data literacy in diverse Hispanic contexts.

2. Literature Review

To understand how pre-service teachers engage with educational data, it is essential to consider the theoretical foundations that shape their skills, dispositions, and decision-making processes. Recent research has emphasized the need to combine technical competencies with critical and reflective capacities, recognizing data literacy as a multidimensional construct relevant to authentic classroom contexts (Lee et al., 2024; Conn et al., 2022). This review draws on these perspectives to support the development of culturally responsive assessment tools.

2.1. Socioformation and Sustainable Social Development

In the context of teacher education, socioformation provides a comprehensive pedagogical model that integrates the development of professional competencies, critical reflection, and social responsibility. Originating in Latin America, this model emphasizes the resolution of contextual problems, collaborative work, and the construction of knowledge through meaningful projects that address real societal needs (Martínez-Iñiguez et al., 2021; Tobón & Lozano-Salmorán, 2024).
From this perspective, education is not limited to content acquisition but is understood as a transformative process aimed at preparing individuals to contribute to sustainable social development. Socioformation aligns with global frameworks such as Education for Sustainable Development (ESD), promoted by UNESCO (2020a), which highlight the importance of equipping citizens with skills to make informed, ethical, and evidence-based decisions in the face of complex societal and environmental challenges (Velandia Rodríguez et al., 2022).
In educational practice, the socioformative approach promotes learning environments based on metacognition, socio-emotional development, and transversality, enabling teachers to guide students in solving problems rooted in their own communities. This model encourages the integration of digital competencies and data use as tools for diagnosing needs, planning interventions, and evaluating impact, fostering a reflective and transformative use of information (UNESCO, 2020b; Martínez-Iñiguez et al., 2021).
Tobón and Lozano-Salmorán (2024) emphasize that socioformative pedagogical practices contribute not only to academic performance but also to the development of socio-emotional and civic competencies. These outcomes are particularly relevant in a digitalized educational context, where the ability to manage, interpret, and apply information is essential for sustainable and inclusive educational innovation (Velandia Rodríguez et al., 2022).
These principles provide a valuable conceptual foundation for the present study, supporting the need for culturally and contextually relevant instruments that assess how pre-service teachers engage with educational data in Spanish-speaking contexts increasingly influenced by socioformative approaches (Martínez-Iñiguez et al., 2021; Tobón & Lozano-Salmorán, 2024).

2.2. Data-Driven Decision-Making (DDDM) in Teacher Education

In the educational field, data-driven decision-making (DDDM) has become an essential practice to improve the quality of contemporary education (Mandinach & Gummer, 2016; Mandinach & Schildkamp, 2021; Sandoval-Ríos et al., 2025). This approach emphasizes the systematic use of data from various sources—such as standardized assessments, classroom observations, and institutional records—to inform pedagogical and administrative decisions grounded in evidence. Multiple authors have conceptualized DDDM from complementary perspectives. For example, Mandinach and Schildkamp (2021) define it as the systematic collection and analysis of educational data to guide instructional improvement. In parallel, Schildkamp and Kuiper (2010) describe data use as the process of “systematically analyzing existing data sources within the school, applying the results of these analyses to innovate teaching, curriculum, and school performance, and implementing and evaluating these innovations”.
In teacher education, DDDM requires not only technical skills but also an ethical and reflective framework that enables future teachers to understand the context of data and make informed decisions that enhance student learning (Datnow & Park, 2019). This perspective has led to the development of models that integrate data analysis as part of teachers’ professional reasoning, emphasizing the importance of interpreting information beyond its instrumental value (Jimerson & Wayman, 2015).
Several studies have highlighted that these competencies remain underdeveloped in pre-service teacher education programs (Miller-Bains et al., 2022; Hamilton et al., 2022). Despite the growing availability of digital technologies and platforms, a gap persists between data collection and its effective use in planning and evaluating teaching and learning processes. This disconnection underscores the need to embed data literacy as a core component of teacher preparation (Gummer & Mandinach, 2015).
Recent research also shows that educators’ perceptions significantly influence the effective use of data. For example, a study conducted with school leaders in Malaysia found that while teachers acknowledged the importance of DDDM, its implementation was hindered by limited competencies and a lack of qualitative data integration (Shamsuddin & Abdul Razak, 2023). These findings reinforce the need for teacher education programs to promote a critical, context-aware, and ethically grounded use of data.

2.3. Relevance of DDDM: Political Context, Implementation Challenges, and the Role of Teacher Education

The adoption and implementation of data-driven decision-making (DDDM) in education is deeply shaped by national policies, institutional structures, and the political emphasis placed on accountability and evidence-informed practices. In countries like the United States, legislative frameworks such as the No Child Left Behind Act (NCLB) and the Every Student Succeeds Act (ESSA) have consolidated a culture of data use for monitoring educational outcomes and improving instruction (Mandinach & Jackson, 2012; Yoshizawa, 2022). This policy landscape has facilitated the development of specialized tools and systems to support teachers in collecting, interpreting, and applying data in their daily practice.
Similarly, the Netherlands has implemented structured mechanisms such as the Pupil Monitoring System, which allows for systematic tracking of student progress and supports school-level decision-making with reliable and accessible data (Brinkhuis & Maris, 2019). These cases illustrate how well-developed policy environments and institutional support can foster effective DDDM.
In contrast, Spanish-speaking countries such as Chile and Spain operate under distinct educational governance models and policy priorities. National data systems in these contexts are often less integrated, and the use of educational data tends to be fragmented or limited to high-stakes external assessments. These conditions create significant challenges for implementing DDDM in ways that are consistent and pedagogically meaningful (Mandinach & Schildkamp, 2021). As a result, instruments developed in Anglophone contexts may not adequately reflect the sociocultural and institutional realities of Latin American or Southern European systems.
This study focuses on Chile and Spain not only because of their shared language and cultural ties but also due to their contrasting institutional configurations. For instance, differences in school autonomy, teacher education structures, and the availability of data platforms highlight the need for a culturally responsive approach to measuring how pre-service teachers engage with educational data (Ortiz-Mallegas et al., 2025).
Moreover, research has shown that beyond policy and infrastructure, other implementation challenges include school leadership, teachers’ beliefs and attitudes toward data, access to high-quality digital tools, and the uneven development of data literacy competencies (Schildkamp et al., 2020; Shamsuddin & Abdul Razak, 2023). These barriers are often exacerbated when teacher preparation programs do not explicitly address the ethical, reflective, and contextual dimensions of data use (Datnow & Park, 2019).
In this context, initial teacher education faces the challenge of preparing professionals who are not only capable of understanding the pedagogical value of data, but also of developing the necessary competencies to interpret and use it critically. Therefore, it is essential that pre-service teachers acquire strong data literacy skills from the early stages of their training. Although several international initiatives have been launched to strengthen the development of this competence, most have assessed only its short-term effectiveness (Miller-Bains et al., 2022; Neugebauer et al., 2020), highlighting the need for further research to examine its sustained impact on teaching practice and long-term educational improvement.

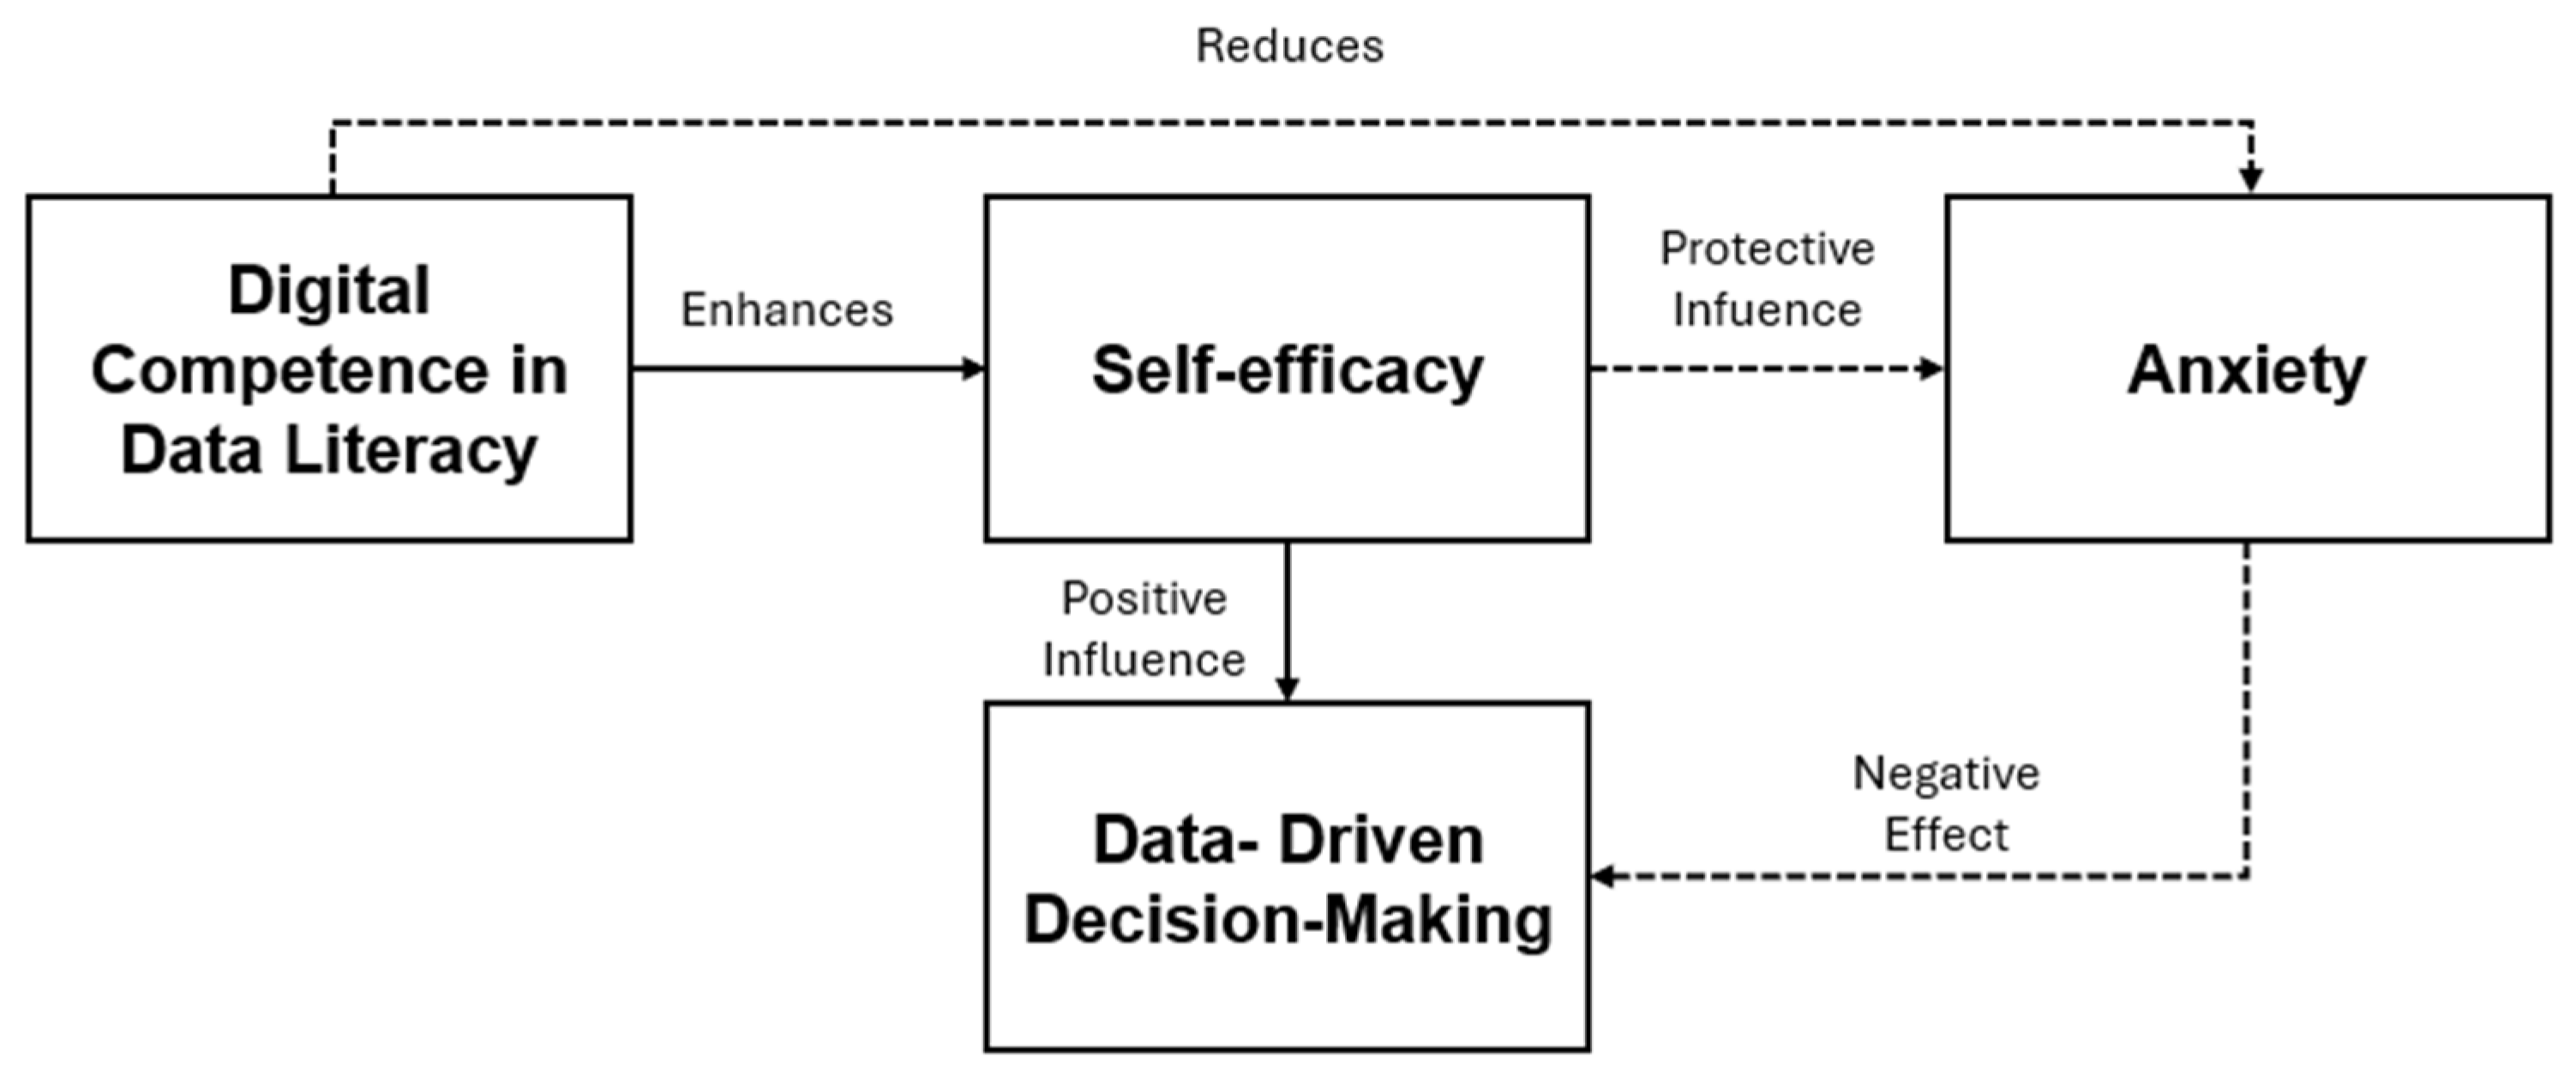
2.4. Self-Efficacy, Digital Competence, and Anxiety in DDDM

Assessing pre-service teachers’ progress in data literacy requires reliable tools. According to Bandura’s self-efficacy theory (1986), individuals’ beliefs in their ability to perform tasks influence their actions and outcomes—a concept particularly relevant in teaching (Skaalvik & Skaalvik, 2010). Based on this theory, Dunn et al. (2013b) developed the 3D-MEA to assess teachers’ self-efficacy and anxiety in data-informed decision-making. Grounded in Stiggins’ (2001) framework, the scale evaluates abilities to access data, use data systems, interpret and apply data, and manage anxiety about data use.
Initially designed for in-service teachers in the U.S., the 3D-MEA was later validated with pre-service teachers (Reeves et al., 2020), but remains untested in other cultural or linguistic contexts, underscoring the need for adaptation. Complementary tools like the scale by Rubach and Lazarides (2021) assess ICT self-efficacy and include a data literacy dimension, aligning with Bandura’s (1977) framework and supporting broader validation efforts.
Frameworks such as DigComp (Vuorikari et al., 2022) also help define digital competencies like data literacy, critical thinking, and digital communication. Its latest version, DigComp 2.2, emphasizes their application in complex, tech-mediated contexts, highlighting data literacy as essential for teacher training (Van Audenhove et al., 2024).
Finally, anxiety about using educational data—often linked to low confidence or technical skills—can cause cognitive overload and avoidance behaviors, reducing decision quality (García-Martín et al., 2023; Alaqeel, 2024). Addressing this anxiety is key to supporting effective data-driven practices in education. These constructs—self-efficacy, anxiety, and digital competence in data literacy—are conceptually interrelated in teacher training processes and form the core of the conceptual model that guides this study. Recent empirical and theoretical research suggests that digital competence contributes to the development of efficacy beliefs, and that self-efficacy can play a protective role against anxiety related to the use of data (Alaqeel, 2024; Dunn et al., 2020; Mandinach & Gummer, 2016). In addition, studies conducted in Spanish-speaking contexts have reinforced the importance of culturally grounded validation efforts and emphasized the emotional and cognitive challenges future teachers face when engaging with educational data (e.g., García-Martín et al., 2023; Roy et al., 2025; Javier-Aliaga et al., 2024).
These relationships are visually represented in Figure 1: digital competence enhances self-efficacy (solid arrow), which in turn has a positive influence on data-driven decision-making. Self-efficacy also acts as a protective factor that reduces anxiety (dashed arrow), while anxiety exerts a negative effect on the decision-making process. This interaction model highlights the need for teacher education to address not only technical skills but also affective dimensions, ensuring that data use is perceived as manageable and meaningful.
Following Bandura’s (1997) theory of self-efficacy, it is proposed that beliefs in one’s ability to interpret and apply educational data directly influence the willingness to use data in pedagogical practice. Self-efficacy is, in turn, shaped by an individual’s digital competence, particularly in areas related to data literacy (Rubach & Lazarides, 2021). Higher self-efficacy may also serve as a protective factor against anxiety related to data use, while digital competence itself may contribute directly to reducing such anxiety. This model offers a conceptual foundation for understanding how these dimensions interact in the process of teacher decision-making informed by data.
Based on this framework, the objective of this study is to adapt and validate an instrument to assess self-efficacy, digital competence, and anxiety related to data use in pedagogical decision-making among Spanish-speaking pre-service teachers, taking into account the cultural and linguistic specificities of these contexts.

3. Materials and Methods

3.1. Participants

The sample included 512 Spanish-speaking pre-service teachers selected through convenience sampling to facilitate access and data collection (Etikan et al., 2016). Of these, 306 (59.7%) were from two Chilean universities and 206 (40.2%) from a Spanish university, spanning undergraduate and postgraduate levels. Most participants identified as women (57.8%), and 61.5% reported prior teaching experience (see Table 1). Including students from Chile and Spain ensured contextual diversity, as both countries share a language but differ in teacher education structures. In Chile, teacher education spans five years and includes a national diagnostic evaluation (CPEIP, n.d.-a), whereas in Spain, it typically lasts four years with university-based assessment. Additionally, Spain has implemented a national digital competence framework tied to data use (Instituto Nacional de Tecnologías Educativas y de Formación del Profesorado, n.d.), unlike Chile, where digital competencies are less standardized and only indirectly included in national standards (CPEIP, n.d.-b). These differences provide a valuable opportunity to examine the instrument’s applicability in distinct educational contexts. A summary of key differences is provided in Appendix B.

3.2. Materials

3.2.1. Data-Driven Decision-Making Efficacy and Anxiety Inventory (3D-MEA)

The Data-Driven Decision-Making Efficacy and Anxiety Inventory (3D-MEA) developed by Dunn et al. (2013b) measures teachers’ confidence in their ability to implement data-driven decision-making. The scale includes five subscales: Efficacy for Identifying and Accessing Data (Identification); Efficacy for Using Data Technology (Technology); Efficacy for Analyzing and Interpreting Data (Interpretation); Efficacy for Applying Data to Instruction (Application); and Anxiety Related to Data-Driven Decision-Making (Anxiety). Examples of items include ‘I am confident that I can use assessment data to provide targeted feedback to students about their performance or progress’ and ‘I am concerned that I will feel or look ‘dumb’ when it comes to data driven decision making’. It consists of 20 items, and the response format uses a five-point Likert scale: 1 = Strongly disagree, 2 = Disagree, 3 = Neither agree nor disagree, 4 = Agree, and 5 = Strongly agree.

3.2.2. Beliefs About Basic ICT Competencies in Information and Data Literacy

This study also used the Beliefs about Basic ICT Competencies in Information and Data Literacy scale developed by Rubach and Lazarides (2021), which assesses individuals’ beliefs about their basic digital skills related to information and data literacy. The original scale consists of 32 items, of which 6 correspond to the Information and Data Literacy dimension, which was the one used in this study. Examples of items from this subscale include ‘I can identify and use appropriate sources in digital environments based on my information needs’ and ‘I am critical about information, sources and data in digital environments’.

3.3. Procedures

3.3.1. Translation Process

The 3D-MEA instrument, originally developed in American English, was translated into Spanish following the guidelines proposed by Mokkink et al. (2010) and Ritoša et al. (2020) for cross-cultural adaptation. Two native Spanish-speaking bilingual education experts independently translated the instrument. Their versions were compared and consolidated through consensus. Then, two additional translators who had not participated in the initial step performed a back-translation into English. A committee of four experts (two from Chile and two from Spain) reviewed all versions (original, translation, and back-translation) to resolve discrepancies and ensure the semantic, idiomatic, conceptual, and cultural equivalence of the items.

3.3.2. Content Validity

To adapt the scale to the Chilean and Spanish educational contexts, the instrument underwent a rigorous content validation process, where items were removed or added based on the model by Flodén et al. (2020) and recommendations from six experts (three from each country). These experts, all university professors, held doctoral degrees in education or psychology, with over 10 years of experience in research in education and ICT integration. Their extensive experience in the field ensured a comprehensive evaluation.
Six items referencing state or district-level information from the original scale were removed, as Chile and Spain do not have district-based data systems like those in the United States. Of these, one belonged to the Identification subscale, three to Technology, and two to Anxiety. For instance, an item such as ‘I am confident that I can use my district’s data analysis technology to access standard reports’ was removed due to its specific contextual irrelevance.
In turn, six new items were added to the instrument, derived from the Beliefs about Basic ICT Competencies in Information and Data Literacy scale (Rubach & Lazarides, 2021), to enhance its focus on relevant technological use within local educational settings. An example of an added item is ‘I can use my search strategies in digital environments’. The Likert response format remained unchanged. Additionally, two items—from the Interpretation and Application dimensions—were removed based on limited contextual relevance. These changes, grounded in document review and expert consensus, aimed to improve contextual and conceptual accuracy in both countries. Although these modifications improved contextual relevance, we acknowledge that the removal of original items—particularly from the Interpretation and Application dimensions—may have altered the scope or structure of the initial construct. This was considered in subsequent validity analyses and is further discussed in the study’s limitations.
Six experts (three from Chile and three from Spain) assessed each item using a four-point rubric evaluating sufficiency, clarity, coherence, and relevance. Aiken’s V index was computed for each, with 0.75 as the cut-off for acceptable content validity (Penfield & Giacobbi, 2004). Most items surpassed this threshold, and those slightly below were retained due to their theoretical value and sound psychometric properties. Table 2 presents the Aiken’s V values for the 18 items.

3.3.3. Pilot Test

Once a preliminary version of the instrument had been developed and content validity established, a pilot test was conducted with 30 participants—15 from Chile and 15 from Spain. For this pilot test, participants were selected as they were pedagogy students at any level from the Chilean and Spanish universities previously mentioned in the Participants section.
This pilot allowed researchers to gather qualitative feedback through open-ended questions after instrument completion. Participants’ feedback primarily focused on the need to adjust wording to ensure gender inclusivity (male and female forms), given the nature of the Spanish language. This led to minor adjustments to enhance the instrument’s clarity and comprehension. No further substantial changes were made to the final version of the instrument presented in Table 2.

3.3.4. Data Collection for Psychometric Validation

The psychometric validation was carried out during the second semester of 2023 and the first semester of 2024 in Chile and Spain. Students completed the 18-item questionnaire via Google Forms during face-to-face classes. A researcher was present to explain the study’s purpose and answer any questions. Informed consent was obtained from all participants, and confidentiality was ensured.

3.4. Data Analysis

To validate the scale on self-efficacy, digital competence, and anxiety in data-driven decision-making, an exploratory factor analysis (EFA) and internal consistency assessment were conducted with the sample of 512 Spanish-speaking pre-service teachers.
First, a descriptive analysis of sociodemographic and educational characteristics was conducted using frequencies and percentages. Then, item-level statistics—including mean, standard deviation, skewness, and kurtosis—were computed.
To examine the latent constructs, a principal axis factoring (PAF) analysis with oblique rotation was conducted. PAF was chosen as the extraction method, as it is particularly suitable when multivariate normality cannot be assumed (Costello & Osborne, 2005; Fabrigar et al., 1999; Floyd & Widaman, 1995). Oblique rotation was applied since the factors were expected to be correlated. No factor count was pre-specified to allow the factor structure to emerge from the data. Both scree plot and parallel analysis (Kaiser eigenvalue criterion) were used as recommended by Reise et al. (2000).
All analyses were performed using Stata version 18, including EFA and internal consistency evaluation.
Subsequently, a Confirmatory Factor Analysis (CFA) was conducted using JASP (version 0.18.3) with the Diagonally Weighted Least Squares (DWLS) estimator, which is suitable for ordinal data. The model tested consisted of four factors derived from the EFA. Model fit was evaluated using multiple indices, including the chi-square test, CFI, TLI, RMSEA, and SRMR, following the recommendations of Hu and Bentler (1999).
Final versions of the scale in both Spanish and English are provided as Supplementary Material to support replication and broader application in teacher education research.

4. Results

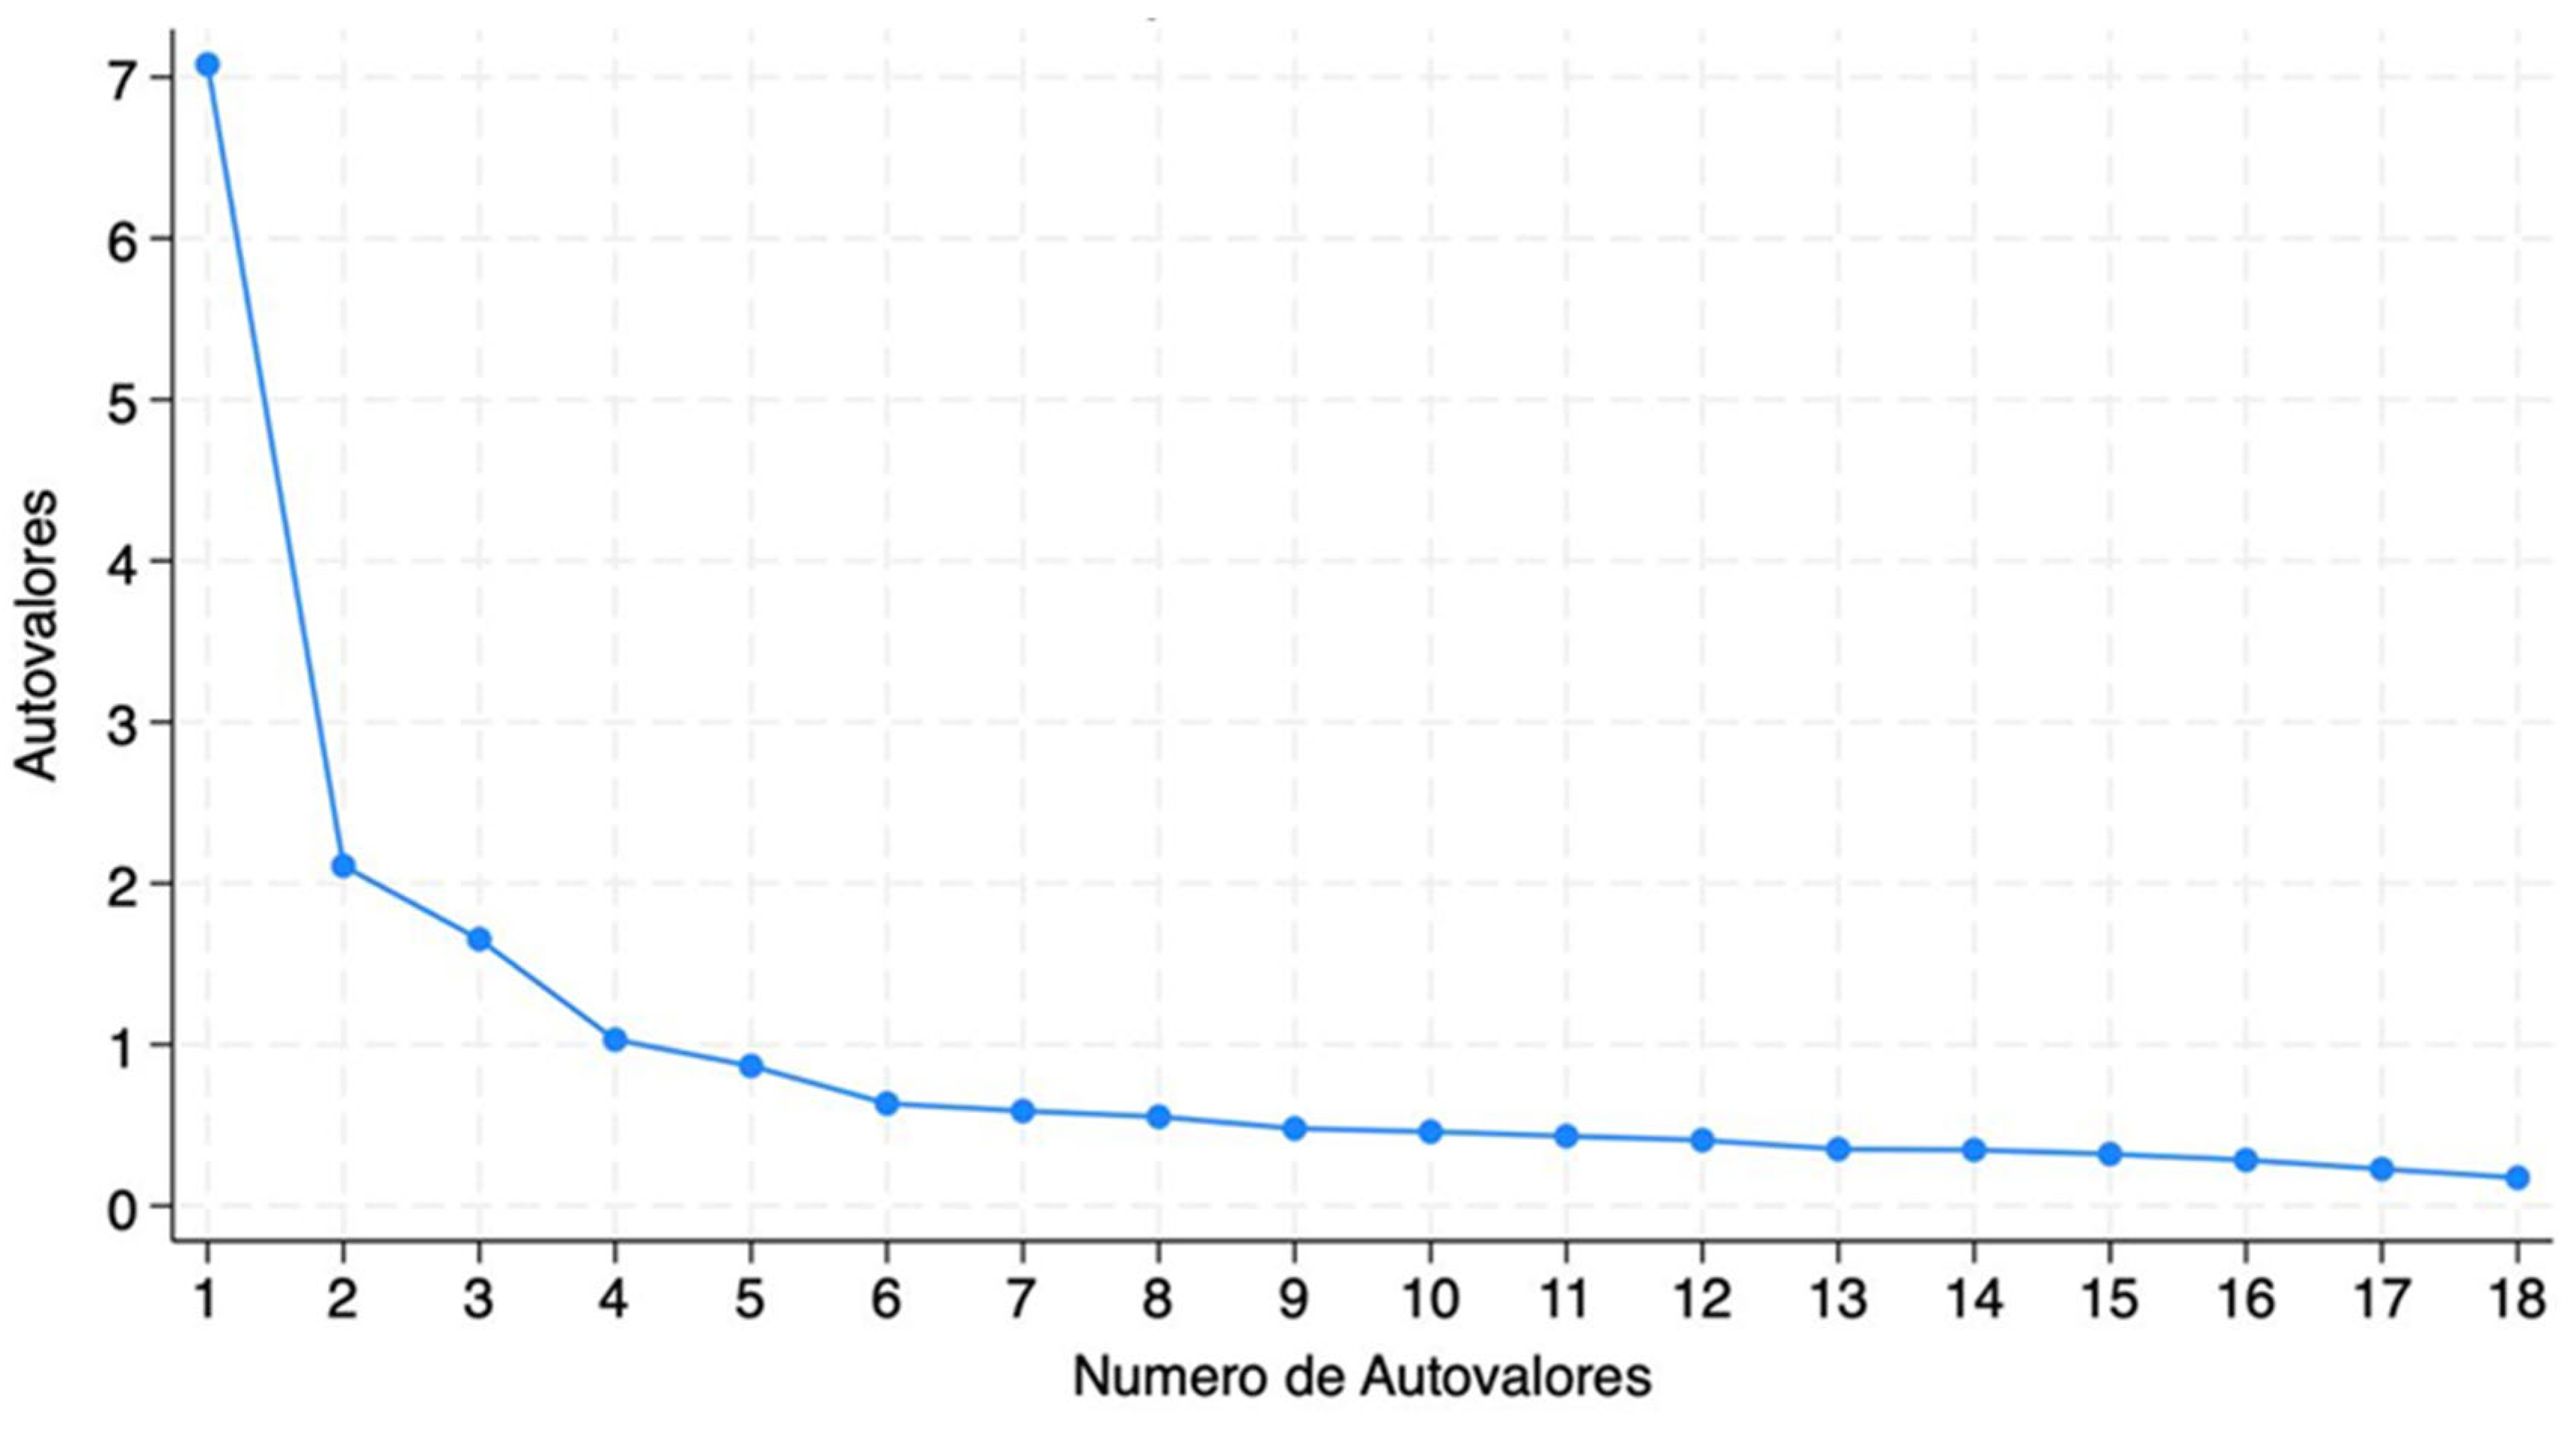
4.1. Exploratory Factor Analysis (EFA)

Table 3 presents the items and descriptive statistics of the scale. Exploratory Factor Analysis (EFA) included scree tests and parallel analysis, with the latter (Kaiser eigenvalue) favoring a four-factor solution over the theoretical five-factor model (see Figure 2). Although the MAP test suggested that a three-factor solution was also viable, the four-factor model was selected based on theoretical grounds and the original structure proposed by Dunn et al. (2013a), as it better represents DDDM competencies. Table 4 displays the corresponding factor loadings, considering values ≥ 0.50 as significant (Stevens, 2002).
To determine the number of factors to retain, multiple criteria were considered: eigenvalues greater than 1, scree plot analysis, and parallel analysis. While the parallel analysis suggested a three-factor solution, the scree plot (Figure 2) supported the retention of four. Moreover, the four-factor structure demonstrated strong theoretical alignment with the constructs measured. Retaining four factors allowed for the preservation of conceptually important items, particularly those in the ‘Identification’ dimension. The parallel analysis plot is included as Supplementary Material (Figure S1).
The Self-Efficacy for Identifying and Accessing Data subscale (Identification) included two items (Items 1 and 2) that measured pre-service teachers’ self-assessment of their “ability to identify, access, and collect the appropriate reports needed for data-driven decision-making” (Dunn et al., 2013b). The Self-Efficacy for Using Data Technology subscale (Technology) included six items (Items 10 to 15) that measured pre-service teachers’ self-assessment of their “skills to search for, evaluate, and manage information, using information ethically and safely through technological tools” (Rubach & Lazarides, 2021). Item 10 loaded primarily on the interpretation and application factor but was kept under the Technology factor, which will be discussed further below.
Although the Identification factor contains only two items, prior studies have shown that identifying and accessing data is conceptually distinct from data analysis, interpretation, and application (Dunn et al., 2013b; Reeves et al., 2020; Hamilton et al., 2022; Walker et al., 2018). The strong and separate loadings of these two items support retaining the factor. Furthermore, recent validations justify the use of two-item factors when they are conceptually grounded and psychometrically robust (Abraham et al., 2021; Laakasuo et al., 2022; Luo et al., 2024).
Initially, two latent factors were hypothesized—Interpretation and Application—but they merged in the EFA. The resulting subscale, Self-Efficacy for Data Interpretation, Application, and Evaluation, includes seven items (Items 3–9) and reflects pre-service teachers’ self-assessment of their ability to analyze, interpret, and apply data to instruction (Dunn et al., 2013b).
The Anxiety Related to DDDM subscale comprises three items (Items 16–18) and measures feelings of discomfort and apprehension about engaging in DDDM (Dunn et al., 2013b). Table 5 displays the Promax-rotated factor correlation matrix showing associations among the four factors: Identification, Technology, Interpretation and Application, and Anxiety.
Internal consistency measured by Cronbach’s alpha was strong for all subscales: Identification (0.857), Technology (0.855), Interpretation and Application (0.888), and Anxiety (0.802). The full scale demonstrated high reliability (α = 0.889).
In addition to the factor loadings and inter-factor correlations presented above, overall model fit was evaluated to confirm the adequacy of the four-factor structure. Sampling adequacy was verified using the Kaiser–Meyer–Olkin (KMO) index, which yielded a value of 0.896, and Bartlett’s test of sphericity was significant (χ2, p < 0.001), supporting the suitability of the data for factor analysis. The model showed acceptable fit across multiple indicators, including RMSEA, CFI, TLI, and SRMR. Table 6 summarizes the fit indices, reliability coefficients, and variance explained by each factor.
The four extracted factors explained 33%, 26%, 22%, and 11% of the variance, resulting in a cumulative variance of 92%. Although this value is relatively high for social science research, such levels are justifiable when the factor structure is clear, the items are strongly related to their latent dimensions, and the theoretical model demonstrates a coherent and empirically supported factor structure. As noted by Norris and Lecavalier (2010), cumulative variance values above 90% may be acceptable in psychological and educational research when these conditions are met. The fourth factor’s lower percentage reflects its composition of only two items, which were retained due to their conceptual clarity and psychometric strength.

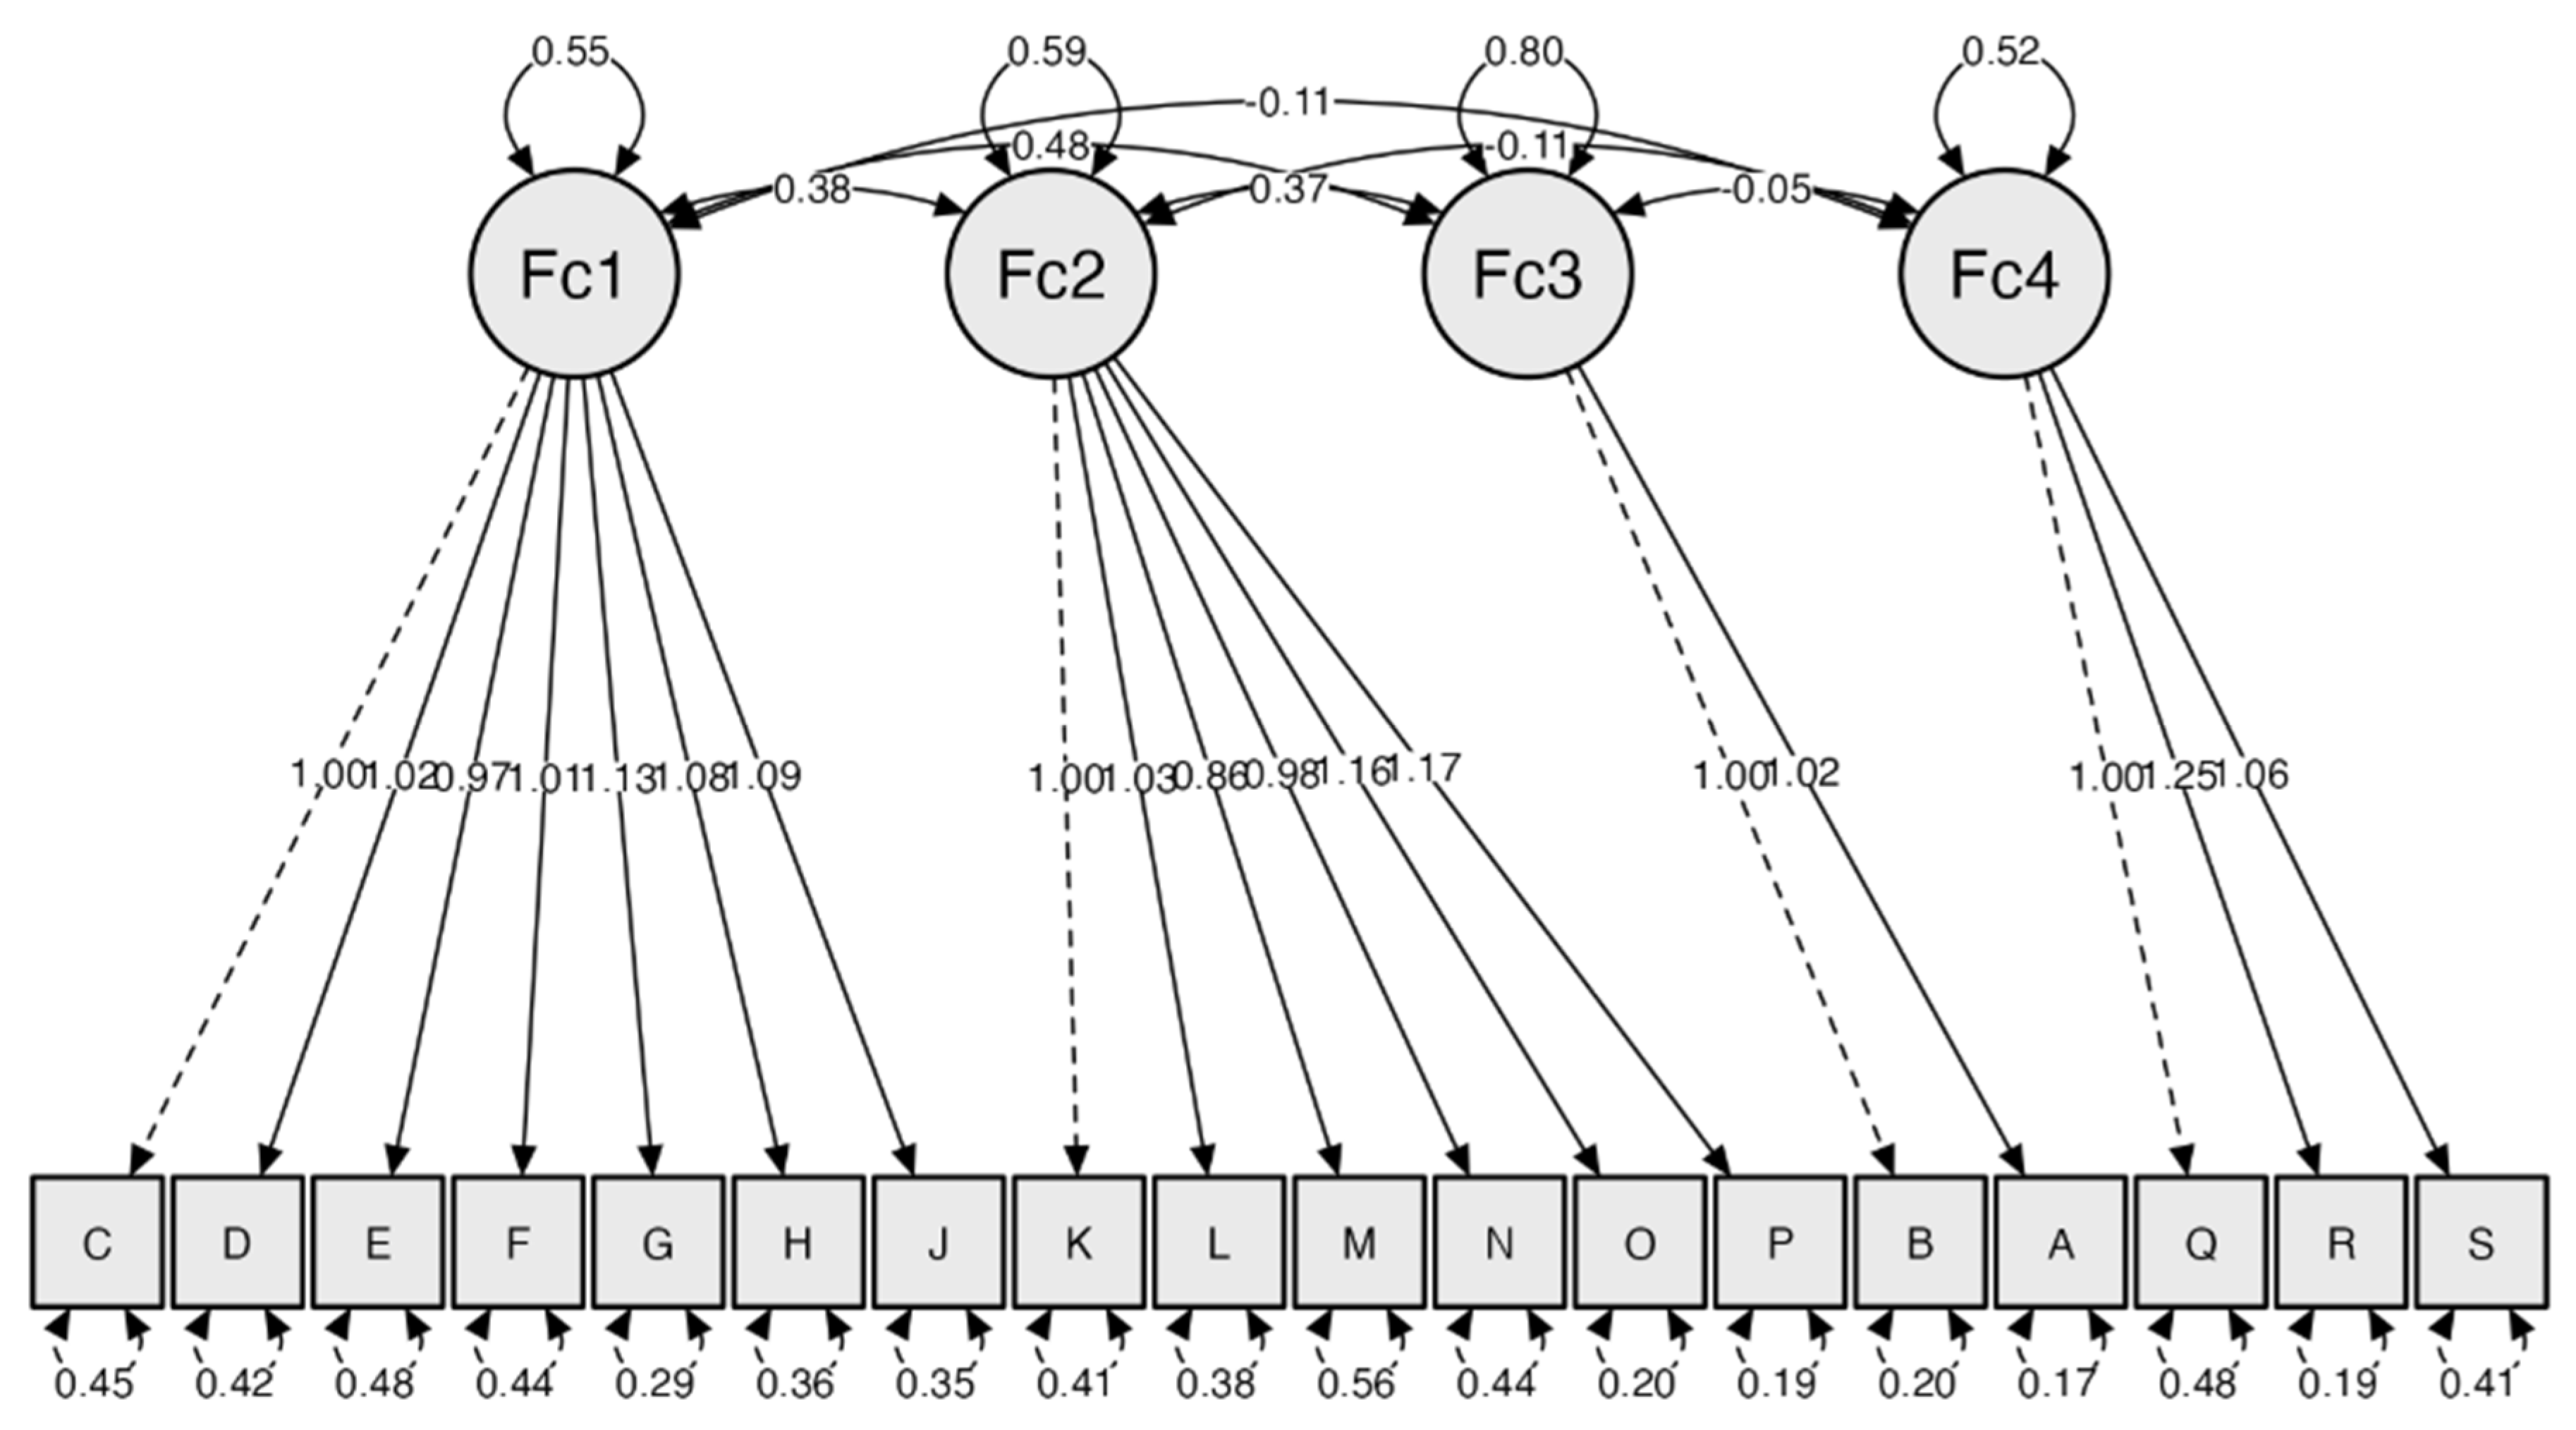
4.2. Confirmatory Factor Analysis (CFA)

To confirm the factor structure obtained through the exploratory factor analysis, a confirmatory factor analysis (CFA) was conducted using the JASP software (version 0.18.3). Given the ordinal nature of the items (five-point Likert scale), the Diagonally Weighted Least Squares (DWLS) estimation method was used, which is appropriate for categorical data and yields stable and accurate parameter estimates in the presence of non-normality (Li, 2016).
The hypothesized four-factor model—comprising Interpretation and Application, Technology, Identification, and Anxiety—demonstrated a good fit to the data. The following fit indices were obtained: χ2 (129) = 189.25, p < 0.001; CFI = 0.985; TLI = 0.981; RMSEA = 0.041 [90% CI = 0.030, 0.052]; and SRMR = 0.061. According to the cut-off criteria proposed by Hu and Bentler (1999), these values indicate an adequate to excellent model fit.
Standardized factor loadings for each item are presented in Table 7. All loadings were statistically significant (p < 0.001) and exceeded the commonly accepted minimum threshold of 0.50 (Hair et al., 2014), providing evidence for convergent validity.
In addition to adequate model fit, the reliability and convergent validity of the latent constructs were assessed. Composite Reliability (CR) for the four factors ranged from 0.839 (F4) to 0.915 (F1), exceeding the recommended threshold of 0.70. Furthermore, the Average Variance Extracted (AVE) ranged from 0.594 (F1) to 0.816 (F3), surpassing the 0.50 criterion. These values confirm excellent reliability and adequate convergent validity for all constructs.
As shown in Figure 3 and detailed in Table 7, the items loaded clearly onto their respective latent constructs, with minimal cross-loadings and high internal consistency. This strong factorial structure, confirmed through CFA, supports the conceptual coherence of the instrument and validates its adaptation for use in Spanish-speaking contexts. These results reinforce the instrument’s suitability for assessing self-efficacy, digital competence, and anxiety related to data-driven decision-making among pre-service teachers.

4.3. Measurement Invariance Across Gender and Country

To examine whether the four-factor structure of the scale was invariant across gender and nationality, a multi-group confirmatory factor analysis (MG-CFA) was conducted using the Diagonally Weighted Least Squares (DWLS) estimation method. A sequence of nested models was tested, assessing configural, metric, and scalar invariance (Putnick & Bornstein, 2016).
For gender, results indicated acceptable fit at each step—configural model (CFI = 0.981, RMSEA = 0.045), metric invariance (ΔCFI = 0.001, ΔRMSEA = 0.001), and scalar invariance (ΔCFI = 0.001, ΔRMSEA = 0.001)—supporting full invariance across groups.
For nationality, similar results were observed—configural model (CFI = 0.983, RMSEA = 0.044), metric invariance (ΔCFI = 0.002, ΔRMSEA = 0.000), and scalar invariance (ΔCFI = 0.002, ΔRMSEA = 0.001)—suggesting that the factorial structure is invariant across participants from Chile and Spain.
These findings provide evidence that the scale measures the same constructs equivalently across gender and nationality groups, supporting the validity of cross-group comparisons.

5. Discussion

This study validated a Spanish-language instrument to assess self-efficacy, digital competence, and anxiety in data-driven decision-making (DDDM) among pre-service teachers. It builds upon the 3D-MEA (Dunn et al., 2013b) and items from Rubach and Lazarides’ (2021) ICT beliefs scale, selected for their conceptual relevance and prior validation. The 3D-MEA, originally developed in the U.S., required cultural adaptation due to non-transferable items related to district-level data systems. This aligns with literature emphasizing contextual adaptation in measurement tools (Ambuehl & Inauen, 2022; Kristanti & Febriana, 2021).
To preserve content balance, items from Rubach and Lazarides (2021) on data literacy and ICT beliefs were added, maintaining relevance to digital competence (Padilla-Hernández et al., 2019). This adaptation addresses a key gap by offering the first validated tool in Spanish to assess these three constructs together, considering institutional differences from contexts like the U.S. (Mandinach & Schildkamp, 2021).
The model proposed by Reeves et al. (2020), validated in English-speaking contexts, identifies five factors: (1) identifying and accessing data, (2) using technology to manage data, (3) analyzing and interpreting data, (4) applying data to instructional decisions, and (5) anxiety related to data use. In contrast, the present study yielded a four-factor structure, in which the dimensions of identifying, analyzing, and applying data appear to be more integrated, possibly reflecting a more holistic perception of the data-use process among pre-service teachers. Technology use remained as an independent factor, while anxiety was also retained as a distinct construct, consistent with the original model.
This integration of competencies may be attributed to contextual conditions in Spanish-speaking teacher education systems, such as lower digital maturity and fragmented institutional platforms (Busco et al., 2023; Valenzuela et al., 2023). These factors may blur the boundaries between the stages of data use, leading pre-service teachers to conceptualize these skills in a more unified manner. By contrast, in the United States, Professional Learning Communities (PLCs) foster systematic and collaborative data use, which may encourage a more sequential understanding of the involved competencies (O’Connor & Park, 2023; Villeneuve & Bouchamma, 2023). Nevertheless, the persistence of a separate anxiety factor supports its cross-cultural validity as an emotional dimension.
Prior Latin American research supports the need for culturally grounded validation. Chilean and Mexican TSES adaptations revealed reliable structures and relevant contextual variations (Gálvez-Nieto et al., 2023; Salas-Rodríguez et al., 2021). In Colombia, Betancur-Chicué et al. (2023) validated a DigCompEdu-based scale with local adjustments. These findings underscore the importance of adapting not just language but also theoretical and institutional fit.
Our results can be interpreted through the socioformative educational model, which values holistic, ethical, and contextual teacher development. This model explains the integrated perception of DDDM competencies, aligning with recent studies (Tobón & Lozano-Salmorán, 2024; Cruz-Vargas et al., 2023) and suggesting that self-efficacy, digital competence, and anxiety form a cross-cutting, interconnected set of skills.
The four-factor structure retained the Identification subscale with two items due to its theoretical significance (Dunn et al., 2013b; Hamilton et al., 2022; Reeves et al., 2020; Walker et al., 2018). Similarly, Item 10, although statistically linked to Interpretation, remained under the Technology factor for conceptual coherence (Rubach & Lazarides, 2021). Replacing the original technology factor with Rubach & Lazarides’ data literacy framework enabled a richer representation of digital self-efficacy. This approach is consistent with research showing that higher ICT self-efficacy supports better pedagogical practices (Ertmer et al., 2012; Scherer et al., 2015).
While some scholars note the limitations of two-item factors, the retention of the “Identification” factor is supported by its strong factor loadings and theoretical coherence. Identifying relevant data is a critical component of data literacy models and was consistently perceived by participants as a distinct dimension. Likewise, the reassignment of Item 10 to the “Technology” factor was based on both empirical fit and thematic alignment. This item refers to the use of technological platforms, which aligns more closely with the construct of digital competence. From a perspective rooted in sustainability and contextual relevance—principles aligned with socioformation—these decisions further support the conceptual validity of the proposed model.
Finally, the preference for a four-factor over a five-factor structure aligns with theoretical models (Dunn et al., 2013b; Stiggins, 2001) and regional validation trends, suggesting a more integrated view of DDDM in Spanish-speaking contexts (Sorkos & Hajisoteriou, 2021; Tan et al., 2022). Properly assessing self-efficacy, anxiety, and digital competencies in DDDM can help identify the specific professional development needs of teachers in Spanish-speaking contexts. Several studies highlight the discomfort and challenges teachers around the world face when using data to make pedagogical decisions (Jimerson, 2014; Mandinach & Schildkamp, 2021; Oguguo et al., 2023). Therefore, further research is needed on the effects that teacher training in data literacy can have on improving student learning.
In this context, the results of the multi-group confirmatory factor analysis (MG-CFA) confirmed configural, metric, and scalar invariance across gender and nationality, reinforcing the cross-group validity of the instrument. These findings support its application in comparative studies and suggest that the perceptions of self-efficacy, anxiety, and digital competence in DDDM can be reliably measured across Spanish-speaking populations. This is particularly relevant in cross-cultural educational research, where sociocultural variables may influence how data-related competencies are perceived and applied (Caycho-Rodríguez et al., 2022).
This validated scale can be used in teacher education programs as a diagnostic and formative tool to assess self-efficacy, digital competence, and anxiety related to data use. Specifically, the instrument’s ability to reliably measure these constructs in Spanish-speaking contexts, as demonstrated by its psychometric properties and four-factor structure, directly informs curriculum design. It enables the identification of specific training needs (e.g., areas where efficacy is low, or anxiety is high), monitoring of students’ progress, and adjustment of pedagogical strategies. Additionally, its results can inform curriculum evaluation and be used in comparative studies to support the design of interventions aimed at strengthening data literacy and evidence-based pedagogical decision-making. For instance, formative interventions could include problem-based learning modules where pre-service teachers collaboratively analyze authentic school data to design evidence-based pedagogical strategies, incorporating reflective practices to manage data-related anxiety. Such modules align with socioformative principles by promoting contextual problem-solving and holistic skill development.
Likewise, the integration of digital and data literacy competencies into teacher training curricula is essential to prepare future educators for the challenges of the 21st century, including adaptation to digital processes and the vast availability of educational data (Gálvez-de-la-Cuesta et al., 2020). Recent research further supports this, showing that enhancing digital competence through information and communication technology can significantly improve academic performance in higher education students (Milkova et al., 2025). Studies on digital teaching competence in university contexts also highlight the importance of understanding its developmental trajectories (González-Medina et al., 2025). Similarly, a study conducted at three Finnish universities with first-year students showed that positive attitudes toward digital technologies are associated with higher levels of digital competence, facilitating their integration into future pedagogical practices (Merjovaara et al., 2024). Our findings, particularly the four-factor solution suggesting a more holistic understanding of data use, imply that curricula in Chile and Spain should foster integrated competencies rather than fragmented skills. This means designing learning experiences that connect self-efficacy, technology use, data identification, analysis, and application in a cohesive manner, while also explicitly addressing the emotional challenges (anxiety) associated with data-driven decision-making. Using this type of assessment in Spanish-speaking contexts is crucial to shift from intuition-based education to evidence-based education. In many Spanish-speaking countries in Latin America and the Caribbean, educational levels are low and international assessment results reflect the urgent need for informed and sustainable improvements in their education systems (UNESCO, 2020b). The integration of DDDM allows teachers to use concrete data to guide their pedagogical practices, identify areas for improvement, and make decisions that positively impact student learning.
These results are consistent with the conceptual model outlined in the theoretical framework, which proposed that self-efficacy, digital competencies, and anxiety are interrelated dimensions within the process of data-driven decision-making. Specifically, the inter-factor correlations observed in this study support the proposed structure. Self-efficacy, technology, and identification factors exhibited moderate and positive associations, aligning with the assumption that these competencies reinforce each other in practice. In contrast, anxiety showed negative correlations with the other dimensions, reflecting the protective role of self-efficacy against negative emotional responses, as originally theorized by Bandura (1997) and supported by recent research (Dunn et al., 2013b; Alaqeel, 2024; Rubach & Lazarides, 2021).

Limitations and Future Directions

Although the sample size is adequate, generalizability is limited since only Chile and Spain were included. Despite considering cultural and institutional differences in the adaptation process, the sample was treated as a single linguistic group. This initially limited the study, as no multigroup confirmatory factor analysis (MG-CFA) was conducted. However, this limitation was later addressed by testing and confirming measurement invariance across countries and gender.
An important limitation of this study is its geographic scope, which is restricted to Chile and Spain. While these countries share a common language, they differ in institutional structures. To enhance the cross-cultural validity of the instrument, future research should replicate this study in other Spanish-speaking countries with varying levels of digital maturity and educational governance, such as Mexico, Argentina, or Colombia.
Another limitation is that the Identification factor comprises only two items. Although three or more items are typically recommended, this was supported by theoretical rationale and previous studies (Dunn et al., 2013b; Hamilton et al., 2022; Reeves et al., 2020). Recent validations have also retained two-item factors with strong conceptual and statistical support (Abraham et al., 2021; Laakasuo et al., 2022; Luo et al., 2024). Still, future research should consider expanding this subscale. Additionally, some items—especially from Interpretation and Application—were removed for contextual relevance, which may have affected construct coverage.
As a self-report study, response biases such as social desirability may also be present (Ried et al., 2022); future research may address this through strategies such as forced-choice formats, performance-based scenarios, or triangulation with qualitative data. Furthermore, CFA was not initially included due to sample size constraints but was later performed using the full sample. Future studies should replicate this analysis with independent samples and explore longitudinal changes in DDDM competencies.
In summary, the main limitations involve the cultural scope, the brevity of one factor, potential response bias, and the absence of longitudinal data. Addressing these in future research will enhance the scale’s validity and utility across Spanish-speaking contexts. Future research should also explore the predictive validity of the instrument by examining whether the assessed competencies are associated with teaching performance or student learning outcomes.

6. Conclusions

This study makes relevant contributions at three levels. Methodologically, it provides a culturally and linguistically adapted instrument to assess data-driven decision-making (DDDM) competencies among Spanish-speaking pre-service teachers. The validation process, involving contextual adaptations like strategic item removal and addition, yielded a four-factor structure reflecting a more holistic perception of DDDM. Theoretically, findings support the differentiation of self-efficacy dimensions, including Identification, and confirm how higher self-efficacy and digital competence relate to reduced anxiety in data use. Practically, the validated scale serves as a formative tool for teacher education programs, offering actionable insights to strengthen data literacy, promote evidence-based instructional decision-making, and improve learning outcomes.
This study not only fills a critical methodological gap in Spanish-language DDDM assessment but also provides a foundation for culturally relevant interventions aimed at enhancing educational quality in diverse Spanish-speaking contexts.

Supplementary Materials

The following supporting information can be downloaded at https://www.mdpi.com/article/10.3390/educsci15070789/s1, Figure S1: Parallel analysis; Table S1: Spanish-Language Scale on Data-Driven Decision-Making in Pre-Service Teachers (Spanish/English).

Author Contributions

Conceptualization, F.S.-R. and J.A.L.-N.; data curation, F.S.-R.; formal analysis, F.S.-R.; investigation, F.S.-R. and C.C.-O.; methodology, F.S.-R. and J.A.L.-N.; supervision, J.A.L.-N.; validation, J.A.L.-N.; visualization, F.S.-R.; writing—original draft, F.S.-R.; writing—review and editing, F.S.-R., C.C.-O., and J.A.L.-N. All authors have read and agreed to the published version of the manuscript.

Funding

This research received no external funding.

Institutional Review Board Statement

The study was conducted in accordance with the Declaration of Helsinki and approved by the Research Ethics Committee of the University of Granada (Registration No. 3326/CEIH/2023) on 16 February 2023.

Informed Consent Statement

Informed consent was obtained from all subjects involved in the study.

Data Availability Statement

The data supporting the findings of this study are not publicly available due to ethical and privacy restrictions. Participants were assured that their responses would remain confidential and would not be shared outside the research team. Sharing the dataset would compromise the anonymity and privacy of individual participants.

Acknowledgments

We sincerely thank the pre-service teacher education students from the participating universities in Chile and Spain who voluntarily took part in this study. Their willingness and commitment made the validation of this instrument possible. We also extend our gratitude to the experts who contributed to the content review and cultural validation process of the questionnaire, whose valuable insights and suggestions greatly enriched this research.

Conflicts of Interest

The authors declare no conflicts of interest.

Appendix A

Table A1. English translation of the survey items (for reference only).
Item
1. I am confident that I know what types of data or reports I need to evaluate group performance.
2. I am confident that I know what types of data or reports I need to evaluate student performance.
3. I am confident in my ability to understand assessment reports.
4. I am confident in my ability to interpret subtest or content area scores to determine students’ strengths and weaknesses in a specific area.
5. I am confident that I can use data to identify students with special learning needs.
6. I am confident that I can use data to identify gaps in students’ understanding of curricular concepts.
7. I am confident that I can use assessment data to provide students with specific feedback on their performance or progress.
8. I am confident that I can use data to group students with similar learning needs for instruction.
9. I am confident in my ability to use data to guide my selection of specific interventions to address students’ learning gaps.
10. I can identify and use appropriate sources in digital environments based on my information needs.
11. I can use my search strategies in digital environments.
12. I am critical of information, sources, and data in digital environments.
13. I can securely store digital information and data.
14. I can retrieve the information I have stored.
15. I can retrieve information I have stored from different environments.
16. I feel intimidated by statistics.
17. I worry about feeling or seeming “stupid” when it comes to making data-based decisions.
18. I am intimidated by the process of linking data analysis with my teaching practice.

Appendix B

Table A2. Comparative overview of initial teacher education: Chile vs. Spain.
Dimension ChileSpain
Program duration5-year undergraduate teacher education programs (10 semesters), leading to a professional teaching degree.4-year undergraduate degree (Grado) for Primary or Early Childhood Education. For Secondary Education, a university degree plus a 1-year Master’s is required.
Admission criteriaRegulated by Law 20.903, including minimum scores in national exams (PAES), NEM (high school GPA), or ranking of high school achievement.Admission is based on the results of the national university entrance exam (EBAU), with no specific national-level criteria for teacher education programs.
Curriculum structureIncludes disciplinary training, pedagogy, and progressive practicum experiences beginning in early semesters.Focuses on theoretical foundations and mandatory practicum, typically concentrated in later semesters or during the Master’s program.
National diagnostic assessmentMandatory Evaluación Nacional Diagnóstica (END) in the second and final years, aligned with the national standards for initial teacher education.No national diagnostic exam. Internal assessments are managed by each university.
Professional certificationThe teaching degree grants eligibility to work as a teacher. Entry into the public education system requires participation in national or municipal competitions.The degree (Grado or Master) grants eligibility, but public school teachers must pass national competitive examinations (oposiciones) based on standardized content.
Competency frameworksGoverned by the 2023 Initial Teacher Education Standards (Estándares Orientadores), which include general references to digital skills and data use.Based on the Marco de Competencia Digital Docente (Instituto Nacional de Tecnologías Educativas y de Formación del Profesorado, n.d.), which explicitly incorporates data-informed decision-making, learning analytics, and digital fluency.
Data use trainingNo standardized national approach. Some teacher education programs include content related to data use, evaluation, and technologies, but implementation varies across institutions.Data use is explicitly addressed through the digital competence framework of the National Institute of Educational Technologies and Teacher Training and integrated into state-level policies for teacher training and professional performance.

References

  1. Abraham, J., Ferfolja, T., Sickel, A., Power, A., Curry, C., Fraser, D., & Mackay, K. (2021). Development and validation of a scale to explore pre-service teachers’ sense of preparedness, engagement and self-efficacy in classroom teaching. Australian Journal of Teacher Education, 46(1), 1–23. [Google Scholar] [CrossRef]
  2. Alaqeel, A. M. (2024). Examining self-efficacy and anxiety in data-driven decision-making practices among learning disabilities teachers in Saudi Arabia: A mixed methods study. Cogent Education, 11(1), 2434775. [Google Scholar] [CrossRef]
  3. Ambuehl, B., & Inauen, J. (2022). Contextualized measurement scale adaptation: A 4-step tutorial for health psychology research. International Journal of Environmental Research and Public Health, 19(19), 12775. [Google Scholar] [CrossRef]
  4. Bandura, A. (1977). Self-efficacy: Toward a unifying theory of behavioral change. Psychological Review, 84(2), 191–215. [Google Scholar] [CrossRef]
  5. Bandura, A. (1997). Self-efficacy: The exercise of control. W. H. Freeman. [Google Scholar]
  6. Betancur-Chicué, V., Gómez-Ardila, S. E., Cárdenas-Rodríguez, Y. P., Hernández-Gómez, S. A., Galindo-Cuesta, J. A., & Cadrazco-Suárez, M. A. (2023). Instrumento para la identificación de competencias digitales docentes: Validación de un instrumento basado en el DigCompEdu en la Universidad de la Salle, Colombia. Revista Prisma Social, 41, 27–46. Available online: https://revistaprismasocial.es/article/view/4970 (accessed on 10 May 2025.).
  7. Brinkhuis, M. J. S., & Maris, G. (2019). Tracking ability: Defining trackers for measuring educational progress. In B. Veldkamp, & C. Sluijter (Eds.), Theoretical and practical advances in computer-based educational measurement (pp. 161–173). Springer. [Google Scholar] [CrossRef]
  8. Busco, C., González, F., & Aránguiz, M. (2023). Factors that favor or hinder the acquisition of a digital culture in large organizations in Chile. Frontiers in Psychology, 14, 1153031. [Google Scholar] [CrossRef]
  9. Caycho-Rodríguez, T., Vilca, L. W., Cervigni, M., Gallegos, M., Martino, P., Calandra, M., Rey Anacona, C. A., López-Calle, C., Moreta-Herrera, R., Chacón-Andrade, E. R., Lobos-Rivera, M. E., del Carpio, P., Quintero, Y., Robles, E., Panza Lombardo, M., Gamarra Recalde, O., Buschiazzo Figares, A., White, M., & Burgos-Videla, C. (2022). Cross-national measurement invariance of the purpose in life test in seven Latin American countries. Frontiers in Psychology, 13, 974133. [Google Scholar] [CrossRef] [PubMed]
  10. Centro de Perfeccionamiento, Experimentación e Investigaciones Pedagógicas. (n.d.-a). National diagnostic assessment of initial teacher education. Ministry of Education of Chile. Available online: https://cpeip.cl/Categoria/evaluacion-nacional-diagnostica-de-la-formacion-inicial-docente/ (accessed on 24 May 2025).
  11. Centro de Perfeccionamiento, Experimentación e Investigaciones Pedagógicas. (n.d.-b). Guiding standards for initial teacher education. Ministry of Education of Chile. Available online: https://www.cpeip.cl/estandares-formacion-docente/ (accessed on 24 May 2025).
  12. Conn, C. A., Bohan, K. J., Bies-Hernandez, N. J., Powell, P. J., Sweeny, S. P., Persinger, L. L., & Persinger, J. D. (2022). Expected data literacy knowledge and skills for early career teachers: Perspectives from school and district personnel. Teaching and Teacher Education, 111, 103607. [Google Scholar] [CrossRef]
  13. Costello, A. B., & Osborne, J. W. (2005). Best practices in exploratory factor analysis: Four recommendations for getting the most from your analysis. Practical Assessment, Research & Evaluation, 10(7), 1–9. [Google Scholar] [CrossRef]
  14. Cruz-Vargas, J., Pérez-González, M., & Rodríguez-López, A. (2023). Implications for the quality of initial teacher training: The influence of socioformative processes. Mediterranean Journal of Social Sciences, 14(2), 101–110. [Google Scholar] [CrossRef]
  15. Datnow, A., & Park, V. (2019). Professional collaboration with purpose: Teacher learning towards equitable and excellent schools. Routledge. [Google Scholar]
  16. Dunn, K. E., Airola, D. T., & Hayakawa, T. (2020). Pre-service teachers’ efficacy, anxiety, and concerns about data and the new idea of anchored judgment. Current Issues in Education, 21(1), 1–25. Available online: http://cie.asu.edu/ojs/index.php/cieatasu/article/view/1856 (accessed on 24 May 2025).
  17. Dunn, K. E., Airola, D. T., Lo, W. J., & Garrison, M. (2013a). Becoming data driven: The influence of teachers’ sense of efficacy on concerns related to data-driven decision making. Journal of Experimental Education, 81(2), 222–241. [Google Scholar] [CrossRef]
  18. Dunn, K. E., Airola, D. T., Lo, W. J., & Garrison, M. (2013b). What teachers think about what they can do with data: Development and validation of the data-driven decision-making efficacy and anxiety inventory. Contemporary Educational Psychology, 38(1), 87–98. [Google Scholar] [CrossRef]
  19. Ertmer, P. A., Ottenbreit-Leftwich, A. T., Sadik, O., Sendurur, E., & Sendurur, P. (2012). Teacher beliefs and technology integration practices: A critical relationship. Computers & Education, 59(2), 423–435. [Google Scholar] [CrossRef]
  20. Etikan, I., Abubakar, S., & Sunusi, R. (2016). Comparison of convenience sampling and purposive sampling. American Journal of Theoretical and Applied Statistics, 5(1), 1–4. [Google Scholar] [CrossRef]
  21. Fabrigar, L. R., MacCallum, R. C., Wegener, D. T., & Strahan, E. J. (1999). Evaluating the use of exploratory factor analysis in psychological research. Psychological Methods, 4(3), 272–299. [Google Scholar] [CrossRef]
  22. Fischer, C., Pardos, Z. A., Baker, R. S., Williams, J. J., Smyth, P., Yu, R., Slater, S., Baker, R., & Warschauer, M. (2020). Mining big data in education: Affordances and challenges. Review of Research in Education, 44(1), 130–160. [Google Scholar] [CrossRef]
  23. Flodén, A., Stadtler, M., Jones Collazo, S. E., Mone, T., Ash, R., & Fridlund, B. (2020). Cross-cultural adaptation and psychometric validation of the Flodén ATODAI instrument in the North American context. BMC Nursing, 19, 55. [Google Scholar] [CrossRef]
  24. Floyd, F. J., & Widaman, K. F. (1995). Factor analysis in the development and refinement of clinical assessment instruments. Psychological Assessment, 7(3), 286–299. [Google Scholar] [CrossRef]
  25. Gaftandzhieva, S., Hussain, S., Hilčenko, S., Doneva, R., & Boykova, K. (2023). Data-driven decision making in higher education institutions: State-of-play. International Journal of Advanced Computer Science and Applications, 14(6), 397–405. [Google Scholar] [CrossRef]
  26. García-Martín, J., Rico, R., & García-Martín, M. A. (2023). Self-perception of digital competence and the use of digital resources among teachers from Spain and the United States. Behavioral Sciences, 13(7), 559. [Google Scholar] [CrossRef]
  27. Gálvez-de-la-Cuesta, M. d. C., Gertrudix-Barrio, M., & García-García, F. (2020). Datos abiertos y educación: Formación de docentes en la sociedad digital. Páginas de Educación, 13(2), 1–20. [Google Scholar] [CrossRef]
  28. Gálvez-Nieto, J. L., Salvo-Garrido, S., Domínguez-Lara, S., Polanco-Levicán, K., & Mieres-Chacaltana, M. (2023). Psychometric properties of the teachers’ sense of efficacy scale in a sample of Chilean public school teachers. Frontiers in Psychology, 14, 1272548. [Google Scholar] [CrossRef]
  29. González-Medina, I., Gavín-Chocano, Ó., Pérez-Navío, E., & Maldonado Berea, G. A. (2025). Trajectories of digital teaching competence: A multidimensional PLS-SEM study in university contexts. Information, 16(5), 373. [Google Scholar] [CrossRef]
  30. Gummer, E. S., & Mandinach, E. B. (2015). Building a conceptual framework for data literacy. Teachers College Record, 117(4), 1–22. [Google Scholar] [CrossRef]
  31. Hair, J. F., Black, W. C., Babin, B. J., & Anderson, R. E. (2014). Multivariate data analysis (7th ed.). Cengage Learning. [Google Scholar]
  32. Hamilton, V., Onder, Y., Andzik, N. R., & Reeves, T. D. (2022). Do data-driven decision-making efficacy and anxiety inventory scores mean the same thing for pre-service and in-service teachers? Journal of Psychoeducational Assessment, 40(4), 482–498. [Google Scholar] [CrossRef]
  33. Hu, L., & Bentler, P. M. (1999). Cutoff criteria for fit indexes in covariance structure analysis: Conventional criteria versus new alternatives. Structural Equation Modeling: A Multidisciplinary Journal, 6(1), 1–55. [Google Scholar] [CrossRef]
  34. Instituto Nacional de Tecnologías Educativas y de Formación del Profesorado. (n.d.). Competencia digital docente. Available online: https://intef.es/competencia-digital-educativa/competencia-digital-docente/ (accessed on 10 May 2025).
  35. Javier-Aliaga, D., Paredes-Aguirre, M., Quispe-Apaza, C., & López-Meneses, E. (2024). Self-efficacy and digital competence in teachers: Impact on the perceived usefulness of ICTs in educational settings. Education and Information Technologies. Advance online publication. [Google Scholar] [CrossRef]
  36. Jimerson, J. B. (2014). Thinking about data: Exploring the development of mental models for “data use” among teachers and school leaders. Studies in Educational Evaluation, 42, 5–14. [Google Scholar] [CrossRef]
  37. Jimerson, J. B., & Wayman, J. C. (2015). Professional learning for using data: Examining teacher needs & supports. Teachers College Record, 117(4), 1–36. [Google Scholar] [CrossRef]
  38. Kristanti, S., & Febriana, T. (2021). Adapting the Trait Emotional Intelligence Questionnaire–Short Form (TEIQue–SF) into Indonesian language and culture. Journal of Educational, Health and Community Psychology, 10(4), 320–337. [Google Scholar] [CrossRef]
  39. Laakasuo, M., Palomäki, J., Abuhamdeh, S., Salmela, M., & Salmela, M. (2022). Psychometric analysis of the flow short scale translated to finnish. Scientific Reports, 12, 20067. [Google Scholar] [CrossRef]
  40. Lee, J., Alonzo, D., Beswick, K., Abril, J. M. V., Chew, A. W., & Zin Oo, C. (2024). Dimensions of teachers’ data literacy: A systematic review of literature from 1990 to 2021. Educational Assessment, Evaluation and Accountability, 36, 145–200. [Google Scholar] [CrossRef]
  41. Li, C.-H. (2016). Confirmatory factor analysis with ordinal data: Comparing robust maximum likelihood and diagonally weighted least squares. Behavior Research Methods, 48(3), 936–949. [Google Scholar] [CrossRef]
  42. Luo, Y., Wang, Y., Zhang, Y., & Li, X. (2024). Development and validation of the self-volume management behaviour questionnaire for patients with chronic heart failure. ESC Heart Failure, 11, 1076–1085. [Google Scholar] [CrossRef]
  43. Mandinach, E. B., & Gummer, E. S. (2016). What does it mean for teachers to be data literate: Laying out the skills, knowledge, and dispositions. Teaching and Teacher Education, 60, 366–376. [Google Scholar] [CrossRef]
  44. Mandinach, E. B., & Jackson, S. (2012). Transforming teaching and learning through data-driven decision making. Corwin Press. [Google Scholar] [CrossRef]
  45. Mandinach, E. B., & Schildkamp, K. (2021). Misconceptions about data-based decision making in education: An exploration of the literature. Studies in Educational Evaluation, 69, 100842. [Google Scholar] [CrossRef]
  46. Martínez-Iñiguez, J. E., Tobón, S., & Soto-Curiel, J. A. (2021). Ejes claves del modelo educativo socioformativo para la formación universitaria en el marco de la transformación hacia el desarrollo social sostenible. Formación Universitaria, 14(1), 53–66. [Google Scholar] [CrossRef]
  47. Merjovaara, O., Eklund, K., Nousiainen, T., Karjalainen, S., Koivula, M., Mykkänen, A., & Hämäläinen, R. (2024). Early childhood pre-service teachers’ attitudes towards digital technologies and their relation to digital competence. Education and Information Technologies. Advance online publication. [Google Scholar] [CrossRef]
  48. Milkova, E., Moldoveanu, M., & Krcil, T. (2025). Sustainable education through information and communication technology: A case study on enhancing digital competence and academic performance of social science higher education students. Sustainability, 17(10), 4422. [Google Scholar] [CrossRef]
  49. Miller-Bains, K. L., Cohen, J., & Wong, V. C. (2022). Developing data literacy: Investigating the effects of a pre-service data use intervention. Teaching and Teacher Education, 109, 103569. [Google Scholar] [CrossRef]
  50. Mokkink, L. B., Terwee, C. B., Patrick, D. L., Alonso, J., Stratford, P. W., Knol, D. L., Bouter, L. M., & De Vet, H. C. W. (2010). The COSMIN checklist for assessing the methodological quality of studies on measurement properties of health status measurement instruments: An international Delphi study. Quality of Life Research, 19(4), 539–549. [Google Scholar] [CrossRef]
  51. Neugebauer, S. R., Morrison, D., Karahalios, V., Harper, E., Jones, H., Lenihan, S., Oosterbaan, F., & Tindall, C. (2020). A collaborative model to support K-12 pre-service teachers’ data-based decision making in schools: Integrating data discussions across stakeholders, spaces, and subjects. Action in Teacher Education, 43(1), 85–101. [Google Scholar] [CrossRef]
  52. Norris, M., & Lecavalier, L. (2010). Evaluating the use of exploratory factor analysis in developmental disability psychological research. Journal of Autism and Developmental Disorders, 40, 8–20. [Google Scholar] [CrossRef]
  53. O’Connor, B., & Park, M. (2023). Exploring the influence of collaborative data-based decision making among teachers in professional learning communities on teaching practice. Disciplinary and Interdisciplinary Science Education Research, 5, 17. [Google Scholar] [CrossRef]
  54. Oguguo, B., Ezechukwu, R., Nannim, F., & Offor, K. (2023). Analysis of teachers in the use of digital resources in online teaching and assessment in COVID times. Innoeduca. International Journal of Technology and Educational Innovation, 9(1), 81–96. [Google Scholar] [CrossRef]
  55. Ortiz-Mallegas, S., Carrasco-Aguilar, C., Luzón-Trujillo, A., & Torres-Sánchez, M. M. (2025). New teacher associations: Comparative analysis of teachers’ political participation in Chile and Spain. SAGE Open, 15(1). [Google Scholar] [CrossRef]
  56. Padilla-Hernández, A. L., Gámiz-Sánchez, V. M., & Romero-López, M. A. (2019). Niveles de desarrollo de la competencia digital docente: Una mirada a marcos recientes del ámbito internacional. Innoeduca. International Journal of Technology and Educational Innovation, 5(2), 140–150. [Google Scholar] [CrossRef]
  57. Penfield, R. D., & Giacobbi, P. R., Jr. (2004). Applying a score confidence interval to Aiken’s item content-relevance index. Measurement in Physical Education and Exercise Science, 8(4), 213–225. [Google Scholar] [CrossRef]
  58. Putnick, D. L., & Bornstein, M. H. (2016). Measurement invariance conventions and reporting: The state of the art and future directions for psychological research. Developmental Review, 41, 71–90. [Google Scholar] [CrossRef]
  59. Reeves, T. D., Onder, Y., & Abdi, B. (2020). Validation of the data-driven decision-making efficacy and anxiety inventory (3D-MEA) with U.S. pre-service teachers. Mid-Western Educational Researcher, 32(4), 286–303. Available online: https://scholarworks.bgsu.edu/mwer/vol32/iss4/2 (accessed on 10 May 2025).
  60. Reise, S. P., Waller, N. G., & Comrey, A. L. (2000). Factor analysis and scale revision. Psychological Assessment, 12(3), 287–297. [Google Scholar] [CrossRef]
  61. Ried, L., Eckerd, S., & Kaufmann, L. (2022). Social desirability bias in PSM surveys and behavioral experiments: Considerations for design development and data collection. Journal of Purchasing and Supply Management, 28(1), 100743. [Google Scholar] [CrossRef]
  62. Ritoša, A., Danielsson, H., Sjöman, M., Almqvist, L., & Granlund, M. (2020). Assessing school engagement: Adaptation and validation of “Engagement versus disaffection with learning: Teacher report” in the Swedish educational context. Frontiers in Education, 5, 521972. [Google Scholar] [CrossRef]
  63. Romero, C., & Ventura, S. (2020). Educational data mining and learning analytics: An updated survey. Wiley Interdisciplinary Reviews: Data Mining and Knowledge Discovery, 10(3), e1355. [Google Scholar] [CrossRef]
  64. Roy Sadradín, D., Céspedes Carreño, C., Chacana Yordá, C., & Vera Carreño, H. (2025). La competencia digital y la autoeficacia en docentes de educación superior: El rol de las variables de edad y género. European Public & Social Innovation Review, 10(1), 1–20. Available online: https://epsir.net/index.php/epsir/article/view/1413 (accessed on 10 May 2025).
  65. Rubach, C., & Lazarides, R. (2021). Addressing 21st-century digital skills in schools: Development and validation of an instrument to measure teachers’ basic ICT competence beliefs. Computers in Human Behavior, 118, 106636. [Google Scholar] [CrossRef]
  66. Salas-Rodríguez, F., Lara, S., & Martínez, M. (2021). Spanish version of the teachers’ sense of efficacy scale: An adaptation and validation study. Frontiers in Psychology, 12, 714145. [Google Scholar] [CrossRef]
  67. Sandoval-Ríos, F., Gajardo-Poblete, C., & López-Núñez, J. A. (2025). Role of data literacy training for decision-making in teaching practice: A systematic review. Frontiers in Education, 10, 1485821. [Google Scholar] [CrossRef]
  68. Scherer, R., Siddiq, F., & Teo, T. (2015). Becoming more specific: Measuring and modeling teachers’ perceived usefulness of ICT in the context of teaching and learning. Computers and Education, 88, 202–214. [Google Scholar] [CrossRef]
  69. Schildkamp, K., & Kuiper, W. (2010). Data-informed curriculum reform: Which data, what purposes, and promoting and hindering factors. Teaching and Teacher Education, 26(3), 482–496. [Google Scholar] [CrossRef]
  70. Schildkamp, K., van der Kleij, F. M., Heitink, M. C., Kippers, W. B., & Veldkamp, B. P. (2020). Formative assessment: A systematic review of critical teacher prerequisites for classroom practice. International Journal of Educational Research, 103, 101602. [Google Scholar] [CrossRef]
  71. Shamsuddin, F., & Abdul Razak, A. Z. (2023). Development of a model for data-driven decision making: Critical skills for school leaders. Malaysian Journal of Social Sciences and Humanities, 8(12), e002614. [Google Scholar] [CrossRef]
  72. Skaalvik, E. M., & Skaalvik, S. (2010). Teacher self-efficacy and teacher burnout: A study of relations. Teaching and Teacher Education, 26(4), 1059–1069. [Google Scholar] [CrossRef]
  73. Sorkos, G., & Hajisoteriou, C. (2021). Sustainable intercultural and inclusive education: Teachers’ efforts on promoting a combining paradigm. Pedagogy, Culture and Society, 29(4), 517–536. [Google Scholar] [CrossRef]
  74. Stevens, J. (2002). Applied multivariate statistics for the social sciences (4th ed.). Lawrence Erlbaum Associates. [Google Scholar]
  75. Stiggins, R. (2001). Student-involved classroom assessment (3rd ed.). Prentice Hall. [Google Scholar]
  76. Tan, H., Zhao, K., & Dervin, F. (2022). Experiences of and preparedness for intercultural teacherhood in higher education: Non-specialist English teachers’ positioning, agency and sense of legitimacy in China. Language and Intercultural Communication, 22(1), 68–84. [Google Scholar] [CrossRef]
  77. Tobón, S., & Lozano-Salmorán, E. F. (2024). Socioformative pedagogical practices and academic performance in students: Mediation of socioemotional skills. Heliyon, 10, e34898. [Google Scholar] [CrossRef]
  78. UNESCO. (2020a). Education for sustainable development: A roadmap. United Nations Educational, Scientific and Cultural Organization. Available online: https://unesdoc.unesco.org/ark:/48223/pf0000374802 (accessed on 10 May 2025).
  79. UNESCO. (2020b). Evaluation of the Latin American laboratory for the assessment of quality in education. Available online: https://unesdoc.unesco.org/ark:/48223/pf0000374760 (accessed on 10 May 2025).
  80. Valenzuela, L. Á., Ocaña, Y. J., Soto, C. V., Cotrina, J. C., & Fuster-Guillén, D. (2023). E-government and its development in the region: Challenges. International Journal of Professional Business Review, 8(1), e0939. [Google Scholar] [CrossRef]
  81. Van Audenhove, L., Korica, M., Taddeo, M., & Colpaert, J. (2024). Data literacy in the new EU DigComp 2.2 framework: How DigComp defines competences on artificial intelligence, internet of things and data. Information and Learning Sciences, 125(1/2), 60–74. [Google Scholar] [CrossRef]
  82. Velandia Rodríguez, C. A., Mena-Guacas, A. F., Tobón, S., & López-Meneses, E. (2022). Digital teacher competence frameworks evolution and their use in Ibero-America up to the year the COVID-19 pandemic began: A systematic review. International Journal of Environmental Research and Public Health, 19(19), 12628. [Google Scholar] [CrossRef]
  83. Villeneuve, A., & Bouchamma, Y. (2023). Data-driven decision making using local multi-source data: Analysis of a teacher-researcher’s professional practice. Teaching and Teacher Education, 132, 104198. [Google Scholar] [CrossRef]
  84. Vuorikari, R., Kluzer, S., & Punie, Y. (2022). DigComp 2.2: The digital competence framework for citizens (EUR 31006 EN). Publications Office of the European Union. [Google Scholar] [CrossRef]
  85. Walker, D. A., Reeves, T. D., & Smith, T. J. (2018). Confirmation of the data-driven decision-making efficacy and anxiety inventory’s score factor structure among teachers. Journal of Psychoeducational Assessment, 36(5), 477–491. [Google Scholar] [CrossRef]
  86. Yoshizawa, L. (2022). The imposition of instrumental research use: How school and district practitioners enact their state’s evidence requirements. American Educational Research Journal, 59(6), 1157–1193. [Google Scholar] [CrossRef]
Figure 1. Interaction model of self-efficacy, anxiety, and digital competence in data use.
Education 15 00789 g001
Figure 2. EFA scree plot.
Education 15 00789 g002
Figure 3. Path diagram of the confirmatory factor analysis model.
Education 15 00789 g003
Table 1. Participant characteristics.
Participants
N = 512
ValuesTotal
n; (%)
Age (n = 511)<2063 (12%)
20–29388 (76%)
30–3938 (7%)
40–4915 (3%)
50–596 (1%)
≥601(0.2%)
GenderFemale296 (57.81%)
Male211 (41.21%)
Other5 (0.98%)
UniversityChilean306 (59.77%)
Spanish206 (40.23%)
Academic LevelFirst year92 (17.97%)
Second year167 (32.62%)
Third year80 (15.62%)
Fourth year94 (18.36%)
Fifth year32 (6.25%)
Postgraduate47 (9.18%)
Table 2. Aiken’s V index for content validity.
Item CodeSubscaleSufficiencyClarityCoherenceRelevance
IT01Identification0.750.780.770.95
IT020.80.740.860.81
IT03Interpretation and Application0.760.790.90.78
IT040.930.940.90.93
IT050.930.790.870.78
IT060.750.780.770.78
IT070.890.860.940.83
IT080.80.780.880.73
IT090.730.860.780.94
IT100.930.90.770.88
IT11Technology0.950.870.770.75
IT120.940.860.910.85
IT130.790.940.810.92
IT140.880.890.760.74
IT150.810.870.880.77
IT16Anxiety0.90.740.870.9
IT170.770.840.790.92
IT180.910.810.890.79
Table 3. Descriptive statistics.
Item MeanStandard DeviationSkewnessKurtosis
1. Confío en que sé qué tipos de datos o informes necesito para evaluar el rendimiento del grupo.3.470.95−0.272.81
2. Confío en que sé qué tipos de datos o informes necesito para evaluar el rendimiento de los estudiantes3.590.95−0.482.98
3. Confío en mi capacidad para comprender informes de evaluación3.820.88−0.633.32
4. Confío en mi habilidad para interpretar puntajes de subpruebas o áreas de contenido para determinar las fortalezas y debilidades de los estudiantes en un área específica3.690.94−0.352.79
5. Confío en que puedo utilizar datos para identificar a estudiantes con necesidades especiales de aprendizaje3.591.02−0.472.82
6. Confío en que puedo utilizar datos para identificar brechas en la comprensión de los estudiantes en cuanto a conceptos curriculares3.490.98−0.412.90
7. Confío en que puedo utilizar los datos de evaluación para proporcionar retroalimentación específica a los estudiantes sobre su rendimiento o progreso3.810.94−0.673.36
8. Confío en que puedo utilizar los datos para agrupar a los estudiantes con necesidades de aprendizaje similares para la enseñanza3.660.93−0.452.96
9. Confío en mi capacidad para utilizar datos para guiar mi selección de intervenciones específicas para abordar las brechas en la comprensión de los estudiantes3.540.95−0.493.26
10. Puedo identificar y utilizar fuentes adecuadas en entornos digitales en función de mis necesidades de información3.760.93−0.432.85
11. Puedo utilizar mis estrategias de búsqueda en entornos digitales4.020.89−0.833.63
12. Soy crítico/a con la información, las fuentes y los datos en entornos digitales4.010.92−0.833.49
13. Puedo almacenar información y datos digitales de forma segura4.010.90−0.672.98
14. Puedo recuperar la información que tengo almacenada3.910.98−0.733.12
15. Puedo recuperar información que tengo almacenada de distintos entornos.3.810.98−0.542.73
16. Me siento intimidado/a por las estadísticas.2.771.240.262.13
17. Me preocupa sentirme o parecer “tonto” cuando se trata de tomar decisiones basadas en datos.2.941.360.901.79
18. Me intimida el proceso de vincular el análisis de datos con mi práctica de enseñanza.2.991.23−0.082.13
Note: The items in this table are presented in their original language (Spanish), as the survey validation was conducted in a Spanish-speaking context. An English translation of the items is provided in Appendix A for reference purposes only and is not part of the validation process.
Table 4. Exploratory factor analysis with a four-factor solution: oblimin rotation.
Item Factor Loadings
F1 (Interpretation and Application)F2
(Technology)
F3
(Identification)
F4
(Anxiety)
10.58780.44420.8784−0.1135
20.5830.42210.8289−0.0862
30.65760.44930.5311−0.2403
40.68550.45220.5608−0.1606
50.70890.34510.3804−0.0503
60.72350.36820.4351−0.1181
70.78270.46790.5639−0.2019
80.76540.42330.4758−0.1707
90.75180.45440.5276−0.1758
100.60090.57620.3567−0.2359
110.59690.63850.3694−0.1529
120.48980.53910.279−0.1244
130.46430.74630.3441−0.1152
140.41190.83910.3901−0.1418
150.4310.8460.4326−0.1585
16−0.0923−0.12390.00340.6943
17−0.1694−0.1723−0.1230.8315
18−0.1485−0.0762−0.09620.7529
Note: Factor loadings ≥ 0.40 are highlighted. Items 3–9 loaded on Factor 1 (Interpretation and Application); items 10–15 on Factor 2 (Technology); items 1 and 2 on Factor 3 (Identification); and items 16–18 on Factor 4 (Anxiety). Cross-loadings were below 0.40 and thus not retained.
Table 5. Rotated factor correlation matrix (promax).
FactorsF1 (Interpretation and Application)F2
(Technology)
F3
(Identification)
F4
(Anxiety)
F11
F20.58121
F30.62890.47281
F4−0.2163−0.1966−0.13251
Table 6. Model fit indicators.
FactorsCronbach’s Alpha > 0.70VarianceKMOBartlett’s χ2RMSEACFITLISRMR
F10.8880.330.896<0.0010.0850.9000.8810.066
F20.8550.26
F30.8570.22
F40.8020.11
Note: RMSEA = Root Mean Square Error of Approximation; CFI = Comparative Fit Index; TLI = Tucker–Lewis Index; SRMR = Standardized Root Mean Square Residual.
Table 7. Standardized factor loadings from the confirmatory factor analysis (CFA).
ItemFactorStandardized LoadingStandard Errorz-Valuep
1Identification0.9120.01658.497<0.001
20.8950.01654.592<0.001
3Interpretation and Application0.7420.02430.683<0.001
40.760.02135.859<0.001
50.720.02331.811<0.001
60.7460.0237.054<0.001
70.8410.01651.201<0.001
80.80.01942.362<0.001
90.8060.01942.526<0.001
10Technology0.7680.02235.545<0.001
110.7890.0239.236<0.001
120.6610.02923.013<0.001
130.7490.02234.52<0.001
140.8940.01466.132<0.001
150.8990.01278.151<0.001
16Anxiety0.720.02726.983<0.001
170.90.02634.666<0.001
180.7650.02926.629<0.001
Disclaimer/Publisher’s Note: The statements, opinions and data contained in all publications are solely those of the individual author(s) and contributor(s) and not of MDPI and/or the editor(s). MDPI and/or the editor(s) disclaim responsibility for any injury to people or property resulting from any ideas, methods, instructions or products referred to in the content.

