Article

Family Diversity from the Perspective of Early Childhood Education Students

by
Paula Peregrina-Nievas
1,
María Jesús Caurcel-Cara
2,
Emilio Crisol-Moya
1 and
Christian Cid-González
3,*
1
Department of Didactics and School Organization, University of Granada, 18071 Granada, Spain
2
Department of Developmental and Educational Psychology, University of Granada, 18071 Granada, Spain
3
Open University of Catalonia, Rambla del Poblenou, 154-156, Sant Martí, 08018 Barcelona, Spain
*
Author to whom correspondence should be addressed.
Educ. Sci. 2025, 15(4), 456; https://doi.org/10.3390/educsci15040456
Submission received: 10 March 2025 / Revised: 2 April 2025 / Accepted: 3 April 2025 / Published: 5 April 2025
(This article belongs to the Special Issue Cutting-Edge Research on Childhood Special Education)

Abstract

:
Family diversity is a reality in Spanish Early Childhood Education schools. However, there is little research on the perspective of teachers and families on this type of diversity, and even fewer studies on the viewpoint of children in Early Childhood Education. This study analyzed the perception of family diversity among 156 Early Childhood Education children from three schools in the province of Granada (Spain). Alongside the use of the ‘Family Diversity Questionnaire for Children’, a quantitative study was conducted with a non-experimental, descriptive, cross-sectional, and comparative design. Descriptive statistics (mean, standard deviation, and mode) and frequencies were calculated. After assessing the normality of the data using the Kolmogorov–Smirnov test, inferential analyses were performed, using Student’s t-tests and ANOVA tests to determine whether there were any significant differences. The results showed that the nuclear family was the most recognized family structure by the children, in contrast to the one-person family, which was the least recognized. As for the happiness level, the extended family was identified as the happiest typology, while the divorced family was the one with the lowest happiness level.

1. Introduction

Family is a shared human experience (Mota et al., 2018) that profoundly shapes lives and development. Similarly, Crisol and Romero (2021) characterize it as a dynamic and common element in all societies, which evolves over time. Knowing a society implies understanding the types of families that shape it. For this reason, Dessen and Campos (2010) establish that it is relevant to know the conceptions about the family of the different members to understand its internal functioning.
Based on the systematic review conducted by Peregrina-Nievas et al. (2023), which analyzes the publications about family diversity in school contexts, it can be established that the research on this topic is very scarce. Dessen and Campos (2010) point out that there is no research that establishes the principles of how the concept of “family” develops during childhood.
That makes it essential to first address the concept of “family”. Many authors have already tried to establish a single definition of this concept. However, Aguado (2010) highlights the complex nature of the concept, because family is surrounded by values and prejudices, which makes it difficult to analyze.
However, some authors have formulated definitions of the concept. For example, Berger and Luckmann (2003) focus the definition on children and therefore establish that the family is the space in which they maintain the first processes of socialization, as well as the first contacts with culture and affective bonds.
Also, Buendica et al. (2017) define the family as an organization, as “a complex system in which its members play different roles in a relational exchange, which is also combined with other systems outside its core” (p. 12).
As mentioned by Crisol and Romero (2021), the family is dynamic and adapts to social conditions. For this reason, the concept of family has evolved, giving rise to other family models in addition to the traditional model. The authors define the traditional family as the family unit in which gender and age roles are highly defined. In this type of family, authority is dominated by the father, who usually plays the role of the head of the household.
López et al. (2008) mention that different changes in society have led to the diversification of families. In the case of Spain, sociological changes—such as the increase in life expectancy, the development of new forms of love and relationships, or the transition from patriarchy to a new philosophy of freedom, autonomy, and negotiation—have influenced family structures and given rise to family diversity (Aguado, 2010; López et al., 2008).
Several authors (Buendica et al., 2017; Irueste et al., 2018; Urdiales et al., 2021; Golani et al., 2024) have classified family models according to different criteria such as the member’s sexual orientation (two-father families and two-mother families), the number of individuals in the family (single-parent family and extended families), or the genetic link between them (adopted family).
However, some authors highlight that, despite these fast changes, families in schools are still conceived as nuclear families, which results in the marginalization of this diversity (Jeffries, 2024). For example, research by Eerola et al. (2023) points out that there is a differentiation between ‘diverse’ and ‘non-diverse’ families.
Moreover, this is not the only form of exclusion. For example, diverse families are rarely represented in textbooks (Rodríguez-Chaves et al., 2025) and children’s literature (Adam et al., 2024), with LGTBQIA+ families being the least represented (Hedberg et al., 2022). They are often required to participate in activities designed exclusively for traditional families (Vaz & Neves, 2019), such as Father’s Day or Mother’s Day, despite the existence of family models in which these figures are absent (Alemán, 2021).
Another example of exclusion in schools is the lack of support for single mothers, who face difficulties in balancing work and personal life, in addition to frequently facing economic problems (Bustos Delgado & Arenas Yáñez, 2023). These situations can generate insecurity and negatively affect the well-being of students and their families (Comas-d’Argemir, 2018).
Despite this, Capano et al. (2016) highlight that school allows children to learn about different family typologies, which provides the opportunity to question traditional norms and stereotypes about family structures, fostering a more inclusive understanding of diversity among students.

Family Diversity According to Children’s Perspective

As has been previously mentioned, few studies have analyzed these conceptions of family diversity from the children’s point of view. For example, Alegre and Prades (2015), in Castellon (Spain), study the conception of children in the last year of Early Childhood Education about the family before and after being worked on at school. This research shows that the children’s conceptions of family are confused, and they have difficulties in representing it before the subject is worked on at school.
Correa et al. (2016), in their study with students in Early Childhood Education, try to establish what children’s representations of the family are like. The authors assert that children should be understood as unique individuals to truly comprehend their behavior and their relationships with their parents. They conclude that the family plays a fundamental role in fostering children’s development.
For Poveda et al. (2011) the definition of family developed by the participating children did not follow the development established by the evolutionary literature, highlighting in this study that the representation of the family from the child’s perspective went beyond genetic bonds. Similar results are obtained in international studies by Dessen and Campos (2010), as children are not guided by blood or legal kinship but include in their family both their nuclear family and their godparents, friends, and pets; or in the study by Vaz and Neves (2019) in Coimbra (Portugal) with Early Childhood and Primary School pupils, where children consider family to be the members of their household and with whom they established ties, regardless of the existence or not of kinship.
Paniagua et al. (2018), in Seville (Andalusia, Spain), studied adopted children’s perceptions of their adoptive parents. Both studies obtained similar results, showing that children present ideas that are deeply rooted in the traditional nuclear family model despite their upbringing in other types of families.
Bosisio and Ronfani (2016), in Turin (Italy), evaluate children’s conception from diverse families. This study concludes that children do not pay attention to the concepts of “biological parents” and “non-biological parents”, as children focus on affective aspects. The authors found that school is the place where these children are confronted with situations where they must prove to others that they have a “real” family like others. This study was carried out with children in Primary Education (9–12 years old), which highlights even more the scarce presence of studies during the Early Childhood Education stage.
This is the reason why it is necessary to do more research into the ideas, conceptions, and perceptions that Early Childhood Education pupils have about the family and the family diversity with which they are surrounded in the classroom. The aim of this study is to analyze the perception of Early Childhood Education pupils about family diversity.
Specifically, the research objectives were as follows: (a) to determine which family typologies are recognized as a family structure by Early Childhood Education students; (b) to analyze whether there are differences in the recognition of family diversity according to gender, age, school district, the center type, the upbringing place and the family type; (c) to analyze the level of happiness of children growing up in different types of families from the participants’ perspective; and (d) to analyze whether there are differences in the participants’ perceptions of the level of happiness of children growing up in diverse families according to the variables: gender, age, school district, type of school, place of upbringing and type of family of the participants.

2. Materials and Methods

2.1. Participants

Data were collected from 156 children in Early Childhood Education (from 3 to 6 years old) from three different schools in the province of Granada (Andalusia, Spain). The sample selection was non-probabilistic by convenience (Hernández, 2021).
Moreover, 28.2% of the data were collected from a public school located in the urban area of Granada, specifically in the Zaidin district. This district is located in the south part of the city, and it has 41,883 inhabitants (INE, 2023).
Moreover, 48.1% of the participants were from a public school located in a town of 8.694 inhabitants (INE, 2023) in the province of Granada (Spain).
Finally, 23.7% of the data were obtained from a public–private partnership school in Granada city, located in the Beiro district. This district is located in the northern part of the city, and it has a population of 17,076 inhabitants (INE, 2023).
According to gender, 79 participants were boys (50.6%) and 77 were girls (49.4%), ranging in age from three to six years old (MAge = 4.60 years, SD = 0.85). Most of the children had a traditional nuclear family (89.1%), although there were also participants from other family typologies: 6.4% from divorced families; 5.1% from single-parent families; and 1.9% from reconstituted families. There were no participants from single-parent, homoparental, or homomarental families. Moreover, 86.4% of the children came from urban areas, and 15.4% came from rural areas. Most of the participants had one sibling (65.4%), followed by those without siblings (21.2%). Furthermore, 11.5% had two siblings, and only 1.9% had three or more siblings.

2.2. Instrument

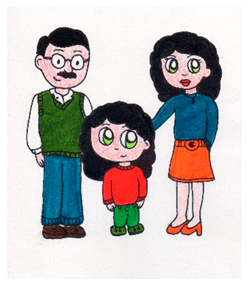
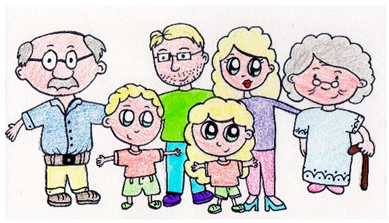
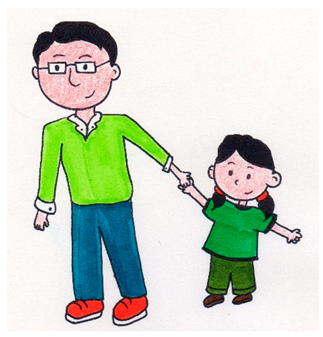
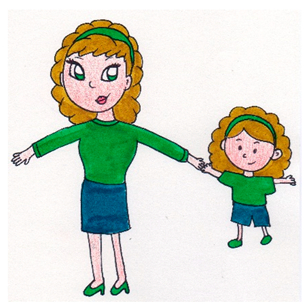
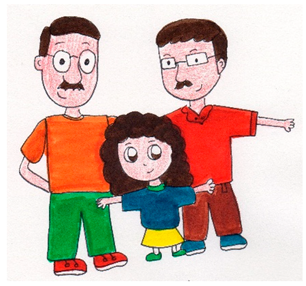
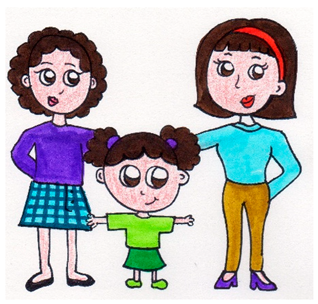
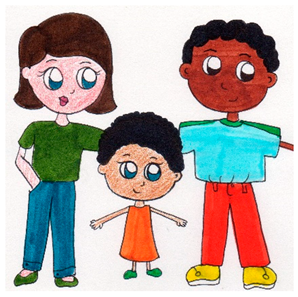
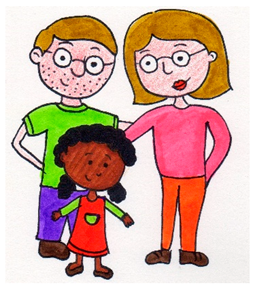
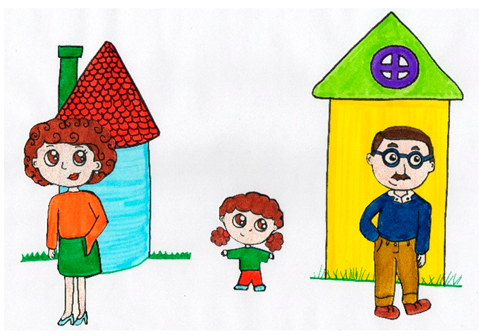
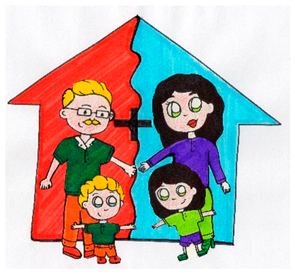
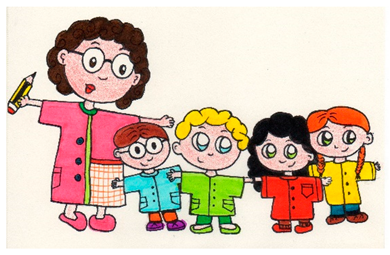
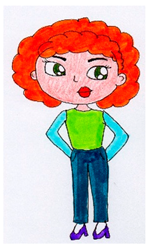
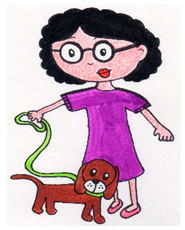
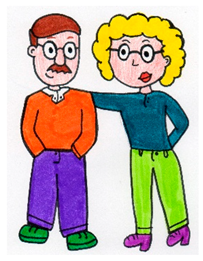
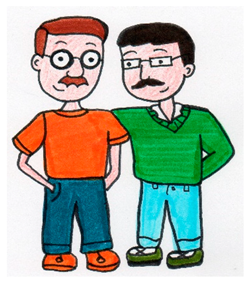
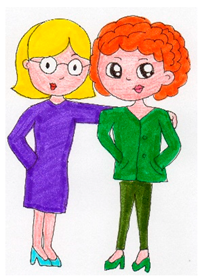
For this study, the Questionnaire for Children on Family Diversity by Peregrina et al. (2021) was used, of which two versions were created: one with drawings for boys (male gender) and the other with drawings featuring girls (female gender) to facilitate the children’s understanding and identification with the images. These drawings (Figure 1) were hand-drawn, and the characters had neutral expressions to not induce the child’s response.
This instrument was selected by the research group to collect the sample because, after reviewing the previous literature, studies with children were very few, practically non-existent in Early Childhood Education, and generally of a qualitative nature. Moreover, they did not allow for the participation of a large number of participants, which meant that they could not respond to research objectives (b) and (d).
The questionnaire consisted of four parts to find out what the child’s family was like and how the child perceived family diversity. Only the first and third parts were used for this research. The first part asked questions about socio-demographic variables (gender, age, number of siblings, place of origin, and type of family).
The third part presented seventeen drawings of different family types (nuclear, single-parent, LGTBQIA+ families, single-person, adoptive, mixed, reconstituted, divorced, a teacher and pupils, group of friends, single-person, and childless couples) that the children had to classify as family or not with a dichotomous scale “Yes”/”No” (α = 0.877), also explaining the reason for their answer. Although the “teacher and the pupils” and the “group of friends” were not considered family types, they were included to find out where the limit was for the child to differentiate between what is family and what is not (Appendix A).
In the family drawings in which children appeared, another question was also included in the form “How happy is the child in this picture?”. A Likert scale with values from one to five, in which children had to indicate the happiness level of the child in the picture, 1 = “lowest level of happiness” and 5 = “highest happiness level” (α = 0.773).
The sections of the instrument that were not used were the second section, “What is my family like?”, which asked about the distribution of household tasks among the different members of the participants’ families, and section four, “Which family do I want when I grow up?”, which included questions about what kind of family model the participants would like to have when they grow up.

2.3. Procedure

This study was carried out following the principles of the Declaration of Helsinki (WMA, 2013), adhering to the ethical standards outlined by the American Psychological Association (APA, 2018), and considering the ethical guidelines for research involving children as stated in the EECERA Ethical Code for Early Childhood Researchers (Bertram et al., 2016). To ensure responsible and reliable research, this study followed the ethical considerations set out by the University Ethics Committee of the research team (No. 1942/CEIH/2021).
All data collection lasted approximately one month, from 19 March 2024 to 14 April 2024. In order to carry out this research, meetings were held with the headmaster and management team of each school, and permission was requested to conduct this research. During the first week of March, an informed consent form was handed out for parents to sign by the children’s families.
This informed consent form guaranteed the anonymity and confidentiality of the data collected, as well as the voluntary nature of the research and the absence of physical or psychological risks for the participants.
The questionnaire was collected face-to-face in schools. It was conducted like an interview, with the children marking the desired option on the screen of the electronic device with the researcher explaining the questions. Before starting the questionnaire, a consent form was also included so the child could accept it. The children were given brief and simple verbal instructions on how to complete the questionnaire. Each interview ranged from approximately 10 to 15 min.

2.4. Data Analysis

The research was quantitative, with a non-experimental cross-sectional design (Yucra Quispe & Bernedo Villalta, 2020).
The IBM SPSS software version 24.0 for Windows was used for analysis. Descriptive statistics (mean, standard deviation, and mode) and frequencies were calculated to determine the distribution of the data. Student’s t-test and ANOVA were used to determine statistically significant differences, as the data had a normal distribution. The eta test (η2) and Cohen’s d test were used to calculate the size effect (Rendón-Macías et al., 2021).

3. Results

The recognition percentages of the family are described in Table 1. It was observed that the highest percentages were obtained by the nuclear family with 95.50% and the extended family with 94.90%. After these percentages, it was observed that the mixed family obtained 92.90%, followed by the adoptive family with 92.30%, which were also the most recognized.
However, the percentage decreased to 71.20% where the two-mother family was found, followed by the childless couple with 71.00%, the two-father family (69.90%), and the reconstituted family (68.40%). The one-mother family scored 58.30%, as did the childless female couple. The couple formed by two homosexual men without children had 54.50%, followed by the one-father family (51.30%) and the divorced family (45.50%).
The percentages drop even further when presented with a teacher and her students (40.60%) and a group of children (37.80%). The lowest percentage was in the one-person family, with 22.40%. It is noteworthy that this percentage rose to 43.30% if it was a one-person family with a pet.
The results obtained for the happiness level of children that the participants attributed to each family typology are presented below (Table 2). Although the mode in all types was 4, fluctuations were observed with respect to the means. The extended family obtained the highest mean (M = 4.17) and therefore had the highest happiness level. The next happiest families were the mixed family (M = 4.13), the nuclear family (M = 4.12), the adoptive family (M = 4.08), and the teacher with her students (M = 4.05). The mean decreased to 3.97 in the reconstituted family, the two-mother family (M = 3.92), the group of children (M = 3.88), the one-mother family (M = 3.87), and the two-father family (M = 3.86). The family typology perceived to have the lowest level of happiness was the divorced family, which had the lowest mean (M = 3.61).
In the recognition of family typologies, the variables age, school district, type of school, and type of family upbringing were discriminating factors. In terms of the happiness level of the children depicted in the drawings, the variables gender, age, school district, type of school, place of upbringing, and type of upbringing family produced statistically significant differences.
Related to the variable “gender”, only one statistically significant difference was observed (t = −2.27, p = 0.006), in which girls reported a higher happiness level (M = 3.99) for children in the one-father family compared to boys (M = 3.58). These values showed a normal size effect (η2 = 0.4499).
In the case of the variable “age”, statistically significant differences were found in the degree of recognition of the images as a family (Table 3). In the case of the one-father family, it was observed that three-year-olds (M = 0.79) and four-year-olds (M = 0.70) were more likely to identify the single-parent family as a family than five-year-olds (M = 0.38) and six-year-olds (M = 0.33).
Three-year-olds (M = 0.89) and four-year-olds (M = 0.74) were more likely to recognize the one-mother family than five-year-olds (M = 0.43). The two-father family was more reported by four-year-olds (M = 0.88) than by six-year-olds (M = 0.39). In the divorced family, post hoc tests indicated differences between three-year-olds (M = 0.79) and five-year-olds (M = 0.38), as well as between four-year-olds (M = 0.56) and six-year-olds (M = 0.17). Like the above was the case for the reconstituted family. Three-year-old children (M = 0.89) recognized it more than four-year-old children (M = 0.81), who in turn recognized it more than five-year-old children (M = 0.60) and six-year-old children (M = 0.50).
In the case of the teacher and pupils, it was found to be more recognized as a family by the three-year-old (M = 0.63) than in the case of the six-year-olds (M = 0.17). The group of children was more recognized as a family by the three-year-old (M = 0.68) than by the five-year-old (M = 0.28) and the six-year-old (M = 0.22).
In the one-person family, participants aged three (M = 0.63) identified it more than the other age groups: four (M = 0.30), five (M = 0.13), and six (M = 0.00). Finally, the recognition of the one-person family with a pet was higher in the under-threes (M = 0.74) compared to the under-fives age groups (M = 0.32). All the values showed a small size effect.
The happiness level related to the variable “age” showed statistically significant differences (Table 4). It was observed that the highest happiness level in the one-father family was reported by the three-year-old participants (M = 4.26) compared to the six-year-olds (M = 3.33).
In the divorced family, it was the six-year-old participants (M = 2.89) who reported the lowest happiness level in the child compared to the other age groups: three (M = 3.79), four (M = 3.90), and five (M = 3.57). Both cases presented a small size effect.
For the variable “school district”, there were also two statistically significant differences (Table 5). Firstly, participants from the external area of Granada showed a lower recognition (M = 0.51) of the reconstituted family compared to the schools located in the Beiro (M = 0.86) and Zaidín (M = 0.82) districts. Secondly, in the case of a teacher with her students, participants from the Zaidín district (M = 0.19) showed lower recognition compared to participants from Beiro (M = 0.62) and the external area (M = 0.43). Both cases presented a small size effect.
There were also statistically significant differences in the happiness level according to the school district (Table 6). In the case of the extended family, participants from the external area (M = 4.01) reported a higher happiness level compared to those from Zaidín (M = 4.39). For the one-father family, participants from the Beiro district (M = 3.38) reported lower levels of happiness than those from the outer zone (M = 3.83) and Zaidín (M = 4.05). In the case of the one-mother family, the lowest happiness level was in the Beiro district (M = 3.51) compared to participants from Zaidín (M = 4.14).
For two-father, two-mother, and mixed families, it was the participants from Zaidín (M = 4.26; M = 4.20; and M = 4.55) who gave the highest happiness level, compared to those from Beiro (M = 3.54; M = 3.70; and M = 4.11) and those from the outer zone (M = 3.80; M = 3.85; and M = 3.89).
Participants from the external zone (M = 3.92 and M = 3.91) reported a lower happiness level compared to Zaidín (M = 4.34 and M = 4.34) in the case of the adoptive family and a teacher and her students. Furthermore, participants from the external area (M = 3.69) indicated lower happiness compared to Beiro (M = 4.35) and Zaidín (M = 4.11). Finally, in the case of the children’s group, Beiro (M = 3.35) reported a lower happiness level compared to Zaidín (M = 4.27) and the external zone (M = 3.91). All cases had a small size effect.
Also, there were statistically significant differences in the recognition of the types of families according to the school type, depending on whether it was public or public–private partnership (Table 7). In the case of the nuclear family, participants from public schools (M = 0.97) showed a greater recognition of this family typology compared to those from the public–private partnership school (M = 0.89). The one-father family was more identified in the public schools (M = 0.56) than in the public–private partnership (M = 0.35).
The opposite happened with the reconstituted family, where children in the public–private partnership school (M = 0.86) recognized this family typology more than those in public schools (M = 0.63). Similarly, they were the ones who most identified a teacher and her students as a family (M = 0.62) compared to those in public schools (M = 0.34). Size effects ranged from small to moderate.
In addition, differences were observed in the happiness level according to the family type depending on the type of school (Table 8). In the case of the one-father and one-mother family, participants from the public–private partnership school (M = 3.38 and M = 3.51) reported a lower happiness level of the child compared to those from the public schools (M = 3.91 and M = 3.98).
In the case of the divorced family, the participants in the public–private partnership school (M = 4.35) gave a higher happiness level to the child compared to those in the public schools (M = 3.85). Finally, in the case of the group of children, the public schools (M = 4.04) assigned greater happiness than those in the public–private partnership school (M = 3.35). Size effects ranged from small to moderate.
On the variable “upbringing place” (city or countryside), there was only one statistically significant difference (t = −2.33, p = 0.025). On the happiness level for the reconstituted family, participants coming from the countryside (M = 3.70) gave a lower score than participants coming from the city (M = 4.02), with a moderately high size effect (d = 0.860).
In the case of the variable “type of upbringing family”, statistically significant differences were found in the recognition of family typologies (Table 9). In the cases of the nuclear family and the male–female couple, participants raised in one-mother families (M = 0.75, in both cases) recognized this family typology less than those from nuclear (M = 0.96, in both cases) and divorced families (M = 1.00, in both cases).
In the two-father family, those from nuclear (M = 0.73) and divorced (M = 0.60) families identified this type of family more than participants from one-mother families (M = 0.25). The male couple and female couple were more recognized by participants from nuclear families (M = 0.58 and M = 0.62) and divorced families (M = 0.40 in both cases) than those from one-mother families (M = 0.13 in both cases). All the significant differences had a small size effect.
According to “upbringing family”, there was only a statistically significant difference in the happiness level according to family type (F = 3.40, p = 0.036). It was observed that in the case of the divorced family, participants coming from one-mother families (M = 3.00) gave a lower happiness level than participants coming from divorced families (M = 4.20), with a small size effect (η2 = 0.035).

4. Discussion

Knowing about family diversity from the perspective of children in Early Childhood Education is essential to address this topic at schools. The results revealed that the most recognized family typologies were the traditional nuclear family and the extended family. These results coincided with the ones obtained in the research conducted by Alegre and Prades (2015), where the nuclear family is the model most recognized by children in Early Childhood Education. The most likely cause of this result is the widespread prevalence of the nuclear family model consisting of two parents—a man and a woman—married with children, as mentioned by López et al. (2008), and which has been dominant both currently and over the past thirty years.
After the nuclear family and the extended family, the most recognized types by the children were the mixed and adoptive families. All these family models shared the same defining structure: an adult couple, consisting of a man and a woman, and their children, regardless of their biological relationship or nationality. It should be noted that these results coincided with the results obtained by Bosisio and Ronfani (2016), who establish that children do not differentiate between the concepts of “biological parents” and “non-biological parents” and that they are primarily driven by affective relationships.
On the opposite side, the least recognized typology was the one-person family. This situation may arise because children perceive a family as requiring children, or at least as consisting of two members. This can be seen in the results, as the participants recognized the person who had a pet as a family typology (43.30%) more than the person who lived alone (22.40%). These findings suggest that the presence of a companion, even if not human, plays a significant role in how children perceive and define a family.
In terms of the happiness level, extended, mixed, traditional nuclear, and adoptive families obtained the highest scores. As can be seen, there was again a similarity in the structure of these families, as they were composed of a man, a woman, and their children. These results may be due to children perceiving these families as complete as they resembled the nuclear family structure.
The family typology with the lowest happiness level was the divorced family. This may be related to children viewing parental divorce as a negative situation, which coincides with the findings of Cantón et al. (2002), who state that children in Early Childhood Education perceive divorce more negatively than in later stages of life. Additionally, a possible explanation for this lies in the negative social perception that persists regarding the consequences of divorce on family structure, despite the increase in divorce rates in recent years (Crisol & Romero, 2021). This perception, present among both teachers and families, could also influence children’s views.
It is also worth mentioning a remarkable fact regarding the drawings of the teacher with her pupils and the group of children. Although these do not represent traditional family typologies, they were included among the drawings because they depicted individuals close to the child’s environment. Interestingly, these drawings were more frequently recognized and associated with higher happiness levels than some actual family typologies. This phenomenon could be attributed to children perceiving as family those individuals who play significant roles in their immediate environment, such as teachers and classmates. Alternatively, it is possible that some children misunderstood the question, interpreting it in a broader context beyond conventional family structures. This highlights the importance of considering how children conceptualize family based on their lived experiences and social interactions, as it is mentioned by Dessen and Campos (2010).
After analyzing the socio-demographic variables, the results revealed that there were no significant differences between boys and girls in the recognition of family types. Only a different perception of the happiness level of the child within the single-parent family was observed, with girls giving a higher level of happiness than boys. This difference may be related to the roles established in the family environment, as Herrera (2000) states that girls, as future women, tend to be educated to be more sensitive and give greater importance to family care and well-being.
According to the variable of “age,” the results revealed a clear trend: the recognition of different family typologies decreased as children grew older. This notable decline in acknowledging family diversity may be explained by the influence of the socio-cultural environment, as suggested by Crisol and Romero (2018). Children’s understanding is shaped by the context in which they grow up; therefore, if family diversity is treated as a taboo subject in their everyday surroundings, their concept of family is likely to align increasingly with the models they are most frequently exposed to. Additionally, since most participants came from nuclear families, this traditional model was the one they most easily recognized, while family structures that deviated further from this norm were less frequently acknowledged.
The same situation occurred with the happiness level of the different family typologies with respect to age, with older participants giving a lower happiness level than younger ones. This situation could be due to the reasons mentioned above; as Bosisio and Ronfani (2016) established, children relate their families to positive affective experiences.
In terms of the school type, depending on whether it was public or public–private partnership, no clear trends were obtained when it comes to the recognition of family typologies. In the case of nuclear and single-parent families, they were more recognized by participants from public schools, while the reconstituted family and the teaching family with pupils were more recognized by public–private partnership school participants. No coherent explanation was found as to the causes of these results. However, the study carried out by Capano et al. (2016) should be considered, in which it is established that the way children interpret the concept of family is different from adults, and this may be the reason for not finding a logical explanation.
On the other hand, regarding the happiness level given to the different families, it was observed that public–private partnership school participants gave a lower happiness level to the single-mother, single-father, and divorced families and the group of children. The explanation for these results may lie in the fact that public–private partnership schools in Spain have often been linked to religious organizations since their creation in the nineteenth century (Fernández Llera & Muñiz, 2012), which is why they maintain more traditional ideals and are closer to a predominance of traditional nuclear families.
The upbringing environment, whether rural or urban, did not significantly influence the results, except in the case of reconstituted families. Here, children from rural areas reported lower happiness levels compared to their urban counterparts. This difference could be attributed to the larger population and greater diversity typically found in urban settings, which may lead participants to perceive such family structures as more common and socially accepted. Moreover, the sense of anonymity and varied social dynamics in cities might contribute to a broader acceptance of diverse family arrangements.
The analysis of the family upbringing variable yielded significant insights. Children from single-mother families were found to be the least likely to recognize family diversity. This could be linked to the tendency of children to identify as family what is most familiar in their immediate environment. These results showed that addressing these perceptions is crucial in promoting a more inclusive understanding of family structures.
After analyzing the results, it was evident that not all family models received the same degree of recognition. Despite variations according to the different study variables, the majority of participants showed a tendency to recognize the different family structures unequally. This reality required a critical examination of the factors leading to this disparity.
Some of the previous studies on family diversity pointed to possible reasons why not all family types are recognized equally by Early Childhood Education students. The first cause on which different authors agreed was the lack of social representation. This is not only an absence in children’s literature, as already mentioned (Adam et al., 2024; Rodríguez-Chaves et al., 2025), but also a great invisibilization in the media. Reed’s (2018) research highlighted this problem by collecting the testimony of parents of same-sex parent families who denounced the scarcity of references to LGTBQIA+ family models in TV shows, series, and other media supports.
Another aspect that could influence the perception of Early Childhood Education students about family diversity was the preconceived ideas of the children’s teachers and their families. School and family are the two main environments with which children have daily contact and the main transmitters of culture and values (Crisol & Romero, 2021), so their beliefs and attitudes can shape children’s views on different family models, as has been pointed out in previous studies (Urdiales et al., 2021; Peregrina-Nievas et al., 2023). Therefore, this research reinforces the need to address the issue of family diversity with Early Childhood Education students.
As pointed out by Capano et al. (2016), school emerges as the ideal space where different family structures coexist, which provides the ideal opportunity to analyze existing stereotypes about family structures, fostering a more inclusive understanding of diversity among students. In this sense, the aim is not only to have a positive impact on children from non-traditional families but also to promote a more enriching coexistence for all. Making this diversity visible in schools would allow Early Childhood Education students to develop a better coexistence, which would help them to develop greater tolerance and the creation of a more diverse family concept.
Addressing family diversity in Early Childhood Education is not only related to tolerance; it is also a fundamental tool for raising more empathetic, critical citizens who are prepared to live in heterogeneous societies.

5. Conclusions

This study aimed to investigate and analyze the children’s perspective about family diversity. Based on the research objectives, the conclusions obtained were as follows:
Objective (a): To determine which family typologies are recognized as a family structure by Early Childhood Education students.
Conclusion 1: Not all family models showed the same degree of recognition. Most recognized family models by children were the ones that were similar to the traditional family (with father, mother, and children). The least recognized were the families formed by only one person. However, one-person families with pets were more recognized than one-person families without pets.
Objective (b): To analyze whether there are differences in the recognition of family diversity according to gender, age, school district, school type, place of upbringing, and family type.
Conclusion 2: Analysis identified statistical differences based on different variables. The most remarkable ones were that the older children and those from rural areas recognized fewer family models. There were numerous statistically significant differences based on the age of the participants; all of them coincided in that the older participants recognized fewer of these family models.
Objective (c): To analyze the happiness levels of children growing up in different types of families from the participants’ perspective.
Conclusion 3: Related to happiness levels, the family types that had the highest recognition were the ones who were identified as the happiest. The model that participants recognized as the happiest was the extended family, and the least happy was the divorced family.
Objective (d): To analyze whether there are differences in participants’ perceptions of the level of happiness of children growing up in diverse families according to the variables gender, age, school district, type of school, place of upbringing, and type of family of the participants.
Conclusion 4: Analysis identified statistical differences based on different variables. The variable ‘school district’ showed the highest number of statistically significant differences.
This study has implications for both teachers and students’ families. On the basis of the results obtained, it is possible to raise awareness of the importance of tackling this issue in the classroom with children in Early Childhood Education. In this sense, the research makes it possible to work on the subject on the basis of the family models that are least recognized by the students, thus promoting inclusion and respect for diversity at schools. The limitations of this study include the challenge of representing certain family typologies, such as divorced or reconstituted families, in the simplest way possible to minimize the number of explanations required for the child and avoid influencing their response. Secondly, obtaining signed informed consent forms from the families of minors has been complicated. Finally, carrying out questionnaires with children in some cases, and especially with those in Early Childhood Education, can be complex due to their level of evolutionary development, both cognitively and linguistically. Another limitation of this study was the scarcity of previous studies on the subject, which made it very difficult to compare results in the discussion section.
In future research, it would be interesting to collect an even larger sample of participants, ensuring that the children belonged to as many different family typologies as possible. In addition, as a prospective research project, it is considered to complete this study from a qualitative perspective by conducting individual interviews with a group of participants and asking them about their criteria for determining whether a structure can be considered a family or not.
In conclusion, many questions remain about how children develop their understanding of the concept of family and identify family diversity. This suggests that the topic continues to be a taboo in the classroom, despite the increasing inclusion of new family models in schools. Promoting inclusive practices is essential to creating schools where diversity is embraced and valued.

Author Contributions

Conceptualization, P.P.-N., M.J.C.-C., E.C.-M. and C.C.-G.; methodology, P.P.-N., M.J.C.-C., E.C.-M. and C.C.-G.; software, P.P.-N., M.J.C.-C., E.C.-M. and C.C.-G.; validation, P.P.-N., M.J.C.-C., E.C.-M. and C.C.-G.; formal analysis, P.P.-N., M.J.C.-C., E.C.-M. and C.C.-G.; investigation, P.P.-N., M.J.C.-C., E.C.-M. and C.C.-G.; resources, P.P.-N., M.J.C.-C., E.C.-M. and C.C.-G.; data curation, P.P.-N., M.J.C.-C., E.C.-M. and C.C.-G.; writing—original draft preparation, P.P.-N., M.J.C.-C., E.C.-M. and C.C.-G.; writing—review and editing, P.P.-N., M.J.C.-C., E.C.-M. and C.C.-G.; visualization, P.P.-N., M.J.C.-C., E.C.-M. and C.C.-G.; funding acquisition, P.P.-N.; project administration, P.P.-N., M.J.C.-C., E.C.-M. and C.C.-G.; supervision, P.P.-N., M.J.C.-C., E.C.-M. and C.C.-G. All authors have read and agreed to the published version of the manuscript.

Funding

This research was funded by the Spanish Ministry of Education, Innovation and Universities (aid for university teacher training [FPU21/00749]).

Institutional Review Board Statement

This study was conducted in accordance with the Declaration of Helsinki, and approval by the University of Granada Ethics Committee on Human Research was obtained for the questionnaire, for which a favorable report was received [1942/CEIH/2021].

Informed Consent Statement

Informed consent was obtained from all subjects involved in this study.

Data Availability Statement

Data are contained within the article.

Conflicts of Interest

The authors declare no conflicts of interest.

Appendix A

  • Section 3 (girl version) of “Questionnaire for Children on Family Diversity (Peregrina et al., 2021)”
  • How do I perceive family diversity? Answer the following cuestions:
  • Family type 1
  • Education 15 00456 i001
  • Is this a family?
    Yes
    No
  • How happy is the girl in the picture?
  • Education 15 00456 i002
  • Family type 2
  • Education 15 00456 i003
  • Is this a family?
    Yes
    No
  • How happy is the girl in the picture?
  • Education 15 00456 i002
  • Family type 3
  • Education 15 00456 i004
  • Is this a family?
    Yes
    No
  • How happy is the girl in the picture?
  • Education 15 00456 i002
  • Family type 4
  • Education 15 00456 i005
  • Is this a family?
    Yes
    No
  • How happy is the girl in the picture?
  • Education 15 00456 i002
  • Family type 5
  • Education 15 00456 i006
  • Is this a family?
    Yes
    No
  • How happy is the girl in the picture?
  • Education 15 00456 i002
  • Family type 6
  • Education 15 00456 i007
  • Is this a family?
    Yes
    No
  • How happy is the girl in the picture?
  • Education 15 00456 i002
  • Family type 7
  • Education 15 00456 i008
  • Is this a family?
    Yes
    No
  • How happy is the girl in the picture?
  • Education 15 00456 i002
  • Family type 8
  • Education 15 00456 i009
  • Is this a family?
    Yes
    No
  • How happy is the girl in the picture?
  • Education 15 00456 i002
  • Family type 9
  • Education 15 00456 i010
  • Is this a family?
    Yes
    No
  • How happy is the girl in the picture?
  • Education 15 00456 i002
  • Family type 10
  • Education 15 00456 i011
  • Is this a family?
    Yes
    No
  • How happy is the girl in the picture?
  • Education 15 00456 i002
  • Family type 11
  • Education 15 00456 i012
  • Is this a family?
    Yes
    No
  • How happy is the girl in the picture?
  • Education 15 00456 i002
  • Family type 12
  • Education 15 00456 i013
  • Is this a family?
    Yes
    No
  • How happy is the girl in the picture?
  • Education 15 00456 i002
  • Family type 13
  • Education 15 00456 i014
  • Is this a family?
    Yes
    No
  • Family type 14
  • Education 15 00456 i015
  • Is this a family?
    Yes
    No
  • Family type 15
  • Education 15 00456 i016
  • Is this a family?
    Yes
    No
  • Family type 16
  • Education 15 00456 i017
  • Is this a family?
    Yes
    No
  • Family type 17
  • Education 15 00456 i018
  • Is this a family?
    Yes
    No

References

  1. Adam, H., Murphy, S., Urquhart, Y., & Ahmed, K. (2024). Where are the diverse families in Australian children’s literature? Impacts and consideration for language and literacy in the early years. Education Sciences, 14(9), 1006. [Google Scholar] [CrossRef]
  2. Aguado, L. (2010). Escuela inclusiva y diversidad de modelos familiares. Revista Iberoamericana de Educación, 56(3), 1–11. [Google Scholar] [CrossRef]
  3. Alegre, A., & Prades, S. (2015). ¿Qué es la familia? La percepción de los niños de 5 años sobre las familias [Bachelor’s Thesis, University of Jaume I]. Available online: http://repositori.uji.es/xmlui/handle/10234/137345 (accessed on 1 March 2025).
  4. Alemán, A. (2021). Diversidad familiar en el contexto escolar. Revista DELOS, Desarrollo Local Sostenible, 10–20. [Google Scholar] [CrossRef]
  5. APA. (2018). Ethical principles of psychologists and code of conduct. Rules and procedures. Ethics Committee of the American Psychological Association. Available online: https://www.apa.org/ethics/committee-rules-procedures-2018.pdf (accessed on 1 March 2025).
  6. Berger, P., & Luckmann, T. (2003). La construcción social de la realidad. Amorrortu. [Google Scholar]
  7. Bertram, T., Formosinho, J., Gray, C., Pascal, C., & Whalley, M. (2016). EECERA ethical code for early childhood researchers. European Early Childhood Education Research Journal, 24(1), 299–304. [Google Scholar] [CrossRef]
  8. Bosisio, R., & Ronfani, P. (2016). ‘Who is in Your Family?’ Italian children with non-heterosexual parents talk about growing up in a non-conventional household. Children & Society, 30, 455–466. [Google Scholar] [CrossRef]
  9. Buendica, G., Díaz García, S. M., Marmolejo, N., & Ospina, M. (2017). ¿Influye la tipología familiar en su dinámica relacional? Textos y sentidos, 17, 11–32. Available online: https://revistas.ucp.edu.co/index.php/textosysentidos/article/view/62 (accessed on 1 April 2025).
  10. Bustos Delgado, X., & Arenas Yáñez, T. (2023). Familias monomarentales: Desafíos de las madres trabajadoras estudiantes en Educación Superior, Chile. In C. Hamodi Galán, & L. Álvaro Andaluz (Eds.), El género y su transversalización en la educación (formal y no formal), en la familia y en el deporte (pp. 569–574). Universidad Técnica Federico Santa María. [Google Scholar]
  11. Cantón, J., Cortés, M. R., & Justicia, M. D. (2002). Las consecuencias del divorcio en los hijos. Psicopatología Clínica, Legal y Forense, 2(3), 47–66. Available online: https://masterforense.com/pdf/2002/2002art16.pdf (accessed on 1 April 2025).
  12. Capano, A., González, M. L., & Massonnier, N. (2016). Análisis de ideas de docentes de educación primaria sobre diversidad familiar. Propósitos y Representaciones, 4(2), 15–71. [Google Scholar] [CrossRef]
  13. Comas-d’Argemir, D. (2018). Bienestar infantil y diversidad familiar. Infancia, parentalidad y políticas públicas en España. Revista de Políticas Sociales Urbanas, 2, 173–194. Available online: https://revistas.untref.edu.ar/index.php/ciudadanias/article/view/537/502 (accessed on 1 April 2025).
  14. Correa, L. V., Vargas, E. D., & Gallego, A. M. (2016). El niño y su imaginario de familia. Simposio de Investigación Ustamed. [Google Scholar]
  15. Crisol, E., & Romero, M. A. (2018). Intervención psicoeducativa en educación infantil. Síntesis. [Google Scholar]
  16. Crisol, E., & Romero, M. A. (2021). Familia y funciones básicas. Revisión bibliográfica y reformulación teórica. In G. Alba, G. Álvarez, A. Benavides, & A. Justicia (Eds.), Investigaciones y avances en el estudio social y psicoeducativo de las familias diversas (pp. 17–28). Dykinson. [Google Scholar]
  17. Dessen, M. A., & Campos, P. C. (2010). Niños de edad preescolar y sus concepciones de la familia. Paidéia, 20(47), 345–357. [Google Scholar] [CrossRef]
  18. Eerola, P., Paananen, M., & Repo, K. (2023). Ordinary and diverse families. A case study of family discourses by Finnish early childhood education and care administrators. Journal of Family Studies, 29(2), 489–505. [Google Scholar] [CrossRef]
  19. Fernández Llera, R., & Muñiz, M. (2012). Colegios concertados y selección de escuela en España: Un círculo vicioso. Presupuesto y Gasto Público, 67, 97–118. Available online: https://digibuo.uniovi.es/dspace/handle/10651/11028 (accessed on 1 April 2025).
  20. Golani, N., Nasie, M., & Carmel, O. (2024). Families come in many forms: Attitudes and practices of Israeli kindergarten teachers towards diverse families. Early Child Development and Care, 194(5–6), 753–768. [Google Scholar] [CrossRef]
  21. Hedberg, L., Venzo, P., & Young, H. (2022). Mums, dads and the kids: Representations of rainbow families in children’s picture books. Journal of LGBT Youth, 19(2), 198–216. [Google Scholar] [CrossRef]
  22. Hernández, O. (2021). Acercamiento a los diferentes tipos de muestreo no probabilístico que existen. Revista Cubana de Medicina General Integral, 37(3), 1–3. Available online: http://scielo.sld.cu/pdf/mgi/v37n3/1561-3038-mgi-37-03-e1442.pdf (accessed on 1 April 2025).
  23. Herrera, P. (2000). Rol de género y funcionamiento familiar. Revista Cubana de Medicina General Integral, 16(6), 568–573. Available online: http://scielo.sld.cu/pdf/mgi/v16n6/mgi08600.pdf (accessed on 1 April 2025).
  24. Instituto Nacional de Estadística (INE). (2023). Cifras oficiales de población resultantes de la revisión del Padrón municipal. Año 2023. Available online: https://www.ine.es/dyngs/INEbase/es/operacion.htm?c=Estadistica_C&cid=1254736177010&menu=resultados&secc=1254736195526&idp=1254734710990 (accessed on 30 December 2024).
  25. Irueste, P., Guatrochi, M., Pacheco, S., & Delfederico, F. (2018). New family configurations: Types of family, functions and family structure. Revista de Psicoterapia Relacional e Intervenciones Sociales, 41, 11–18. Available online: https://www.redesdigital.com/index.php/redes/article/view/44 (accessed on 1 April 2025).
  26. Jeffries, M. (2024). ‘The standard system… is heteronormative’: Deconstructing the (re)production of ‘family’ in schools using a binary lens. Pedagogy, Culture & Society, 1–19. [Google Scholar] [CrossRef]
  27. López, F., Díez, M., Morgado, B., & González, M. M. (2008). Educación infantil y diversidad familiar. Revista de Educación, 10, 111–122. Available online: https://rabida.uhu.es/dspace/bitstream/handle/10272/2145/b15480057.pdf?sequence=1 (accessed on 1 April 2025).
  28. Mota, R., Hamburguer, J., & Vidal, F. (2018). La modernidad de una sociedad familiar. Informe Familia 2017. Padres y Maestros, 374, 34–40. [Google Scholar] [CrossRef]
  29. Paniagua, C., Moreno, C., Rivera, F., & Jiménez-Iglesias, A. (2018). ‘Adolescents’ perceptions of family relationships in adoptees and non-adoptees: More similarities than differences’. British Journal of Social Work, 49(1), 25–43. [Google Scholar] [CrossRef]
  30. Peregrina, P., Caurcel, M. J., & Crisol, E. (2021). Cuestionario para menores sobre Diversidad Familiar, (Unpublished manuscript).
  31. Peregrina-Nievas, P., Caurcel-Cara, M. J., & Crisol, E. (2023). Analyzing family diversity in the educational context: A systematic review. International Journal of Diversity in Education, 23(1), 35–50. [Google Scholar] [CrossRef]
  32. Poveda, D., Jociles, M. I., & Rivas, A. M. (2011). Single-parenthood by choice: Children’s socialization processes into a nonconventional family model. Athenea Digital, 11(2), 133–154. [Google Scholar] [CrossRef]
  33. Reed, E. (2018). The heterogeneity of family: Responses to representational invisibility by LGBTQ parents. Journal of Family Issues, 39(18), 4204–4225. [Google Scholar] [CrossRef]
  34. Rendón-Macías, M. E., Zarco-Villavicencio, I. S., & Villasís-Keever, M. Á. (2021). Métodos estadísticos para el análisis del tamaño del efecto. Revista Alergia México, 68(2), 128–136. [Google Scholar] [CrossRef]
  35. Rodríguez-Chaves, B., Esteban-Mora, J., & Granero-Andújar, A. (2025). Binarismo de género en el material didáctico de editoriales de educación infantil: Análisis axiológico de contenido. Revista del Laboratorio Iberoamericano para el Estudio Sociohistórico de las Sexualidades, 13(2), 1–19. [Google Scholar] [CrossRef]
  36. Urdiales, I., Caurcel, M., & Crisol, E. (2021). La Diversidad Familiar desde la perspectiva de los futuros docentes de Educación Infantil: Necesidades formativas. Revista Complutense de Educación, 32(3), 349–359. [Google Scholar] [CrossRef]
  37. Vaz, D., & Neves, M. F. (2019). A diversidade familiar em contexto educativo [Family diversity in education context]. Exedra, 1, 144–165. Available online: https://dialnet.unirioja.es/servlet/articulo?codigo=7304930 (accessed on 1 April 2025).
  38. World Medical Association (WMA). (2013, October 19). Declaration of Helsinki ethical principles for medical research involving human subjects. 64th General Assembly, Fortaleza, Brazil. Available online: https://www.wma.net/es/policies-post/declaracion-de-helsinki-de-la-amm-principios-eticos-para-las-investigaciones-medicas-en-seres-humanos/ (accessed on 1 April 2025).
  39. Yucra Quispe, T., & Bernedo Villalta, L. Z. (2020). Epistemología e investigación cuantitativa. Revista Igobernanza, 3(12), 107–120. [Google Scholar] [CrossRef]
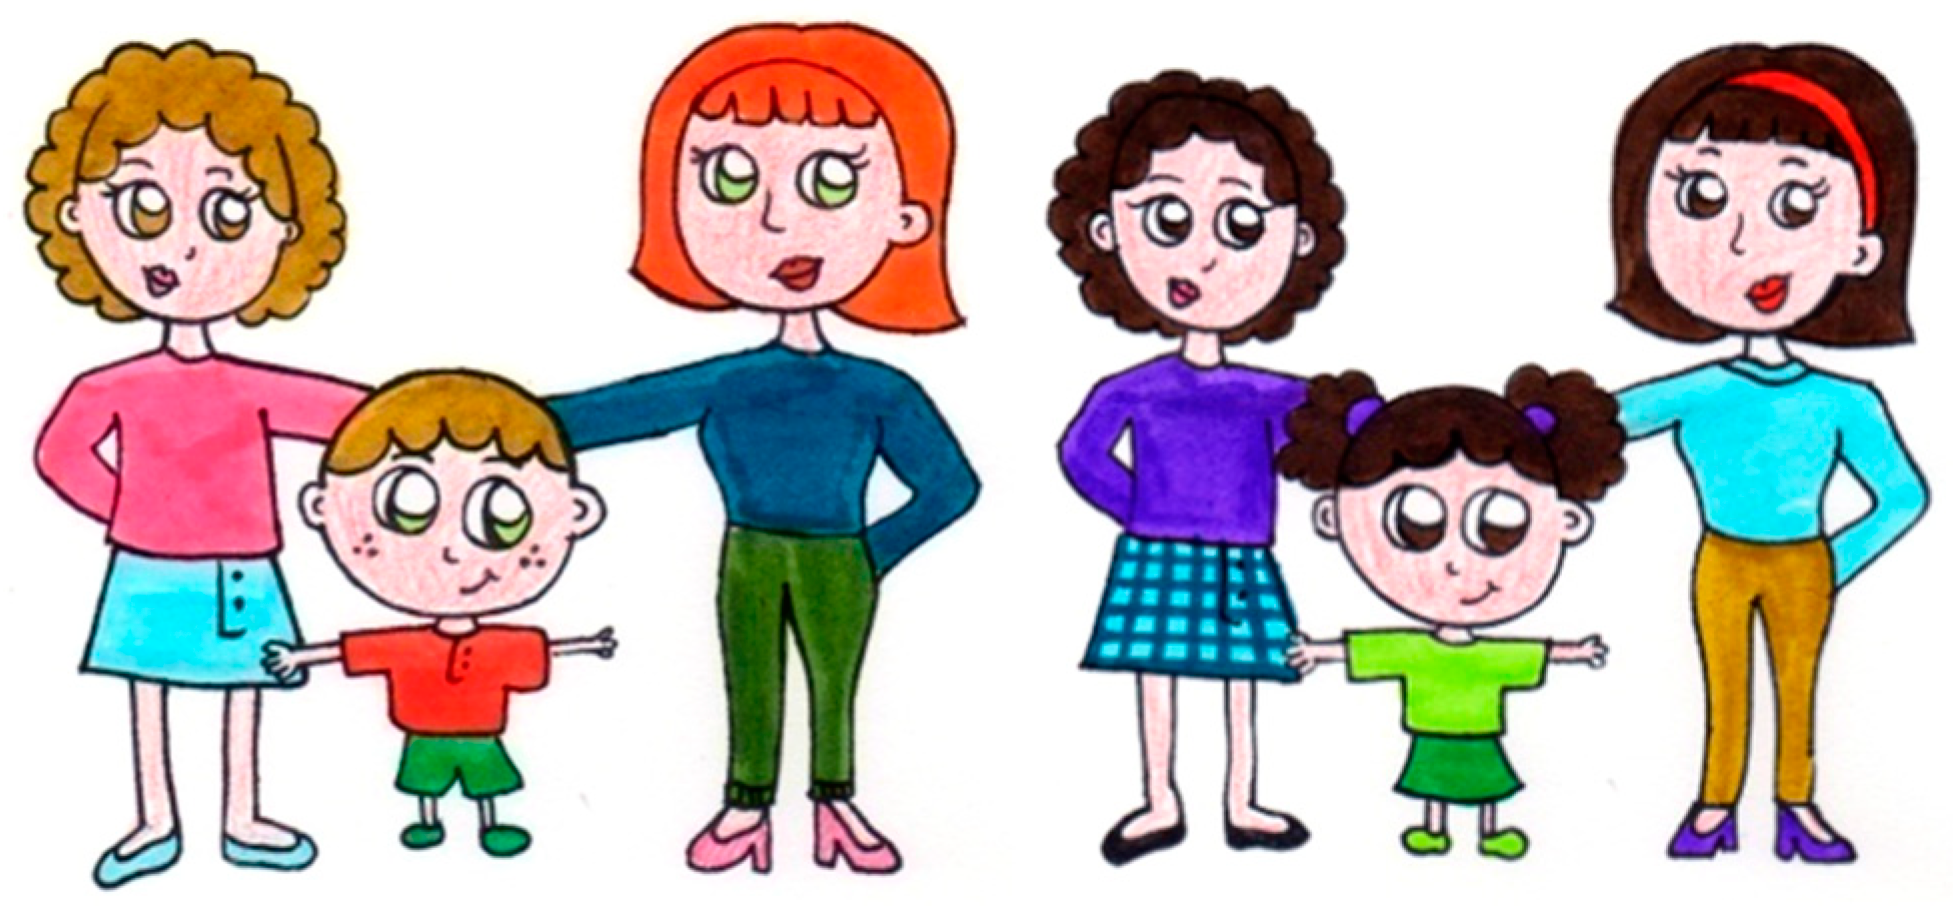
Figure 1. Drawings of two-mother family male and female versions (author elaboration).
Education 15 00456 g001
Table 1. Children’s recognition of family diversity (frequencies).
Family TypesNoYes
N%N%
A male and female couple with children74.5014995.50
A male and female couple with children and grandparents85.1014894.90
A male and female couple from different nationalities with children117.1014592.90
A male and female couple with adoptive children127.7014392.30
A female couple with children4528.8011171.20
A male and female couple4529.0011071.00
A male couple with children4730.1010969.90
A male and female couple from divorced couples with children4931.6010668.40
A female couple6541.709158.30
A woman with children6541.709158.30
A male couple7145.508554.50
A man with children7648.708051.30
A male and female divorced couple with children8554.507145.50
A person with a pet8856.806743.20
A teacher and her students9254.406340.60
A group of children9762.205937.80
A person alone12177.603522.40
Table 2. Children’s views on the degree of child’s happiness.
Family TypesMSDMo%
12345
A male and female couple with children and grandparents4.170.6041.300.003.2071.2024.40
A male and female couple from different nationalities with children4.130.6940.601.908.3062.2026.90
A male and female couple with children4.120.8043.201.302.6065.6027.30
A male and female couple with adoptive children4.080.6741.300.609.0067.1021.90
A teacher and her students4.050.7640.604.509.0061.3024.50
A male and female couple from divorced couples with children 3.970.8742.003.3017.0051.0026.80
A female couple with children3.920.8141.904.5012.2062.8018.60
A group of children3.881.0545.805.809.0053.5025.80
A woman with children3.870.8142.603.8012.8065.4015.40
A male couple with children3.860.8541.906.5012.3061.7017.50
A man with children 3.780.9343.207.1016.0055.8017.90
A male and female divorced couple with children3.610.9945.807.1020.0054.8012.30
Table 3. Significant differences in the recognition of family typology according to age.
Family TypesAgeNMSDFpη2
A man with children3190.790.427.1380.000 *0.108
4430.700.47
5760.380.49
6180.330.48
A woman with children3190.890.317.2910.000 *0.097
4430.740.44
5760.430.50
6180.500.51
A male couple with children3190.680.485.5870.001 *0.046
4430.880.32
5760.670.47
6180.390.50
A male and female divorced couple with children3190.790.426.6510.000 *0.116
4430.560.50
5760.380.49
6180.170.38
A male and female couple from divorced couples with children3190.890.314.4260.005 *0.077
4430.810.39
5760.600.49
6180.500.51
A teacher and her students3190.630.502.9660.034 *0.050
4430.440.50
5760.390.50
6180.170.38
A group of children3190.680.485.3910.001 *0.090
4430.490.51
5760.280.45
6180.220.43
A person alone3190.630.5011.3610.000 *0.173
4430.300.47
5760.130.34
6180.000.00
A person alone with pets3190.740.454.5910.004 *0.062
4430.520.50
5760.320.47
6180.390.50
Note. * p < 0.05.
Table 4. Significant differences in the happiness level according to age.
Family TypesAge NMSDFpη2
A man with children 3194.260.453.4350.019 *0.107
4433.181.01
5763.720.95
6183.330.84
A male and female divorced couple with children 3193.790.715.0050.002 *0.082
4423.900.76
5763.571.01
6182.891.28
Note. * p < 0.05.
Table 5. Significant differences in the recognition of family types according to the school district.
Family TypesLocationNMSDFpη2
A male and female couple from divorced couples with children Beiro370.860.3510.750.00 *0.109
Zaidín440.820.39
Externa740.510.50
A teacher and her studentsBeiro370.620.508.680.00 *
Zaidín430.190.500.011
Externa750.430.50
Note. * p < 0.05.
Table 6. Significant differences according to the happiness level by school district.
Family TypesDistrictNMSDFpη2
A male and female couple with children and grandparentsBeiro374.240.806.000.003 *0.165
Zaidín444.390.75
External754.010.26
A man with childrenBeiro373.381.265.630.004 *0.262
Zaidín444.051.12
External753.830.45
A woman with childrenBeiro373.511.266.430.002 *0.199
Zaidín444.140.73
External753.890.42
A male couple with children Beiro373.541.268.230.000 *0.219
Zaidín424.260.77
External753.800.49
A female couple with childrenBeiro373.701.184.480.013 *0.218
Zaidín444.200.26
External753.850.23
A male and female couple from different nationalities with children Beiro374.111.0214.660.000 *0.246
Zaidín444.550.50
External753.890.42
A male and female couple with adoptive children Beiro374.110.946.290.002 *0.152
Zaidín444.340.68
External743.910.41
A male and female couple from divorced couples with children Beiro374.350.8910.750.000 *0.319
Zaidín444.111.13
External723.690.52
A teacher and her studentsBeiro373.951.084.920.009 *0.217
Zaidín444.340.83
External743.920.40
A group of childrenBeiro373.351.488.610.000 *0.281
Zaidín444.271.11
External743.910.53
Note. * p < 0.05.
Table 7. Significant differences in the recognition of family types according to the nature of the school.
Family TypesPublic
(n = 119)
Public–Private
(n = 37)
tpd
MSDMSD
A male and female couple with children0.970.160.890.322.150.034 *0.316
A man with children0.560.500.350.482.270.024 *0.429
A male and female couple from divorced couples with children0.630.490.860.35−2.760.006 *0.540
A teacher and her students0.340.480.620.49−3.130.002 *0.577
Note. * p < 0.05.
Table 8. Significant differences according to the happiness level according to the school type.
Family TypesPublic
(n = 119)
Public–Private
(n = 37)
tpd
MSDMSD
A man with children3.910.773.381.263.100.002 *0.508
A woman with children3.980.573.511.263.170.002 *0.481
A male couple with children3.970.643.541.262.710.007 *0.430
A male and female couple from divorced couples with children 3.850.834.350.89−3.130.002 *0.581
A group of children4.040.813.351.483.640.000 *0.578
Note. * p < 0.05.
Table 9. Significant differences in the recognition of family types according to the type of upbringing family.
Family TypesUpbringing Family NMSDFpη2
A male and female couple with childrenNuclear1380.960.194.440.013 *0.002
One-mother80.750.47
Divorced101.000.00
A male and female couple with children and grandparentsNuclear1380.960.613.700.027 *0.001
One-mother80.750.35
Divorced101.000.52
A male couple with children Nuclear1380.730.444.590.012 *0.022
One-mother80.250.46
Divorced100.600.51
A male coupleNuclear1380.580.503.710.027 *0.024
One-mother80.130.35
Divorced100.400.51
A female coupleNuclear1380.620.494.800.010 *0.033
One-mother80.130.35
Divorced100.400.51
Note. * p < 0.05.
Disclaimer/Publisher’s Note: The statements, opinions and data contained in all publications are solely those of the individual author(s) and contributor(s) and not of MDPI and/or the editor(s). MDPI and/or the editor(s) disclaim responsibility for any injury to people or property resulting from any ideas, methods, instructions or products referred to in the content.