Abstract
This study provides critical policy insights into the U.S. students’ academic achievement trends and the impacts of remote learning policies and practices during the COVID-19 pandemic. Linking cross-state education assessment and survey datasets, it applies multivariate regression and case study methods to examine the relationship between remote learning policies and student achievement in reading and math. The results reveal large cross-state variations in outcomes along with regional patterns of in-person vs. remote learning policy divides. The states that adopted top-down, stringent school closure/reopening policies and relied more on remote instruction experienced relatively larger achievement declines. The government’s funding support, teacher help, and home learning resources such as technology did not work. In contrast, the states that adopted flexible school closure/reopening policies with more in-person instruction reported smaller achievement losses. Further, students’ digital literacy and remote learning self-efficacy such as online searching and help-seeking worked. The policy and research implications are discussed.
1. Introduction
The COVID-19 pandemic’s impact on K-12 education was enormous in the U.S., where instructional delivery mode suddenly switched from in-person learning to remote learning, and remote learning policies and practices varied substantially among different states and school districts (Lee et al., 2024; McElrath, 2020; U.S. Department of Education, 2021). While there is ample evidence of pandemic-induced learning losses and achievement declines in the U.S, it still remains uncertain how and why these post-pandemic trends in academic achievement varied as a result of different remote learning policies and practices across the nation. Previous studies of pandemic-induced academic achievement losses among school children in the U.S. reported that the problems were ubiquitous but not equal (e.g., Dorn et al., 2021; Kuhfeld et al., 2020; Lewis et al., 2021). The achievement losses were relatively larger in math than in reading (about five months behind in math and four months behind in reading over the 2020–2021 school year). Many studies also reported uneven adverse pandemic impacts on student learning losses by their demographic backgrounds such as race and poverty (Lewis et al., 2021; Office for Civil Rights, 2021).
However, previous research on pandemic-affected learning losses and achievement declines in the U.S. did not consider the geographic/regional contexts and variations in this phenomenon, particularly interstate variations in remote learning policies, conditions, and outcomes (Doherty et al., 2020; Rickles et al., 2020; Verlenden et al., 2021). In the midst of growing divides in political cultures and policy conflicts across the nation (Fisher, 2016), the U.S. education system has seen huge variations in state policy responses to the COVID-19 pandemic crises (Doherty et al., 2020). The U.S. government’s spending for children, including education and remote learning technology support, substantially increased during the pandemic, but this temporary relief funding also varied among the states and did not last (Miller, 2022). Remote learning policies did not work for many students and apparently failed to “do no harm” (Eder, 2020). It is crucial to understand which “state-level” remote learning policies and practices worked for or against students’ academic learning opportunities and achievement in core subjects (reading and math) during the pandemic.
Beyond the U.S. setting, many other nations also struggled with extended school closures and distance education challenges during the pandemic (Vegas, 2020). A systematic review by Donnelly and Patrinos (2022) highlighted average losses of 0.13 standard deviations (SD) across seven high-income countries, with Belgium experiencing a 0.19 SD loss in math, the Netherlands seeing a 0.08 SD decline in multiple subjects, and Australian Year 3 students falling two months behind in math progress. Further studies by Patrinos et al. (2022) estimated average losses at 0.17 SD, roughly equivalent to half a year of learning. These impacts, compounded by school closures from March 2020 to March 2022, exacerbated educational inequalities as students from lower socioeconomic backgrounds struggled with limited digital access and inadequate home learning environments. For instance, Polish secondary students’ performance in math and science declined by about 30 points (Jakubowski et al., 2022). The World Bank et al. (2021) and Azevedo et al. (2022) reported comparable losses: Belgium (0.17 SD for math, 0.19 SD for language), the United Kingdom (two months of learning), and the Netherlands (20% of a school year). These findings demonstrate the pandemic’s detrimental effects on learning outcomes even in high-income countries.
It remains questionable how well the governments collected and used data to inform and improve the decisions on school closure and remote learning, track learning opportunity gaps and achievement gaps during school closures, guide school funding and technology support for teachers and students during remote learning, etc. UNESCO provided comprehensive, publicly accessible data on school closures due to the COVID-19 pandemic, detailing the duration of closures, their scope (nationwide or regional), and the number of students affected in each country (https://covid19.uis.unesco.org/global-monitoring-school-closures-covid19/country-dashboard/ (Accessed on 1 December 2024)). UNICEF (2021) reported that school children worldwide lost an estimated 1.8 trillion hours of in-person learning since the onset of the pandemic and subsequent lockdowns. Although this global dashboard has been useful for tracking the data at the international level, it does not apply well to highly decentralized countries like the U.S. where individual states have education policymaking authority. Thus, we rely on the U.S. state-representative data such as the Education Week survey database of school closure/reopening and the National Assessment of Educational Progress (NAEP) School Dashboard (see Section 3).
Linking the above state-level policy data to the NAEP student assessment and survey data, this study examines whether and how the trends in academic achievement in reading and math at grades 4 and 8 varied among U.S. states in relation to pandemic-induced remote learning policies and practices, including school funding, technology resources and teacher–student support capacity. The U.S. state-representative time-series data allow us to track students’ learning outcomes at the elementary and middle school levels during the 2019–2022 time period. The key conditions examined include students’ readiness and capability for self-regulated remote learning, as well as teacher/parent availability for remote learning support and digital technology resources at home. Through mixed research methods with the combination of national assessment/survey data analyses and case studies, this study aims to fill in the gap of our knowledge base regarding the impact of statewide remote learning policies/practices on student achievement outcomes during the pandemic and to inform evidence-based policies and best practices for the future.
Building on prior research, this study addresses the following set of research questions. Our primary research question is as follows: How and why did grade 4 and 8 students’ academic achievement losses vary among the states that adopted different remote learning policies and practices? Further, we address interrelated sub-questions. Were those losses, if any, attributable to state-mandated school closures and prolonged exposure to remote learning? Did school systems in states with full or partial school closures, where students predominantly received remote learning instead of in-person learning throughout the pandemic period, have more academic losses than their counterparts in states that adopted full school reopening policies statewide or at the local district level? Did students with better access to instructional technology and resources at home and/or higher self-efficacy in remote learning have fewer learning difficulties and smaller achievement losses? By examining the associations of these policy-manipulable variables at the state level, our study would test the hypothesis that statewide education policies and funding during the pandemic (e.g., school closure/reopening and emergency aid) would have affected remote learning resources (e.g., technology and teacher help) and capacity (e.g., students’ self-efficacy and engagement), which in turn would affect student achievement in reading and math. This study would have evidence-based policy implications for effective remote learning during pandemic-like school closure emergency situations.
2. Literature Review
It is important to understand the role of government policies and funding during the pandemic. Although many governments have invested substantial resources in computers, internet connections, software, and information and communications technology (ICT) prior to the pandemic, this investment has not always produced obvious gains in student learning: schools and education systems have not been effective in leveraging the potential of technology (OECD, 2015). To support COVID-19 mitigation and response measures, the U.S. federal government passed the Coronavirus Aid, Relief, and Economic Security (CARES) Act in 2020, which included USD 150 billion in direct assistance for state governments, and local and tribal governments. These funds are known as the Coronavirus Relief Funds (CRFs). Each state received a minimum allocation of USD 1.25 billion. However, there were also variations in the ways that states utilized their CRF allocations. According to the National Conference of State Legislators (2021) database detailing CRF actions, many states allocated CRF funding to support remote learning (distance learning, virtual learning) in particular, as well as other areas of education and childcare support. However, there were some states that did not explicitly allocate CRF funding to school support during the pandemic. Moreover, the support focused on technology hardware/software but not on building human capacity, such as teacher and student training to use technology and seek help effectively.
Although advances in technology as well as the COVID-19 pandemic have accelerated the adoption of online learning, there remain significant gaps and challenges on both teacher and learner sides. On the learner’s side, students’ technological/digital literacies (Martin, 2006; Ng, 2012) and self-regulating abilities (Winne, 2018; Zimmerman, 2008) are essential for online remote learning success. However, the sudden shift to online learning revealed both educator and student readiness gaps in terms of digital literacy (Young, 2020). Relative to in-person education, remote learning is much more challenging for lower-performing students who may lack motivation and meta-cognitive skills to keep their learning on track, search learning resources online, and seek help from instructors (Barnard et al., 2008; Qayyum, 2018). Therefore, there is still a long way to go in that online education quality must be improved and perceived as equal to traditional in-person classroom-based education, such that obtaining credentials in any mode of education should become indistinguishable from one another (Palvia et al., 2018).
This study focuses on the U.S. states as the focal unit of analysis. Despite the difficulty of collecting valid and reliable data on instructional conditions and practices on a large scale, there were attempts to collect the data from a nationally representative sample using survey methods. For example, the National Assessment of Educational Progress (NAEP) not only assesses students’ academic achievement but also surveys teachers and students about their classroom activities so that the survey results can be used to explain the student test scores. Previous analyses of the NAEP data revealed substantial interstate variations in instructional resources, technologies, and practices, which in turn are related to academic achievement outcomes (Raudenbush et al., 1998; Lee, 2004; Swanson & Stevenson, 2002). However, the lessons of those previous studies are not directly applicable to the recent pandemic-induced school closure situation when the majority of students are engaged in out-of-school remote learning without adequate resources at home and teacher support. Moreover, most previous studies on the efficacy of online learning vis à vis in-person learning focused on the higher education sector; there is a dearth of research on the same issues in the K-12 education sector (Means et al., 2010).
The U.S. federal government has made a massive investment in broadband and internet access in three signature pieces of legislation over the past few years, which include the CARES Act, the American Rescue Plan, and the Infrastructure Investment and Jobs Act (IIJA). However, the challenge remains to ensure that all students are digitally literate and can take full advantage of its benefits (Kendall et al., 2023). According to the OECD assessment of digital literacy skills, one-in-three US workers lack digital skills (OECD, 2019). The International Society for Technology in Education (ISTE), a global organization of technology education that aims to improve digital learning, has published the standards of digital learning literacy for students, educators, coaches, and education leaders. Focused on pedagogy, not tools, the ISTE standards are a framework that guides educators in using technology to create high-impact, sustainable, and scalable learning experiences for all students (https://iste.org/standards/students (Accessed on 1 December 2024)). Those standards include the expectations of self-regulated, well-resourced, and help-seeking learners in that (1) students set learning goals, develop strategies leveraging technology to achieve them, and reflect on the learning process to improve learning outcomes; (2) students build networks and customize their learning environments in ways that support the learning process; (3) students use technology to seek feedback that informs and improves their practice and to demonstrate their learning in a variety of ways. Based on these standards, this study attempts to find and examine relevant data about students’ digital literacy and remote (online) learning practices during the pandemic. Even if most school systems were able to overcome pandemic-induced learning crises by now, online education and remote learning are likely to stay with us and become a new normal in the digital age (OECD, 2021). Therefore, the findings of this study would have implications for future online learning and education policies in the U.S. and other nations.
3. Data and Methods
This study draws upon multiple sources of national and state survey/assessment databases to answer the above research questions together: (1) state policy and funding survey data, (2) school policy and practice survey data, and (3) student learning survey and assessment data. The focal unit of analysis is individual states (N = 50 states), so that student-level or school-level data are all aggregated to the state level for cross-state comparisons (see Appendix A for data/variable descriptions). This statistical data analysis is supplemented by illustrative case studies of the four selected states: Delaware, Florida, Iowa, and New Mexico. It extends and enriches the prior research of cross-state education policy and student outcome comparisons (e.g., Lee et al., 2024) with more in-depth analysis of additional data sources and variables as follows.
3.1. State Policy and Funding Data
This study uses the Education Week survey database of state-level policies on school closure and reopening as of October 2022 (https://www.edweek.org/leadership/map-coronavirus-and-school-closures-in-2019-2020/2020/03 (Accessed on 1 December 2024)): (1) individual school district decisions on reopening (N = 40 states), (2) statewide school partial closures (N = 6 states), (3) statewide school return to in-person learning (N = 4 states), and (4) full school closure policy (N = 0 state). We also use the database of the National Conference of State Legislators (2021), State actions on Coronavirus relief funds (CRF) (https://www.ncsl.org/fiscal/state-actions-on-coronavirus-relief-funds (Accessed on 1 December 2024)), which provides cross-state information on the state spending of the federal CRF allocations. Additionally, we use government policy documents and public media reports to examine state education policies and practices during the pandemic.
3.2. School Policy and Practice Data
This study uses the National Assessment of Educational Progress (NAEP) School Dashboard (see https://ies.ed.gov/schoolsurvey/mss-dashboard/ (Accessed on 1 December 2024)) to examine school-level remote learning policy and practice during the pandemic. The National Center for Education Statistics (NCES) surveyed approximately 3500 schools each month for grades 4 and 8 each during the pandemic period of January–May 2021. A total of 46 states/jurisdictions participated, and 4100 out of 6100 sampled schools responded. This study aggregates and compares the state-level percentages of students who received in-person vs. remote/hybrid instructional modes.
3.3. Student Learning Survey and Assessment Data
This study uses the NAEP 2019 and 2022 student survey and assessment datasets (http://nces.ed.gov/nationsreportcard (Accessed on 1 December 2024)) in order to assess students’ participation in in-person vs. remote learning during the pandemic as well as their academic achievement in reading and math. The NAEP 2019 sample involves N = 150,600 grade 4 students and N = 143,100 grade 8 students across 50 states in the U.S. The NAEP 2022 sample involves N = 108,200 and N = 116,200 grader 4 students (reading and math, respectively), and also N = 111,300 and N = 111,000 grade 8 students (reading and math, respectively). This comparison of national and state-representative student performance data before and after the pandemic allows us to track which states had more or less academic achievement losses. In terms of the remote learning environment and engagement, we include a series of NAEP student survey items that tap into students’ remote learning experiences, resources, attitudes, and behaviors during the COVID-19 pandemic period (see Appendix A).
3.4. Data Analysis Methods
This study employs quasi-experimental research design to examine the relationship between state policies, school practices, and student outcomes across the 50 states. Specifically, this study employs the difference-in-differences (DID) method for comparing pre-pandemic vs. post-pandemic achievement differences among 50 states (Murnane & Willett, 2010). Here, we focus on interstate variations in grades 4 and 8 reading and math achievement trends among the states, as differentiated by their remote learning policies and practices. For instance, given that we have two periods t = 1, 2 (1 for pre-pandemic vs. 2 for post-pandemic) and two groups s = A, B (A for states with full school reopening policies vs. B for states with partial school closure policies) for each grade sample student i’s outcome Ym (i.e., whether a student performs at or above the NAEP basic achievement level in reading and math), we would estimate the between-state difference in their average achievement gains in standard deviation units (d) as follows:
Δ = (E[Ymist | s = A, t = 2] − E[Ymist | s = A, t = 1]) − (E[Ymist | s = B, t = 2] − E[Ymist | s = B, t = 1])
Then, this study uses multivariate regression methods to examine the pattern and strength of the associations between remote learning conditions as independent variables (X) and academic achievement gains as dependent variables (Y). Particularly, for the measures of X, we use the two separate aforementioned data sources: (1) the NCES School Dashboard survey measures of student enrollment rates in remote instruction and (2) the NAEP survey measures of the remote learning environment during the pandemic year (see Appendix A). Controlling for the covariates (Z) including state demographics (i.e., racial minority and poverty rates) and pre-pandemic baseline scores, we estimate and report standardized regression coefficients, that is, beta weights (byx.z):
4. Results
4.1. Remote Learning Trends
On one hand, there were significant interstate variations and changes in remote learning enrollment during the pandemic. The Center for American Progress report reveals the trends of school closure and reopening across the states during the 2020–2021 period (Ferren, 2021). By March 2020, all public schools in the U.S. had closed due to the pandemic threat, and they remained closed through the end of the school year, except for schools in two states, Wyoming and Montana. At the start of the 2020–2021 school year, four states—Arkansas, Florida, Iowa, and Texas—required in-person instruction for all or some grades. In other states, many school districts had reopening plans with a patchwork of in-person, hybrid, and remote education in place. By November 2020, 19% of the school districts remained fully remote, whereas 45% used hybrid instruction and 36% were fully in person. However, school reopening plans were often short-lived or modified due to fluctuations in COVID-19 cases in school buildings or surrounding communities. As shown in the top panel of Figure 1, according to the NAEP School Dashboard (see https://ies.ed.gov/schoolsurvey/mss-dashboard/ (Accessed on 1 December 2024)), there still remained very wide ranges of in-person vs. remote instruction enrollment rates among the 50 states during spring 2021; the average enrollment rate of remote or hybrid instruction in spring 2021 dropped to 41%, but it ranged from 10% (Wyoming) to 97 % (California). However, most schools came back to in-person education in fall 2021.
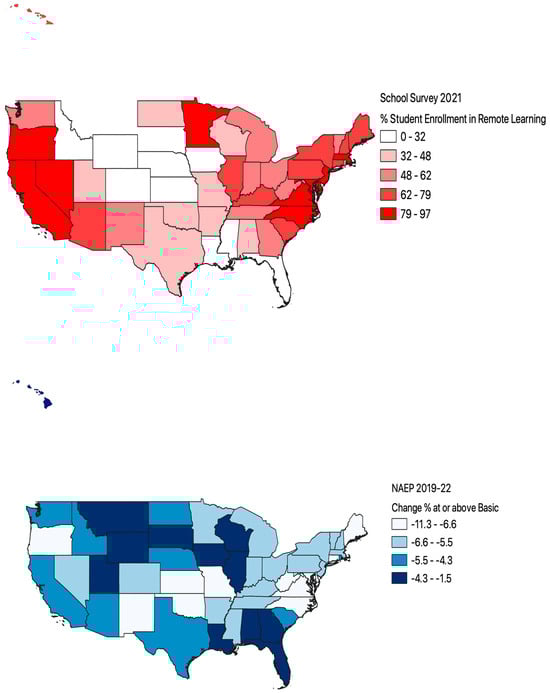
Figure 1.
Cross-state variations in remote learning enrollment (upper panel) and academic achievement losses (lower panel) among grade 4 and grade 8 students during the pandemic period. Note: Data on remote learning enrollment are missing for Alaska, Colorado, Montana, and South Dakota.
The NAEP school survey of instructional delivery modes (percent of students enrolled in in-person, hybrid, or remote learning mode each) during the pandemic period reveals that most schools switched from in-person to hybrid or remote learning. However, there were significant differences in terms of remote learning enrollment rates among the four regions, where the West and Northeast regions surpassed the Midwest and South regions (Mwest = 61%, Mnortheast = 73%, Mmidwest = 48%, MSouth = 56%). Furthermore, there were also significant differences in terms of remote learning enrollment rates by states’ policies on school closure and reopening: remote learning in states with statewide partial school closures (M = 93%) was higher than in states where local school districts made reopening decisions (M = 58%), which was in turn higher than in states with statewide school return to in-person learning (M = 34%).
A correlation analysis of some background variables among the 50 states provides additional insights into the cross-state variations and associations (see Table 1). The states where school systems relied more heavily on remote learning as opposed to in-person learning during the pandemic (i.e., red-colored states in Figure 1, upper panel) had somewhat different demographic, educational, and social environmental features. They tended to have relatively larger minority student populations (r = 0.23) and lower child poverty rates (r = −0.31). At the same time, those states with the higher rates of remote learning enrollment had relatively better home conditions for remote learning during the pandemic, including the higher percentages of students having home access to digital devices (r = 0.71), teacher help (r = 0.47), and a quiet place to do their schoolwork (r = 0.36). They also had higher COVID-19 vaccination rates (r = 0.61) among school-aged populations. Based on these correlation patterns, it turns out that those states that had more extensive school closures and thus enrolled more students in remote learning also had lower poverty and better home learning environments, while they prioritized public health over in-person schooling through the enforcement of health safety protection measures such as vaccination and social distancing rules.

Table 1.
Correlations among remote learning enrollment, home environment, and student demographics.
Further, the geographic pattern of school closure/reopening and remote learning policy variation appears to be associated with state leadership’s political party affiliation and political culture, as signified by Republican vs. Democratic governors and legislative bodies—so-called Red (Conservative-dominant) vs. Blue (Progressive-dominant) state cultures. During the pandemic, Republican policy leaders in Red states were more resistant to health safety measures and business or school closures, whereas Democratic policy leaders in Blue states embraced those public health precautions, even at the expense of the local economy and education (McGinn & Crampton, 2021).
4.2. Academic Achievement Trends
On the other hand, there were also significant interstate variations in academic achievement trends between 2019 and 2022 during the pandemic. As shown in the bottom panel of Figure 1, all 50 states experienced significant declines in average academic achievement in reading and math among grade 4 and grade 8 students, but there were wide variations among the 50 states, ranging from an 11.3% point drop in Delaware to a 1.5% point drop in Alabama. On average, the Northeast and South regions had relatively greater declines in the percentages of students at or above the NAEP basic achievement level (i.e., larger losses of basic skills in reading and math) than the Midwest and West regions over the same period (Mmidwest = −4.9, Mwest = −4.8, Mnortheast = −6.1, MSouth = −6.2).
However, the pattern also varies by grade level and subject area. The losses were relatively larger at grade 8 than at the grade 4 level and also slightly larger in math than in reading on average. Fourth-grade students did show statistically significant signs of decline on the national average (a 3-percentage point loss in reading and math), while there were wide variations among the states. Eighth-grade students’ math achievement showed a significant drop (a 6-percentage point loss in reading and a 7-percentage point loss in math) in 2021 relative to 2019, while there are also wide variations among the states. In terms of effect size, this average 8th-grade math score drop was about a quarter of one standard deviation (d = −0.25), which amounts up to about half a year’s worth of school learning.
Regarding the above achievement trends as measured by NAEP, one could wonder whether the observed change is attributable to the pandemic or something else, since the time interval between 2019 and 2022 assessments is long, and there can be other changes or events during the interim period. If we use the earlier NAEP national reading and math assessment data for grades 4 and 8 (available during the 2013–2019 period) as the basis for estimating pre-pandemic national trends, their 6-year achievement gains were mostly positive (2 points, d = +0.06 for grade 4 reading; 6 points, d = +0.17 for grade 4 math; 0 points for grade 8 reading; 4 points, d = +0.12 for grade 8 math). Thus, it is reasonable to infer that achievement trends were upward or at least stable up until the onset of the pandemic and that the pandemic may have changed the trend downwards. Given the positive pre-pandemic achievement trends, we were more likely to underestimate than overestimate the magnitude of academic losses during the pandemic period.
4.3. Association Between Remote Learning and Academic Achievement Trends
To explore the possible relationships between remote learning patterns and achievement trends, school-reported remote learning enrollment data have been aggregated and linked to the NAEP achievement data by state. The results of multiple regression analysis with the 50-state linked data are summarized in Table 2, where we first reported the averages and then broke them down by subject and grade, using remote learning conditions as predictors to explain student achievement gain scores as outcome variables (i.e., the differences between 2019 and 2022 scores in terms of the percentages of grade 4 and grade 8 students at or above the basic level in reading and math).
Table 2.
Results of the multivariate regression analysis of 2019–2022 NAEP achievement gains.
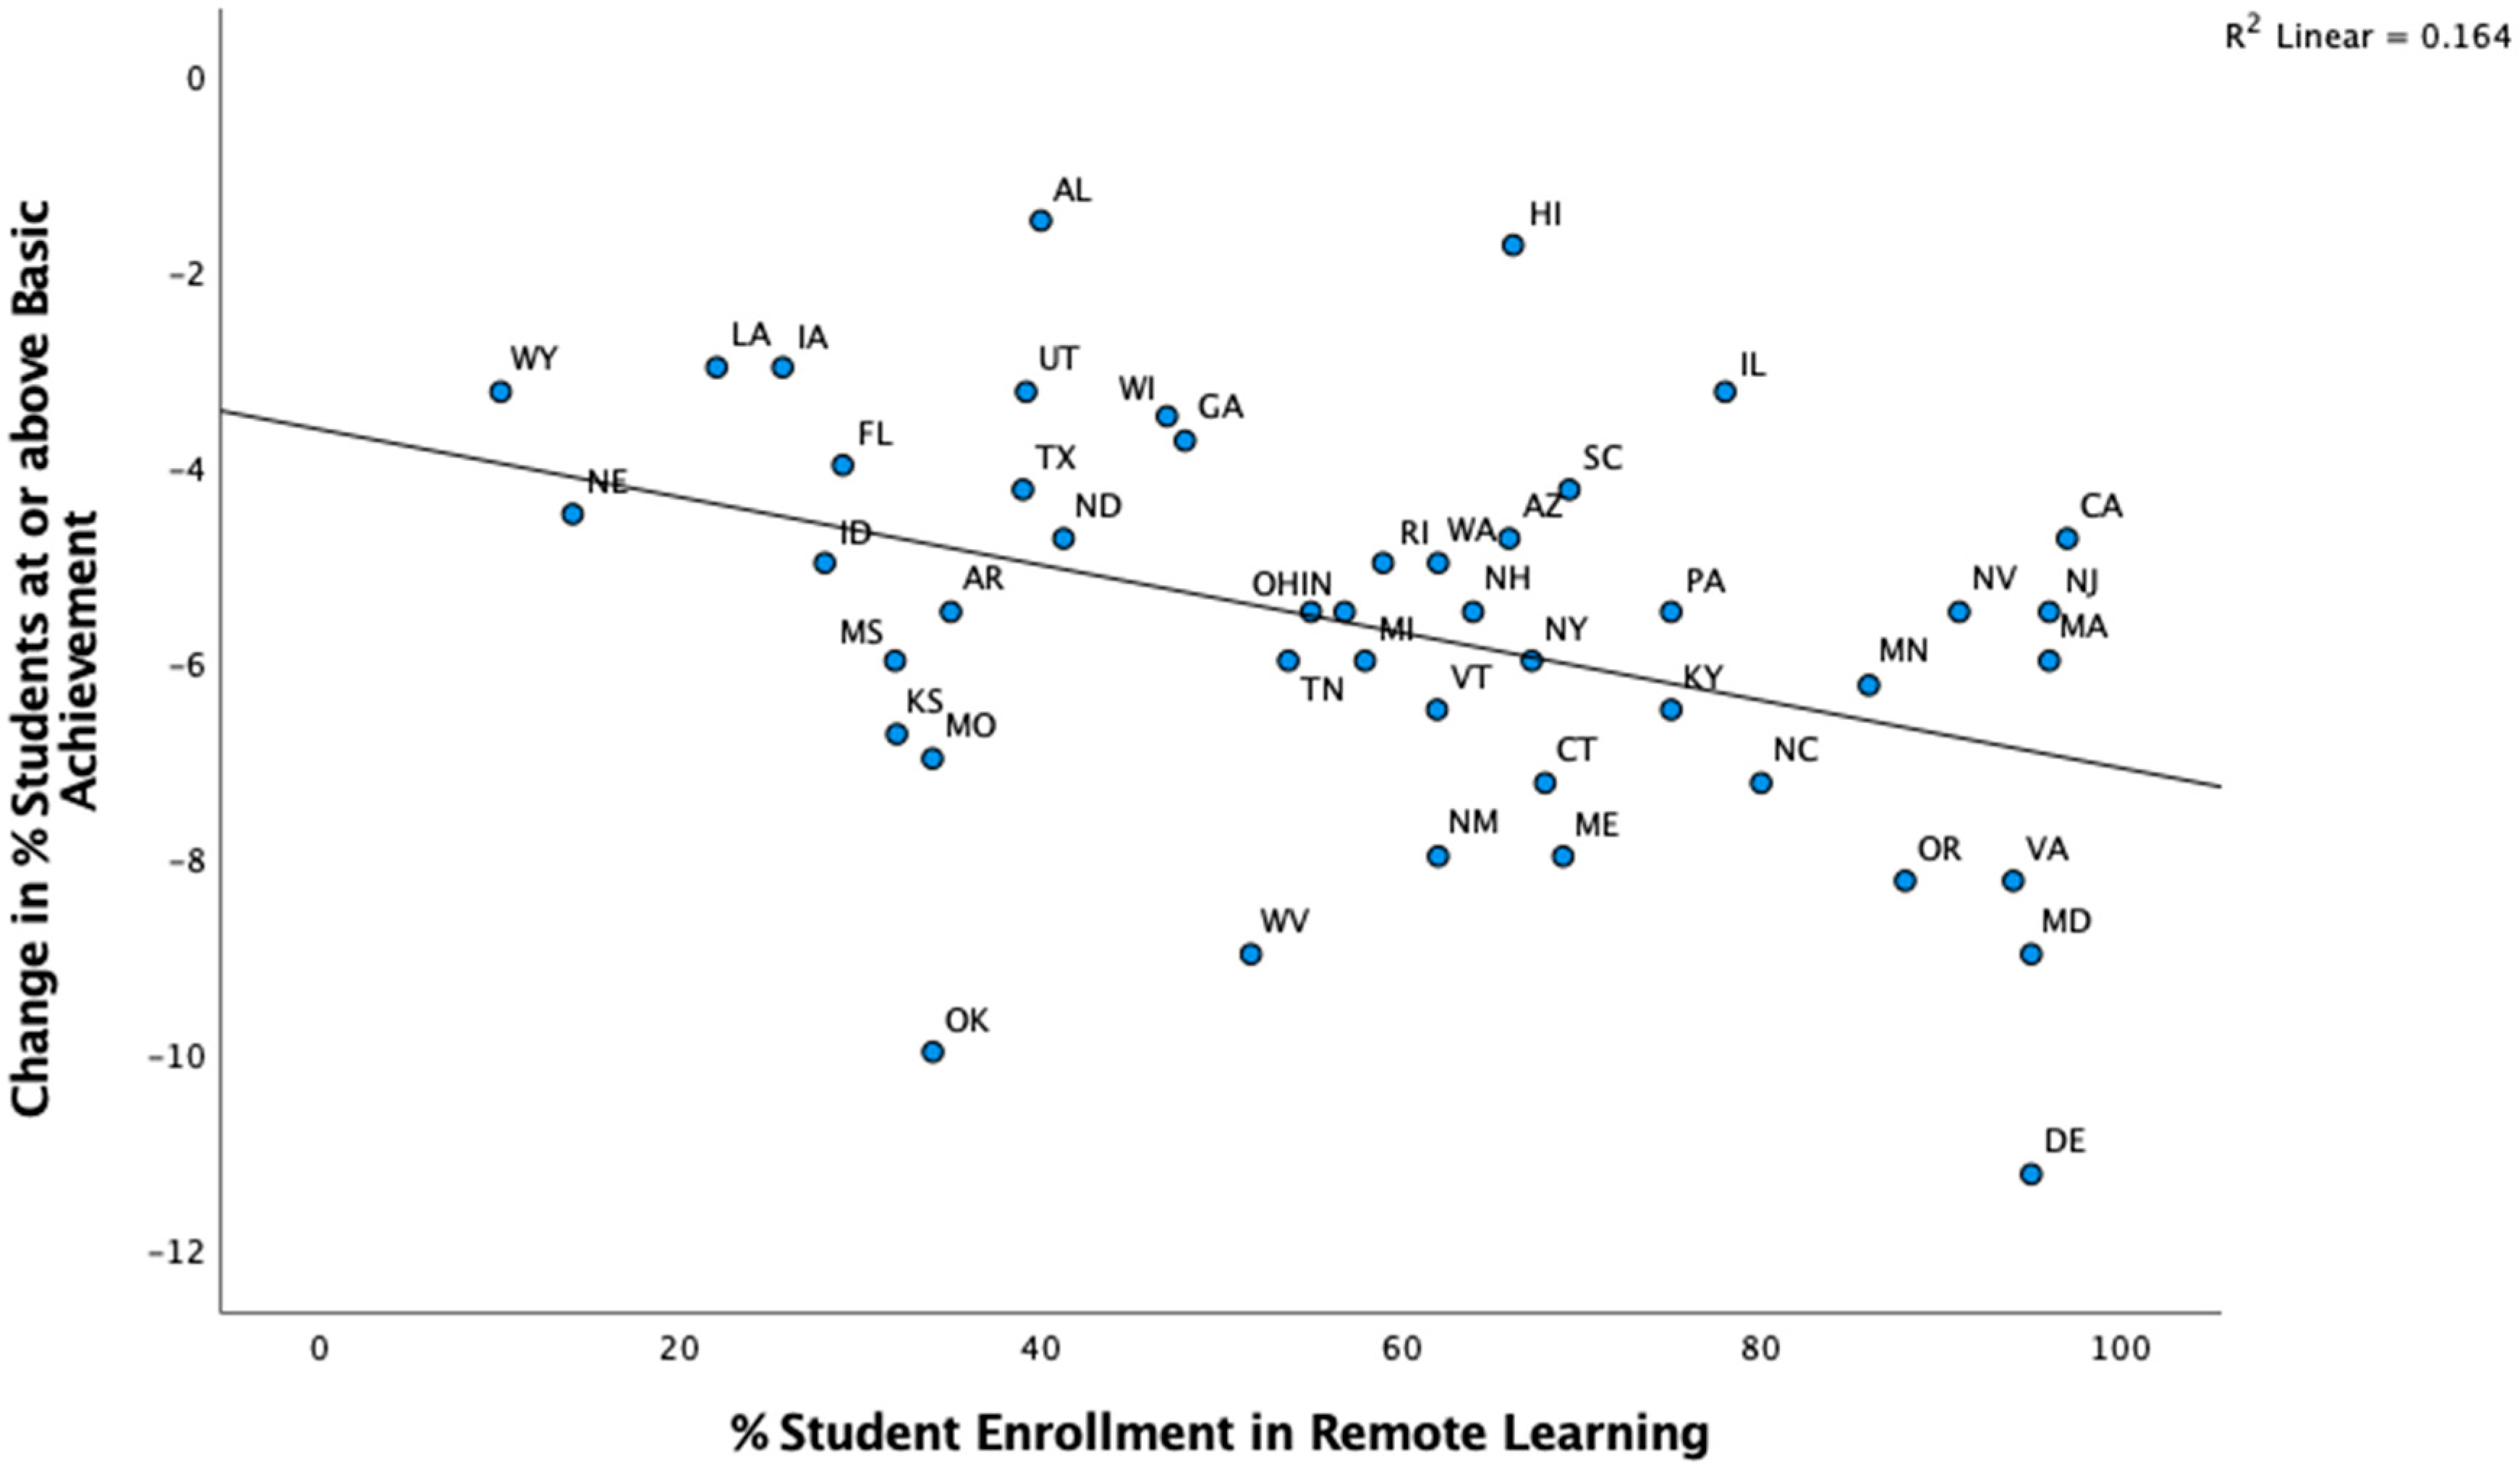
For example, under the “Average” column and the “Remote Learning Enrollment (School Reported)” row of Table 2, we reported the standardized regression coefficient (b = −0.44 **) for remote learning enrollment as a key predictor of the state-level average of 2019–22 NAEP achievement gain scores combined across all grades (4 and 8) and subjects (reading and math). Specifically, this estimated value of −0.44 implies that a one standard deviation unit increase (i.e., a 19-percentage point gain) in statewide remote learning enrollment is associated with approximately a half standard deviation unit decrease (i.e., a 1 percentage point loss) in the state average reading and math achievement outcomes. Graphically, Figure 2 shows the cross-state pattern of a moderately negative correlation, that is, an inverse linear relationship between remote learning enrollment rates and NAEP achievement gain scores. Similar patterns of negative associations emerge for grade- and subject-specific outcomes, with the exception of grade 8 reading (b = −0.51 for grade 4 reading; b = 0.07 for grade 8 reading; b = −0.48 for grade 4 math; b = −0.34 for grade 8 math).
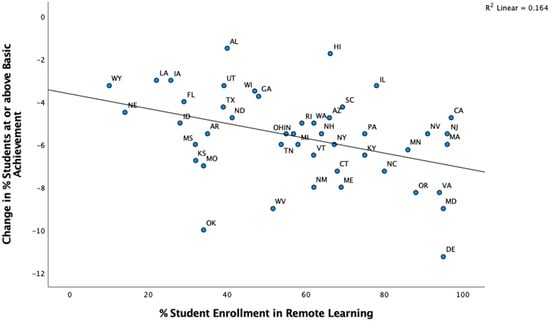
Figure 2.
Scatterplot of academic achievement losses vs. remote learning enrollment rates during the pandemic (N = 46 U.S. states).
After controlling for student demographics (racial minority and poverty rates) and baseline scores among the states, the associations between remote learning enrollment and achievement gains remained significant in slightly more negative directions (b = −0.52 for combined grades/subjects; r = −0.58 for grade 4 reading; b = −0.14 for grade 8 reading; b = −0.49 for grade 4 math; b= −0.41 for grade 8 math). On average, this remote learning enrollment pattern accounts for about 25 percent of the between-state variance in reading and math achievement trends (R2 = 0.25).
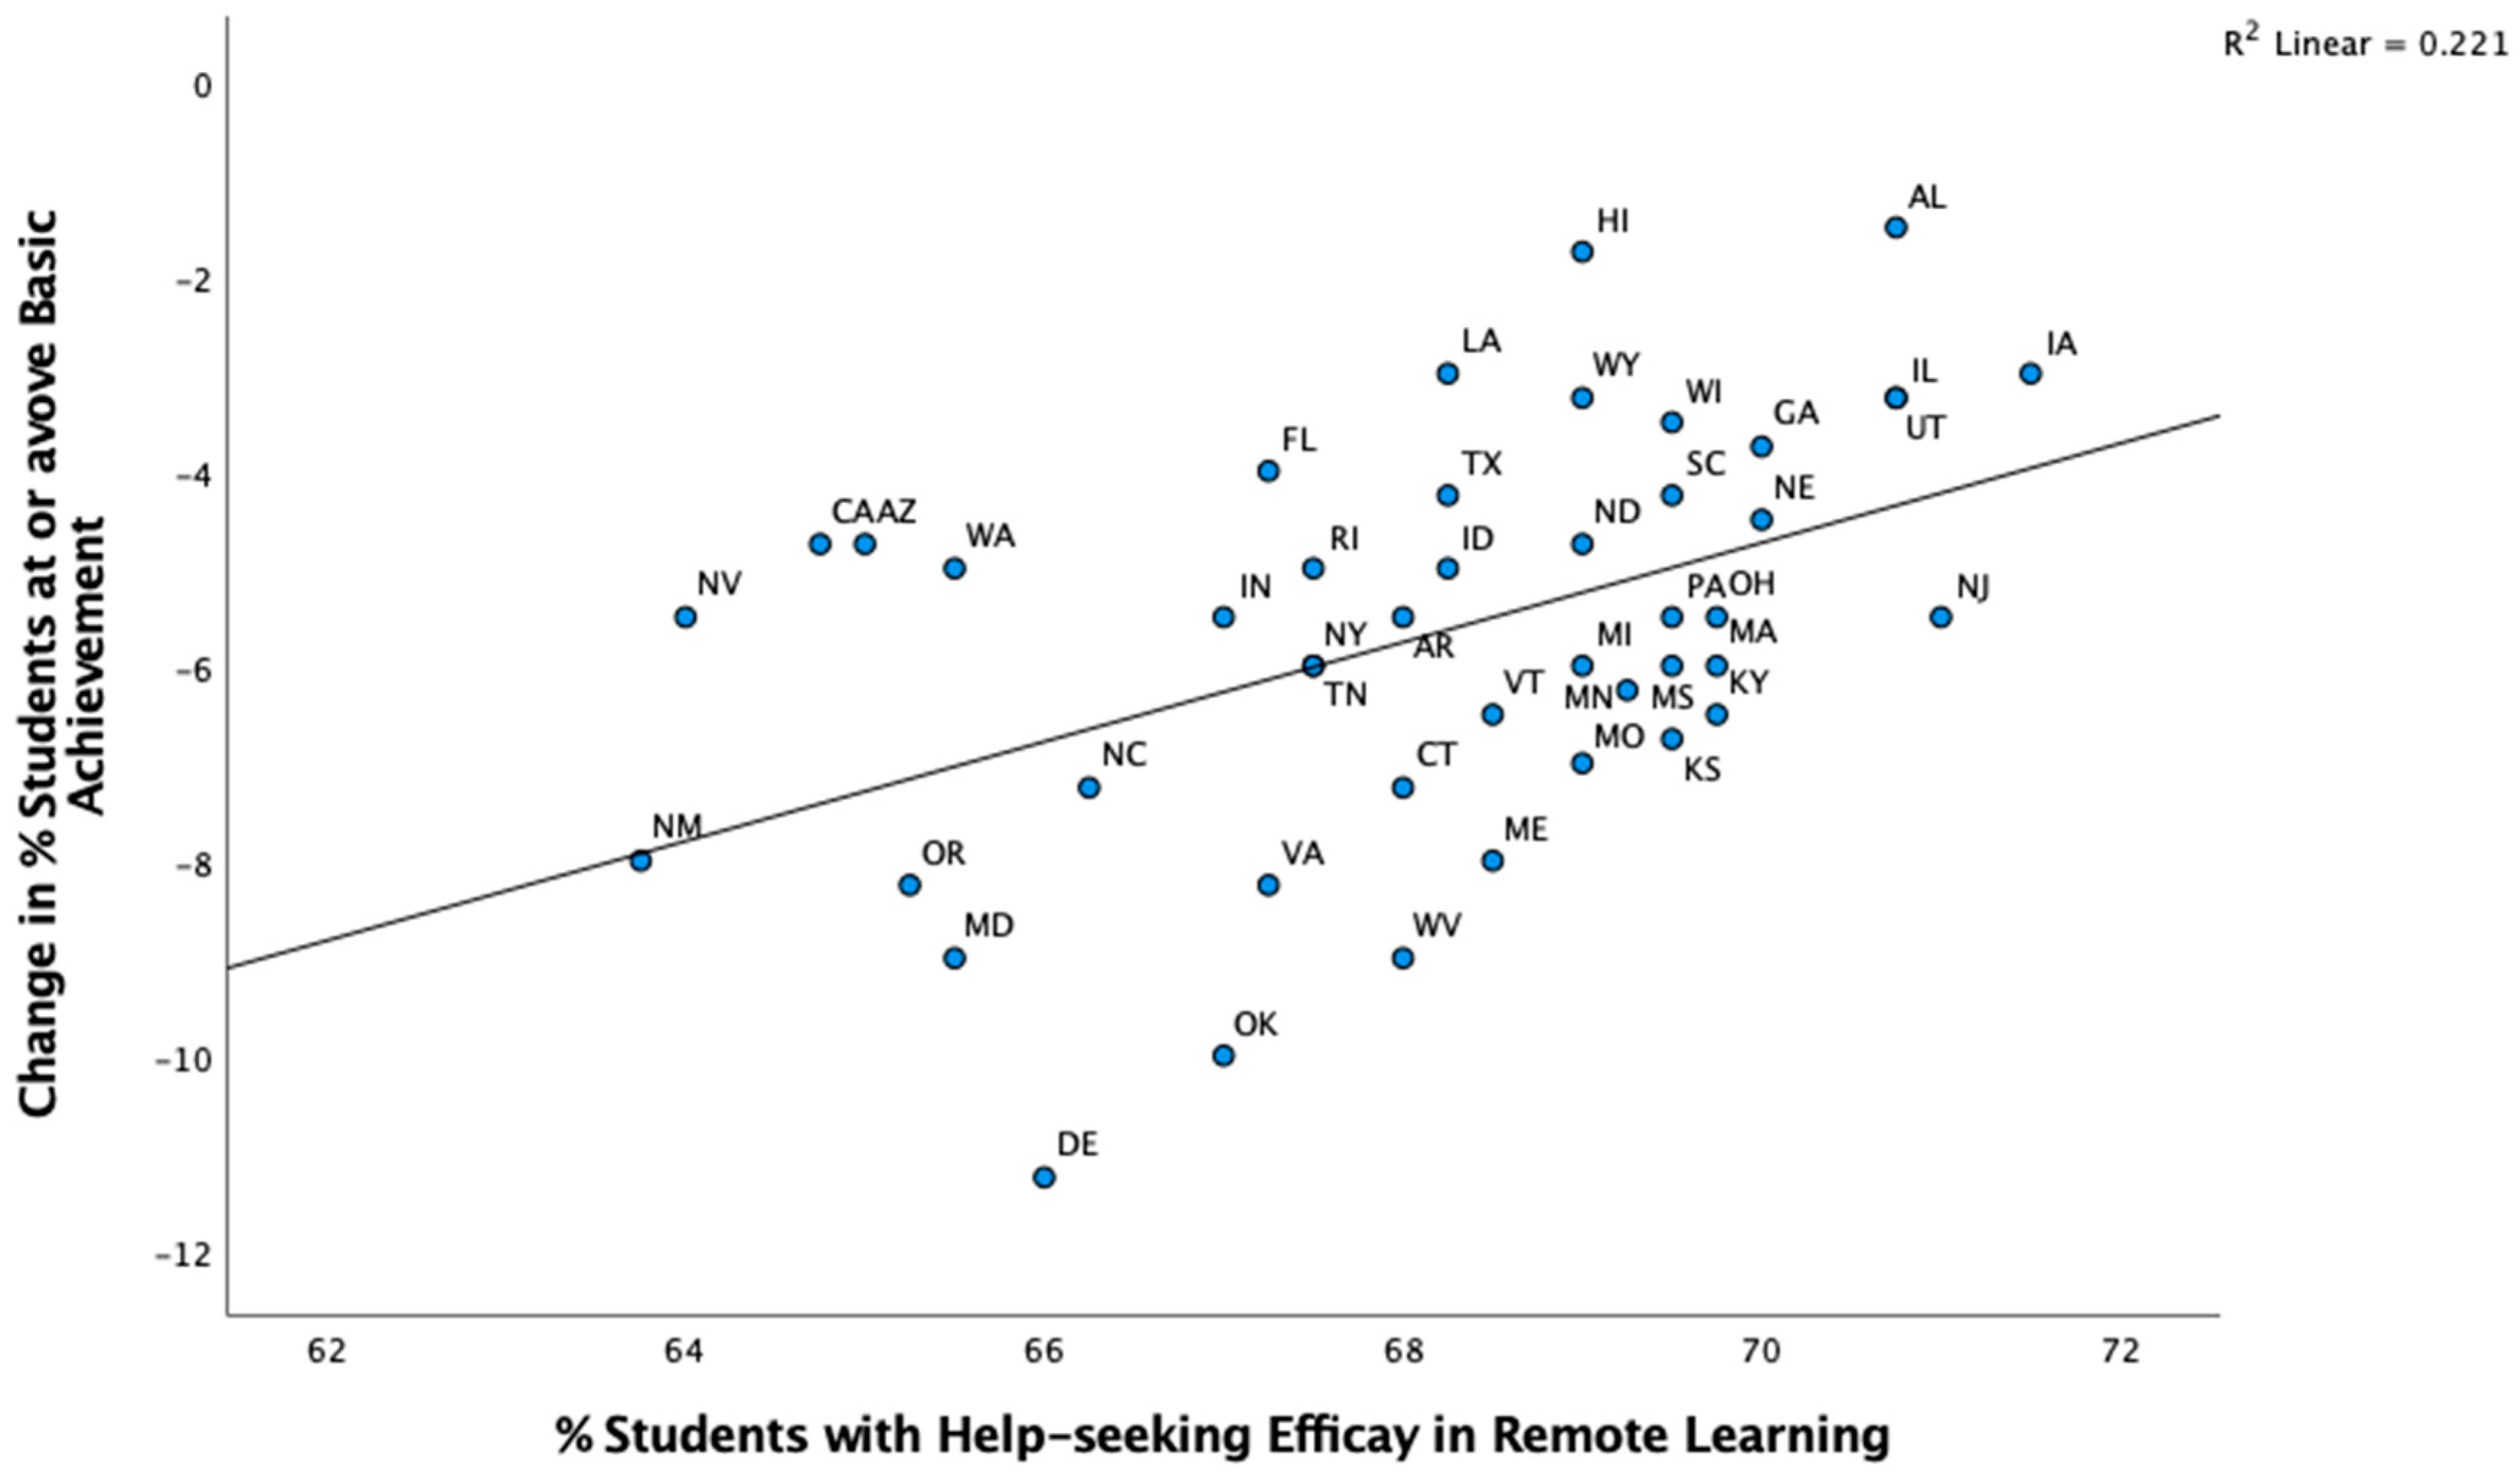
A closer look into the NAEP 2022 student survey data revealed specific conditions and effects of the remote learning environment (Table 1). Regression analyses revealed significant predictors of the NAEP 2019–2022 reading and math achievement trends at the state level. While some psychosocial factors (i.e., self-efficacy in help-seeking and online search, and experience of remote learning difficulty) mattered, remote learning resources (internet access, digital devices, and teacher availability) did not predict the results. As shown in Figure 3, student-reported self-efficacy in seeking help for remote learning was positively associated with achievement trends (b = 0.47 without covariates; b = 0.65 with covariates); a one standard deviation unit increase (i.e., a 2-percentage point gain) in statewide students’ self-efficacy in help-seeking is associated with up to a two-thirds standard deviation unit decrease (i.e., a 1.5-percentage point loss) in state average reading and math achievement outcomes.

Figure 3.
Scatterplot of academic achievement losses vs. remote learning help-seeking efficacy levels (N = 44 U.S. states).
Similarly, student-reported self-efficacy in searching online resources for remote learning was positively associated with achievement trends (b = 0.32). Conversely, student-reported remote learning difficulty had a negative association with achievement gain scores (b = −0.28). The NAEP survey student-reported remote learning difficulty was positively associated with its corresponding remote learning enrollment rates across grades and subjects (r = 0.49 for grade 4 reading, r = 0.48 for grade 4 math, r = 0.22 for grade 8 reading, r = 0.28 for grade 8 math).
4.4. Case Study
The case of four selected states illustrates the cross-state variations in learning environments and outcomes during the pandemic (see Table 3). Iowa (Midwest) and Florida (South) exemplify states with relatively lower remote learning rates and smaller academic learning losses, whereas Delaware (South) and New Mexico (West) represent states with relatively higher remote learning rates and larger academic learning losses.
Table 3.
Case study profiles: states’ remote learning policy environment and outcomes during the pandemic.
Following the distinction of political cultures, Delaware and New Mexico were examples of Blue states, where pro-labor and collectivistic welfare values were dominant. In contrast, Iowa (Midwest) and Florida (South) were examples of Red states, where pro-business and individualistic freedom values were prioritized. Consequently, reliance on remote learning was heavier due to statewide health safety and school closure orders issued by Democratic policy leaders, whereas constraints on remote learning were imposed through full or partial school reopening orders issued by their Republican policy leaders.
As shown in Table 3, these four states have very similar levels of high-speed internet access and teacher availability for remote learning. What really separates them is the degree of remote learning enrollment rates and, to a lesser degree, the level of students’ self-efficacy in seeking remote learning help. According to the national survey results, Florida had relatively lower remote learning enrollment rates (29%) in the earlier stage of the pandemic (spring 2021); the national average was 60%. While only half of the students had adequate remote learning support such as high-speed internet access (48%) and teacher availability (57%), Florida students’ self-efficacy in remote learning help-seeking reached 67%. The state’s average NAEP reading and math test results recorded a four-point drop between 2019 and 2022 in the percentage of grades 4 and 8 students at or above the basic achievement level. Similarly, Iowa had very low remote learning enrollment rates (26%). The state had limited high-speed internet access (55%) and teacher availability (59%), but students’ self-efficacy in help-seeking for remote learning (72%) was in better shape. Iowa managed better than most other states in terms of students’ academic learning losses (3 points).
In contrast, New Mexico students’ enrollment in remote learning during spring 2021 was much higher (63%). In addition to the state’s modest levels of internet access (45%) and teacher availability (59%), students’ help-seeking efficacy (58%) was significantly lower than the national average (68%). The state’s average NAEP reading and math achievement losses among grades 4 and 8 students between 2019 and 2022 were 8 points. Even worse, Delaware students’ enrollment in remote learning was almost universal (95%). The state’s average NAEP basic achievement level losses among grades 4 and 8 students between 2019 and 2022 were 11 points, three times higher than Florida’s. However, the state’s levels of internet access (51%), teacher availability (59%), and students’ help-seeking efficacy (66%) were similar to those in Florida.
Florida’s relative success in pandemic-induced learning damage control is attributable to the statewide school closure/reopening policy minimizing their reliance on remote learning as well as the school system’s readiness for remote learning (Doherty et al., 2020). While the Florida governor pressured schools to reopen for in-person instruction in fall 2021, New Mexico still had partial school closures ordered. Florida has already had a statewide virtual school program, developed in response to frequent hurricanes. Even when the pandemic first shut down schools in the spring of 2020, the state used a student attendance information system to quickly identify students who lacked technology for virtual education (O’Brien, 2020).
There were also differences in state-administered allocations of CRF-eligible spending (National Conference of State Legislators, 2021). Florida allocated 2.5 billion dollars (out of a total of USD 5.9 billion) to its education department for P-16 education support (e.g., school closures and reopenings). This CRF spending record (42 %) indicates a strong priority and commitment to public education. Iowa allocated USD 64 million of the CARES Act fund to expand access to tele-work, tele-health, and tele-learning through broadband expansion and IT upgrades (https://www.kcrg.com/2020/05/29/how-iowa-is-allocating-its-125-billion-coronavirus-relief-fund/ (Accessed on 1 December 2024)). This accounts for 6 percent of its total CRF spending (USD 1.25 billion). In contrast, New Mexico did not allocate any targeted or earmarked funding for remote education technology support purposes; it is likely that some of the state’s block grant funding to local governments included local school support for remote learning accommodations, but it is left to the leeway of local government policy decisions. Delaware allocated about USD 20 million for broadband infrastructure, including funds to cover equipment installation and broadband service for students from low-income households across the state for remote or hybrid learning purposes (see https://news.delaware.gov/2020/08/24/governor-carney-announces-20-million-for-broadband-infrastructure/ (Accessed on 1 December 2024)). This only accounts for less than 2 percent of its total CRF spending (USD 1.05 billion).
5. Discussion
5.1. Summary of the Key Results
It turns out that academic achievement losses in reading and math were prevalent but highly unequal among the 50 states in the U.S. Those states, particularly in the Northeast and West regions, which adopted more stringent school closure/reopening policies, had more student enrollment in remote instruction, which in turn led to relatively larger achievement losses. This finding suggests that school closures and the instructional mode switch from in-person to remote learning were partly responsible for the achievement losses. Beyond state-wide remote learning policy differences, this study also reveals mixed results on the effects of pandemic-induced remote learning conditions. Even with the government’s pandemic relief funding, it turns out that remote learning resources (i.e., technology access at home and teacher availability) varied among the states, but they did not help mitigate academic achievement losses. While all states increased emergency school funding with federal CRF support, the support focused on providing technology support rather than building human capacity for effective technology uses. In contrast, it turns out that students’ self-regulated learning capabilities (e.g., students’ self-efficacy in help-seeking and online search) helped reduce remote learning difficulties and achievement losses.
Further, the case studies reveal deep divides in remote learning policies and practices among the U.S. states during the pandemic. While it was inevitable that school closures and remote instruction caused academic achievement losses during the pandemic, some states performed a relatively better job than others at minimizing these losses. The contrast between Red states (Iowa, Florida) and Blue states (Delaware, New Mexico) reveals cross-state policy variations regarding school closures/reopenings and remote learning. This phenomenon reflects increasing political polarization and partisan divides in values (e.g., the priority of individual freedom vs. social equality) in the U.S. (Haidt, 2012). It calls for more balancing acts such as bipartisan policy collaboration for school emergency aid and high-need family support, so that students who are placed in either in-person or remote learning environments can benefit from extra support.
5.2. Limitations
This study has some limitations in drawing causal inferences about the impact of remote learning policies on student achievement trends. While the DID method helps mitigate selection bias and confounding, it is still subject to potential threats to internal validity, including (1) regression to the mean, (2) reverse causality, and (3) omitted variable bias. This study uses several analytical strategies to address those issues. Regarding the regression to the mean threat, it is possible that initially low performers were less likely to experience academic losses than initially high performers. Thus, this study employs a pre-pandemic baseline status as a covariate in the multiple regression model; initial achievement differences between low-performing and high-performing states in 2019 are equalized. Regarding the reverse causality threat, the concern is that states could have changed education policies as a result of achievement outcomes. However, since all states placed a moratorium on their statewide student assessments during the pandemic, it is implausible that students’ reading and math achievement data were readily available for policymakers to influence their education policy actions, at least at the state level. Finally, regarding the threat of omitted variable biases, this study uses a statistical matching technique, considering several key demographic/geographic variables (e.g., race, poverty, region) as covariates in our regression analysis of academic achievement trends. Using these background variables for matching helps meet the assumption of parallel trends that without the pandemic-induced remote learning policy variations, the states would have followed parallel outcome trends (i.e., the same slope of reading and math achievement trend lines). While we control for family background variables that could influence remote learning resources and capacity at home, we acknowledge that there can be unobserved confounders (e.g., parental attitudes about home schooling and engagement for remote learning help). Subsequent research needs to collect and analyze information from parents about remote learning and digital literacy.
5.3. Implications
These results have policy implications for future school investment and accountability in emergency learning circumstances. Given these mixed results—what worked and what did not work during the pandemic—it is crucial for each state and local education system as well as the federal government to revisit the educational emergency response system. School funding and accountability systems need to accommodate pandemic-like emergency responses to ensure high-quality education for all students, regardless of whether education is delivered in the form of in-person, remote, or hybrid learning. While full in-person learning was not an option for most school systems, particularly during the early phase of the pandemic, it remains questionable whether remote instruction was effectively rolled out with considerations of both “capacity” and “risk” factors: online teaching capacity and learner readiness as well as health and safety threats in school buildings and surrounding communities. It is worth noting that there were often trade-offs in states’ pandemic score cards on their economy and education vs. health outcomes; states that adopted more strict measures for public health and safety were able to reduce COVID-19 infection and death rates at the expense of sacrificing their economy and education (McGinn & Crampton, 2021). Remote learning should have been designed and implemented more carefully. It would require using data-informed decision-making and resource allocations—the identification of high-need vs. low-need students (in terms of remote digital learning resources at home as well as students’ self-regulated learning competencies), followed by an instructional triage with blended learning approaches (need-based mixes of in-person and remote learning).
This study also has implications for future research. First, it offers systemic perspectives to examine the cross-state variations in pandemic-induced remote learning policies, practices, and outcomes by linking multiple databases together at the state level. However, these “state-level” aggregated results cannot be extrapolated down to the school and student levels. Future research needs to examine local variations within each state education system. Second, this study focuses on the central tendency, that is, the average trends and outcomes of educational policies. Subsequent study needs to examine the heterogeneity of policy effects among different groups of students within states, including different geographic, racial, and socioeconomic groups. Third, this study has a relatively short time frame to capture the pandemic impacts. For the cross-state comparisons of pre-pandemic vs. post-pandemic student outcomes, it relies on the NAEP 2019 and 2022 reading and math assessments with state-representative samples of students in grades 4 and 8. It is desirable to track subsequent NAEP assessments for the longer-term trends of student learning outcomes.
6. Conclusions
This study reveals huge complexity and variability of the U.S. education system regarding remote learning policies, practices, and outcomes during the COVID-19 pandemic. While learning losses in reading and math were universal across all 50 states, it is noteworthy that some performed better than others, depending on their school closure/reopening policies with varied levels of remote/hybrid instruction. Despite the massive government investments for technology access and support, digital divides hampered equal educational progress. Overall, the government’s funding support, teacher help, and home learning resources did not work well. It implies that school teachers and students did not know how to use the given resources and technologies effectively. In contrast, students’ digital literacy and remote learning self-efficacy such as online search and help-seeking worked for achievement. Further research needs to examine what works to bridge the digital divides in high-need schools through capacity-building and professional training support and to improve digital literacy skills among educators, students, and parents in remote learning environments.
Author Contributions
Conceptualization, J.L.; methodology, J.L.; formal analysis, J.L.; investigation, J.L. and Y.S.S.; writing—original draft preparation, J.L.; writing—review and editing, Y.S.S. All authors have read and agreed to the published version of the manuscript.
Funding
This research received no external funding.
Institutional Review Board Statement
Not applicable.
Informed Consent Statement
Not applicable.
Data Availability Statement
The datasets generated and/or analyzed during the current study are available in the repository, DOI: 10.6084/m9.figshare.24073785. The original data sources that are publicly available include the following: For academic achievement measures, the NAEP 2019 and 2022 datasets are available at http://nces.ed.gov/nationsreportcard (accessed on 1 December 2024). For remote learning enrollment measures, the NAEP School Dashboard is available at https://ies.ed.gov/schoolsurvey/mss-dashboard (accessed on 1 December 2024).
Conflicts of Interest
The authors declare no conflict of interest.
Appendix A. Description of Key Variables, Descriptive Statistics, and Data Sources
Reading Achievement: Change in the percentages of grade 4 and grade 8 students at or above the NAEP reading basic achievement level in each state between 2019 and 2022 (M = −4.42, SD = 2.77 for grade 4; M = −3.88, SD = 2.25 for grade 8). Data source: NAEP 2019 and 2022 state reading assessments.
Math Achievement: Change in the percentages of grade 4 and grade 8 students at or above the NAEP math basic achievement level in each state between 2019 and 2022 (M = −5.94, SD = 3.16 for grade 4; M = −7.84, SD = 2.64 for grade 8). Data source: NAEP 2019 and 2022 state math assessments.
Remote Learning Enrollment: Percentages of grade 4 and grade 8 students enrolled in remote or hybrid (as opposed to in-person) learning instructional delivery modes within each state during Jan–May 2021 (M = 59.03, SD = 26.58). Data source: NAEP school survey 2021.
Remote Learning Environments and Practices: The following set of NAEP student survey items were used to measure remote learning environment and practices in grades 4 and 8 ELA and math during the COVID-19 pandemic period. Data source: NAEP student survey 2022.
Quiet Learning Place at Home: Students’ access to quiet learning place at home is measured by the percentage of students in each state who positively answered the survey with “Yes, all the time” or “Yes, some of the time” (M = 85.62, SD = 2.03).
High-Speed Internet Access at Home: Students’ access to high-speed internet at home is measured by the percentage of students in each state who positively answered the survey with “Yes, all the time” (M = 49.75, SD = 3.96).
Digital Learning Devices at Home: Students’ access to digital/computing devices at home is measured by the percentage of students in each state who gave positive survey responses with “Yes, all the time” or “Yes, some of the time” (M = 91.26, SD = 1.48).
Remote Learning Experience: Student’s experience of remote learning during the last year is measured by the percentage of students in each state who gave an affirmative survey response of “Yes” (M = 65.1, SD = 5.09).
Remote Learning Difficulty: Student’s perceived difficulty of remote learning is measured by the percentage of students in each state who gave negative survey responses with “a lot more difficult” or “somewhat more difficult” (M = 73.30, SD = 2.13).
Online Resources Search Efficacy: Students’ self-efficacy to find online resources for remote learning is measured by the percentage of students in each state who positively answered the survey with “probably can” or “definitely can” (M = 61.00, SD = 1.99).
Remote Learning Help-Seeking Efficacy: Students’ self-efficacy to ask for help in remote learning is measured by the percentage of students in each state who positively answered the survey with “probably can” or “definitely can” (M = 68.19, SD = 1.92).
Remote Learning Teacher Help Availability: Teacher’s availability to help with remote learning is measured by the percentage of students in each state who positively answered the survey with “everyday” or “once/twice a week” (M = 59.16, SD = 3.28).
References
- Azevedo, J. P., Akmal, M., Cloutier, M.-H., Rogers, H., & Wong, Y. N. (2022). Learning losses during COVID-19: Global estimates of an invisible and unequal crisis (Policy Research Working Paper 10218). World Bank Group. [Google Scholar]
- Barnard, L., Lan, W. Y., To, Y. M., Paton, V. O., & Lai, S.-L. (2008). Measuring self-regulation in online and blended learning environments. The Internet and Higher Education, 12(1), 1–6. [Google Scholar] [CrossRef]
- Doherty, T., Guida, V., Quilantan, B., & Wanneh, G. (2020, October 14). Which states had the best pandemic response? Politico. Available online: https://www.politico.com/news/2020/10/14/best-state-responses-to-pandemic-429376 (accessed on 10 January 2023).
- Donnelly, R., & Patrinos, H. A. (2022). Learning loss during COVID-19: An early systematic review. Prospects, 51, 601–609. [Google Scholar] [CrossRef]
- Dorn, E., Hancock, B., Sarakatsannis, J., & Viruleg, E. (2021, July). COVID-19 and education: The lingering effects of unfinished learning. McKinsey & Company Research Report. Available online: https://www.mckinsey.com/industries/education/our-insights/covid-19-and-education-the-lingering-effects-of-unfinished-learning (accessed on 10 January 2023).
- Eder, R. (2020). The remoteness of remote learning: A policy lesson from COVID19. Journal of Interdisciplinary Studies in Education, 9(1), 168–171. [Google Scholar] [CrossRef]
- Ferren, M. (2021). Remote learning and school reopenings: What worked and what didn’t. Center for American Progress Research Report. Available online: https://www.americanprogress.org/wp-content/uploads/2021/06/Remote-Learning-and-School-Reopening.pdf (accessed on 10 January 2023).
- Fisher, P. (2016). The political culture gap: Daniel Elazar’s subculture in contemporary American politics. Journal of Political Science, 44(1), 87–108. [Google Scholar]
- Haidt, J. (2012). The righteous mind: Why good people are divided by politics and religion. Vintage. [Google Scholar]
- Jakubowski, M., Gajderowicz, T., & Wrona, S. (2022). Achievement of secondary school students after pandemic lockdown and structural reforms of education system: Results from ticks 2021 assessment in Warsaw (policy note). Evidence Institute. Available online: https://www.evidin.pl/wp-content/uploads/2022/01/POLICY-NOTE-1-2022-EN.pdf (accessed on 10 January 2023).
- Kendall, J., Colavito, A., & Moller, Z. (2023, January). America’s digital skills divide. Available online: https://www.thirdway.org/report/americas-digital-skills-divide (accessed on 10 January 2023).
- Kuhfeld, M., Tarasawa, B., Johnson, A., Ruzek, E., & Lewis, K. (2020, November). Learning during COVID-19: Initial findings on student’s reading and math achievement and growth. NWEA RESEARCH. Available online: https://www.nwea.org/content/uploads/2020/11/Collaborative-brief-Learning-during-COVID-19.NOV2020.pdf (accessed on 10 January 2023).
- Lee, J. (2004). Evaluating the effectiveness of instructional resource allocation and use: IRT and HLM analysis of NAEP teacher survey and student assessment data. Studies in Educational Evaluation, 30, 175–199. [Google Scholar] [CrossRef]
- Lee, J., Seo, Y., & Faith, M. (2024). Whole-child development losses and racial inequalities during the pandemic: Fallouts of school accountability turnover with remote learning and unprotective community. Creative Education, 15(6), 1043–1071. [Google Scholar] [CrossRef]
- Lewis, K., Kuhfeld, M., Ruzek, E., & McEachin, A. (2021, July). Learning during COVID-19: Reading and math achievement in the 2020-21 school year. NWEA Research Brief. Available online: https://www.nwea.org/content/uploads/2021/07/Learning-during-COVID-19-Reading-and-math-achievement-in-the-2020-2021-school-year.research-brief-1.pdf (accessed on 10 January 2023).
- Martin, A. (2006). A European framework for digital literacy. Digital Kompetanse, 2, 151–161. [Google Scholar] [CrossRef]
- McElrath, K. (2020, August 26). Nearly 93% of households with school-age children report some form of distance learning during COVID-19. U.S. Census Bureau. Available online: https://www.census.gov/library/stories/2020/08/schooling-during-the-covid-19-pandemic.html (accessed on 10 January 2023).
- McGinn, S., & Crampton, L. (2021, December 15). COVID’S deadly trade-offs, by the numbers: How each state has fared in the pandemic. Politico. Available online: https://www.politico.com/interactives/2021/covid-by-the-numbers-how-each-state-fared-on-our-pandemic-scorecard/ (accessed on 10 January 2023).
- Means, B., Toyama, Y., Murphy, R., Bakia, M., & Jones, K. (2010). Evaluation of evidence-based practices in online learning: A meta-analysis and review of online learning studies. U.S. Department of Education.
- Miller, C. C. (2022, October 1). Spending on children surged during the pandemic. It didn’t last. New York Times. Available online: https://www.nytimes.com/2022/10/01/upshot/children-pandemic-spending.html (accessed on 10 January 2023).
- Murnane, R., & Willett, J. (2010). Methods matter: Improving causal inference in educational and social science research. Oxford University Press. [Google Scholar]
- National Conference of State Legislators. (2021). State actions on Coronavirus relief funds. Database. Available online: https://www.ncsl.org/fiscal/state-actions-on-coronavirus-relief-funds (accessed on 10 January 2023).
- Ng, W. (2012). Can we teach digital natives digital literacy? Computers & Education, 59, 1065–1078. [Google Scholar]
- O’Brien, B. (2020, May 12). In one Florida school district, virtual school is not a virtual vacation. Reuters. Available online: https://www.reuters.com/article/us-health-coronavirus-usa-attendance/in-one-florida-school-district-virtual-school-is-not-a-virtual-vacation-idUSKBN22O1KX (accessed on 10 January 2023).
- OECD. (2015). Students, computers and learning: Making the connection. OECD Publishing. [Google Scholar] [CrossRef]
- OECD. (2019). Skills matter: Additional results from the survey of adult skills. OECD Publishing. Available online: https://www.oecd-ilibrary.org/education/skills-matter_1f029d8f-en (accessed on 21 January 2025).
- OECD. (2021). 21st-century readers: Developing literacy skills in a digital world, PISA. OECD Publishing. [Google Scholar] [CrossRef]
- Office for Civil Rights. (2021). Education in a pandemic: The disparate impacts of COVID-19 on America’s students. Available online: https://www2.ed.gov/about/offices/list/ocr/docs/20210608-impacts-of-covid19.pdf (accessed on 10 January 2023).
- Palvia, S., Aeron, P., Gupta, P., Mahapatra, D., Parida, R., Rosner, R., & Sindhi, S. (2018). Online education: Worldwide status, challenges, trends, and implications. Journal of Global Information Technology Management, 21(4), 233–241. [Google Scholar] [CrossRef]
- Patrinos, H. A., Vegas, E., & Carter-Rau, R. (2022). An analysis of COVID-19 student learning loss (Policy Research Working Paper 10033). World Bank Group. [Google Scholar]
- Qayyum, A. (2018). Student help-seeking attitudes and behaviors in a digital era. International Journal of Educational Technology in Higher Education, 15, 17. [Google Scholar] [CrossRef]
- Raudenbush, S. W., Fotiu, R. P., & Cheong, Y. F. (1998). Inequality of access to educational resources: A national report card for eighth-grade math. Educational Evaluation and Policy Analysis, 20, 253–267. [Google Scholar]
- Rickles, J., Garet, M., Neiman, S., & Hodgman, S. (2020, October). Approaches to Remote instruction: How District Responses to the pandemic differed across contexts. American Institute for Research. Available online: https://www.air.org/sites/default/files/COVID-Survey-Approaches-to-Remote-Instruction-FINAL-Oct-2020.pdf (accessed on 10 January 2023).
- Swanson, C. B., & Stevenson, D. L. (2002). Standards-based reform in practice: Evidence on state policy and classroom instruction from the NAEP state assessments. Educational Evaluation and Policy Analysis, 24, 1–27. [Google Scholar] [CrossRef]
- UNICEF. (2021, September). Education disrupted: The second year of the COVID-19 pandemic and school closures. Available online: https://data.unicef.org/resources/education-disrupted/ (accessed on 10 January 2023).
- U.S. Department of Education, National Center for Education Statistics. (2021). Monthly school survey dashboard. Available online: https://ies.ed.gov/schoolsurvey (accessed on 10 January 2023).
- Vegas, E. (2020). School closures, government responses, and learning inequality around the world during COVID-19. Brookings Institution Report. [Google Scholar]
- Verlenden, J. V., Pampati, S., Rasberry, C. N., Liddon, N., Hertz, M., Kilmer, G., Viox, M. H., Lee, S., Cramer, N. K., Barrios, L. C., & Ethier, K. A. (2021). Association of children’s mode of school instruction with child and parent experiences and well-being during the COVID-19 pandemic—COVID experiences survey, United States, October 8–November 13, 2020. Morbidity and Mortality Weekly Report, 70(11), 369–371. Available online: https://www.cdc.gov/mmwr/volumes/70/wr/pdfs/mm7011a1-H.pdf (accessed on 10 January 2023). [PubMed]
- Winne, P. H. (2018). Theorizing and researching levels of processing in self-regulated learning. British Journal of Educational Psychology, 88(1), 9–20. [Google Scholar] [CrossRef] [PubMed]
- World Bank, UNESCO & UNICEF. (2021). The state of the global education crisis: A path to recovery. The World Bank, UNESCO, and UNICEF. Available online: https://documents1.worldbank.org/curated/en/416991638768297704/pdf/The-State-of-the-GlobalEducation-Crisis-A-Path-to-Recovery.pdf (accessed on 10 January 2023).
- Young, J. R. (2020, October 1). Sudden shift to online learning revealed gaps in digital literacy, study finds. EdSurge. Available online: https://www.edsurge.com/news/2020-10-01-sudden-shift-to-online-learning-revealed-gaps-in-digital-literacy-study-finds (accessed on 10 January 2023).
- Zimmerman, B. J. (2008). Investigating self-regulation and motivation: Historical background, methodological developments, and future prospects. American Educational Research Journal, 45(1), 166−183. [Google Scholar] [CrossRef]

Disclaimer/Publisher’s Note: The statements, opinions and data contained in all publications are solely those of the individual author(s) and contributor(s) and not of MDPI and/or the editor(s). MDPI and/or the editor(s) disclaim responsibility for any injury to people or property resulting from any ideas, methods, instructions or products referred to in the content. |
© 2025 by the authors. Licensee MDPI, Basel, Switzerland. This article is an open access article distributed under the terms and conditions of the Creative Commons Attribution (CC BY) license (https://creativecommons.org/licenses/by/4.0/).