Abstract
Early care professionals have to use instruments for assessing functional skills in children susceptible to early intervention that apply records and produce developmental profiles and personalized intervention proposals. The aims of the study were (1) to analyze the development of functional skills in users with an age range of 48–252 months attending school in a therapeutic intervention center for people with motor impairments; and (2) to analyze the development of functional skills in users with different impairments and ages ranging from 7 to 162 months participating in an early outpatient care program. Study 1 applied a sample of 50 users aged between 48 and 252 months all with motor disabilities and Study 2 included a sample of 71 users aged between 7 and 162 months with different disabilities. Factorial and descriptive–correlational designs were applied in both studies. The Student’s t-test for dependent samples, supervised machine learning techniques (linear regression analysis and logarithmic regression analysis), unsupervised machine learning techniques (k-means), ANOVA, and cross-tabulations were used as contrast tests. In Study 1, no significant changes were found in the development of users’ functional skills, except for a decrease in maladaptive behaviors. Likewise, the chronological age variable did not seem to be a determining factor in the results. In Study 2, significant differences were found in the development of all functional skills between the three measurement time points (initial–intermediate–final). In this group, the type of impairment explained 29% and chronological age 40% of the variance in functional development at the final measurement. This study found that intervention before four years old in outpatient mode produced better results in the acquisition of functional skills, with better results in users affected by rare diseases or communication and language delay at ages 49–60 months.
1. Introduction
Early detection and educational intervention in the first years of life are important for enhancing primary prevention or secondary prevention of possible impairments to children’s overall development. As the World Health Organization (WHO) [1] noted, there is a need for well-tested instruments that include reliability and validity indicators, which can be used as a reference for this purpose. The WHO [2] also emphasized that it is essential to ensure early care during the first three years of life, as well as noting the importance of involving health and education professionals along with families in this process. The WHO [1,2] also places special emphasis on interdisciplinary care for children with different conditions. Furthermore, the European Union stresses the importance of early childhood and second childhood care as part of the rights of children and their families, seeking an inclusive approach [3].
This means that the measurement of functional skills is important for children who suffer from some difficulty in their development. Similarly, monitoring the progression of therapeutic intervention programs allows us to check how effective they are in different groups. Measuring functional skills is based on systematic observation and there are many instruments that currently provide guidelines for such observations, such as the Brunet Lézine Scale [4], the Battelle Developmental Inventory [5], and the Pediatric Evaluation Disability Inventory (PEDI) [6]. There are also programs that facilitate therapeutic intervention, such as the original version of the Portage guide [7]. This guide also includes a record for measuring developmental progress from 0 to 6 years in different developmental areas (motor development, cognition, language, self-help, and socialization). Along similar lines, the web application, eEarlyCare combines observational recording in 11 areas of functional development (food autonomy, personal care and hygiene, independently dresses and undresses, sphincter control, functional mobility, communication and language, resolution of tasks in social contexts, interactive and symbolic play, daily routines, adaptative behavior, and attention) with the creation of a personalized development profile and detection of the most affected functional areas. In addition, eEarlyCare includes a personalized intervention program for each user based on the profile findings. This program guides the teacher or therapist on the most accurate personalized therapeutic intervention [8,9,10].
However, few studies have longitudinally analyzed the effectiveness of therapeutic intervention programs in different age groups [11]. Carrying out such studies will provide data on the validity of developmental assessment instruments in different age groups and with different impairments, providing a forecast of the progression of the intervention programs applied. This data will give early care professionals important information, on variables that may be influencing the lifelong development of these groups. This will foreseeably guide professionals on indicators that would enhance users’ and their families’ quality of life. These studies include the work by Ridosh et al. [12], applying the Adolescent/Young Adult Self-Management and Independence Scale -AMIS-II- [13] in users affected by spina bifida; and Amer et al. [14], performing a validation of the PEDI scale in the Ugandan population with children aged 10–22.5 months affected by cerebral palsy and in children with “normalised” development aged 6–90 months. The conclusions are that this type of study helps professionals in clinical and educational practice to have reference data for interpreting results and guiding their therapeutic intervention work.
In order to address these challenges, our research includes two longitudinal studies. The first analyzes the development of functional skills in users with an age range of 48–252 months attending school in a therapeutic intervention center for people with motor impairments. The second analyzes the development of functional skills in users with different impairments and ages ranging from 7 to 162 months participating in an early outpatient care program.
1.1. Study 1
Therapeutic Intervention in Group 1
RQ1. Will there be significant differences in the therapeutic intervention on functional skills between baseline and interim, baseline and endline, and interim and endline measurements?
RQ2. Will the chronological age variable be related to the results of the therapeutic intervention in 11 functional areas (values in the final measurement)?
1.2. Study 2
Therapeutic Intervention in Group 2
RQ1. Will there be significant differences in the therapeutic intervention on functional skills between baseline and interim, baseline and endline, and interim and endline measurements?
RQ2. Will the chronological age variable be related to the results of the therapeutic intervention in 11 functional areas (values in the final measurement)?
RQ3. In the final measurement, will it be possible to find groupings without a pre-assignment variable for the user’s chronological age and type of impairment?
2. Materials and Methods
2.1. Participants
2.1.1. Study 1
Convenience sampling was applied. We worked with a sample of 50 participants (32 boys and 18 girls) aged between 48 and 252 months who attended school in a specific care center for people with motor impairments in Castilla y León (Spain). Table 1 shows a breakdown of the sample by the variables of chronological age and gender. The care applied a therapeutic intervention model in a specific center. Each intervention involved three individual sessions per week. During the study, there was one experimental death of a user.

Table 1.
Disaggregation of the sample from Group 1.
2.1.2. Study 2
Convenience sampling was applied, with an initial sample of 79 users aged 7–162 months. However, the three measurements were only completed by 71 users (43 male and 28 female; type of impairment: 1 = motor disability, n = 11; 2 = prematurity, n = 9; 3 = maturational delay, n = 13; 4 = rare disease, n = 12; 5 = communication and language delay, n = 21; 6 = autistic spectrum disorder, n = 5). Table 2 shows a disaggregation of the sample by the variables chronological age range and gender. We worked with users who were cared for using an outpatient therapeutic intervention model in their homes. Each intervention involved three individual sessions per week.

Table 2.
Disaggregation of the sample from Group 2.
2.2. Instruments
- (a)
- SFA (Scale for the measurement of functional abilities in children aged 0–6 years old) [15]. The Scale contains 114 items that are distributed in 11 functional development areas (food autonomy, personal care and hygiene, independently dresses and undresses, sphincter control, functional mobility, communication and language, resolution of tasks in social contexts, interactive and symbolic play, daily routines, adaptative behavior, and attention) which in turn are subdivided into sub-areas and measured on a Likert type scale from 1 to 5. The SFA was developed with reference to the “Portage Guide to Early Education” [7], “Scale of psychomotor development of early childhood (Brunet-Lézine-Revised)” [4], “Battelle Developmental Inventory” [5], and “The Pediatric Evaluation of Disability Inventory” [6]. This instrument has a Cronbach’s alpha reliability index of α = 0.98 and an Omega index of Ω = 0.99. Likewise, in Study 1 an α = 0.97 and an Ω = 0.99 were found, and in Study 2 an α = 0.98 and an Ω = 0.98 was found. Table 3 presents the areas of functional development, the acronym, the number of items, and the maximum score.
 Table 3. Description of the SFA functional areas and maximum scores.
 - (b)
- eEarlyCare software v.3 [10]. This is a web application in which the SFA scale is implemented. This application facilitates obtaining an individualized functional development profile in the 11 areas of functional development. Likewise, each profile obtained provides personalized intervention proposals in each functional area adjusted to the needs of each user. An example of both can be seen in Figure 1 and Figure 2.
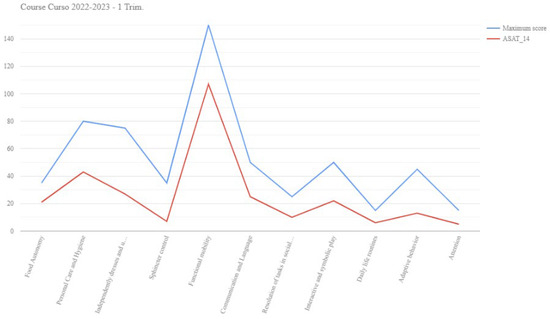 Figure 1. Customized development profile obtained with the eEarlyCare-T web application.
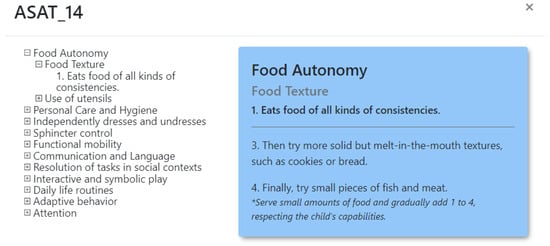 Figure 2. Personalized early care program obtained with the eEarlyCare-T web application.
2.3. Procedure
Prior to the development of the study, positive reports were obtained from the Bioethics Committee of the University of Burgos No. IR 09/2020 (work with children and their families) and No. IO 04/2022 (work with early care professionals). Next, work was carried out in a care center for people with motor and developmental impairments. Prior to the start of the study, the families of the users were informed of the objectives and signed the written informed consent form. Two care programs are implemented in this center, one aimed at people with motor impairments aged between 48 and 252 months who attend school. The other program is aimed at children with developmental disabilities aged between 7 and 162 months. The therapeutic intervention is outpatient at home. Both interventions were carried out with a frequency of three sessions per week. Prior to the development of the therapeutic interventions, an initial assessment was carried out using the SFA [15]. This scale was included in the eEarlyCare web application. Next, a personalized development profile was obtained for each user, detecting the areas with the greatest impairment. Subsequently, a personalized therapeutic intervention program for each user was obtained from the eEarlyCare web application and implemented over a three-month period. At the end of the quarter, a second measurement of functional development was carried out and a second profile and a new intervention program proposal were obtained and implemented during the second quarter. At the end of the second trimester, a new assessment of functional development was carried out and a third profile and a new intervention program proposal were obtained. This was implemented during the third trimester. In summary, the intervention time for functional development lasted 9 months. Figure 3 shows an outline of the procedure followed.
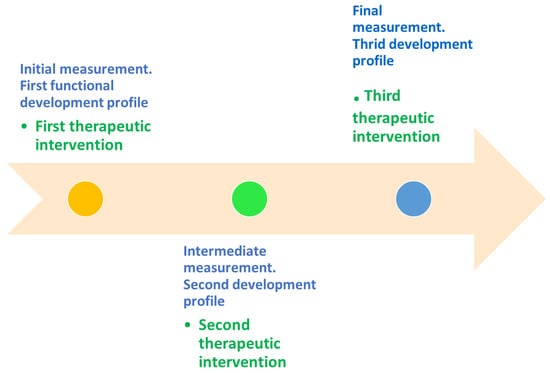
Figure 3.
Procedure followed in this study.
2.4. Data Analysis
Before addressing the research questions, the data were examined for normality. For normal distributions, given that n = 50 and n = 71, parametric tests would be applied to test the hypotheses, otherwise non-parametric tests would be applied. The statistical software SPSS v.28 [16] and the data mining software Orange v.3.35.0 [17] were used to perform the analyses.
3. Results
3.1. Preliminary Analysis
Before testing the research questions, the sample distribution of the results of the initial measurement in the SFA was examined by calculating values of skewness and kurtosis. As Table 4 and Table 5 show, no extreme values of skewness or kurtosis were found in any of the groups (according to Bandalos and Finney [18], extreme values of skewness are considered to be greater than |2| and kurtosis between |8| and |20|). Based on these results, parametric statistics were applied to test the RQs in both studies.

Table 4.
Analysis of skewness and kurtosis in Group 1.

Table 5.
Analysis of skewness and kurtosis in Group 2.
In addition, Table 6 presents the tests that were applied to test each of the research questions in Study 1 and Study 2.

Table 6.
Tests to test the research questions in the two studies.
3.2. Analysis to Test the RQs
3.2.1. Study 1
Testing RQ1 (Will there be significant differences in the therapeutic intervention on functional skills between baseline and interim, baseline and endline, and interim and endline measurements?), no significant differences were found in development in the functional areas between measures 1 and 2, 1 and 3, and 2 and 3, except in AB_T, which analyses adaptive behaviors, between measure 1 and measure 3. This difference indicates a lower incidence of maladaptive behaviors, as higher scores indicate a higher incidence of maladaptive behaviors, and lower scores indicate a lower incidence or absence of behavioral disturbances (see Table A1).
To test RQ2 (Will the chronological age variable be related to the results of the therapeutic intervention in 11 functional areas (values in the final measurement)?), a linear regression analysis was applied to examine whether the chronological age variable predicted developmental outcomes in the functional areas in each measurement (initial, intermediate, and final). The variance explained by the chronological age variable in the three measurements was 25%, 22%, and 28%, respectively, and not significant in each case (see Table 7).

Table 7.
Multiple correlation coefficient and significance with respect to the chronological age variable in the prediction of functional development in the three measurements (initial, intermediate, and final) in Group 1.
3.2.2. Study 2
In Study 2, testing RQ1 (Will there be significant differences in the therapeutic intervention on functional skills between baseline and interim, baseline and endline, and interim and endline measurements?), there were significant differences between measurements 1 and 2 in all functional areas except FM_T, with the second measurement indicating improvement. Significant differences were also found between measurements 1 and 3 in all functional areas and between measurements 2 and 3 in all functional abilities. It is important to note that in functional area AB_T, the first measure was higher in all cases, which is a positive result, as it indicates that disruptive behaviors decreased at measurement 2 and measurement 3 compared to measurement 1 (a lower score indicates that disruptive behaviors do not occur) (see Table A2). Linear regression analysis was applied to address RQ2 (Will the chronological age variable be related to the results of the therapeutic intervention in 11 functional areas (values in the final measurement)?) and check whether the variable “chronological age” predicted developmental outcomes in the functional areas at each time of measurement (initial, intermediate, and final). The variance explained in the three measurements was 32%, 32%, and 40%, respectively, and in all cases, these values were significant, with the final measurement being higher (see Table 8).

Table 8.
Multiple correlation coefficient and significance with respect to the chronological age variable in the prediction of functional development in the three measurements (initial, intermediate, and final) in Group 2.
In addition, as the participants in Study 2 had more than one impairment, a linear regression analysis was performed to determine whether the variable “type of impairment” predicted developmental outcomes in the functional areas at each measurement. The variance explained by the variable “type of impairment” at the three measurements was, 20%, 27%, and 29%, respectively, and was only significant in the last measurement (see Table 9).

Table 9.
Multiple correlation coefficient and significance with respect to the type of impairment variable in the prediction of functional development at the three measurements (initial, intermediate, and final) in Group 2.
As the regression analysis was significant in the final measurement, a logarithmic regression analysis was performed on the SFA results for the two independent variables “chronological age” and “type of impairment”. In both cases, no significant differences were found (F = 0.05, p = 0.83; F = 0.23, p = 0.63). However, as Figure 4 shows, there are distinct logarithmic trends in FAT_T, CL_T, ISP_T, and AT_T.
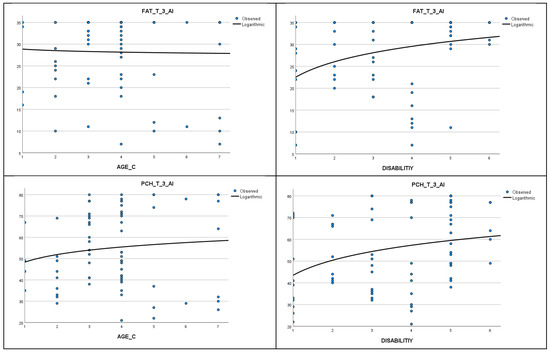
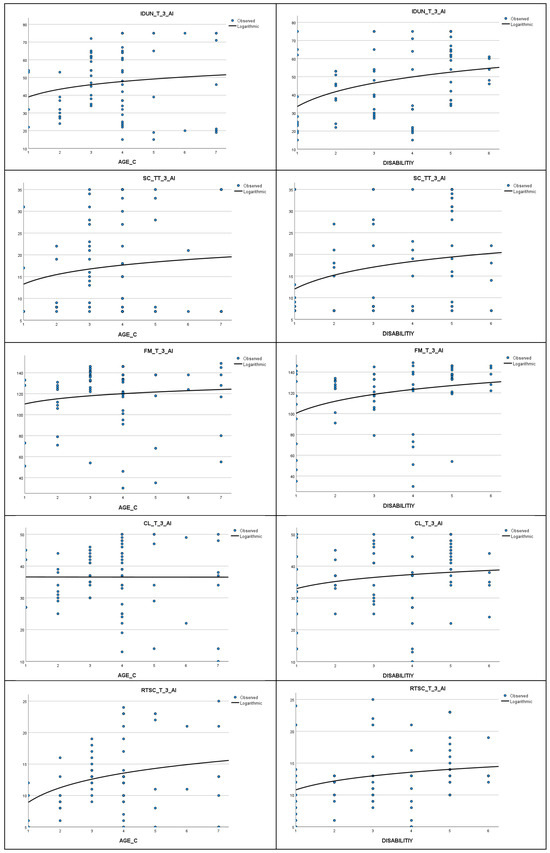
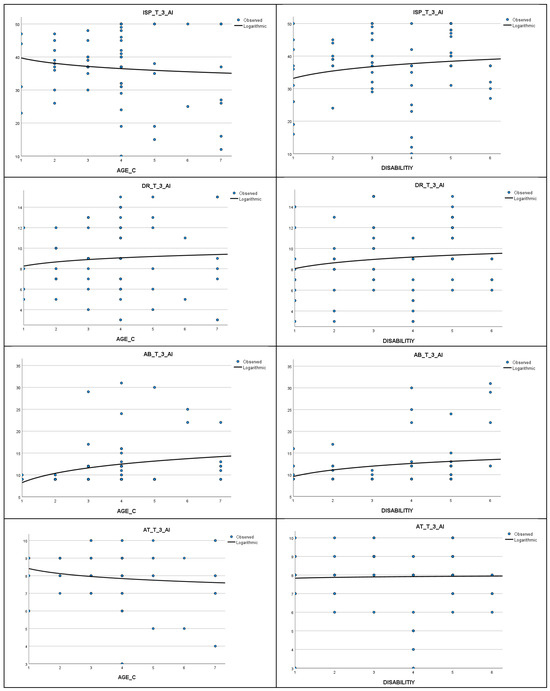
Figure 4.
Logarithmic regression of functional skills on the variables chronological age and type of impairment in Group 2 users.
To test RQ3 (In the final measurement, will it be possible to find groupings without a pre-assignment variable for the user’s chronological age and type of impairment?), a cluster analysis was carried out using the k-means algorithm on the data from the third measurement. Three clusters were found, and significant differences were found in the ANOVA between them in all functional skills except AB_T_3 (see Table 10). Next, a cross-tabulation was performed between the assignment cluster and the chronological age interval variable (see Table 11). A third (33.8%) of the users belonged to cluster 1 and 50.7% to cluster 3. These clusters had the highest scores in the areas of functional development. In cluster 1, 29.2% of the assigned users were in age range 3 (ages 25–36 months) and in cluster 3, 44.4% of the users were in age range 5 (ages 49–60 months) (see Table 10). The contingency index was C = 0.48, p = 0.2. Finally, a cross-tabulation was performed between each user’s assigned cluster and the type of impairment. In cluster 1, 45.8% of the assigned users belonged to condition 4 (rare disease), whereas in cluster 3, 36.1% of assigned users belonged to condition 4 (rare disease) and 36.1% to condition 5 (communication and language delay) (see Table 12), a contingency index of C = 0.47, p = 0.08 was calculated.

Table 10.
Final cluster centers and ANOVA.

Table 11.
Cross-tabulation between the assigned cluster and the chronological age interval variable.

Table 12.
Cross-tabulation between the assigned cluster and the type of impairment.
Figure 5 shows the distribution of clusters with respect to functional ability scores on the variables chronological age and type of impairment in Group 2.
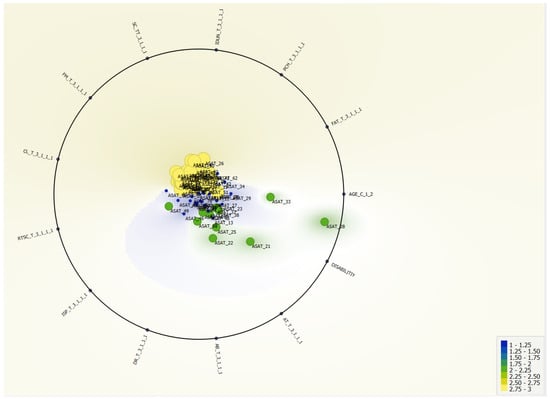
Figure 5.
Distribution of users in Group 2 with respect to the three clusters found in the SFA functional development scores in the final measurement.
4. Discussion
With respect to the schooled participants aged between 48 and 252 months of chronological age, all of them were diagnosed with motor impairments, and no significant changes were detected between assessment initial–intermediate (1–2), initial–final (1–3) and intermediate–final (2–3), except for an improvement in skills related to the reduction in adaptive behaviors. Likewise, chronological age in this group did not prove to be a significant variable in explaining the variance in the development of functional skills.
For participants who received outpatient care at home aged 7–162 months and with different impairments, significant differences in functional development were found between measurement initial–intermediate (1–2) and between measurement initial–final (1–3), and between measurement intermediate–final (2–3). In this case, the variable “chronological age” explained 32% of the variance in the development of functional skills in measurement 1 and measurement 2 and 40% in measurement 3. Likewise, the variable “type of impairment” explained 29% of the variance in functional development in measurement 3. Also, the “type of impairment” seems to be related to a better prognosis of the therapeutic intervention in rare diseases and communication and language delay impairments.
In summary, early detection of various early childhood impairments is essential to initiate therapeutic intervention programs as early as possible [1]. This study has found that the results of therapeutic intervention vary depending on the age of onset. In addition, the development of outpatient intervention programs has been shown to be very useful. In this intervention model, significant differences were found between all measurements taken on a quarterly basis. Therefore, it can be concluded that longitudinal monitoring of development at early ages provides relevant information on the evolution of users with different impairments. In this study, differences were specifically found in impairments related to users with rare diseases (in this study we worked with users affected by Coffin–Siris, Prader–Willi, LAMA II, West, Beuren, Mucopolysaccharidosis, Encephalopathy, Schaaf–Yang, and KBG) or communication and language delay. It seems therefore that the personalization of the intervention through the use of web applications that facilitate registration and learning analytics in real time has an important weight for the monitoring that therapists carry out of the development as well as in the personalized proposal of therapeutic intervention programs [8,9,10]. This makes it easier for the intervention to be as personalized as possible, which increases the effectiveness of the treatment, especially at ages 0–60 months. It is also important to note that this type of longitudinal study provides a large volume of data. This functionality makes it easier to find reliability and validity indicators for the instruments applied and also to be able to use supervised (prediction) and unsupervised (clustering) machine learning techniques. These techniques enhance the precision of therapeutic intervention programs. All of this is expected to help improve the quality of life of users and families [11,12,14].
Limitations and Future Lines of Research
The limitations of this study are related to the choice of the sample, convenience sampling was applied, and we worked with users from a specific center. However, conducting longitudinal studies is complex, and obtaining large samples in different settings and locations is an added difficulty. Therefore, although the results of this work are not generalizable, they can provide guidance to early care researchers with respect to the web-based tools used, such as machine learning techniques. The use of these techniques helps to improve the accuracy of diagnosis and intervention at early ages. However, future work will expand on the diversity of the sample’s origin. It will also address whether there are significant differences between the improvement of functional development in users with different types of rare diseases. The scope of the work is limited to an educational center in Spain. In future studies, the inclusion of other centers will be considered in order to reinforce and improve the results and conclusions obtained.
5. Conclusions
The use of the web applications such as eEarlyCare has been shown to be a promising tool for recording functional development and obtaining personalized educational intervention programs and profiles. The development of such tools that include a learning analytics system facilitates real-time data analysis and is very useful for early-care professionals. Furthermore, the use of supervised and unsupervised learning techniques in data analysis provides the practitioner with predictive and grouping data. All these advantages are expected to increase the accuracy of intervention by professionals and the quality of life of affected children and their families.
In sum, the development of computer applications containing real-time data analysis systems that are easy to use for special education and early childhood professionals needs to be promoted by those in charge of educational administrations. The inclusion of technological advances and artificial intelligence in the field of special education is essential for its progress in the 21st century. Further research in this line of work is also needed.
6. Patents
The web application “eEarly Care Therapeutic Intervention Program” is registered in the General Intellectual Property Registry (Registro General de la Propiedad Intelectual) in the Spanish Ministry of Culture and Sports, Number NºR 00/2021/1174. Exploitation rights are held by the University of Burgos. The application can be used under a license agreement with the University of Burgos.
Author Contributions
Conceptualization, M.C.S.-M., R.M.-S. and M.C.E.-L.; methodology, M.C.S.-M. and R.M.-S.; software, M.C.S.-M. and R.M.-S.; validation, M.C.S.-M. and R.M.-S.; formal analysis, M.C.S.-M. and R.M.-S.; investigation, M.C.S.-M., R.M.-S., M.C.E.-L. and R.V.-S.; resources, M.C.S.-M.; data curation, M.C.S.-M.; writing—original draft preparation, M.C.S.-M. and R.M.-S.; writing—review and editing, M.C.S.-M., R.M.-S., M.C.E.-L. and R.V.-S.; visualization, M.C.S.-M. and R.M.-S.; supervision, M.C.S.-M., R.M.-S. and M.C.E.-L.; project administration, M.C.S.-M.; funding acquisition, M.C.S.-M., R.M.-S. and M.C.E.-L. All authors have read and agreed to the published version of the manuscript.
Funding
This research was part of the project “Specialized and updated training on supporting advance technologies for early childhood education and care professionals and graduates” (eEarlyCare-T, project number 2021-1-ES01-KA220-SCH-000032661), funded by the European Commission.
Institutional Review Board Statement
This study has been carried out under the umbrella of the Ethics Committee of the University of Burgos No. IR 09/2020, regarding work with children and their families, and report No. IO 04/2022 regarding work with early care professionals.
Informed Consent Statement
The guardians or legal representatives of the participants in this study were informed of the objectives of the study and gave their informed consent to those responsible for the ASPACE SALAMANCA center.
Data Availability Statement
Data will be made available upon request of the researchers and signature of responsible use and privacy due to ethical reasons.
Acknowledgments
To the professionals of the ASPACE SALAMANCA center (Spain) and to the participants and their families. To the funding of the project “Specialized and updated training on supporting advance technologies for early childhood education and care professionals and graduates”, one of the objectives of which is to update the training of practicing professionals in the field of early childhood care.
Conflicts of Interest
The eEarlyCare-T web application currently belongs to the University of Burgos. However, interested researchers will be able to use the application free of charge after authentication of their affiliation and after a collaboration agreement between the institution to which they belong and the University of Burgos.
Appendix A

Table A1.
t-tests for differences in means for related samples between the three measurements in Group 1.
Table A1.
t-tests for differences in means for related samples between the three measurements in Group 1.
| Functional Areas | M 1 M (SD) | M 2 M (SD) | M 3 M (SD) | t1–2 | p1–2 | d1–2 | Hedges Correction | t1–3 | p1–3 | d1–3 | Hedges Correction | t2–3 | p2–3 | d2–3 | Hedges Correction |
|---|---|---|---|---|---|---|---|---|---|---|---|---|---|---|---|
| n = 49 | n = 49 | n = 49 | |||||||||||||
| FA_T | 15.15 (10.04) | 15.98 (11.20) | 16.33 (10.12) | −0.44 | 0.33 | 13.30 | 13.41 | −1.43 | 0.08 | 5.79 | 5.84 | −0.19 | 0.43 | 13.29 | 13.39 |
| PCH_T | 31.31 (19.96) | 29.05 (18.47) | 30.51 (19.97) | 0.79 | 0.22 | 20.02 | 20.18 | 0.41 | 0.35 | 14.10 | 14.17 | −0.52 | 0.30 | 19.80 | 19.96 |
| IDUN_T | 29.20 (18.47) | 27.33 (14.94) | 27.26 (17.16) | 0.70 | 0.24 | 18.59 | 18.74 | 1.29 | 0.10 | 10.44 | 10.63 | 0.02 | 0.49 | 19.25 | 19.40 |
| SC_TT | 12.80 (7.99) | 20.78 (11.40) | 11.80 (7.88) | −4.11 | 0.001 * | 13.60 | 13.71 | 1.10 | 0.14 | 6.35 | 6.40 | 0.65 | 0.26 | 9.39 | 9.46 |
| FM_T | 71.37 (43.02) | 66.00 (36.17) | 66.67 (40.79) | 0.79 | 0.22 | 47.78 | 48.15 | 0.80 | 0.22 | 41.61 | 41.94 | −0.12 | 0.45 | 40.11 | 40.43 |
| CL_T | 21.76 (15.63) | 23.55 (14.75) | 24.20 (14.77) | −0.78 | 0.22 | 16.10 | 16.22 | −1.15 | 0.13 | 14.87 | 14.99 | −0.32 | 0.38 | 14.62 | 14.74 |
| RTSC_T | 10.57 (6.10) | 11.04 (6.05) | 10.86 (5.86) | −0.51 | 0.31 | 6.58 | 6.63 | −0.96 | 0.17 | 2.17 | 2.18 | −7.01 | 0.001 * | 10.56 | 10.64 |
| ISP_T | 19.77 (11.48) | 20.78 (11.40) | 21.61 (10.73) | −0.48 | 0.32 | 14.92 | 15.03 | −1.16 | 0.13 | 11.08 | 11.17 | −0.53 | 0.30 | 10.95 | 11.05 |
| DR_T | 5.62 (2.95) | 5.29 (2.40) | 5.97 (2.92) | 0.63 | 0.27 | 3.70 | 3.73 | −1.11 | 0.14 | 2.23 | 2.24 | −1.27 | 0.11 | 3.79 | 3.82 |
| AB_T | 15.71 (8.04) | 14.97 (8.16) | 13.09 (7.85) | 0.48 | 0.32 | 10.81 | 10.89 | 2.54 | 0.007 * | 7.24 | 7.30 | 1.21 | 0.12 | 10.89 | 10.97 |
| AT_T | 5.03 (2.11) | 5.22 (1.92) | 5.23 (1.80) | −0.53 | 0.30 | 2.49 | 2.51 | −0.67 | 0.25 | 2.10 | 2.11 | −0.04 | 0.49 | 2.23 | 2.25 |
Note. * p < 0.05; M 1 = measurement 1; M 2 = measurement 2; M 3 = measurement 3; FA_T = food autonomy; PCH_T = personal care and hygiene; IDUN_T = independently dress and undresses; SC_TT = sphincter control; FM_T = functional mobility; CL_T = communication and language; RTSC_T = resolution of tasks in social contexts; ISP_T = interactive and symbolic play; DR_T = daily routines; AB_T = adaptative behavior; AT_T = attention; M = mean; SD = standard deviation; d = Cohen’s d (>0.20 no effect, 0.21–0.49 small effect, 0.50–0.70 medium effect, <0.70 large effect).

Table A2.
t-tests for differences in means for related samples between the three measurements in Group 2.
Table A2.
t-tests for differences in means for related samples between the three measurements in Group 2.
| Functional Areas | M 1 | M 2 | M 3 | t1–2 | p1–2 | d1–2 | Hedges Correction | t1–3 | p1–3 | d1–3 | Hedges Correction | t2–3 | p2–3 | d2–3 | Hedges Correction |
|---|---|---|---|---|---|---|---|---|---|---|---|---|---|---|---|
| M (SD) n = 71 | M (SD) n = 71 | M (SD) n = 71 | |||||||||||||
| FA_T | 22.59 (9.98) | 24.59 (9.41) | 28.24 (8.78) | −2.96 | 0.002 * | 5.65 | 5.68 | −7.10 | 0.001 * | 6.50 | 6.54 | −5.86 | 0.001 * | 5.08 | 5.11 |
| PCH_T | 46.06 (18.72) | 50.46 (19.32) | 54.69 (18.12) | −4.28 | 0.001 * | 8.67 | 8.72 | −6.63 | 0.001 * | 10.98 | 11.04 | −4.71 | 0.001 * | 7.56 | 7.60 |
| IDUN_T | 35.46 (17.85) | 40.96 (18.39) | 46.82 (18.82) | −5.23 | 0.001 * | 8.86 | 8.90 | −9.01 | 0.001 * | 10.61 | 10.67 | −5.75 | 0.001 * | 8.59 | 8.64 |
| SC_TT | 12.06 (8.86) | 13.66 (9.48) | 17.06 (10.87) | −2.95 | 0.002 * | 4.58 | 4.61 | −6.10 | 0.001 * | 7.09 | 7.13 | −4.64 | 0.001 * | 6.39 | 6.43 |
| FM_T | 107.10 (38.00) | 109.49 (32.49) | 119.04 (29.66) | −1.12 | 0.13 | 17.99 | 18.09 | −4.80 | 0.001 * | 20.97 | 21.08 | −5.61 | 0.001 * | 14.35 | 14.42 |
| CL_T | 29.28 (10.59) | 32.04 (10.62) | 36.55 (9.94) | −4.36 | 0.001 * | 5.33 | 5.36 | −8.84 | 0.001 * | 6.92 | 6.96 | −6.82 | 0.001 * | 5.57 | 5.60 |
| RTSC_T | 10.34 (4.60) | 11.39 (4.90) | 13.06 (5.27) | −3.10 | 0.002 * | 2.90 | 2.92 | −6.81 | 0.001 * | 3.36 | 3.38 | −4.80 | 0.001 * | 2.92 | 2.93 |
| ISP_T | 29.87 (10.70) | 34.86 (9.30) | 36.83 (9.75) | −5.37 | 0.001 * | 7.83 | 7.87 | −7.60 | 0.001 * | 7.72 | 7.76 | −2.67 | 0.005 * | 6.22 | 6.26 |
| DR_T | 7.04 (3.24) | 8.21 (3.03) | 8.97 (3.19) | −4.37 | 0.001 * | 2.26 | 2.27 | −7.85 | 0.001 * | 2.07 | 2.08 | −3.05 | 0.002 * | 2.10 | 2.11 |
| AB_T | 16.72 (10.80) | 13.17 (5.40) | 12.03 (5.19) | 2.76 | 0.004 * | 10.84 | 10.90 | 3.77 | 0.001 * | 10.48 | 10.54 | 4.72 | 0.001 * | 2.04 | 2.05 |
| AT_T | 6.42 (2.01) | 6.92 (1.53) | 7.90 (1.50) | −2.47 | 0.008 * | 1.68 | 1.69 | −8.05 | 0.001 * | 1.55 | 1.56 | −6.85 | 0.001 * | 1.21 | 1.22 |
Note. * p < 0.05; M 1 = measurement 1; M 2 = measurement 2; M 3 = measurement 3; FA_T = food autonomy; PCH_T = personal care and hygiene; IDUN_T = independently dress and undresses; SC_TT = sphincter control; FM_T = functional mobility; CL_T = communication and language; RTSC_T = resolution of tasks in social contexts; ISP_T = interactive and symbolic play; DR_T = daily routines; AB_T = adaptative behavior; AT_T = attention; M = mean; SD = standard deviation; d = Cohen’s d (>0.20 no effect value, 0.21–0.49 small effect value, 0.50–0.70 medium effect value, <0.70 large effect value).
References
- World Health Organisation (WHO). Rehabilitation in Health Systems; WHO: Geneva, Switzerland, 2017; Available online: https://apps.who.int/iris/handle/10665/254506 (accessed on 30 January 2024).
- World Health Organisation (WHO). Improving Early Childhood Development: WHO Guideline; WHO: Geneva, Switzerland, 2020; Available online: https://www.who.int/publications/i/item/97892400020986 (accessed on 30 January 2024).
- European Union. Official Journal of the European Union. Recommendations for High Quality Early Childhood Education Systems. NO. C 189/4. Available online: https://eur-lex.europa.eu/legal-content/ES/TXT/?uri=CELEX%3A32019H0605%2801%29 (accessed on 30 January 2024).
- Josse, D. Escala de Desarrollo Psicomotor de la Primera Infancia Brunet-Lézine Revisado [Scale of Psychomotor Development of Early Childhood Brunet Lézine-Revised]; Psymtéc: Madrid, Spain, 1997. [Google Scholar]
- Newborg, J. Battelle Developmental Inventory Examiner’s Manual, 2nd ed.; Riverside: Itasca, IL, USA, 2005. [Google Scholar]
- Haley, S.M.; Coster, W.J.; Ludlow, L.H.; Haltiwanger, J.T.; Andrellos, P.J. The Pediatric Evaluation of Disability Inventory (PEDI), 2nd ed.; Pearson Clinical Assessment: Washington, WA, USA, 2012. [Google Scholar]
- Bluma, M.S.; Shearer, M.S.; Frohman, A.H.; Hilliard, J.M. Portage Guide to Early Education, 2nd ed.; Cooperative Educational Service Agency: Pewaukee, WI, USA, 1978.
- Sáiz-Manzanares, M.C.; Marticorena, R.; Arnaiz, Á. Evaluation of Functional Abilities in 0-6 Year Olds: An Analysis with the eEarlyCare Computer Application. Int. J. Environ. Res. Public Health 2020, 17, 3315. [Google Scholar] [CrossRef] [PubMed]
- Sáiz-Manzanares, M.C.; Marticorena, R.; Arnaiz, Á.; Díez-Pastor, J.F.; García-Osorio, C.I. Measuring the functional abilities of children aged 3–6 years old with observational methods and computer tools. J. Vis. Exp. 2020, e60247. [Google Scholar] [CrossRef]
- Sáiz-Manzanares, M.C.; Marticorena, R.; Arnaiz-Gonzalez, Á. Improvements for therapeutic intervention from the use of web applications and machine learning techniques in different affectations in children aged 0–6 years. Int. J. Environ. Res. Public Health 2022, 19, 6558. [Google Scholar] [CrossRef] [PubMed]
- Poon, E.T.-C.; Wongpipit, W.; Sun, F.; Tse, A.C.-Y.; Sit, C.H.-P. High-intensity interval training in children and adolescents with special educational needs: A systematic review and narrative synthesis. Int. J. Behav. Nutr. Phys. Act. 2023, 20, 13. [Google Scholar] [CrossRef]
- Ridosh, M.M.; Adams, W.; Magaña, F.; Sawin, K.J.; Holmbeck, G.N. Trajectories of self-management and independence in youth with spina bifida: Demographic predictors of growth. Child Care Health Dev. 2023, 49, 508–517. [Google Scholar] [CrossRef] [PubMed]
- Sawin, K.J.; Heffelfinger, A.; Cashin, S.E.; Brei, T.J. The Development of the Adolescent/Young Adult Self-Management and Independence Scale II: Psychometric Data. J. Pediatr. Rehabil. Med. 2018, 11, 311–322. [Google Scholar] [CrossRef]
- Amer, A.; Hermansson, L.; Jarl, G.; Kamusiime, S.; Forssberg, H.; Andrews, C.; Kakooza-Mwesige, A.; Eliasson, A.C. Validity and test-retest reliability of the Ugandan version of the Pediatric Evaluation of Disability Inventory (PEDI-UG) in children and youth with cerebral palsy. Child Care Health Dev. 2023, 49, 464–484. [Google Scholar] [CrossRef] [PubMed]
- Sáiz-Manzanares, M.C.; Pérez-Bravé, Y. Escala de Medición Habilidades Funcionales [Functional Skills Measurement Scale]. Number of Intellectual Property 00/2019/4253. Available online: https://bit.ly/3muc6To (accessed on 12 January 2024).
- IBM Corp. SPSS Statistical Package for the Social Sciences (SPSS), 28th ed.; IBM Corp: Armonk, NY, USA, 2023. [Google Scholar]
- Demšar, J.; Curk, T.; Erjavec, A.; Gorup, Č.; Hočevar, T.; Milutinovič, M.; Možina, M.; Polajnar, M.; Toplak, M.; Starič, A.; et al. Orange: Data Mining Toolbox in Python. J. Mach. Learn. Res. 2013, 14, 2349–2353. Available online: http://jmlr.org/papers/v14/demsar13a.html (accessed on 12 February 2024).
- Bandalos, D.L.; Finney, S.J. Item Parceling Issues in Structural Equation Modeling. In New Developments and Techniques in Structural Equation Modeling; Lawrence Erlbaum Associates Publishers: Mahwah, NJ, USA, 2001; pp. 269–296. [Google Scholar]
Disclaimer/Publisher’s Note: The statements, opinions and data contained in all publications are solely those of the individual author(s) and contributor(s) and not of MDPI and/or the editor(s). MDPI and/or the editor(s) disclaim responsibility for any injury to people or property resulting from any ideas, methods, instructions or products referred to in the content. |
© 2024 by the authors. Licensee MDPI, Basel, Switzerland. This article is an open access article distributed under the terms and conditions of the Creative Commons Attribution (CC BY) license (https://creativecommons.org/licenses/by/4.0/).