Abstract
Personalized learning is becoming more important in today’s diverse classrooms. It is a strategy that tailors instruction to each student’s abilities and interests. The benefits of personalized learning include students’ enhanced motivation and academic success. The average teacher-to-student ratio in classes is 1:15.3, making it challenging for teachers to identify each student’s areas of strength (or weakness). Learning analytics (LA), which has recently revolutionized education by making it possible to gather and analyze vast volumes of student data to enhance the learning process, has the potential to fill the need for personalized learning environments. The convergence of these two fields has, therefore, become an important area for research. The purpose of this study is to conduct a systematic review to understand the ways in which LA can support personalized learning as well as the challenges involved. A total of 40 articles were included in the final review of this study, and the findings demonstrated that LA could support personalized instruction at the individual, group, and structural levels with or without teacher intervention. It can do so by (1) gathering feedback on students’ development, skill level, learning preferences, and emotions; (2) classifying students; (3) building feedback loops with continuously personalized resources; (4) predicting performance; and (5) offering real-time insights and visualizations of classroom dynamics. As revealed in the findings, the prominent challenges of LA in supporting personalized learning were the accuracy of insights, opportunity costs, and concerns of fairness and privacy. The study could serve as the basis for future research on personalizing learning with LA.
1. Introduction
Personalized learning is an educational strategy that adjusts pace, content, and instruction based on each student’s particular needs, interests, and aptitude to meet the demands [1]. The advantages of this strategy lie in its capacity to meet the various demands of students and improve their engagement and performance. Personalized learning creates a deeper comprehension of subjects, boosts motivation, and enhances student accomplishment by recognizing and accommodating individual variations [2]. Additionally, it can encourage students to take charge of their learning and pursue independent study [3]. By offering specialized support to students who might need extra help or have difficulties, personalized learning can also aid in bridging educational disparities [4]. Students gain from personalized learning since it considers their individual needs and characteristics for assignments, tests, and learning. This contrasts with the conventional “one-size-fits-all” approach to education, which, as studies have shown, hinders teacher from identifying and meeting the needs and talents of every student [5]. Personalized learning is becoming more and more common in schools and universities today due to the plethora of advantages mentioned above [6,7].
At the same time, amidst the fervor surrounding personalized learning, there exists a nuanced discourse that questions the universal benefits attributed to this educational paradigm. Critics argue that the emphasis on performance within personalized learning may jeopardize students’ psychological well-being by potentially compromising their sense of autonomy and relatedness. Self-determination theory [8] states that students require feelings of competence, autonomy, and relatedness for optimal well-being. The risk emerges when an excessive emphasis on numbers overshadows the intrinsic value of the learning process. Students may be driven to pursue performance goals solely to satisfy teachers, neglecting the essential aspect of understanding the learning process itself [9,10]. Moreover, the primacy of personalised learning pathways might inadvertently sideline the crucial social aspects of learning. Classroom studies emphasize the value of collaborative work, teamwork skills, and communication, elements often overshadowed in the current landscape of personalized learning systems. The absence of verbal interaction and insufficient attention to students’ need for relatedness in these systems poses a potential limitation, challenging the assumption that personalized learning inherently encompasses all aspects of a dynamic learning experience [11]. Therefore, these works underscore the need for a nuanced understanding of the conditions under which personalized learning can thrive and the potential pitfalls that may impede its success.
The effective implementation of personalized learning includes (1) a meticulous gathering of data on each student’s progress levels, strengths, and weaknesses in different topics, (2) the customization of learning materials and quizzes based on the needs of each student, and (3) customized feedback for each student. Given that today’s curriculum does not only involve individual exams but also group projects, there are even more areas for personalized guidance from teachers. Hence, personalized learning requires a lot of time and manpower. However, the average percentage of a teacher’s work hours spent in the classroom is only 46% [12], and the average teacher-to-student ratio in classes is 1:15.3 [13], which means that there is a lack of time and manpower to monitor each student and effectively personalize their learning. Therefore, it is possible that teachers will not be able to monitor and identify every student’s behavior, traits, and preferences on their own. Additionally, because of time restrictions, teachers frequently use a one-size-fits-all strategy whereby they teach a large class of students at once. These restrictions can cause a few gaps where teachers may not be able to provide differentiated instruction based on each student’s strengths and learning pace and may not be able to give timely and thorough feedback to every student. This can affect students’ learning because they may not be aware of where and how to improve. A system that can evaluate student data, provide feedback, aid in differentiated instruction, and assist teachers in making instructional decisions in the classroom is required to close these gaps. LA is a promising solution that can accomplish the aforementioned.
In this regard, LA can be very useful as it allows for a quick assessment of students’ strengths and weaknesses, progress tracking, automatic customization of learning materials and quizzes, and automatic feedback. Sometimes, teachers’ feedback can be more subjective and based on their impressions and experiences with each student. LA can help such feedback be more objective by providing data-driven insights to the teachers. In addition, LA can even measure students’ participation and performance in group work and assist in providing necessary feedback.
LA measures, collects, analyzes, and interprets data on students and their contexts to enhance student learning outcomes [14]. In the past ten years, LA has made significant contributions to the area of education by gathering vast amounts of data to better understand various facets of learning, including student engagement, behavior, and performance. Based on these findings, LA has now been able to quickly provide feedback and support to students and teachers [15]. By encouraging self-regulation, reinforcing their learning, and developing positive habits that will enhance their learning experiences, LA has also been able to empower students as they move forward in their educational journey [16].
It is noteworthy that the roots of data-driven approaches in education trace back to the 1980s and 1990s when Intelligent Tutoring Systems emerged as pioneering systems aimed at providing personalized instruction [17,18]. These early systems laid the groundwork for the development of more sophisticated LA methodologies [19].
LA supports the objective of personalized learning as it has the advantage of being able to track all online student behavior and automatically develop or adjust online resources. The use of LA for creating learning activities and raising student engagement has been the subject of a sizable body of study, but relatively few studies have examined how LA might enable personalized learning [15]. This study seeks to close the gap by analyzing the ways in which LA can promote personalized learning and the challenges involved with its implementation.
2. Methodology
A systematic literature review was conducted to address the current research gaps. The main steps carried out in this study include (1) problem definition, (2) creation of criteria, (3) data gathering and analysis, and (4) discussion. There are significant knowledge gaps between theory and practice in the emerging field of LA, particularly when it comes to how it relates to personalized instruction. The methods and challenges of LA must be understood to use it to assist personalized learning. Thus, the following research questions were formed:
- RQ1: How can LA be leveraged to support personalized learning?
- RQ2: What are the challenges in leveraging LA in personalized learning?
In this study, journal articles, books, and published dissertations published in Scopus and ProQuest were included. Five inclusion criteria and exclusion criteria were considered, as shown in Table 1, to only gather studies that were pertinent. Other literature evaluations on LA and the Critical Appraisal Skills Programme (CASP) [20,21] served as a guide for these criterion selections.

Table 1.
Inclusion and exclusion criteria.
In addition to the inclusion/exclusion standards, four quality standards were also taken into account to further filter the chosen studies and guarantee a high grade (Table 2).
Table 2.
Quality assessment.
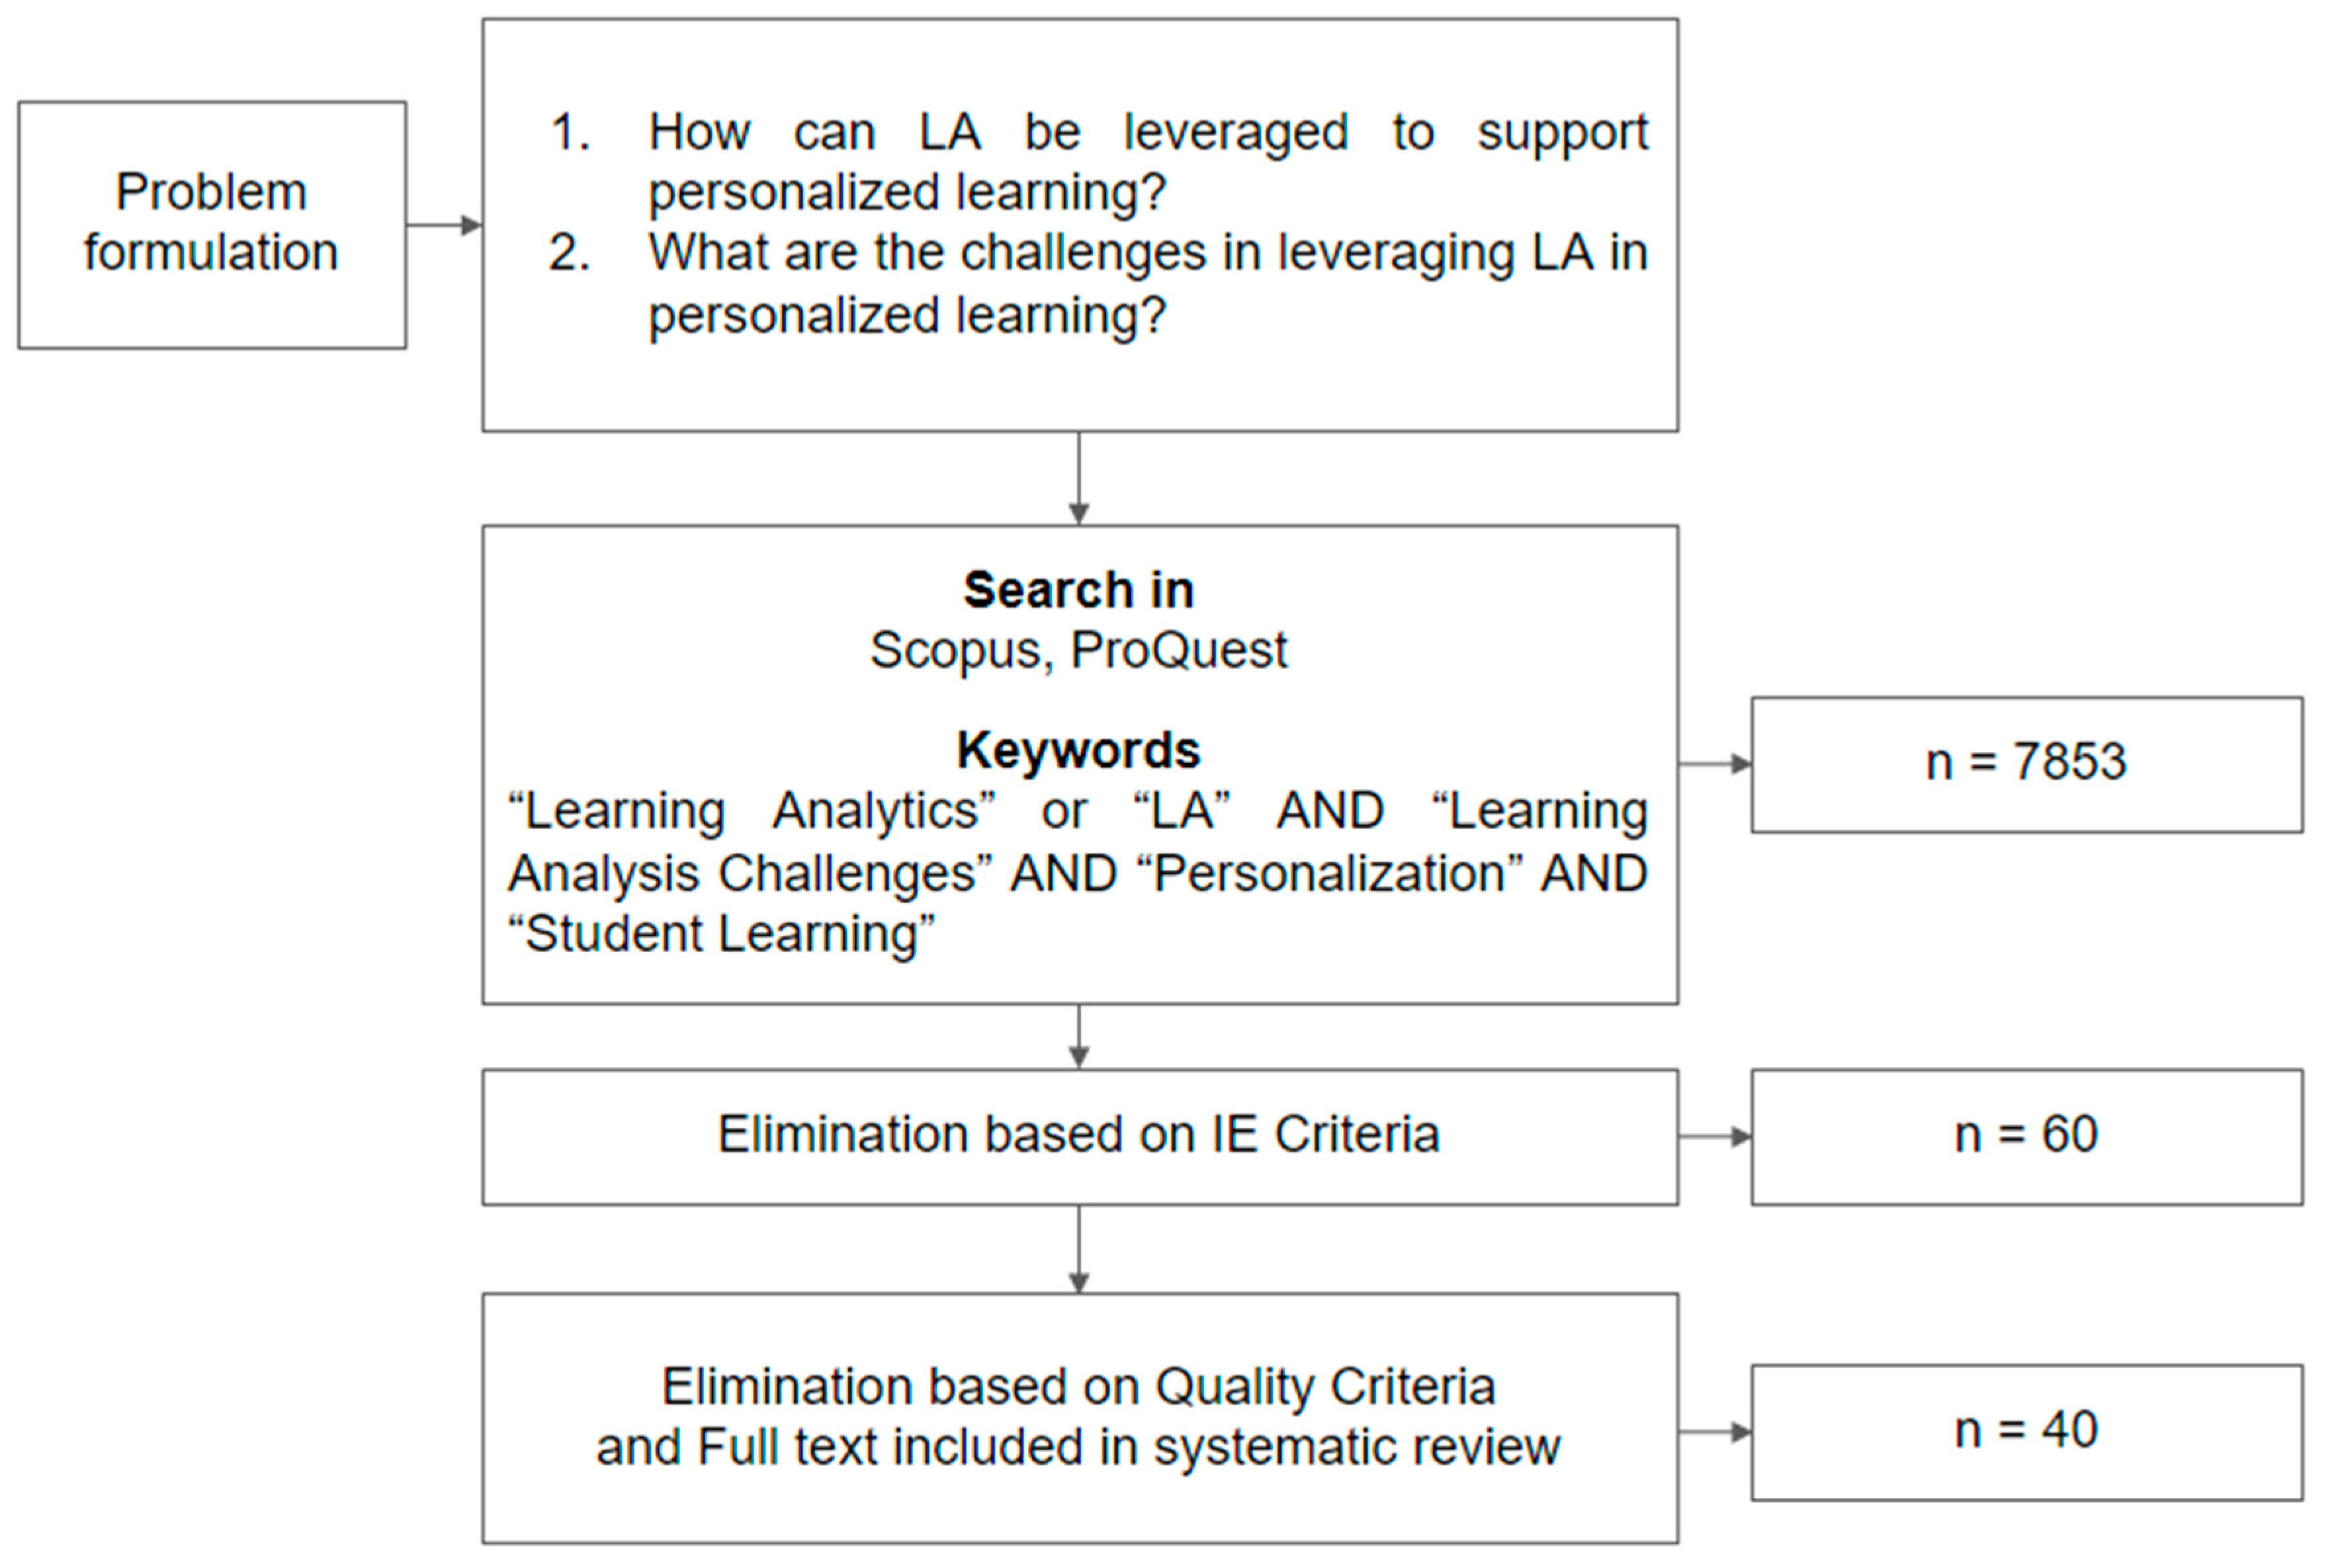
The first three keywords that were required to appear in the pertinent studies were “learning,” “analytics,” and “personalization” in the search string. To further limit the scope, the word “challenges” was also used. The terms “learning” and “analytics,” however, were combined as “learning analytics” because using them separately produced numerous articles that were not relevant. To obtain more relevant results, the terms “learning analytics” and “challenges” were also combined. The final search term was, therefore, “Learning Analytics” or “LA” AND “Learning Analysis Challenges” AND “Personalization” AND “Student Learning”. Figure 1 summarizes the process of article selection.
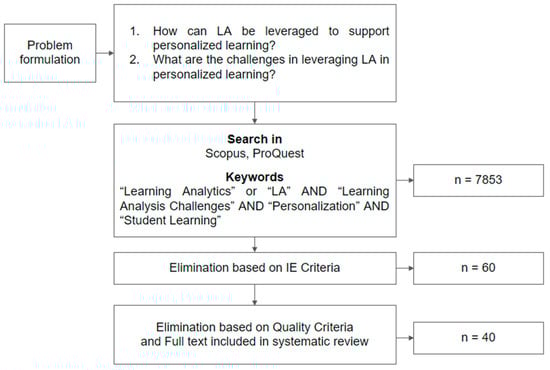
Figure 1.
Main steps of the systematic review.
3. Findings and Discussion
In total, 40 articles were included in this study’s final review. Four of the articles that were used in addressing RQ1 were also utilized to answer RQ2. Results from the analysis were reported in this section to address the research questions. The review of 28 articles focuses on the use of LA to support personalized learning at individual, classroom/group, and structural levels. Extracted analytics presents data for interpretation, while embedded analytics eliminates teacher interactions by automatically recommending tasks, resources, and opportunities based on a student’s skill level. LA can track student progress, identify students’ unique approaches to problem-solving, and provide real-time feedback on student performance. Teachers can use LA to categorize students based on ability levels, assess course materials, and forecast learning. LA can also evaluate previous student behavior and performance to predict future academic success. Social network data and student profiles can also be used to forecast future performance. Overall, LA can be used to provide personalised support in the classroom, allowing teachers to better understand and support their students.
The review of 16 articles reveals that the key challenges in leveraging LA for personalized learning include accuracy, privacy concerns, fairness concerns, and opportunity cost. The accuracy of LA results may be affected by factors such as student absence, which could lead to low engagement on platforms that leverage LA. Privacy concerns are another significant barrier to the implementation of LA in education. Students prefer anonymity in LA elements. Fairness is another challenge, as LA algorithms may contain biases, such as racial and gender stereotypes, which can negatively affect students’ experiences and engagement. Opportunity cost is another challenge associated with LA in classrooms. High usage of digital tools may discourage creativity and detract from students’ ability to learn, communicate, and interact physically.
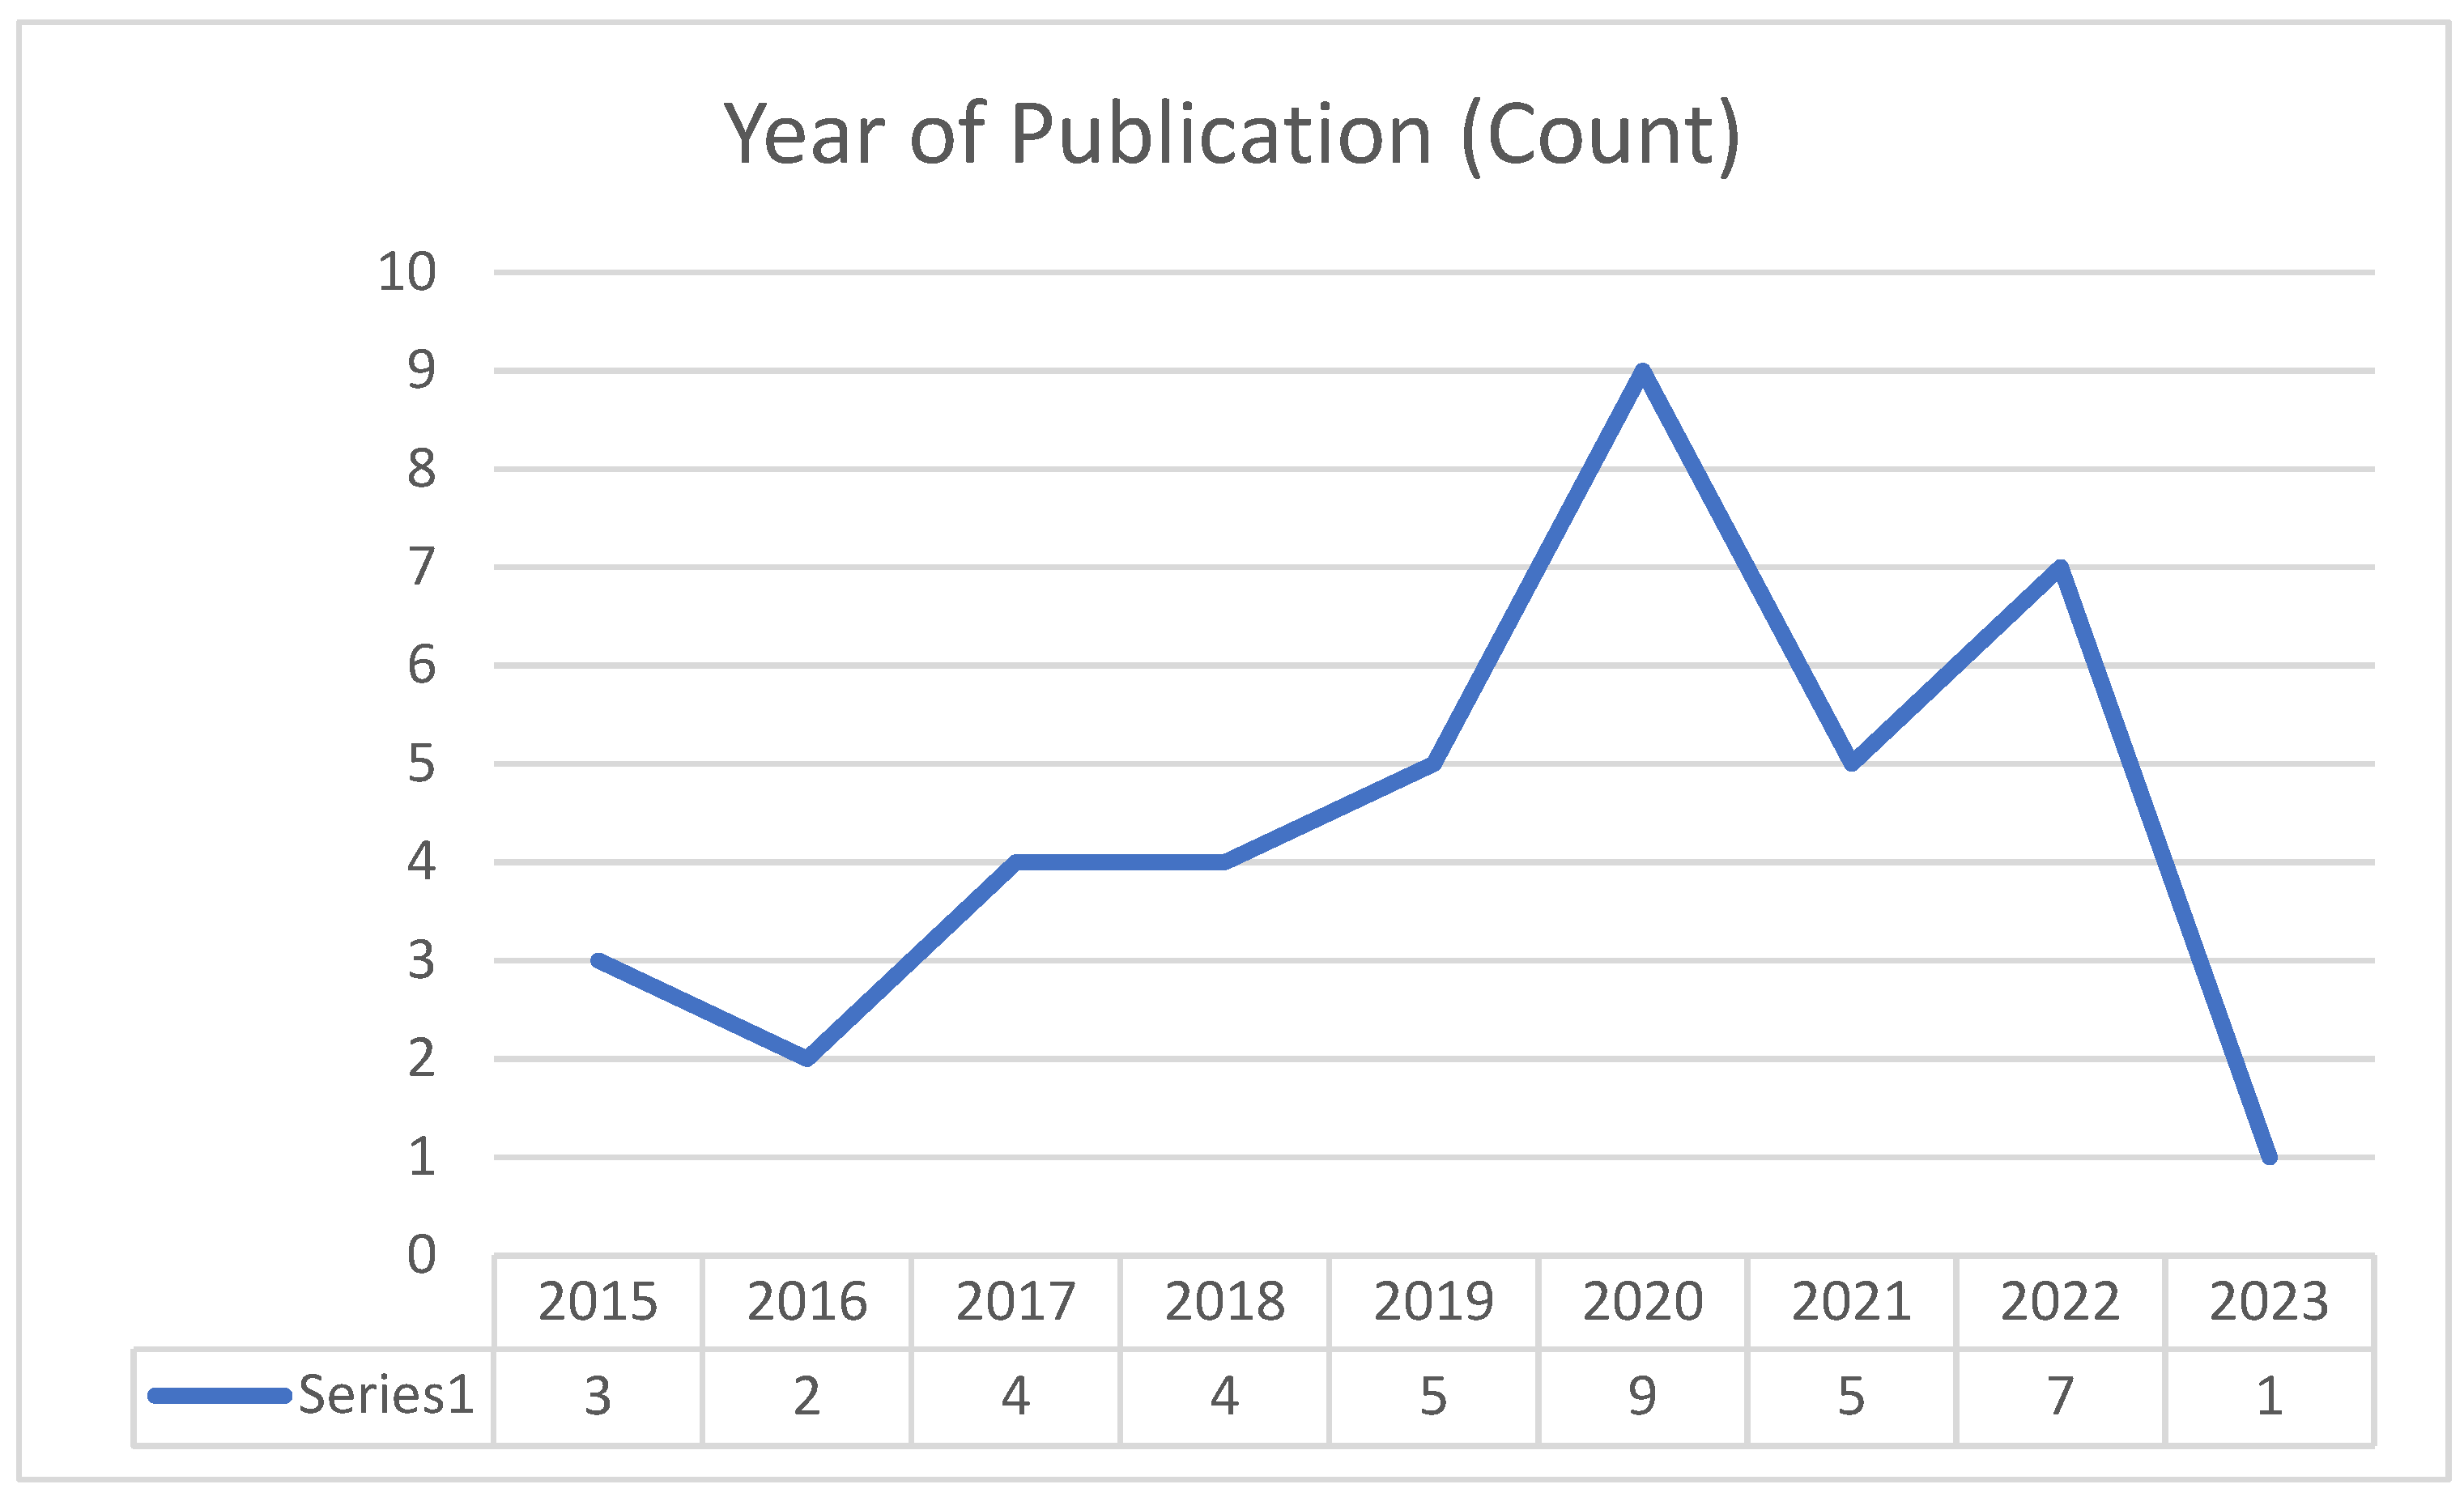
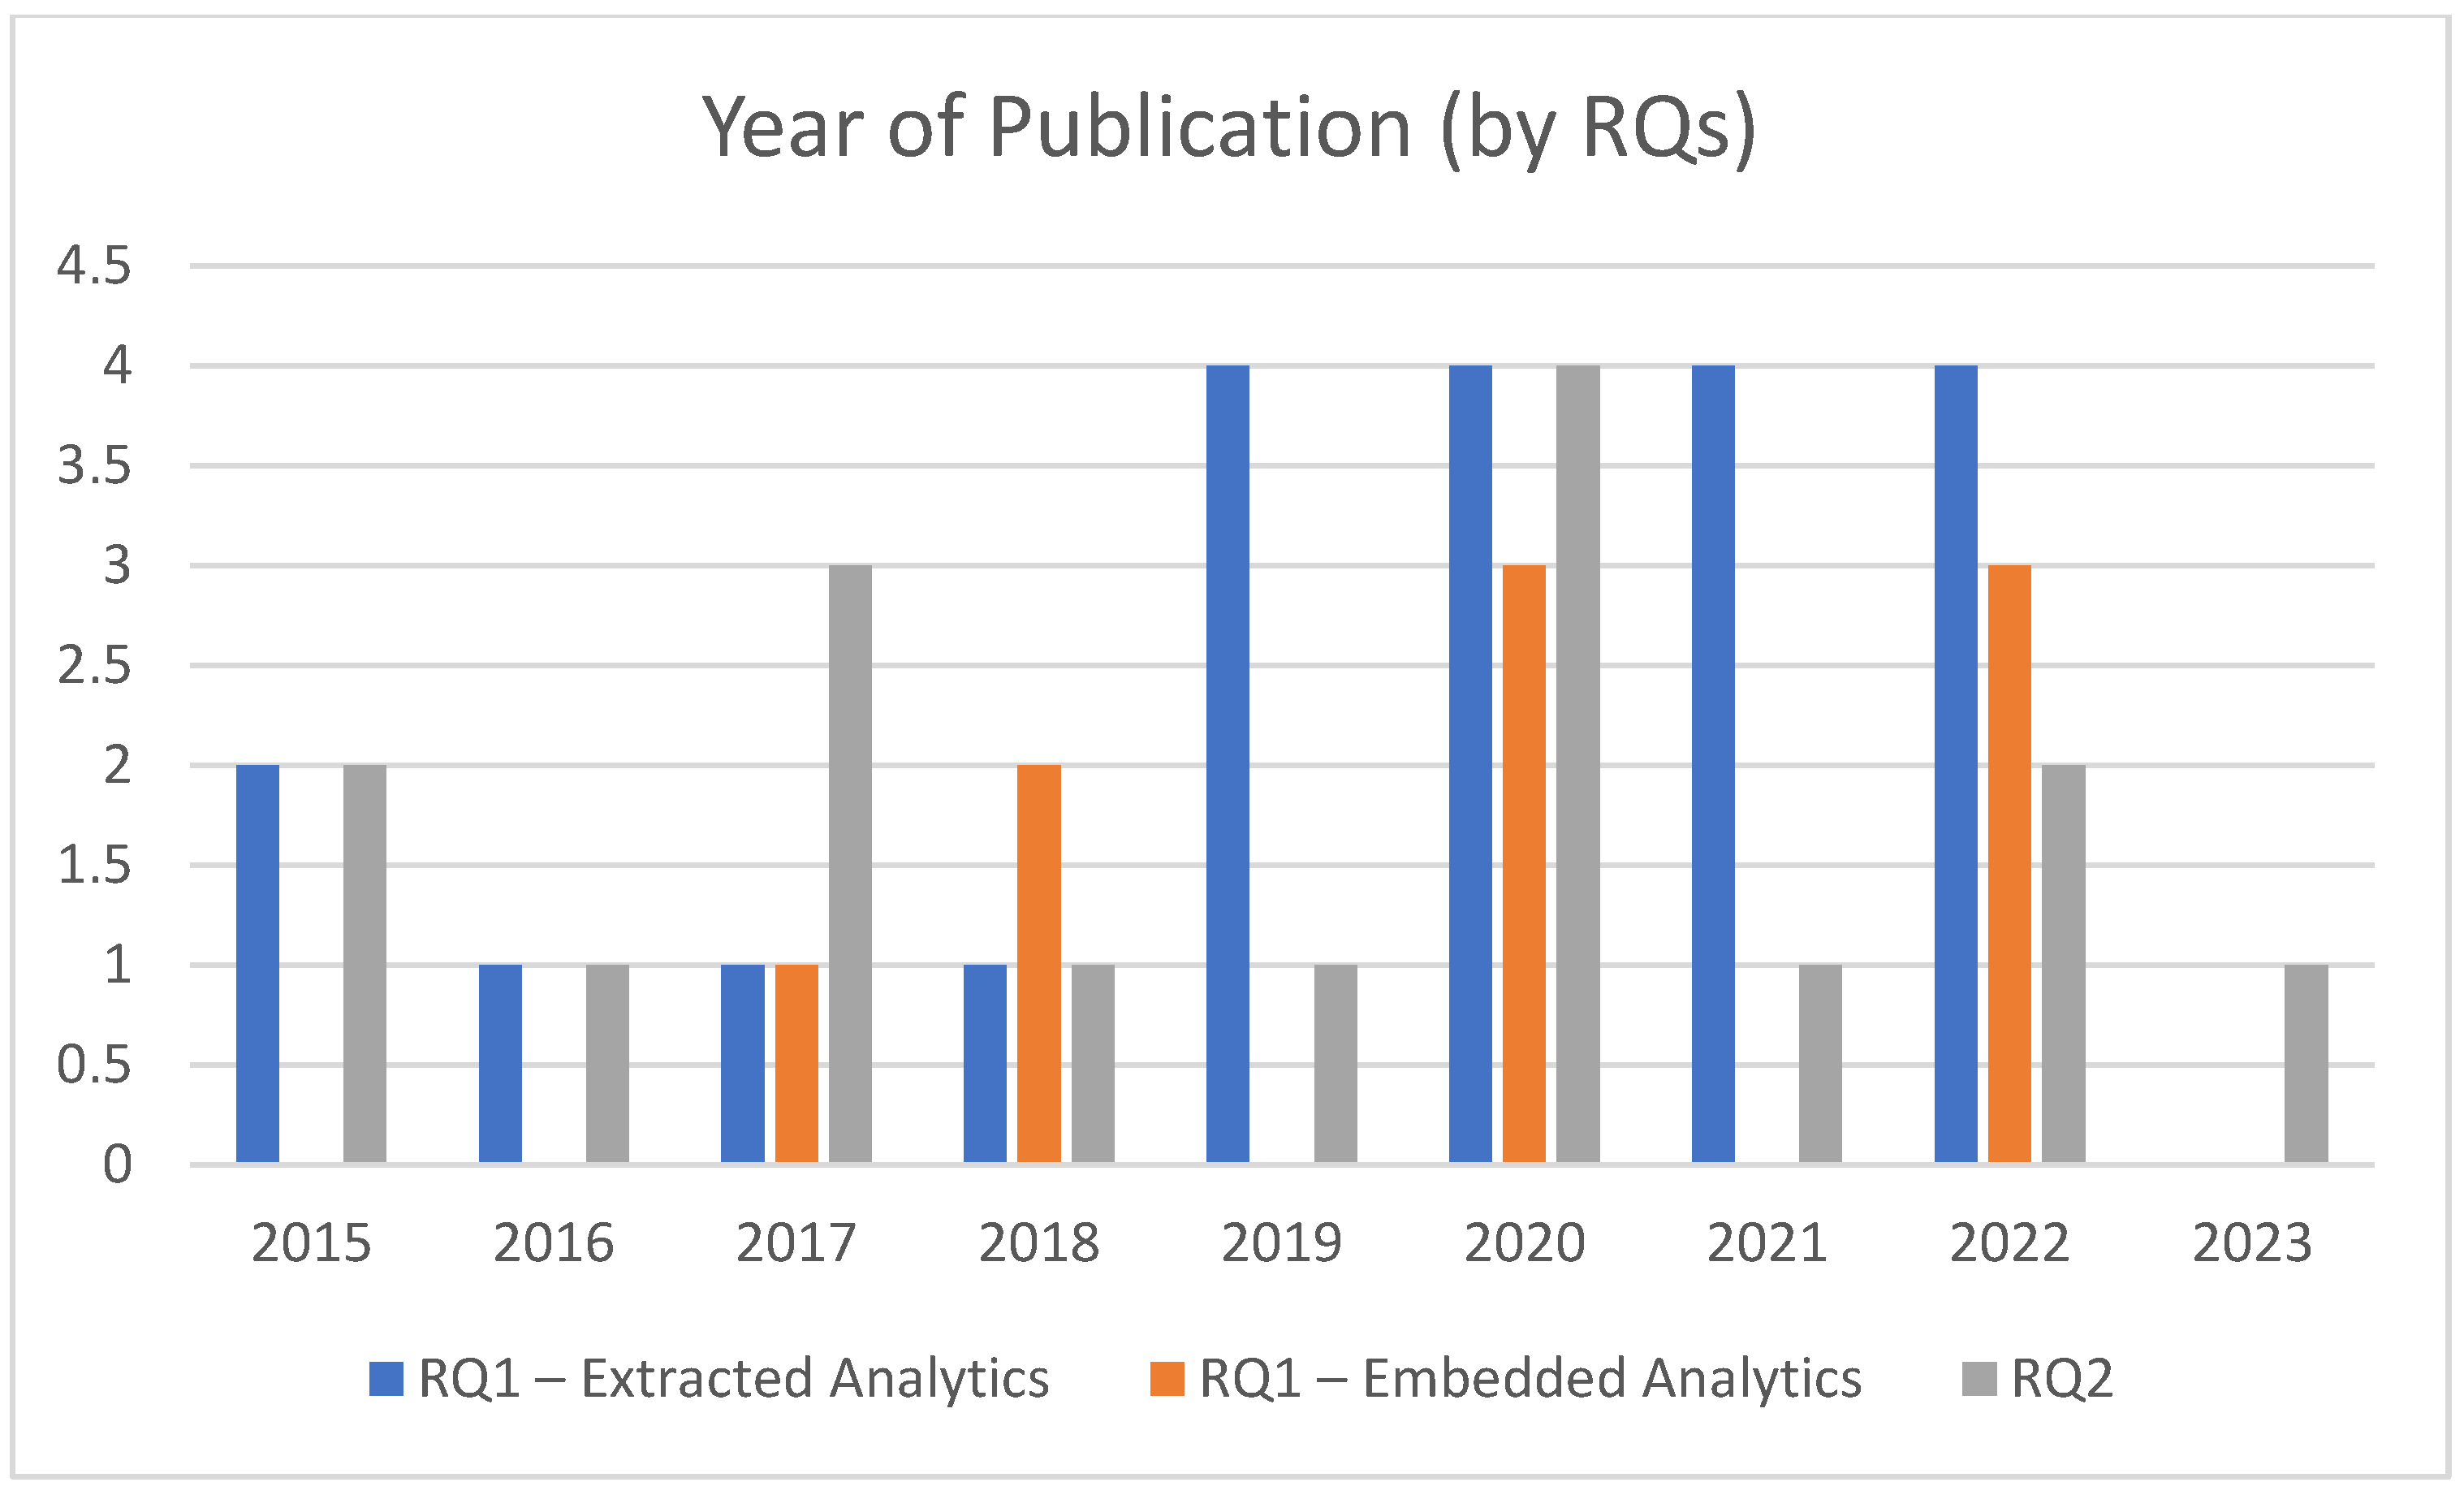
Figure 2 illustrates the total number of articles obtained for this study between 2015 and early 2023 based on the year of publication. The distribution of articles based on RQs is shown in Figure 3. The number of articles published shifted between 2015 and 2016, as LA was only starting to gain traction. However, in 2017, there was an increase in the number of articles published as a result of the shift in technology trends in education, likely as a result of the use of Learning Management System (LMS) as a personalized tool to support students. Studies on LA reached a record level in 2020. It is assumed that the sharp growth resulted from the COVID-19 pandemic at the time, which caused teaching and learning to be largely moved over to online, and personalized instruction is crucial for online learning. LA trends will continue to gain popularity in the future given its many benefits [22]. Hence, it is crucial for future research to explore LA in personalized learning and evaluate its effectiveness in enhancing students’ performance.
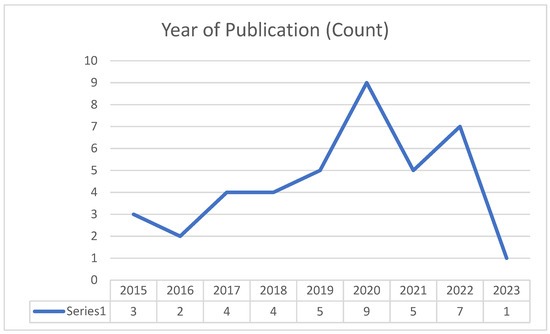
Figure 2.
Year of publication for selected articles.
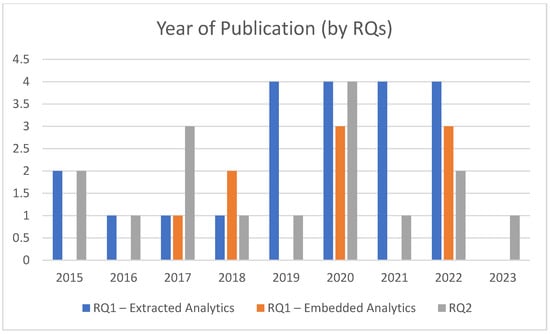
Figure 3.
Year of publication (by RQs).
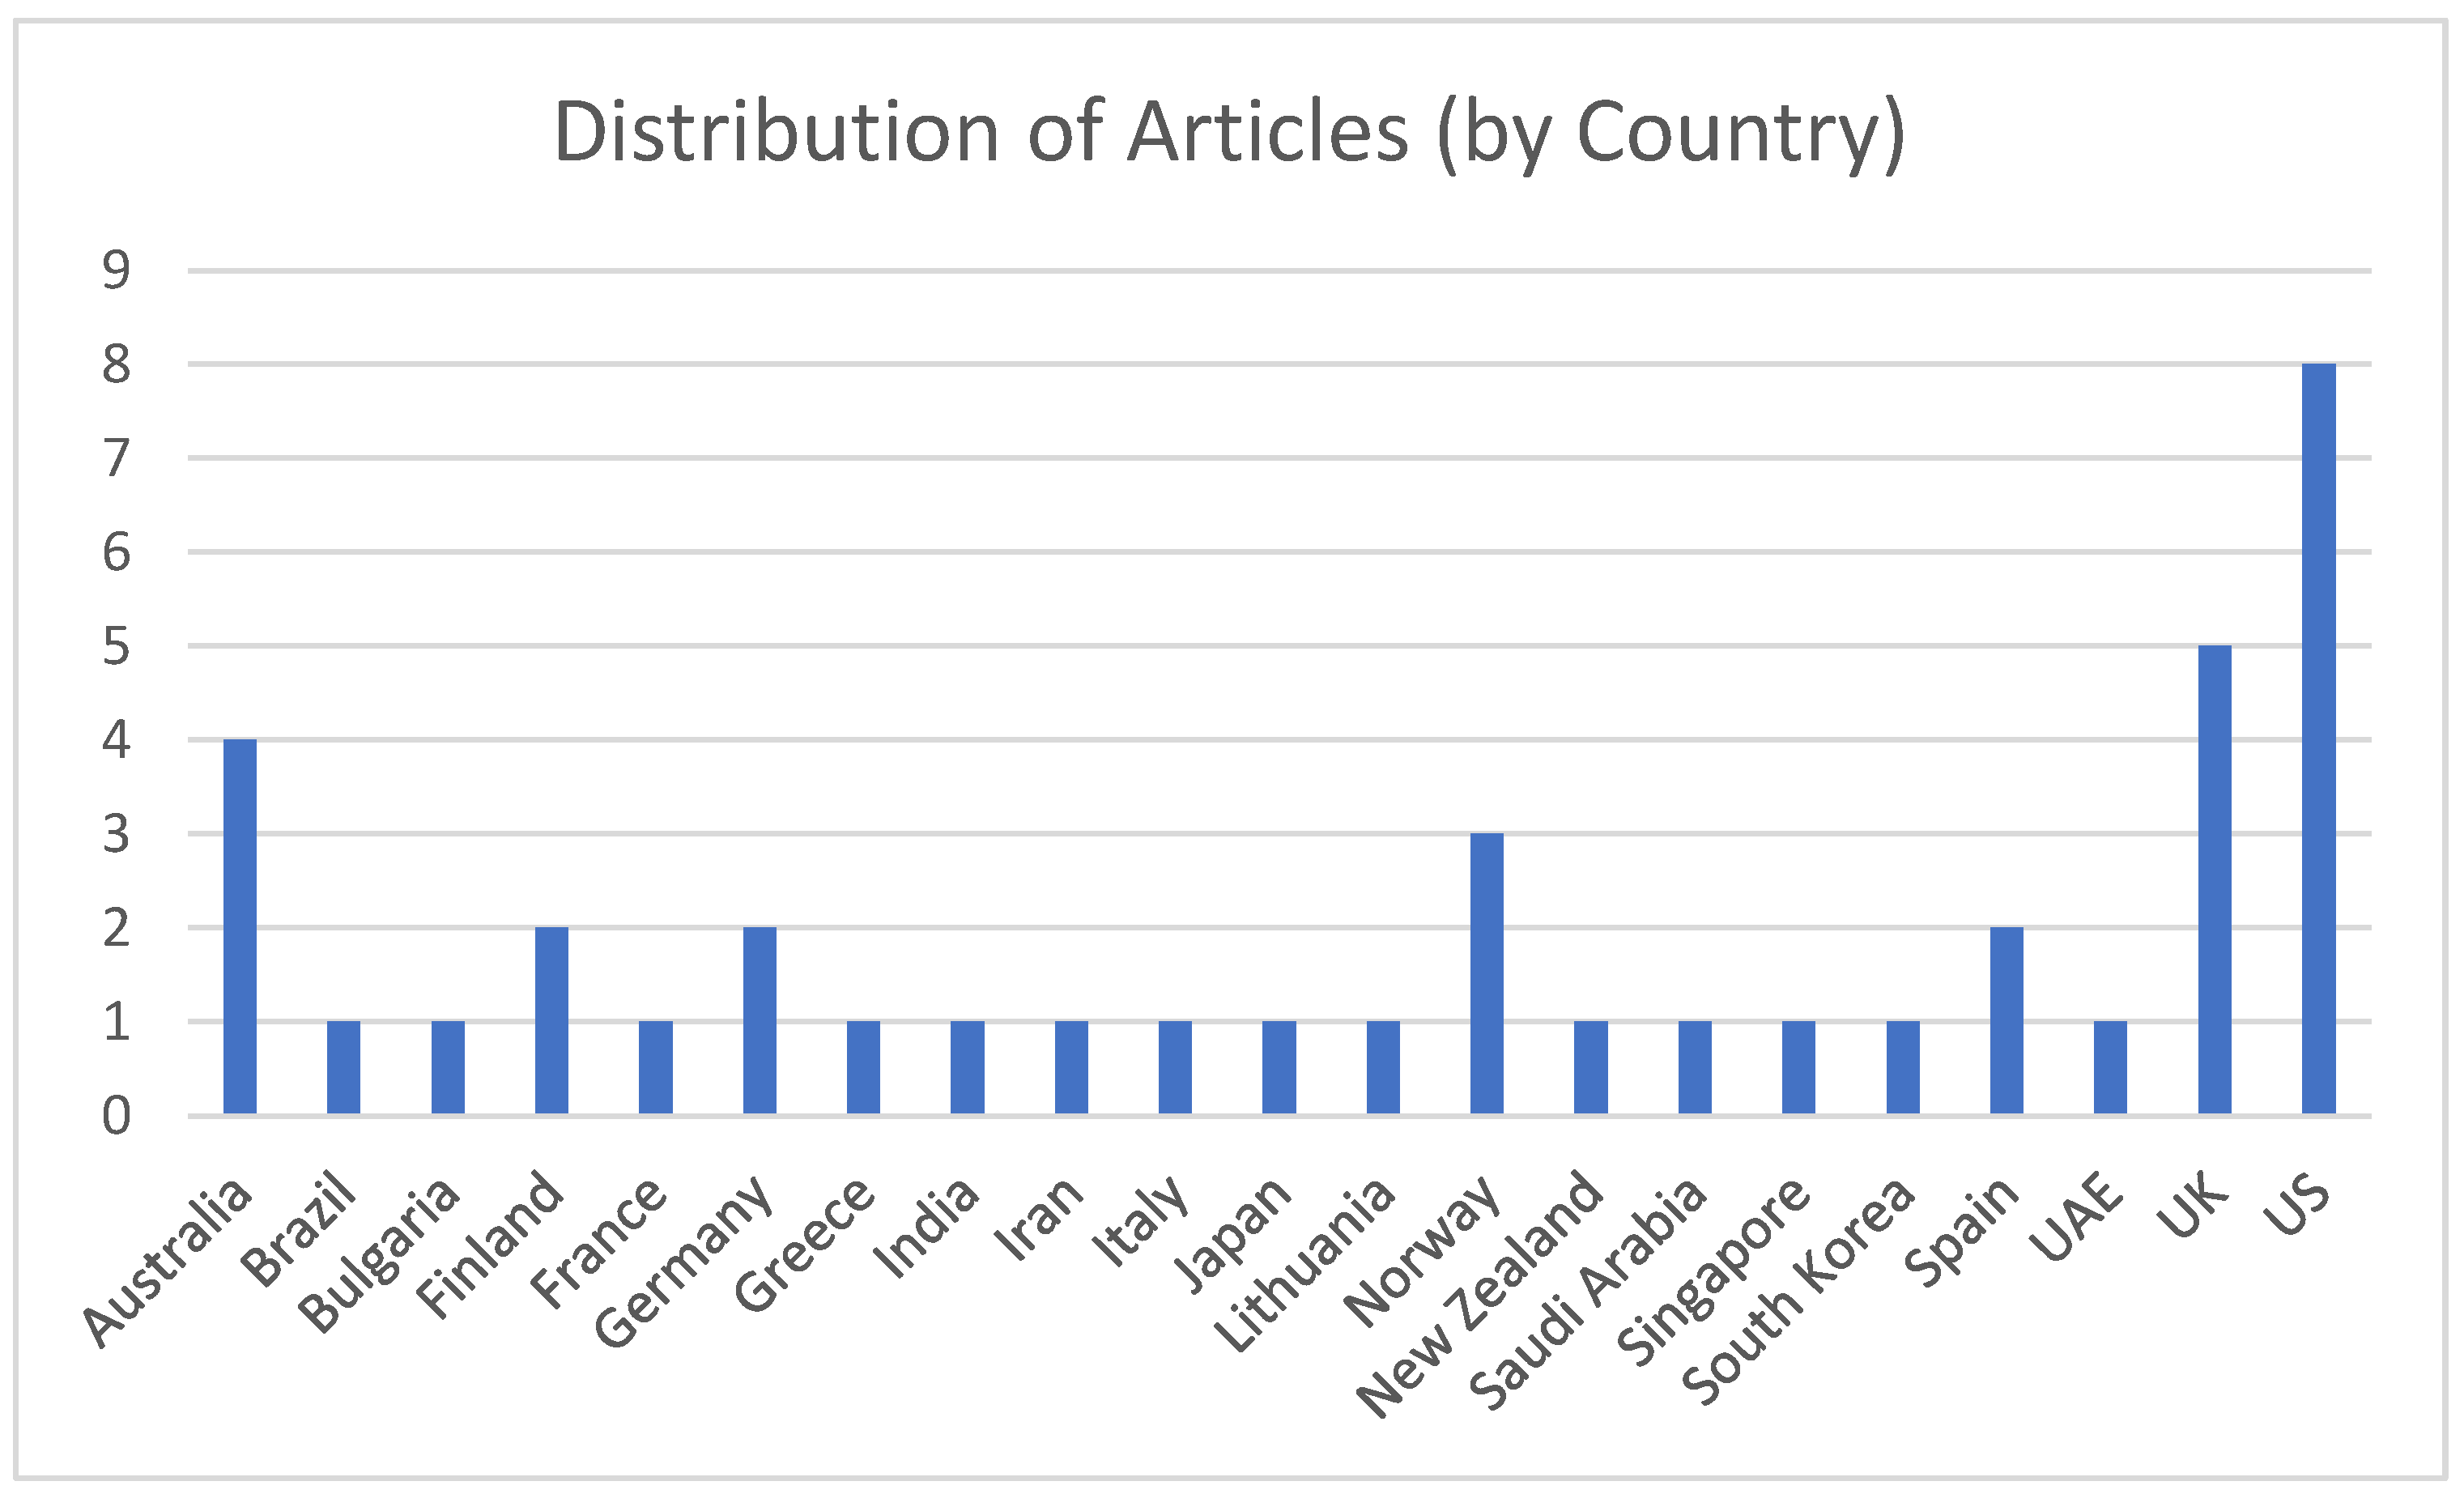
The articles included in the final review are organized by nation in Figure 4. The selected articles, which identified personalizing learning with LA, came from a total of 21 different nations. Studies on applying LA to support personalized learning have been carried out repeatedly in Western nations like the US, the UK, Australia, and Norway. Asian nations like Singapore, South Korea, and Japan also demonstrated interest in examining how LA is leveraged in personalized student learning. Accordingly, since it presents a variety of results on the use of LA in personalizing students’ learning, it is critical for future studies to ensure diversity of demographic backgrounds. Students and teachers can do this by putting into practice the strategies and tools recommended in the research that use different forms of sampling and demographic backgrounds to improve the quality of the learning process in personalized learning contexts.
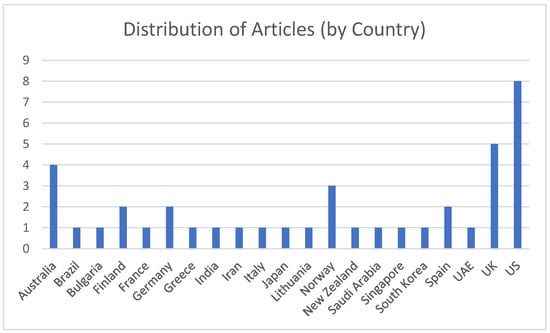
Figure 4.
Distribution for selected articles by country.
3.1. The Way That LA Supports Personalized Learning (RQ1)
A total of 28 articles were reviewed to address RQ1. LA can be leveraged to support personalized learning in two ways: extracted analytics and embedded analytics. The approach known as extracted analytics presents data for interpretation so that teachers and students can obtain an understanding of the learning process and its outcomes, hence facilitating the personalization of teaching and learning in the classroom. Meanwhile, embedded analytics eliminates the requirement for teacher interactions by using data to automatically recommend tasks, resources, and opportunities based on a student’s skill level [23].
3.1.1. Extracted Analytics
Through extracted analytics at the individual, classroom/group, and structural levels, LA can be leveraged to promote personalized learning. The included articles for extracted analytics are shown in Table 3.
Table 3.
Types of extracted analytics in personalized learning.
- Individual Level
At the individual level in the context of LA, the focus is on the unique characteristics, progress, and behaviors of each student. Extracted analytics are utilized to provide personalized support and insights tailored to individual students’ needs and learning styles.
For example, Ruipérez-Valiente et al. [24] revealed that LA could aid in tracking and visualizing each student’s progress as they worked through puzzles. Additionally, it could identify which problems and corresponding concepts individual students found the most and least challenging. This can help provide each student with personalized support. Most significantly, LA might tell teachers whether a student has been actively trying to solve the problems or is simply speculating by examining how students engage with the puzzles. Decisions on pedagogy in the classroom can be guided by such knowledge. According to Sousa and Mello [23], LA could be used to track student progress in real-time on platforms like Khan Academy and Google Classroom.
With LA, teachers are able to view real-time feedback regarding students’ performance as reported by Vahdat et al. [25]. This will assist teachers in identifying students who require assistance. According to Kleinman et al. [26], LA can be used to track students’ behaviors while they attempt to solve problems and can provide data on both the quantity and sequence of those actions. The latter could be used to identify each student’s unique approaches to problem-solving and identify the precise ideas that each student finds challenging. Teachers could utilize this data to identify the areas where their students need to improve and create lessons that are specifically geared toward those needs.
Kurilovas [27] found that teachers may utilize LA to categorize their students according to their ability levels, identify those who require more assistance, assess which course materials benefited various student groups the most, and forecast their learning. Additionally, it was mentioned that LA could classify students thoroughly based on the various ways they learn and process information. The data might then be used by teachers to develop various material kinds for differentiated education with their students. LA could also evaluate the behavior and performance of previous students to forecast academic success in the future [28,29,30,31,32,33].
Teachers could utilize this information to compare test results with actual student performance and provide tailored feedback. Social network data and student profiles can also be utilized to forecast future performance and determine how long each student can stay engaged in a course in addition to prior student performance [34]. According to Mangaroska et al. [15], LA that incorporated student data from several educational platforms improved the ability to forecast performance for specific students. Overall, teachers can use the data produced by LA to provide students with personalised support in the classroom. Table 4 summarizes the data (what) and methods (how) used in the selected study for leveraging LA to support personalized learning in the context of individual level.
Table 4.
Data and methods used to support personalized learning with extracted analytics (individual level).
- Classroom/Group Level
At the classroom/group level, in the context of LA, the analysis is focused on understanding and optimizing the collective dynamics, engagement, and performance of students within a specific classroom or group setting. Teachers can then leverage this information to tailor their teaching strategies, address common challenges, and provide targeted support to enhance the overall learning experience for the entire class.
For instance, at the classroom level, LA may assist in analyzing the status of the class during a task, with statistics including the percentage of students who started, submitted, and successfully completed each question [24]. Teachers might better understand how different classes might need assistance with various topics with the aid of such data. The authors also stated that LA may evaluate the difficulty level of each question by taking into account the amount of time spent, the proportion of tries that were successful, and other factors. In the event that students find a question more challenging than they should have, this can assist teachers in identifying any gaps they may have overlooked when teaching a concept.
LA can also identify common mistakes students make, which the teacher can subsequently correct with the class right away. Using a dynamic recommendation system that may suggest both individual and group learning activities to be employed in the classroom, based on students’ profiles, Antonova and Bontchev [35] discovered that LA might benefit teachers. According to Wen and Song [36], LA can be used to depict both group and individual student engagement. Teachers can utilize this to determine which class activities are more interesting, effective, and interactive, and to make the best pedagogical choices. Teachers can use this information to provide more personalized instruction to both groups and individuals.
LA might be used to monitor the caliber of group contributions, allowing teachers to identify areas that needed improvement and offer advice on how to do so for each group [23]. According to Saqr et al. [37], LA could be used to identify group dynamics, or how members of a group interact with one another. To do this, it can be useful to examine how students behave in cooperative groups, paying particular attention to their communication styles, contributions to group debates, and general participation. This could be used to determine the degree to which isolated or active students are, as well as which students are more active. Teachers can use this information to better understand the dynamics of the class and identify students who would need additional targeted guidance or encouragement.
Overall, teachers may utilize the information offered by LA to (1) select the emphasis for each class, (2) recognize any gaps in their explanation, (3) assign students the kind of work they will be most involved in, and (4) keep an eye on group projects and offer tailored support to different groups. Table 5 provides a summary of the data and methods used in the chosen study to employ LA to enhance personalized learning at the classroom/group level.
Table 5.
Data and methods used to support personalized learning with extracted analytics (classroom/group level).
- Structural Level
The structural level refers to the broader institutional and organizational aspects of the educational system. It involves analyzing data and implementing personalized learning strategies at a systemic level, beyond individual classrooms or students. At this level, LA focuses on understanding and optimizing various structural elements of the educational environment.
For example, Llurba et al. [38] revealed that LA may be used to identify students’ emotions at the structural level. Different emotions fluctuate greatly at different times of the day, and students who report feeling the most positive, neutral, and least negative emotions outperform the others. The ability to predict student emotions at different times of the day can greatly assist teachers and school administration in developing lesson plans that will maximize learning for students.
LA could also aid teachers in developing lesson plans, as reported by Troussas et al. [39]. By examining students’ performance against a variety of curricular structures, teaching schedules, teaching techniques, and evaluation technologies, it could be able to identify areas where the educational process is lacking. This could be used to decide if and how the curriculum needs to be altered to better serve the needs of the students. According to Colasante et al. [40], LA could give students more flexibility in their lesson medium. Instead of requiring them to attend in-person lessons, LA could measure their learning outcomes and educate the schools and teachers on the best ways to implement the hybrid curriculum to enhance student learning.
LA could analyze the effectiveness of different learning tools and behaviors for the learning performance of individuals. For instance, a study conducted by Chen et al. [41] revealed a significant positive correlation between learning performance and the use of markers as a learning activity. As a result, teachers can decide which teaching methods to employ or which learning styles to promote in the classroom with such information. By looking at the questions that students attempted and struggled with, Coussement et al. [42] discovered that LA can be used to predict student dropout in online learning and even determine why they dropped out. Concentrating on the areas where students struggle and providing them with personalised support can help teachers and schools create student retention programs that are more effective. Overall, teachers can create more personalised lesson plans and timetables for the students in each batch using the data provided by LA. A summary of the data and methods used in the selected study to employ extracted analytics to improve personalized learning at the structural level can be found in Table 6.
Table 6.
Data and methods used to support personalized learning with extracted analytics (structural level).
3.1.2. Embedded Analytics
LA can also be leveraged to support personalized learning through embedded analytics through (1) feedback collection; (2) the assessment and classification of students with similar profiles; and (3) the creation of a feedback loop. LA firstly enables the collection of information about students’ ability levels and preferred learning styles. According to Moltudal et al. [43], LA can gather information and form insights about students’ abilities both generally and specifically. The LA-enabled technology might be used to continually personalize and adapt the online curriculum and assessment questions to each student’s skill level by feeding the program feedback loop with students’ answers to math problems [43].
LA might be used to track how students use online course materials [44]. LA may automatically reorder the materials according to what students prioritized and gained the most from. Additionally, Niemala et al. [44] stated that LA could evaluate each student’s performance and make recommendations for future work, including connections to helpful resources and activities. Additionally, if some students succeed after implementing the aforementioned advice, LA will automatically give the same advice to other students with a similar profile, creating a continuous feedback loop that continually customizes learning for students.
Additionally, LA could help to automatically classify each student and recommend personalized resources to level up, thus relieving teachers of the burden of differentiated instruction after teachers classify each homework question as easy, medium, or hard and add necessary resources for those who have cleared levels, as reported by Meacham et al. [45]. According to Roberts et al. [46], LA may automatically create a student-customizable dashboard depending on their current skill level, which would include further personalized readings as well as a reminder of any relevant scholarships and competitions based on their interests and areas of strength. Furthermore, LA was able to predict the cognitive states of students and offer personalized learning courses and exams depending on those states [39].
Aside from the above results when the insights from LA are fed into the feedback loop, there are also other benefits. Studies have reported that when the automatic and personalized insights from LA were shown to students, students were more engaged and found the insights useful for reflecting on their learning and progress [47,48,49]. Table 7 displays data and techniques applied in the selected study to enable personalized learning with embedded analytics.
Table 7.
Data and methods used to support personalized learning with embedded analytics.
3.2. The Challenges of LA in Personalized Learning (RQ2)
A total of 16 articles were reviewed to address RQ2. The accuracy of LA insights, privacy concerns, concerns about fairness, and opportunity cost are the key challenges in employing LA to support personalized learning. Table 8 categorizes the article along with the type of challenges.
Table 8.
Types of LA challenges in personalized learning.
- Accuracy
LA results might not always be accurate [43]. Some students might become sick or be absent, which would result in a low level of engagement on platforms that leverage LA. Without sufficient time spent on these platforms, the system may not accurately grade the students, failing to offer them resources and assessments that are appropriately tailored to their ability level. Therefore, for more accuracy in personalizing, it is advised that LA be used in conjunction with other methods of tracking students’ skill levels. Furthermore, Moltudal et al. [43] found that because students frequently do not have to write out their calculations while using online resources, they may simply guess their results, and not all LA technology may be able to pick them up. The personalization’s correctness may be impacted by this. In addition, Wilson et al. [50] highlighted that LA might not always be reliable for projecting students’ success. In this study, LA was used to identify trends in the way that students interacted with the course materials and other students. Following these exchanges, performance forecasts for the students were made. However, this study discovered that there was little connection between online interaction patterns and students’ academic achievement. Therefore, it may be erroneous and thus unhelpful if these predictions provided by LA were used to take further measures to tailor to student learning.
- Privacy
Privacy issues pose a significant barrier to the implementation of LA in education [25,51]. This is due to the uncertainties and worries surrounding the gathering, exploitation, and dissemination of student personal information. Students wanted to know how they compared to the rest of the cohort, but Reimers and Neovesky [52] found that they disliked it if the comparison included personal information. Similar to this, Roberts et al. [46] found that students preferred that all LA elements that enabled comparisons be anonymous. These demonstrate the importance of data privacy to students. As mentioned by Rubel and Jones [53], before LA can be leveraged in education, it is important to determine whether personal data on students can be analyzed, who can view them, and how secure they are. Troussas et al. [39] also highlighted that it is crucial that researchers develop transparency in their processes of data collection, data use, and data sharing if LA is to be used in education. Through the aforementioned techniques, Wintrup [54] reported that student involvement in lessons may increase if privacy concerns are allayed.
- Fairness
Fairness is one of the main challenges in LA. Students valued personalised dashboards and learning materials, but most thought that all students should have access to them [46]. Giving specific materials only to some students may exacerbate the feeling of being profiled and may seem unfair. The study, therefore, suggested that all the information should remain accessible to everyone, even while students can receive tailored recommendations. Furthermore, as found by Uttamchandani and Quick [55], LA may contain the biases of the algorithm, including racial and gender stereotypes, and this may have a negative effect on students’ experiences with and engagement in LA-enabled technology. We found that there are differing levels of algorithmic fairness among LA algorithms, and these variations can have negative effects. According to Riazy et al. [56] and Gartner et al. [57], flaws in the algorithm can make it difficult for LA to forecast students’ outcomes, frequently underestimating the potential of particular student groupings. Similar findings were made by Bayer et al. [58], who discovered that minority groups are unfairly and biasedly analyzed by current LA performance prediction algorithms, which favor the majority group.
- Opportunity Cost
There is a considerable potential cost associated with the use of LA in classrooms [43]. High usage of digital tools in the classroom may discourage creativity and promote bad work habits, which would be detrimental to students’ subject-specific talents. Additionally, employing digital tools during class time takes up time and space, detracting from students’ ability to learn, communicate, and interact physically with topics. Similarly, Knight et al. [59] also stated that the use of LA in the classroom has the opportunity cost of preventing students from concentrating on and devoting much time to ideas other than those identified by LA, even if they may need assistance in those areas. According to Alamri et al. [60], students who spend too much time in online learning may miss out on face-to-face contact with peers and teachers and consequently feel lonely. Carlson [61] also stated that LA-enabled technology should only be used up to a certain point because it cannot replace the activities and interactions that promote holistic student development.
4. Conclusions
The need for an LA approach to personalized learning was first explored in this systematic literature review. Next, we discussed the challenges encountered in supporting personalised learning through LA. The findings show that LA can enable personalized learning primarily in two ways: extracted analytics and embedded analytics. We discovered that LA could offer insights using extracted analytics to direct teacher intervention at the individual, group, classroom, and structural levels. The emphasis of each class is defined by the teacher, blind spots in their instruction are identified and corrected, and personalised lesson plans and timetables are planned to enhance student learning results. These teacher interventions also involve providing focused aid for individuals or groups of students inside the classroom. We also found that LA can automatically adapt learning for students under embedded analytics by gathering feedback, evaluating and categorizing students who share comparable profiles, and establishing a feedback loop for ongoing customization. This is crucial because it can ease the pressure on teachers to organize and carry out differentiated education in the classroom.
Before students receive personalized learning, we recommend combining the insights and comments from LA with teacher observations as there is evidence showing that the automatic insights from LA may not always be accurate. As for privacy, a number of the articles mentioned above demonstrate how privacy worries can be allayed. For better outcomes in terms of student motivation and engagement with LA, we strongly advise developers to take these suggestions and student input into mind. Fairness and opportunity cost are still being researched as problems that need to be resolved. Meanwhile, as previously noted, before moving forward with personalization, we recommend combining the observations and recommendations of LA with teachers’ input. This is so that any biases in the algorithm that can affect the feedback students receive can be checked by the input and observations of teachers.
The findings of this review paper provide insights into LA approaches and how LA be leveraged to support personalized learning and its challenges. In addition, some recommendations for future researchers were provided. However, there are some limitations to this study. Firstly, methodological choices, such as choosing a database and crafting search queries, could skew the results. Furthermore, there were times when some instances of the papers under review were misrepresented, which resulted in gaps in the information coding. It is important to note, nonetheless, that these information gaps were only somewhat present and were not anticipated to have a significant impact on the study’s conclusions. A limited number of articles were reviewed. The selected articles were gathered from only journal articles, books, and published dissertations published in Scopus and ProQuest. Book chapters and other types of publications were not taken into consideration. Hence, future research may include relevant articles published in other databases. Another limitation is that the affordances and challenges of LA mentioned in many research papers heavily depend on the exact software or technology used, as well as the subject. For example, Moltudal et al. [43] reported that there were cases where teachers felt that students could have guessed their math answers in the MSØ software, and the LA could not have picked that up. Nevertheless, Ruipérez-Valiente et al. [24] found that with the use of another technology, Shadowspect, LA was able to differentiate between students mindfully trying to solve a puzzle versus arbitrarily guessing. Therefore, researchers may examine how LA can assist personalized learning for various courses in the future and delve more into the various technologies being employed to compare their affordances and limitations.
It is very important that efforts toward personalized learning are equitable and inclusive. Some studies analyzed in the paper have shown that LA models can contain biased algorithms, which may discriminate against minorities. Hence, future research can focus on developing LA models that effectively cater to diverse students, including those with different backgrounds, languages, and disabilities. It is crucial to ensure that personalized systems do not perpetuate bias and provide effective support for all students. In addition, most of the studies analyzed in this paper focus on short-term interventions and the consequences of using LA for learning. Further research could explore how personalized LA can support students over an extended period. This could involve investigating the impact of LA on students beyond formal education, such as the impact on long-term educational achievement, career success, and life satisfaction.
Author Contributions
Conceptualization, E.T.K.; methodology, E.T.K. and M.K.; writing—original draft preparation, review and editing: E.T.K. and M.K. All authors have read and agreed to the published version of the manuscript.
Funding
This research received no external funding.
Conflicts of Interest
The authors declare no conflict of interest.
References
- Chatti, M.A.; Jarke, M.; Specht, M. The 3P Learning Model. Educ. Technol. Soc. 2010, 13, 74–85. [Google Scholar]
- Makhambetova, A.; Zhiyenbayeva, N.; Ergesheva, E. Personalized Learning Strategy as a Tool to Improve Academic Performance and Motivation of Students. Int. J. Web-Based Learn. Teach. Technol. 2021, 16, 1–17. [Google Scholar] [CrossRef]
- Fung, C.Y.; Abdullah, M.N.L.Y.; Hashim, S. Improving Self-regulated Learning through personalized weekly e-Learning Journals: A time series quasi-experimental study. E-J. Bus. Educ. Scholarsh. Teach. 2019, 13, 30–45. [Google Scholar]
- Ali, A. Exploring the Transformative Potential of Technology in Overcoming Educational Disparities. Int. J. Multidiscip. Sci. Arts 2023, 2, 107–117. [Google Scholar]
- Li, K.C.; Wong, B.T.-M. Features and trends of personalised learning: A review of journal publications from 2001 to 2018. Interact. Learn. Environ. 2021, 29, 182–195. [Google Scholar] [CrossRef]
- Gross, B.; Tuchman, S.; Patrick, S. A National Landscape Scan of Personalized Learning in K-12 Education in the United States. iNACOL, 2018. Available online: https://eric.ed.gov/?id=ED589851 (accessed on 1 May 2023).
- Yuyun, I.; Suherdi, D. Components and Strategies for Personalized Learning in Higher Education: A Systematic Review. In Proceedings of the 20th AsiaTEFL-68th TEFLIN-5th iNELTAL Conference (ASIATEFL 2022), Malang, Java, Indonesia, 5–7 August 2022; Atlantis Press: Dordrecht, The Netherlands, 2023; pp. 271–290. [Google Scholar] [CrossRef]
- Deci, E.L.; Ryan, R.M. The “What” and “Why” of Goal Pursuits: Human Needs and the Self-Determination of Behavior. Psychol. Inq. 2000, 11, 227–268. [Google Scholar] [CrossRef]
- Yeager, S.; Dweck, C. Mindsets that promote resilience: When students believe that per-sonal characteristics can be developed. Educ. Psychol. 2012, 47, 302–314. [Google Scholar] [CrossRef]
- Bulger, M. Personalized Learning: The Conversations We’re Not Having. Data Soc. 2016, 22, 1–29. [Google Scholar]
- Roschelle, J. Learning by Collaborating: Convergent Conceptual Change. J. Learn. Sci. 1992, 2, 235–276. [Google Scholar] [CrossRef]
- Hardison, H. How Teachers Spend Their Time: A Breakdown. Available online: https://www.edweek.org/teaching-learning/how-teachers-spend-their-time-a-breakdown/2022/04 (accessed on 19 April 2023).
- Brown, M. Student to Teacher Ratio in High Schools. Get Access to the World’s Best Online Private Tutors with Learner. Available online: https://www.learner.com/blog/student-to-teacher-ratio-in-high-schools#:~:text=billion%20(Technavio).-,What%20Is%20the%20Average%20Student%2DTeacher%20Ratio%20in%20the%20United,education%20codes%2C%20and%20grade%20level (accessed on 2 November 2022).
- Conole, G.; Gašević, D.; Long, P.; Siemens, G. Message from the LAK 2011 General & Program Chairs. In Proceedings of the 1st International Conference on Learning Analytics and Knowledge, Banff, AB, Canada, 27 February–1 March 2011; Association for Computing Machinery: New York, NY, USA, 2011. [Google Scholar] [CrossRef]
- Mangaroska, K.; Vesin, B.; Giannakos, M. Cross-platform analytics: A step towards personalization and adaptation in education. In Proceedings of the 9th International Conference on Learning Analytics & Knowledge, Tempe, AZ, USA, 4–8 March 2019; pp. 71–75. [Google Scholar]
- Khor, E.T.; Looi, C.K. A Learning Analytics Approach to Model and Predict Learners’ Success in Digital Learning. In Proceedings of the 36th International Conference on Innovation, Practice and Research in the Use of Educational Technologies in Tertiary Education, Singapore, 2–5 December 2019; pp. 476–480. [Google Scholar] [CrossRef]
- Anderson, J.R.; Corbett, A.T.; Koedinger, K.R.; Pelletier, R. Cognitive Tutors: Lessons Learned. J. Learn. Sci. 1995, 4, 167–207. [Google Scholar] [CrossRef]
- Sleeman, D.; Brown, J.S. Intelligent Tutoring Systems; Academic Press: Cambridge, MA, USA, 1982. [Google Scholar]
- Siemens, G.; Baker, R.S.J.D. Learning analytics and educational data mining. In Proceedings of the 2nd International Conference on Learning Analytics and Knowledge, Vancouver, BC, Canada, 29 April–2 May 2012. [Google Scholar]
- Mangaroska, K.; Giannakos, M.N. Learning Analytics for Learning Design: A Systematic Literature Review of Analytics-Driven Design to Enhance Learning. IEEE Trans. Learn. Technol. 2018, 12, 516–534. [Google Scholar] [CrossRef]
- Carroll, C. CASP Selection Criteria and Completion. Social Care Institute for Excellence. Available online: https://www.scie.org.uk/publications/briefings/methodology/files/methodology-casp.pdf?res=true (accessed on 7 October 2004).
- Leitner, P.; Khalil, M.; Ebner, M. Learning analytics in higher education—A literature review. In Learning Analytics: Fundaments, Applications, and Trends: A View of the Current State of the Art to Enhance E-Learning; Springer International Publishing: Cham, Switzerland, 2017; pp. 1–23. [Google Scholar]
- Sousa, E.; Mello, R. Learning analytics to support teachers in the challenge of overcoming the learning gaps in k-12 students. In Proceedings of the Doctoral Consortium of Seventeenth European Conference on Technology Enhanced Learning, Toulouse, France, 12–16 September 2022; pp. 1–7. [Google Scholar]
- Ruiperez-Valiente, J.A.; Gomez, M.J.; Martinez, P.A.; Kim, Y.J. Ideating and Developing a Visualization Dashboard to Support Teachers Using Educational Games in the Classroom. IEEE Access 2021, 9, 83467–83481. [Google Scholar] [CrossRef]
- Vahdat, M.; Oneto, L.; Ghio, A.; Anguita, D. Advances in Learning Analytics and Educational Data Mining. In Proceedings of the European Symposium on Artificial Neural Networks, Computational Intelligence and Machine Learning (ESANN), Bruges, Belgium, 22–23 April 2015; pp. 297–306. [Google Scholar]
- Kleinman, E.; Shergadwala, M.; Teng, Z.; Villareale, J.; Bryant, A.; Zhu, J.; El-Nasr, M.S. Analyzing Students’ Problem-Solving Sequences. J. Learn. Anal. 2022, 9, 138–160. [Google Scholar] [CrossRef]
- Kurilovas, E. Advanced machine learning approaches to personalise learning: Learning analytics and decision making. Behav. Inf. Technol. 2018, 38, 410–421. [Google Scholar] [CrossRef]
- Adebodun, M. The Predictive Value of Academic Analytics and Learning Analytics for Stu-dents’ Academic Success in Higher Education. Doctoral dissertation, Texas Southern University, Houston, TX, USA, 2020. [Google Scholar]
- Alshehri, M.; Alamri, A.; Cristea, A.I. Predicting Certification in MOOCs Based on Students’ Weekly Activities. In Proceedings of the Intelligent Tutoring Systems: 17th International Conference, ITS 2021, Virtual Event, 7–11 June 2021; Proceedings 17. Springer International Publishing: Berlin/Heidelberg, Germany, 2021; pp. 173–185. [Google Scholar]
- Alwadei, A. Adaptive Learning Analytics: Understanding Student Learning Behavior and Predicting Academic Success. Doctoral Dissertation, University of Illinois, Chicago, IL, USA, 2019. [Google Scholar]
- Heo, J.; Chung, K.-M.; Yoon, S.; Yun, S.B.; Ma, J.W.; Ju, S. Spatial-Data-Driven Student Characterization in Higher Education. In Proceedings of the 1st ACM SIGSPATIAL Workshop on Prediction of Human Mobility, Redondo Beach, CA, USA, 7–10 November 2017; pp. 1–4. [Google Scholar]
- Pardo, A.; Mirriahi, N.; Martinez-Maldonado, R.; Jovanovic, J.; Dawson, S.; Gašević, D. Generating actionable predictive models of academic performance. In Proceedings of the sixth international conference on learning analytics & knowledge, Edinburgh, UK, 25–29 April 2016; pp. 474–478. [Google Scholar]
- Sweta, S.; Mahato, S.; Pathak, L.K. Prediction of Learner’s Performance in Adaptive E-Learning System using Learning Analytics. In IOP Conference Series: Materials Science and Engineering; IOP Publishing: Bristol, UK, 2021; Volume 1049, p. 012006. [Google Scholar] [CrossRef]
- Cen, L.; Ruta, D.; Ng, J. Big education: Opportunities for Big Data analytics. In Proceedings of the 2015 IEEE international conference on digital signal processing (DSP), Singapore, 21–24 July 2015; pp. 502–506. [Google Scholar]
- Antonova, A.; Bontchev, B. Designing Smart Services to Support Instructors to Create Personalized and Adaptable Video Games for Learning. Educ. Res. Inf. Soc. 2022, 3372, 9–16. [Google Scholar]
- Wen, Y.; Song, Y. Learning Analytics for Collaborative Language Learning in Classrooms: From the Holistic Perspective of Learning Analytics, Learning Design and Teacher Inquiry. Educ. Technol. Soc. 2021, 24, 1–15. [Google Scholar]
- Saqr, M.; Nouri, J.; Jormanainen, I. A Learning Analytics Study of the Effect of Group Size on Social Dynamics and Performance in Online Collaborative Learning. In Proceedings of the European Conference on Technology Enhanced Learning, Delft, The Netherlands, 16–19 September 2019; Springer International Publishing: Cham, Switzerland, 2019; pp. 466–479. [Google Scholar]
- Llurba, C.; Fretes, G.; Palau, R. Pilot study of real-time Emotional Recognition technology for Secondary school students. Interact. Des. Arch. 2022, 52, 61–80. [Google Scholar] [CrossRef]
- Troussas, C.; Krouska, A.; Virvou, M. Using a Multi Module Model for Learning Analytics to Predict Learners’ Cognitive States and Provide Tailored Learning Pathways and Assessment. In Machine Learning Paradigms; Virvou, M., Alepis, E., Tsihrintzis, G., Jain, L., Eds.; Intelligent Systems Reference Library; Springer: Cham, Switzerland, 2020; Volume 158. [Google Scholar] [CrossRef]
- Colasante, M.; Bevacqua, J.; Muir, S. Flexible hybrid format in university curricula to offer students in-subject choice of study mode: An educational design research project. J. Univ. Teach. Learn. Pract. 2020, 17, 119–136. [Google Scholar] [CrossRef]
- Chen, L.; Yoshimatsu, N.; Goda, Y.; Okubo, F.; Taniguchi, Y.; Oi, M.; Konomi, S.; Shimada, A.; Ogata, H.; Yamada, M. Direction of collaborative problem solving-based STEM learning by learning analytics approach. Res. Pract. Technol. Enhanc. Learn. 2019, 14, 24. [Google Scholar] [CrossRef]
- Coussement, K.; Phan, M.; De Caigny, A.; Benoit, D.F.; Raes, A. Predicting student dropout in subscription-based online learning environments: The beneficial impact of the logit leaf model. Decis. Support Syst. 2020, 135, 113325. [Google Scholar] [CrossRef]
- Moltudal, S.H.; Krumsvik, R.J.; Høydal, K.L. Adaptive Learning Technology in Primary Education: Implications for Professional Teacher Knowledge and Classroom Management. Front. Educ. 2022, 7, 830536. [Google Scholar] [CrossRef]
- Niemelä, P.; Silverajan, B.; Nurminen, M.; Hukkanen, J.; Järvinen, H.-M. LAOps: Learning Analytics with Privacy-aware MLOps. In Proceedings of the 14th International Conference on Computer Supported Education, Virtual Event, 22–24 April 2022. [Google Scholar]
- Meacham, S.; Pech, V.; Nauck, D. AdaptiveVLE: An Integrated Framework for Personalized Online Education Using MPS JetBrains Domain-Specific Modeling Environment. IEEE Access 2020, 8, 184621–184632. [Google Scholar] [CrossRef]
- Roberts, L.D.; Howell, J.A.; Seaman, K. Give Me a Customizable Dashboard: Personalized Learning Analytics Dashboards in Higher Education. Technol. Knowl. Learn. 2017, 22, 317–333. [Google Scholar] [CrossRef]
- Blumenstein, M. Synergies of Learning Analytics and Learning Design: A Systematic Review of Student Outcomes. J. Learn. Anal. 2020, 7, 13–32. [Google Scholar] [CrossRef]
- Kumar, K.; Vivekanandan, V. Advancing learning through smart learning analytics: A review of case studies. Asian Assoc. Open Univ. J. 2018, 13, 1–12. [Google Scholar] [CrossRef]
- Vesin, B.; Mangaroska, K.; Giannakos, M. Learning in smart environments: User-centered design and analytics of an adaptive learning system. Smart Learn. Environ. 2018, 5, 24. [Google Scholar] [CrossRef]
- Wilson, A.; Watson, C.; Thompson, T.L.; Drew, V.; Doyle, S. Learning analytics: Challenges and limitations. Teach. High. Educ. 2017, 22, 991–1007. [Google Scholar] [CrossRef]
- Banihashem, S.K.; Aliabadi, K.; Pourroostaei Ardakani, S.; Delaver, A.; Nili Ahmadabadi, M. Learning analytics: A systematic literature review. Interdiscip. J. Virtual Learn. Med. Sci. 2018, 9, 1–10. [Google Scholar]
- Reimers, G.; Neovesky, A. Student Focused Dashboards—An Analysis of Current Student Dashboards and What Students Really Want. In Proceedings of the 7th International Conference on Computer Supported Education, Lisbon, Portugal, 23–25 May 2015; pp. 399–404. [Google Scholar]
- Rubel, A.; Jones, K.M.L. Student privacy in learning analytics: An information ethics perspective. Inf. Soc. 2016, 32, 143–159. [Google Scholar] [CrossRef]
- Wintrup, J. Higher Education’s Panopticon? Learning Analytics, Ethics and Student Engagement. High. Educ. Policy 2017, 30, 87–103. [Google Scholar] [CrossRef]
- Uttamchandani, S.; Quick, J. An introduction to fairness, absence of bias, and equity in learning analytics. In The Handbook of Learning Analytics; Society for Learning Analytics research: Alberta, CA, USA, 2022; pp. 205–212. [Google Scholar] [CrossRef]
- Riazy, S.; Simbeck, K.; Schreck, V. Fairness in Learning Analytics: Student At-risk Prediction in Virtual Learning Environments. In Proceedings of the 12th International Conference on Computer Supported Education, Prague, Czech Republic, 2–4 May 2020; pp. 15–25. [Google Scholar]
- Gardner, J.; Brooks, C.; Baker, R. Evaluating the Fairness of Predictive Student Models Through Slicing Analysis. In Proceedings of the 9th International Conference on Learning Analytics & Knowledge, Tempe, AZ, USA, 4–8 March 2019; pp. 225–234. [Google Scholar]
- Bayer, V.; Hlosta, M.; Fernandez, M. Learning analytics and fairness: Do existing algorithms serve everyone equally? In International Conference on Artificial Intelligence in Education; Springer International Publishing: Cham, Switzerland, 2021; pp. 71–75. [Google Scholar]
- Knight, S.; Shibani, A.; Shum, S.B. A reflective design case of practical micro-ethics in learning analytics. Br. J. Educ. Technol. 2023, 54, 1837–1857. [Google Scholar] [CrossRef]
- Alamri, H.A.; Watson, S.; Watson, W. Learning Technology Models that Support Personalization within Blended Learning Environments in Higher Education. TechTrends 2020, 65, 62–78. [Google Scholar] [CrossRef]
- Carlson, E. Rethinking Learning Design: Learning Analytics to Support Instructional Scaf-folding in International Schools. Doctoral Dissertation, University of West Georgia, Carroll County, GA, USA, 2020. [Google Scholar]
Disclaimer/Publisher’s Note: The statements, opinions and data contained in all publications are solely those of the individual author(s) and contributor(s) and not of MDPI and/or the editor(s). MDPI and/or the editor(s) disclaim responsibility for any injury to people or property resulting from any ideas, methods, instructions or products referred to in the content. |
© 2023 by the authors. Licensee MDPI, Basel, Switzerland. This article is an open access article distributed under the terms and conditions of the Creative Commons Attribution (CC BY) license (https://creativecommons.org/licenses/by/4.0/).