Article

Investigation of Progressive Learning within a Statics Course: An Analysis of Performance Retention, Critical Topics, and Active Participation

Civil and Environmental Engineering and Construction, University of Nevada Las Vegas, Las Vegas, NV 89154, USA
*
Author to whom correspondence should be addressed.
Educ. Sci. 2023, 13(6), 576; https://doi.org/10.3390/educsci13060576
Submission received: 26 February 2023 / Revised: 30 April 2023 / Accepted: 21 May 2023 / Published: 2 June 2023
(This article belongs to the Special Issue Assessment and Evaluation in Higher Education—Series 3)

Abstract

:
Previous research has demonstrated a link between prior knowledge and student success in engineering courses. However, while course-to-course relations exist, researchers have paid insufficient attention to internal course performance development. This study aims to address this gap—designed to quantify and thus extract meaningful insights—by examining a fundamental engineering course, Statics, from three perspectives: (1) progressive learning reflected in performance retention throughout the course; (2) critical topics and their influence on students’ performance progression; and (3) student active participation as a surrogate measure of progressive learning. By analyzing data collected from 222 students over five semesters, this study draws insights on student in-course progressive learning. The results show that early learning had significant implications in building a foundation in progressive learning throughout the semester. Additionally, insufficient knowledge on certain topics can hinder student learning progression more than others, which eventually leads to course failure. Finally, student participation is a pathway to enhance learning and achieve excellent course performance. The presented analysis approach provides educators with a mechanism for diagnosing and devising strategies to address conceptual lapses for STEM (science, technology, engineering, and mathematics) courses, especially where progressive learning is essential.

1. Introduction

In Fall 2019, almost 20 million students attended American colleges and universities, and approximately 625,000 of those students were registered in an undergraduate engineering program [1,2]. However, approximately 30% of engineering students drop out before their second year [3], and 60% of dropouts occur within the first two years [4]. To address and reduce the dropout rate, it is important to understand the casual factors and develop appropriate remedies to prevent dropouts at their root cause.
An educational psychology study [5] concluded that a lack of prior knowledge is one of the contributing factors to high dropout rates in engineering students. Students who have to play catch-up may become disenchanted with their engineering degree program [6]. Past research used both qualitative and quantitative approaches to demonstrate positive correlations between prerequisite knowledge and performance in subsequent courses [7,8,9,10,11,12,13]. The observed positive correlations indicate progressive knowledge development from course to course, which is reflected in the engineering curriculum in the form of prerequisites [14]. However, past studies have paid insufficient attention to in-course knowledge progression, which refers to knowledge progression within a course. Understanding how knowledge attained in an earlier stage can be demonstrated in advanced forms within a course can help educators better manage student activities, leading to improved student performance and reduced student dropout rates.
Accordingly, this study was guided by the following research question: what are the relationships and insights for in-course knowledge progression, specifically in terms of how knowledge attained in earlier stages can be demonstrated in advanced forms within a course? After conducting an exhaustive literature review, we were unable to identify studies that specifically examined in-course relations in a manner that is directly relevant to our research. The existing studies that we found focused on inter-course relationships, which are not applicable to our investigation needs. As a result, we have identified three aspects (i.e., performance retention, critical topics of progressive learning, and progressive course interaction) that we believe are relevant to our research through a process of intuition and deduction.
To address the research question with regards to the three aspects, this study explores one of the fundamental civil engineering courses: Statics. A course taken in the first year of engineering is a timeframe that is crucial for academic success [15]. Mathematical and physical concepts are applied to solve problems, and the course’s topics dependent on each other, making it an ideal candidate to analyze in-course knowledge progression. In accomplishing this, the study collected data over five semesters from 222 students and conducted follow-up analyses at various levels on student activities and performance to identify the relations and insights for in-course progressive learning.

2. Objective and Scope

Every engineering course is made up of interconnected topics that build on one another. Therefore, this study focuses on student performance and activities in one of the core civil engineering courses, Statics, to investigate in-course progressive learning in regard to three aspects: performance retention, critical topics of progressive learning, and progressive course interaction. The study aims to examine how progressive learning is reflected in performance retention, identify critical topics that govern student performance progression, and explore whether active student participation can serve as an indicator of progressive learning and its relation to overall student performance.
The study’s outcomes will provide instructors a reference on how to identify progressive learning patterns and critical topics in a course instruction timeframe. This can potentially contribute to the development of strategies to manage course activities at both macro and micro levels, identify at-risk students, provide extra support for those struggling with critical topics, and offer course guidance based on progressive learning and performance retention. This study does not consider the relation between students’ socioeconomic conditions and student performance and does not factor in the psychological states of the students or instructor.

3. Background of Statics

Statics is one of the first core engineering courses that students enroll in after taking prerequisite courses in foundational mathematics and sciences [16,17]. This course provides a knowledge foundation for advanced courses such as dynamics, strength of material, and structural analysis [18]. Additionally, educators have cited weakness in Statics as a significant cause of difficulties for students in progressing on follow-up courses [19,20], which can extend students’ time to graduate [21]. As such, Statics plays a crucial role in their engineering educational path of students. Our university’s institutional data support these findings [20], with its historical data indicating a high percentage of students with DWIF (i.e., D grade, withdrawal, incomplete, failure) ratings from Statics, which further causes delays in student progression toward degree completion. Based on the discussed backgrounds and deduced reasons, this research selects Statics as the course under investigation to accomplish the research objective.

3.1. Statics Topics and Their Interrelations

Statics topics are built upon one another, implying possible interrelations among students’ performance, knowledge retention and in-course topic development. Figure 1 illustrates topics generally included in a Statics course, such as force vector, free body diagram (FBD), equilibrium of particles of rigid bodies, moments of forces, truss, frames, internal forces. These topics provide sequential knowledge development and progression that require knowledge gained from previous topics to comprehend and apply to forthcoming topics. Adequate understanding must be developed by students to connect the gained knowledge to new situations [22]. Therefore, an insufficient understanding of earlier topics may hinder the learning of subsequent topics in a progressive fashion. For example, without appropriate knowledge of FBDs and equilibrium equations (EEs), which many students find difficult [23], it is almost impossible to properly develop problem-solving steps (involving FBD and EEs) and solve problems related to trusses, frames and machines, friction, and internal forces.
The in-course topic relations and their interdependencies (Figure 1) are natural given the roles of the preceding topics in Statics. The first four topics in Figure 1 help students develop reasoning and logical skills related to physical systems, interpret the interactions between forces and bodies, and apply mathematical operations [24,25,26]. These skills are then used in the subsequent knowledge development in topics five to seven, where they are studied in actual engineering systems. A strong understanding of the previous topics is needed to comprehend topics eight and nine, which prepare students to analyze and design cross sections in accordance with anticipated forces for structural elements to resist, a concept that is eventually covered in a future course.

3.2. Hypothesis

Based on the previous discussion, we set a hypothesis. Given in-course topics that require sequential knowledge development, progression will be observable through performance in student activities and evaluations, where meaningful patterns, trends, insights and implications can be found. To test this hypothesis, our data analyses and discussions focus on the following three aspects: (1) progressive learning as reflected in performance retention; (2) the identification of critical topics that have more significance than others to student learning progression, if in-course topics are related; and (3) student active participation as an indicator of positive progressive learning. We decided to investigate the third aspect additionally because, after working on this educational research over three years, we realized that many (challenged) students tend to procrastinate rather than actively and punctually participating in course activities throughout the semester. If knowledge progression is critical, this surrogate measure may provide meaningful insights.

4. Data Collection

4.1. Data Source and Attributes

This study collected data from Statics courses within the civil engineering program at a state public university in the western United States. To ensure consistency in data processing and analysis, this study used data from the same instructor from the course over five semesters. The curricular content remained the same, minimizing potential biases with multiple instructors and differences in their teaching styles, methods, and evaluations. The instructor used a consistent rubric system to grade submissions, ensuring uniformity in assessing student performance. The sample included 222 students across five semesters (i.e., Fall 2019, Spring 2020, Fall 2020, Spring 2021, and Fall 2021). Fall 2020 had the largest class size (i.e., 66 students), while Spring 2021 and Fall 2021 had the smallest class size (i.e., 36 students each). For each student, individual performance scores on homework, exams, attendance, and final grades were collected along with all submitted and graded materials.
The course had nine major clusters of sequential topics, which correspond to the topics in Figure 1. After the completion of significant context (e.g., a cluster of topics), students submitted homework assignments for assessment of fundamental knowledge and problem-solving skills. Each exam covered several topics for which students completed homework assignments. Three cumulative exams took place. Table 1 presents the topic connections to corresponding homework and exams, with all exams being cumulative. The overall structure of the course portrays how exams and homework are connected.

4.2. Data Preparation

The data preparation process involved compiling and filtering scores from different semesters for follow-up analysis. We compiled data collected over five semesters, consisting of different score ranges for various student activities, such as homework, exam, and attendance. For uniform comparison, we scaled all the student activity scores from 0 to 100 and categorized them into three performance categories: low (scores below 70), medium (scores above 70 and below or equal to 85), and high (scores above or equal to 85). Table 2 displays the classification of the performance categories. Note that the passing grade (a score of 70) is used to set the low performance category, and the remaining score range from 70 to 100 is partitioned to two categories.
After compiling and processing the data, we identified potential outliers—data that are not meaningful and potentially introduce undesired trends/statistical inferences—and removed them. First, we removed data from 27 students who either dropped out or withdrew from the course. Their incomplete data over nine homework submissions and three exams would have polluted and hindered our ability to acquire meaningful information—performance progression throughout the semester. As our study focused on in-course progressive learning, we considered student data that completed and participated in the course from beginning to end.
Second, to reduce potential bias in the analysis, we adjusted the homework scores (by divided them into half) for students who were identified as recurrently using a solutions manual to complete their homework and failed to perform well in the exam. To identify such students, we used several criteria as follows:
  • Highly similar sequence between the solution manual and student homework while there are multiple possible sequences to be taken.
  • Equation/solution details (e.g., order of values in equations, use of notations).
  • High similarity of FBD and/or figures between solution manual and homework.
  • Skipping steps covered in class to solve the problem.
  • Different notation and sign conventions compared to the instructor’s teaching.
We developed these criteria based on the high similarity between the solutions provided by the students and those available in solutions manuals. Similarity between a solution’s manual and a student’s work is obvious in many cases. For example, solutions manuals usually skip minor but important steps, which its absence is likely to hinder the solution development process especially for a student learner with a novice’s perspective. Moreover, students who use a solutions manual do not necessarily follow the class-taught sign convention in FBD development. The instructor strictly followed the same sign convention in FBD development and emphasized to follow the taught sign convention in FBD until students go through sufficient practices and thus are able to develop the directions of unknown forces in FBD in well-estimated true directions. Finally, the similarity in solutions can be easily identified based on the way students express their equations. Certain problems have multiple options to find their solutions. For example, truss problems can be solved using various sequences (e.g., order of joints and order of equations per joint). In addition, an equation may have several combinations of additions, multiplications, and divisions, and it can be developed with numerical values (e.g., decimals and fractions) and parameters. When these are too similar for most of the homework problems, such submissions were marked with a flag for further investigation.
Our years-long observation reveals that high performing students typically do not encounter flags based on these criteria, while a sizeable portion of the low performing students do. More specifically, several low performing students performed extremely well on homework assignments (with higher averages on homework assignments than high performing students) yet extremely poorly on exams. The course is designed with considerably more demanding levels of homework problems than those from exams; therefore, significantly lower performance (e.g., demonstrating levels of understanding and presenting problem-solving steps) on exams than on homework assignments, despite considering exam pressure, are not reasonable.
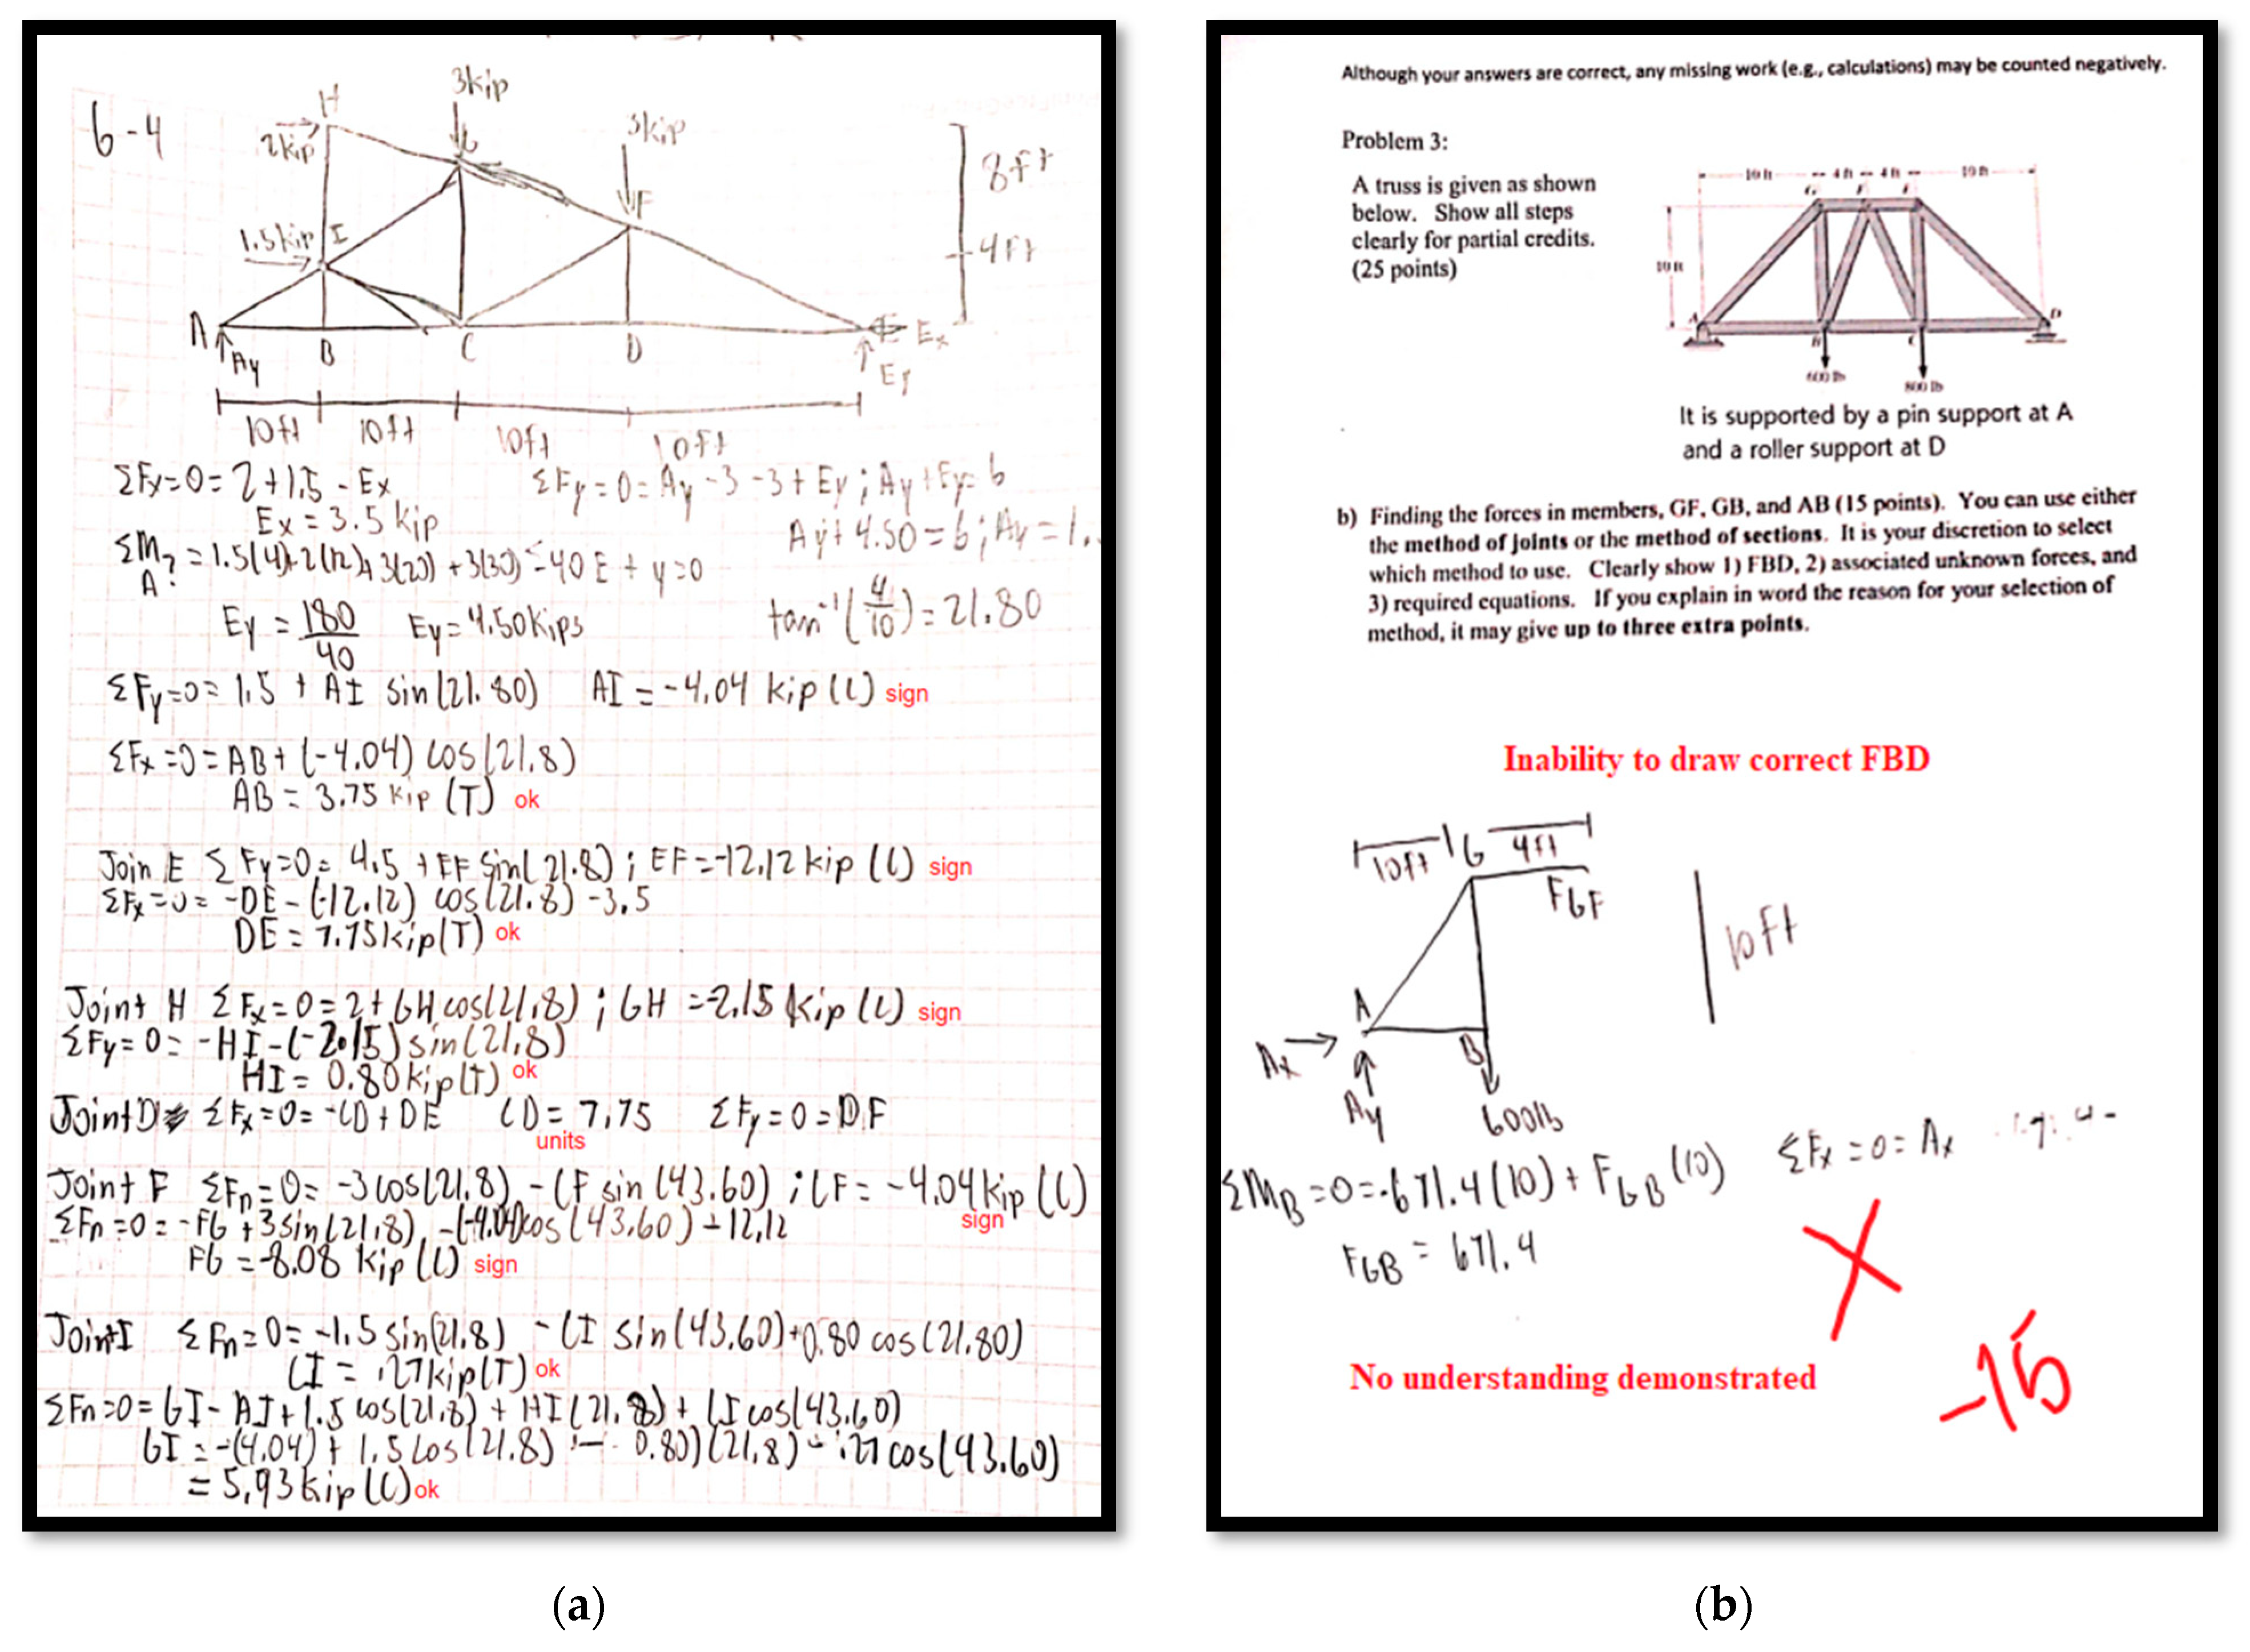
Such students who perfectly performed in homework fail to demonstrate any understanding in exams. Figure 2 provides an example of one of these cases by presenting a truss problem that a student solved correctly in their homework (Figure 2a) but failed to solve during the corresponding exam (Figure 2b). Solving a truss problem like the one in Figure 2a without properly drawing FBD is highly difficult, even for instructors. Without having FBDs, it becomes too complicated to keep track of forces from joints in subsequent joint analyses; however, the student did this homework problem perfectly without presenting proper work. Additionally, the notations and sign conventions used to solve this homework problem were different from what the instructor taught. Despite these irregularities, the student developed perfect numerical answers to the homework problem. However, when this work was checked against our criterial mentioned above, the student homework solution did not pass several of the criteria. In contrast, reviewing the same student’s work on a truss problem on an exam (Figure 2b), it is clear that the student failed to demonstrate any level of understanding. The student failed to develop a correct FBD, and thus failed to develop proper equations and left the solution incomplete.
It is essential to note that homework data does not reflect the true understanding of the students. For the sake of analysis, we did not eliminate such data because it would completely eliminate a big portion data corresponding to the low-performing students, which are critical for our research. To better reflect their insufficient understanding, we penalized the scores of such homework and divided them by half. All the data we present henceforward are after the penalization of scores and removal of students who dropped the course.

5. Analysis, Results, and Discussion

To achieve the objective of the research, we analyzed student progression using homework and exam data collected over multiple semesters. Homework and exams serve as fundamental tools to reinforce and measure student learning. Homework evaluates student learning on individual topics or a cluster of topics, whereas exams comprehensively assess student learning on cumulative topics covered across multiple homework assignments. This paper delves into three aspects of progressive learning: performance retention, critical topics, and progressive course interaction.

5.1. Performance Retention

This section examines the first aspect of our analysis, which is the reflection of progressive learning in performance retention. We take a systematic analysis of student performance across exams and homework. As shown in Figure 3, we first split students into three groups based on their scores in the first exam (i.e., High, Medium, and Low). Then, we further split each group into three sub-groups based on their scores for the second exam. Finally, we split each sub-group based on their scores for the third exam. This splitting strategy enables us to observe performance retention across different exams. For example, a student who maintained high performance over the three exams would be in the H1-H2-H3 group. Similarly, students who constantly underperformed in all exams would be in the L1-L2-L3 group.
We applied the same splitting strategy for the homework scores as we did for the exams. Since there are nine homework assignments in the data, we group them into three sets (i.e., set 1: homework one to four, set 2: homework five to six, and set 3: homework seven to nine). Each set corresponds directly to subsequent exams, as shown in Table 1. To reduce the number of subgroups generated during the splitting strategy, we computed the average score for each set.
Using this approach, we first divided 195 students into three groups based on their scores (i.e., high, medium, and low) on exam 1 and homework set 1 separately; we further carried out two additional splitting processes to account for exam 2 and homework set 2, and exam 3 and homework set 3. The splitting strategy generated 27 groups for both exams and homework. The following subsections present and discuss the findings from the groups regarding performance retention and its implications for exams and homework.

5.1.1. Exam Performance Retention

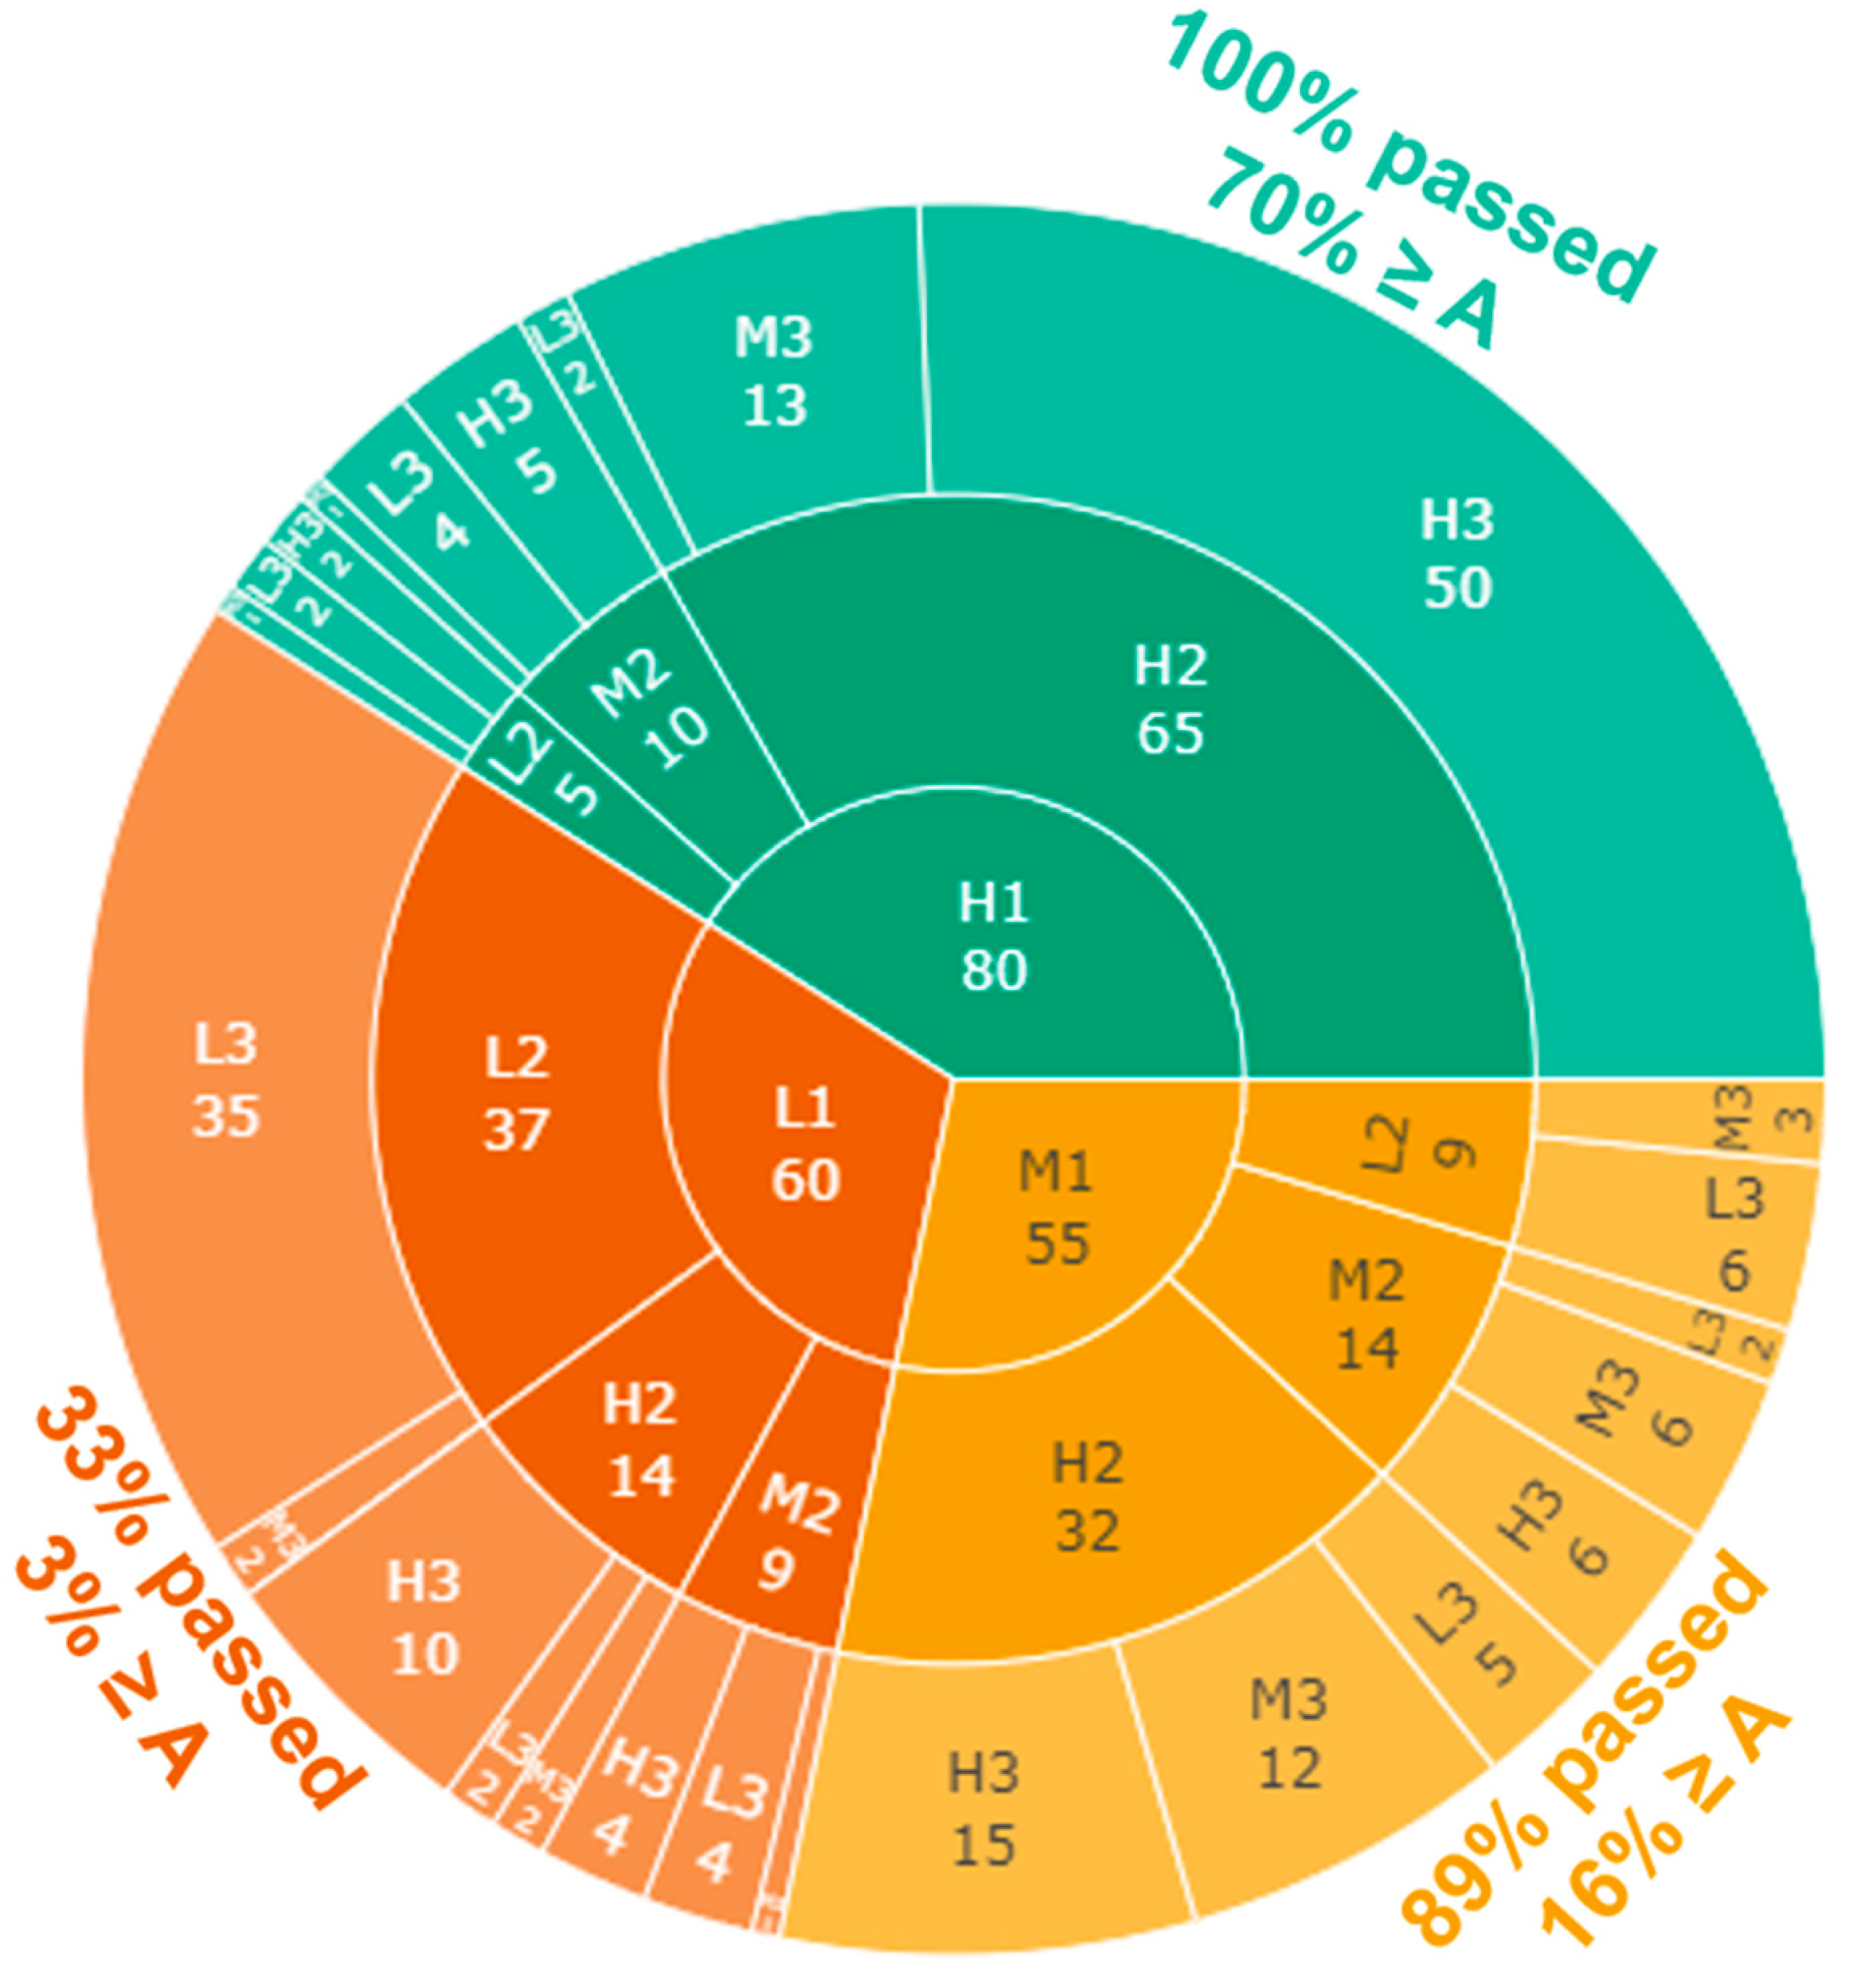
Figure 4 illustrates the exam-wise performance progression of all the students, where the inner, middle, and outer circles correspond to exam 1, exam 2, and exam 3, respectively. The categories within the circles correspond to the number of students that obtained High (H), Medium (M), and Low (L) scores for each exam.
The analysis of Figure 4 reveals the following insights about performance retention, which we analyze based on the initial performance (scores on exam 1) to observe the progression along the rest of the course (exams 2 and 3).
  • High scores on exam 1: Out of the 80 students in this group, 65 (81.2%) maintained a high score on exam 2; and of these 65 students, 50 (76.9%) maintained a high score in exam 3. Not a single student in this group failed the course; 70% obtained a final grade of A; and 90% obtained a final grade of B or better. These findings demonstrate that a high proportion of students who developed a good understanding early on are more likely to retain the same level of high performance and successfully complete the course without failing. This indicates that performance retention is clearly found among students who build a good understanding from the beginning. In other words, early-on understanding is critical in this course for knowledge progression and retention.
  • Medium scores on exam 1: Out of the 55 students in this group, 46 (83.6%) achieved the same or better levels (i.e., medium or high) of performance on exam 2; out of these 46 students, 39 (84.7%) achieved a medium or high score on the final exam 89% of the students in this group successfully passed the course, with 11% of the students in this group failing. More specifically, 16% obtained a final grade of A, which is significantly less than that of the students who received high scores on exam 1 while 61.8% of the students in this group received a grade of B or better for the final grade. These results indicate that students who develop an acceptable level of understanding early on either maintained or improved on that performance. Most of them achieved acceptable final grades and successfully completed the course without failing. However, depending on their follow-up progression, some students in this group may still fail the course or achieve a high final grade.
  • Low scores on exam 1: Out of the 60 students in this group, 37 (61.6%) obtained a low score on exam 2; out of these 37 students, 35 (94.5%) maintained the low score in exam 3. Moreover, 67% of the students in this group failed the course, and only 3% obtained a final grade of A. From exam 1 to exam 2, about 30% of the students improved their performance. However, from exam 2 to exam 3, only 5% improved their performance. This indicates that low performance on exam 1 is strongly associated with the continuous low performance, and low performance on exam 2 is extremely strongly associated with the continuous low performance. This suggests that building a weak understanding from the beginning makes it difficult for them to recover or properly learn. Although some students may overturn low performance on exam 1 and achieve satisfactory or high final grades, the number of such students is insignificant.

5.1.2. Homework Performance Retention

Figure 5 illustrates the homework-wise performance progression of all the students, where the inner, middle, and outer circles correspond to homework set 1, 2, and 3, respectively. Within each circle, students are categorized based on their performance for each homework set, and the numbers of the students in the categories are displayed.
The analysis of Figure 5 reveals the following insights about performance retention, which we analyze based on the initial performance (scores on homework set 1) to observe the progression along the rest of the course (homework sets 2 and 3).
  • High scores on homework set 1: From the 128 students in this group, 82 (64.1%) maintained a high score on homework set 2; from these 82 students, 64 (78.1%) maintained a high score on homework set 3. Approximately 80% of the students in this group passed the course, and 42% obtained a final grade of A. These findings demonstrate that students who develop a good understanding from the beginning retain the same level of high performance till the end, and most of them successfully complete the course without failing. This result generally corroborates our findings related to exam performance retention that performance retention is clearly found among students who build a good understanding from the beginning. However, there is a notable number of students, worth noting, who had a significant drop in performance to low homework performance from homework set 2. An additional, separate analysis indicates that many students from this group performed poorly on exam 1. Although we are unable to prove this with hard evidence or data, these students may have learned completion of homework without a proper understanding of the material is not helpful for their exam performance and overall knowledge retention, and stopped using extra resources (e.g., solutions’ manual) to complete their homework.
  • Medium scores on homework set 1: In total, 44 students were identified to initially be in this group. As this is the medium performing group, the spread of the performance on the next homework sets covers more broadly than the other groups. Considering the performance in homework set 2, the 44 students are distributed to 24, 14, and 6 in low, medium and high groups (L2, M2, and H2), respectively. A larger proportion is found in the low performance (L2) group from M1. The same true considering the third homework set: there are more students in L3 than the other groups, M3 and H3. From this student distribution in subsequent homework sets, we claim a medium level performance presents challenges to improve performance in subsequent learning; however, it is not impossible to improve as a small portion of students were able to improve their performance while majority struggled with lower performance. From this group (M1), 22% of the students received an A grade, 32% failed the course, and 68% passed the course. Given the importance of initial topics of statics serving the fundamental basis of later topics, these results are deemed reasonable.
  • Low scores on homework set 1: From the 23 students in this group, 20 (86.9%) maintained the same level of performance at a low score on homework set 2; from these 20 students, 17 (85%) maintained a low score on homework set 3. Moreover, 44% of students in this group—a significant portion—failed the course and only 19% obtained a final grade of A. These findings demonstrate that on homework, almost all students who develop a poor understanding early on retain the same level of low performance on subsequent assessments, and almost half of the students fail to pass the course. This corroborates exam retention findings that performance retention negatively builds among students who attain a poor understanding from the beginning.
This is important to note that the homework results and corresponding analyses may not be highly consistent with the trends/insights identified by the exam analysis and reveal less insightful results. This is, however, within an acceptable variation considering several factors: (1) retake students tend to pay less attention to homework, (2) a number of unethical homework submissions are found, (3) homework is highly demanding with many problems in each homework assignment and more difficult, requiring effort and time to complete; these reasons may have produced a small level of irregularity in data (score) distribution. Examples of irregularity between homework and exam are cases where (1) well performing students often have low homework scores while demonstrating very well through attempted problems in exams and (2) low-performing students sometimes have high homework scores.
The analysis of exam and homework performance scores in exam performance retention and homework performance retention sections indicates clear associations between course topics and student performance in progressive learning. In other words, comprehension and application of previously learned topics play an important role in successfully learning subsequent topics. Students’ retention of performance scores reflected the progressive learning throughout the course, which support our hypothesis. In Statics, performance consistency is essential for successful learning. Therefore, students who learn and perform well from the beginning tend to build on that positive performance and succeed in the course. In contrast, the students who fall behind build on that negative performance and hardly recover.

5.2. Critical Topics

The investigation of critical topics focuses on identifying the course contents/topics that may lead to students’ course failure when insufficiently or inadequately learned. Insufficient learning can result in various progression paths as shown with the 27 cases from the prior analyses on homework and exams. Examples of challenged students include students who exhibit low performance throughout the semester; students who have satisfactory perform at the beginning but perform differently over time; and students who demonstrate low performance at the beginning, then catch up with slight improvement in performance, but eventually fail to recover. If critical topics exist and they are not properly understood, these may hinder student learning progression and catch-up efforts due to being so critical in learning of subsequent topics. Existence of such topics should have clear effect on subsequent learning, and accordingly this investigation is to identify critical topics in the student’s learning paths.
The investigational approach especially focused on identifying critical topics for students who exhibited low performance and failed the course, as their learning conditions are the most sensitive to critical topics, resulting in course failure and as medium or high-performing students completed the course satisfactorily and may not substantially be challenged by critical topics. In doing so, we divided the students based on their exam performance first, as described in the Exam Performance Retention section. Further, we identified groups that contained students that failed to pass the course.
The above analyses yielded four groups from where students failed the course, and the four groups are “L1-L2-L3,” “M1-L2-L3,” “L1-L2-M3,” and “L1-M2-L3” groups, which contained 35, 6, 2, and 4 students, respectively. Due to the low sample size in some of the groups, we first combined and analyzed all failing students into a single group—a single group that includes all students who failed the course—and then we separately analyzed low performing students (“L1-L2-L3”), where we have a comparatively large sample size. This group not only offers the largest sample size but also represents the group that was challenged the most significantly with continuously low performance. This will allow us to find critical topics of all the failing students as well as for the students who consistent exhibited a low performance. The identification of critical topics pertains to performance progression analysis by score and identification of points over time progression where students noticeably fall behind and are unable to catch up or perform poorly. Such points can be considered as critical points where reinforcement can substantially benefit students in successfully taking and succeed in the course and instructors in providing course instructions that naturally fill loopholes and thus better managing the course and its students.
In observation of student homework progression by score, we use as a comparison baseline the homework scores for high-performing students (students with high scores on all exams), as they represent the ideal case for learning, which was the cases for the largest portion (64 students) out of the 27 groups. This baseline is important because it removes the effect of drops in performance given by difficult topics, for which even high-performing students may struggle. The use of the baseline comparison allows relative comparisons of the concerned student group with the ideal student group so that we can monitor how much knowledge gaps are created along with their learning paths over time.
In the next two subsections, we present the analysis results for all the failing students and the continuously low-performing students.

5.2.1. Critical Topics for All Failing Students

This section analyses the homework scores for all the failing students compared to the student group, high-performing students (H1-H2-H3), with ideal learning progression over the semester. Figure 6 illustrates the progression in homework scores for both groups and further offers an important measure for performance progression. The vertical lines indicate the gap in scores between the groups, which explain differences in learning and performance. The failing students obtained acceptable scores from homework 1 to 4. Based on the plots and their relative changes from homework 1 to 4, the two groups show similar patterns, that is the lines have similar patterns. However, there are two noticeable differences: (1) the absolute grades of the ideal group range from 85.0 to 95.3, which is considered as high performing while those of the failing students are between 73.6 and 82.1, which is a low C grade to a low B grade at best, based on the standard grading scale, and (2) the gaps between the two groups are gradually widened, which is further discussed in the following paragraph.
Starting at homework 5, the failing students experienced a sharp decline in homework scores compared to high performing students. The data indicates that, after this initial decline, the students do not recover but continue to perform poorly until the end of the course.
To expand the previously discussed results, we conducted an in-depth analysis of the gaps in scores between the failing and high performing students. Figure 7 presents the score differences (the vertical gaps in Figure 6) between these two groups of students across homework assignments which is computed by subtracting the failing students’ scores from the high performing students’ scores individually for each homework. To better illustrate the variation in score differences, the plot includes the slope values between each pair of homework. A positive slope value indicates that the gap in scores increased whereas a negative value indicates the gap decreased.
The results in Figure 6 and Figure 7 reveal the following insights:
  • Based on Figure 7, from homework 4 to homework 5, the gap in scores for the failing students experienced the most drastic increase.
  • Based on Figure 6, from homework 5 to the following homework assignments, there is no significant increase in performance, which implies that the students continue to suffer at a low grade.
  • The failing students maintained a constantly low performance on homework 5 to 9 at 62.0, 49.6, 49.6, 56.3, and 47.3, respectively.
  • On homework 8, their performance improved; however, on homework 9, again, a significant drop in performance occurs.
The first observation reveals that students who fail are struggling significantly with homework 5, which covers topics such as free-body diagram, equilibrium, two force member, and support. These concepts are essential takeaway from a Statics course and are necessary in further subsequent chapters, including trusses, frames and machines, friction, and internal forces. The second and third observations support this, showing consistently low homework performance in the following homework assignments. These findings are in line with the instructor’s subjective observation, which was based on the instructor’s experience over the period of data collection and analysis.
In addition, we conducted a set of t-tests to analyze the nine homework scores of the all failing students and H1-H2-H3 group. Table 3 displays the p-values and statistical significance for the differences in homework scores. The results indicate that, based on the observed data, the differences in homework scores for the all failing students and H1-H2-H3 group are statistically significant, with the exception of homework 1. One possible explanation for the lack of statistical significance for homework 1 could be that it requires the recall of prerequisite concepts in Newtonian physics and calculus. As student performance on these concepts can vary widely, it may have led to more variability in the scores for homework 1 compared to the other homework assignments. This increased variability could have made it more difficult to detect statistically significant differences between the groups on this particular assignment.
In light of these findings, we conclude that (1) topics covered up to homework 4 form the foundation of Section 5. The instructor’s opinion corroborates this, as the foundational knowledge of forces, concept of FBD and equilibrium (with a focus on particles in earlier chapters), moments and distributed loads are essential components to the learning of the equilibrium of a rigid body, the major topic covered in homework 5. Moreover, understanding these concepts is essential to compute reactions prior to conducting further structural/system analysis (e.g., trusses, frames and machines, friction, and internal forces). In other words, topics covered up to homework 5 provide the foundation of understanding and succeeding in the topics covered in homework 6 and 7.
Homework 8 covers centroid, which does not critically depend upon knowledge from the previous topics and is typically considered as a relatively easy topic; therefore, accordingly, we observed a slight increase in performance in homework 8, which still is low performance. A further drop in performance is found from homework 8 to 9, which is easily explained by the topics of centroid being the requirement of the learning of the moment of inertia from homework 9.
As presented and discussed with the analyses, students who fail to build an appropriate understanding of key topics, such as free-body diagram, equilibrium, two-force member, and support, struggle to solve problems on later topics. Thus, this demonstrated that the lack of understanding of these core topics critically affects students’ learning progression, and their outcome inevitably results in them failing the course. In sum, we conclude that topics up to homework 4 considerably critical to the learning of topics covered in homework 5. The topics covered in homework 5 is progressively critical to the subsequent topics. In addition, the topics covered in homework 8 is critical to the learning of topics covered in homework 9.

5.2.2. Critical Topics for Continuously Low-Performing Students

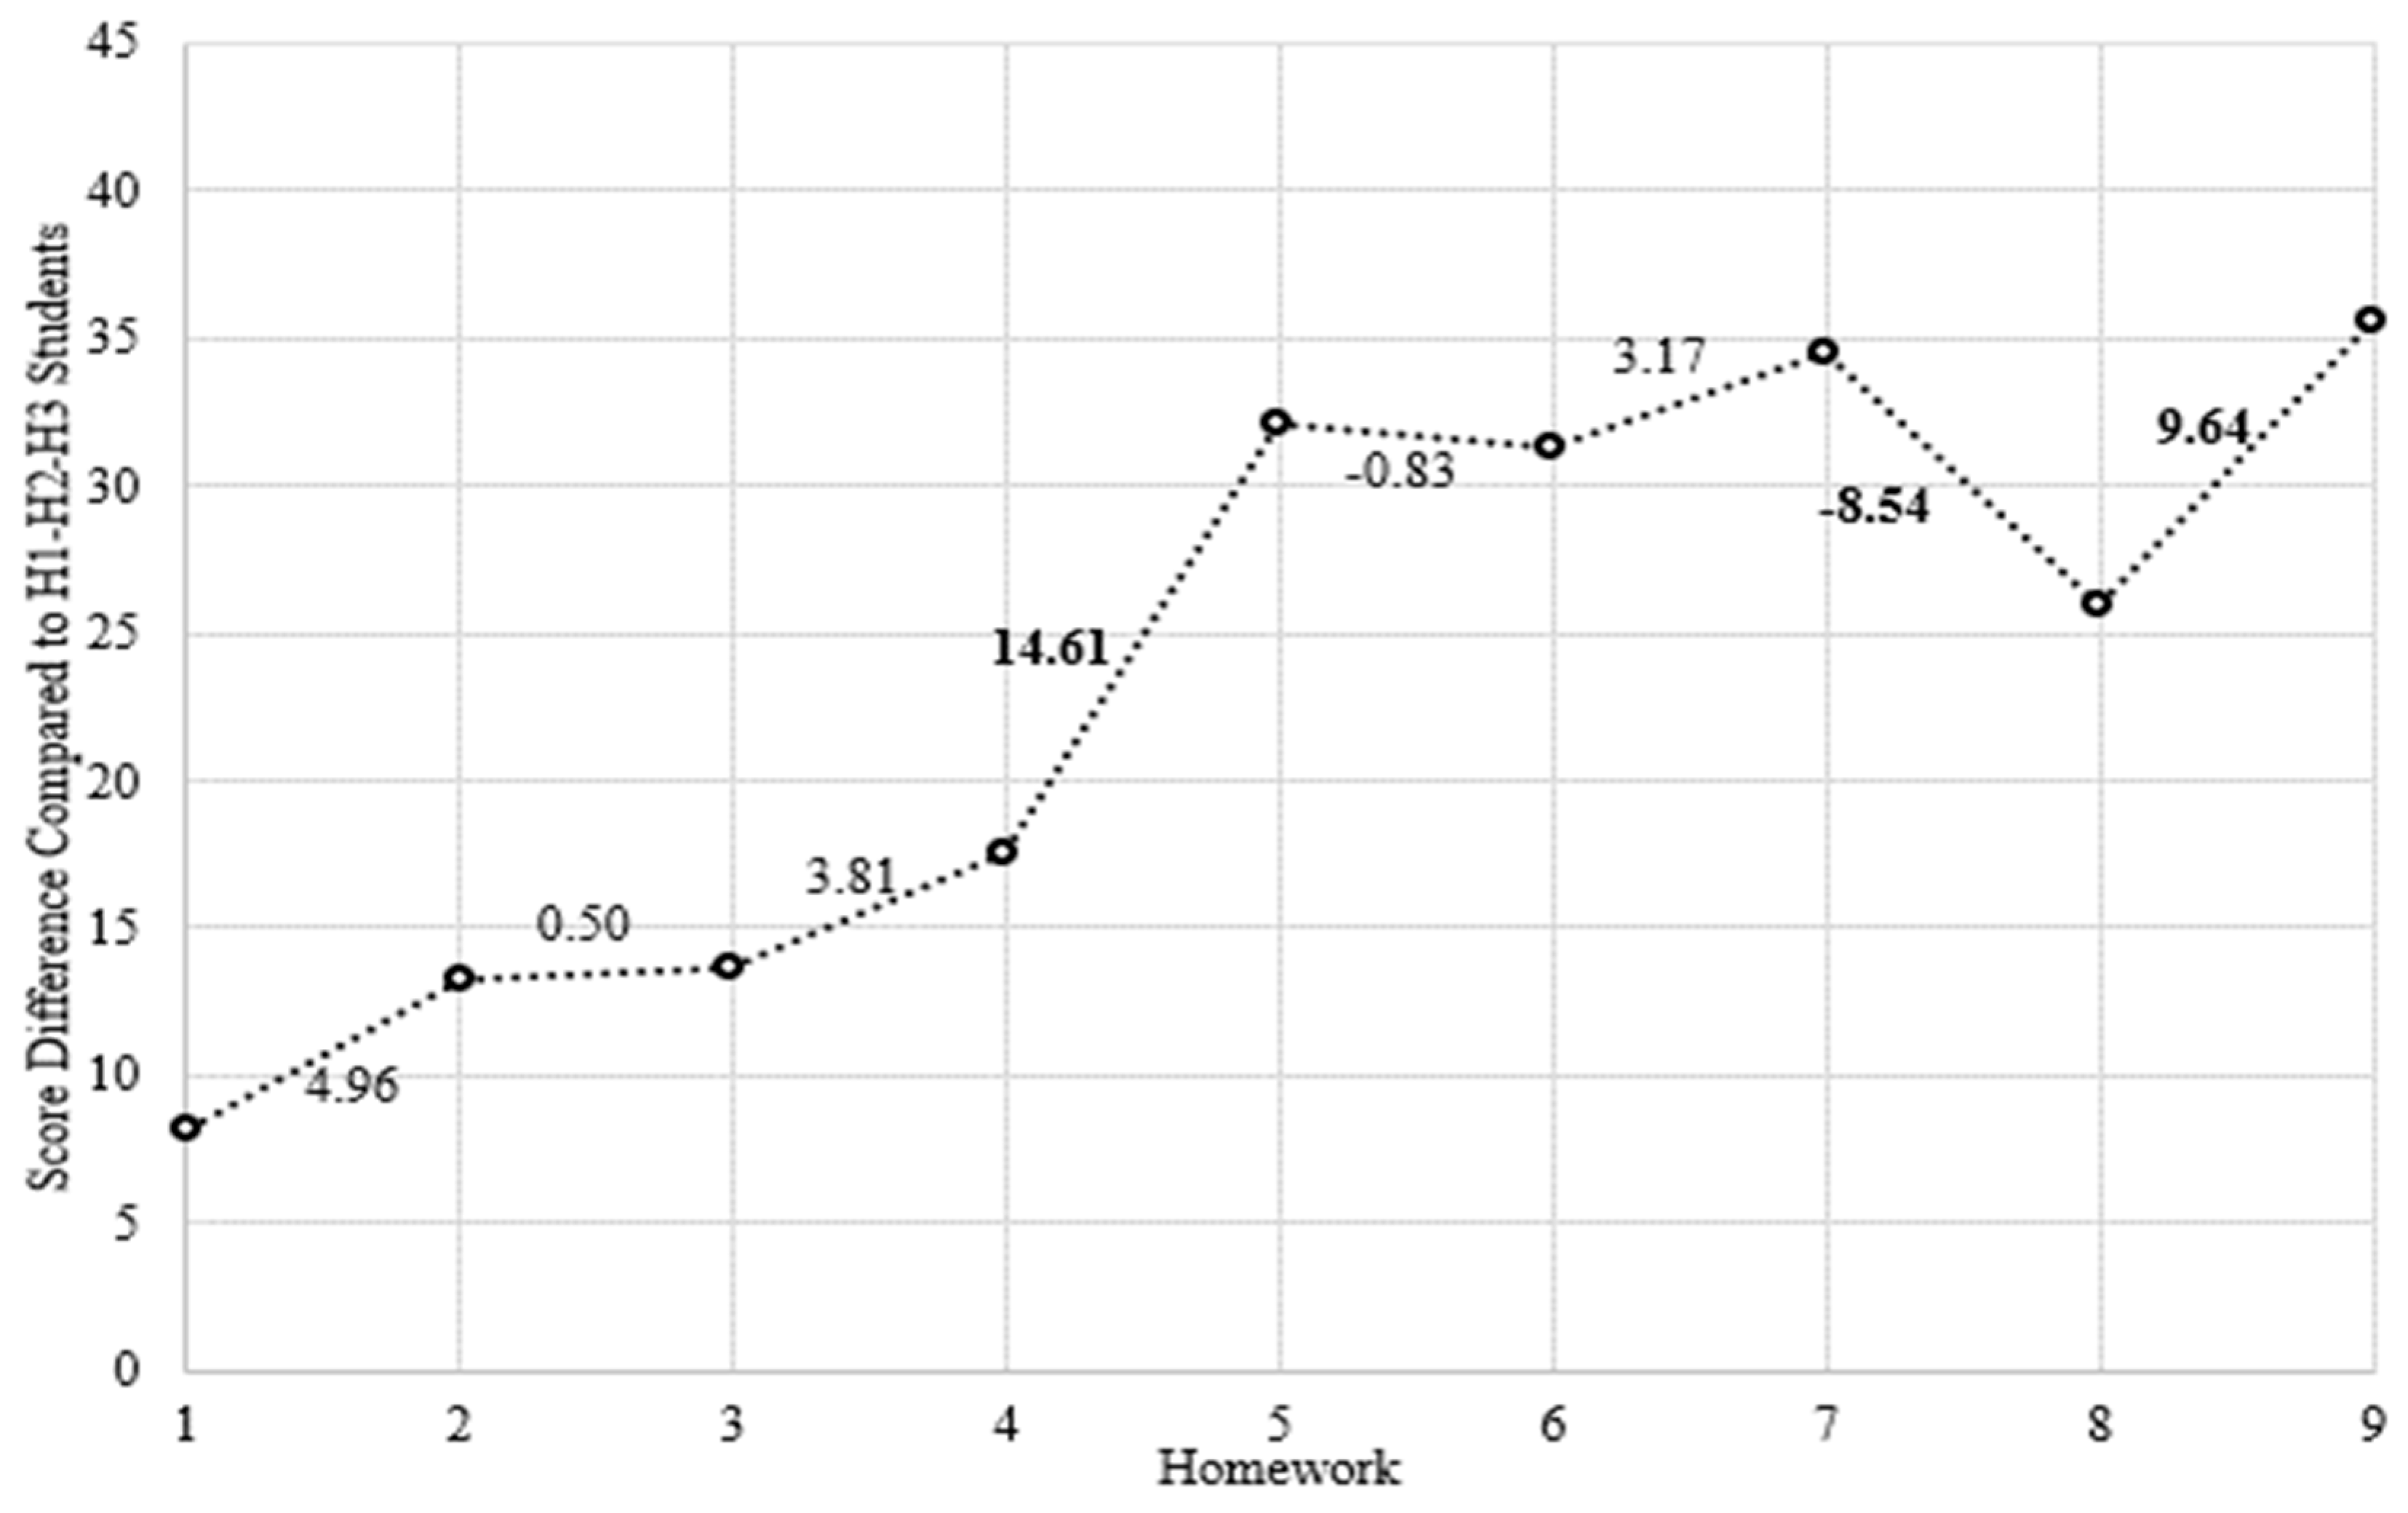
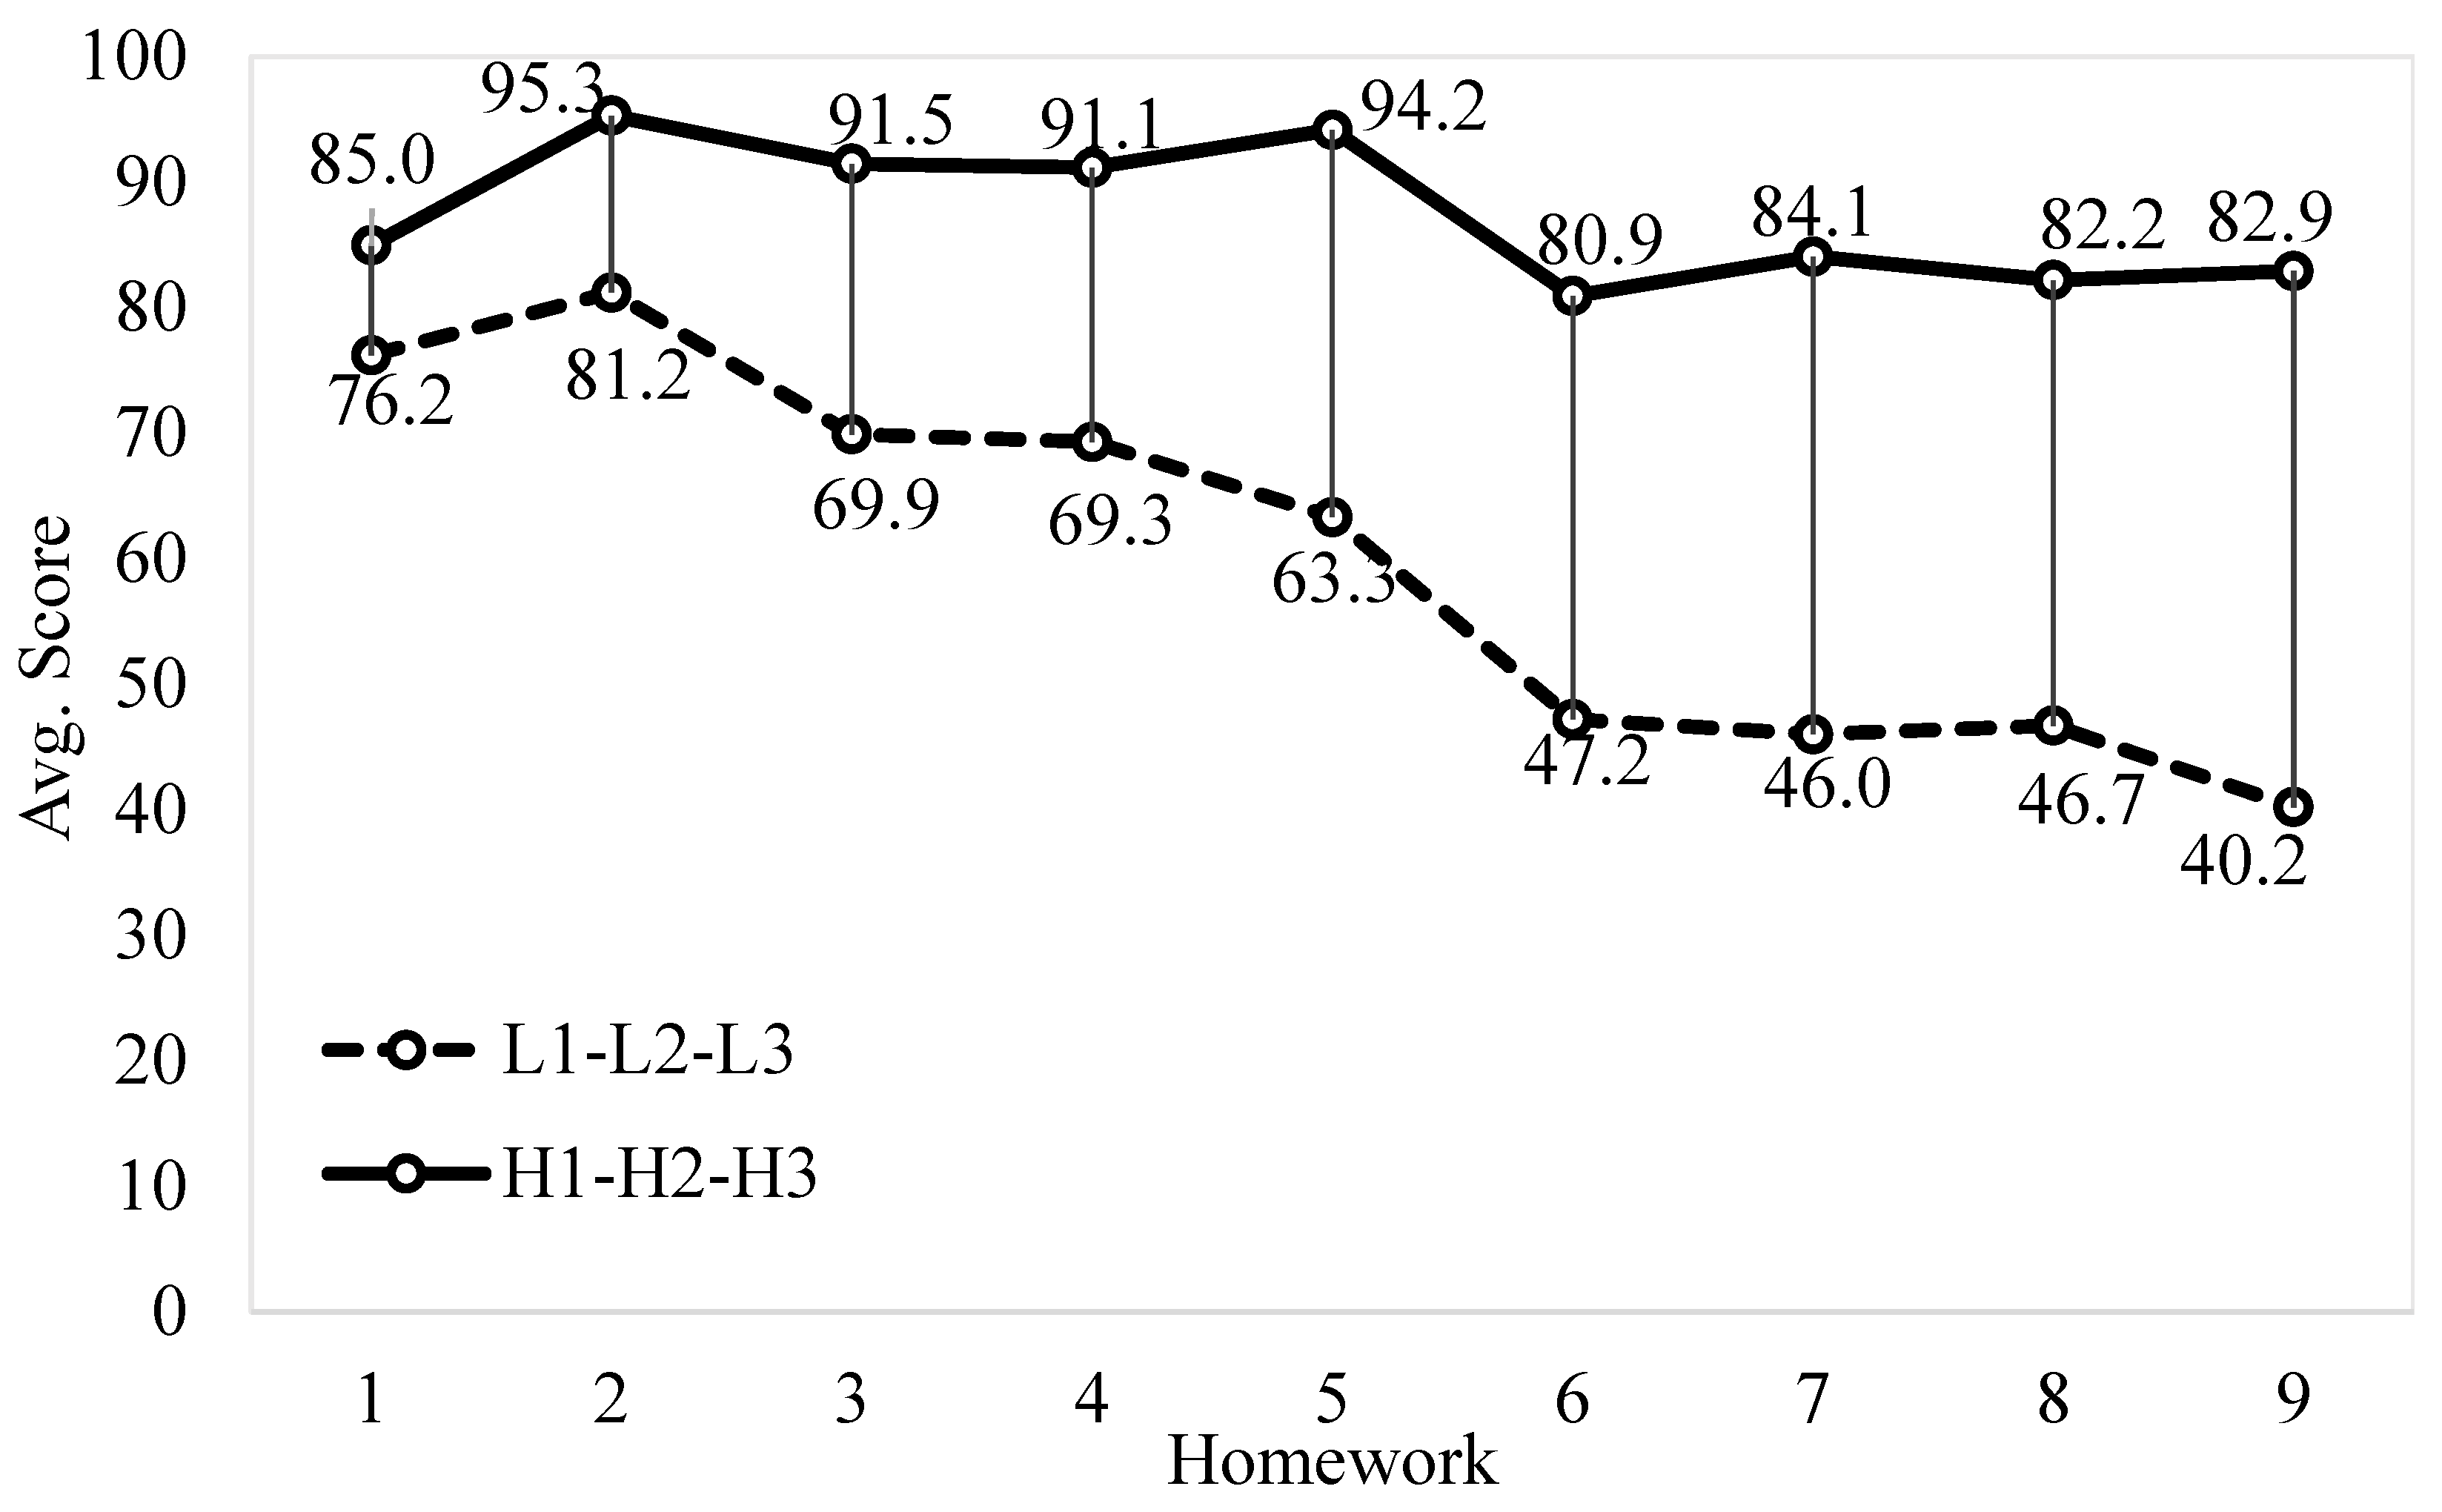
This section analyzes critical topics for students who exhibited low performance on all exams (L1-L2-L3) and eventually failed the course. The goal of this analysis is to identify critical topics for continuously low performing students and compare them against those for all the failing students discussed in the previous section. Figure 8 shows that continuously low performing students maintained acceptable performance until homework 2, but significantly decreased their performance in subsequent homework, and this trend continued until the end of the course.
Similar to the previous section, we expanded the analysis of homework performance progression by examining the gaps in scores between high performing and continuously low performing students. Figure 9 presents the results of this analysis. Significant drops in performance are found from homework 2 to homework 3 and from homework 4 to homework 5. Moreover, the transition from homework 7 to homework 8 is the only point that exhibits a slight improvement in score differences; however, the improvement is minimal and the score is still poor at 46.7.
Likewise, we conducted a set of t-tests for the L1-L2-L3 and H1-H2-H3 groups as well. Table 4 displays the p-values and statistical significance for the differences in homework scores. Based on the analysis of the observed data, the results suggest that all of the homework scores are statistically significant, and the p-values are comparatively lower, except for homework 1. As previously stated, a plausible reason for the absence of statistical significance in homework 1 could be attributed to its reliance on recalling prerequisite concepts in Newtonian physics and calculus.
The results of this section are generally similar to those of the previous section except for one noticeable difference that the L1-L2-L3 student group additionally suffered early on with homework 3, and it may be further associated with their continuous struggle that accumulated throughout subsequent homework. Incremental deficit of knowledge accumulated through homework affects their progressive learning, which results in a sharp decline in performance on homework 5. Similar to the results for all failing students discussed in the previous section, the continuously low performing students slightly improved their performance in homework 8, which covers a relatively easy topic (centroid).
Homework 3 covers topics such as moment, Varignon’s theorem, and couple. Knowledge and problem-solving skills acquired from learning these topics are implicitly and explicitly utilized on subsequent topics such as two-force members, support, truss, and internal forces. Students who fail to build a solid understanding of these topics early on, struggle to solve problems on later topics, and their performance significantly declines. Thus, the lack of understanding of topics such as moment, Varignon’s theorem, and couple critically affected the learning progression of continuous low-performing students to build on a solid foundation early on, which lead them to have low performance all the way until the end of the course. In addition to looking at the subsequent topics, in the view of prerequisite topics of the homework 3 topics, it is critical that students have a strong background in required physics and mathematics (e.g., vectors and calculus) to learn these new topics.
Generally, the findings of this analysis with the L1-L2-L3 group generally support all findings from the previous group (all failing students); therefore, we conclude that the same critical topics are valid for this group also. In addition, additional struggle (critical topic) was identified early on with low performance on homework 3.

5.3. Progressive Course Interaction

This section analyzes the effect of the students’ interaction with the course on their final semester grades. We analyze course interaction from two perspectives, active participation in course activities and attendance.

5.3.1. Active Participation

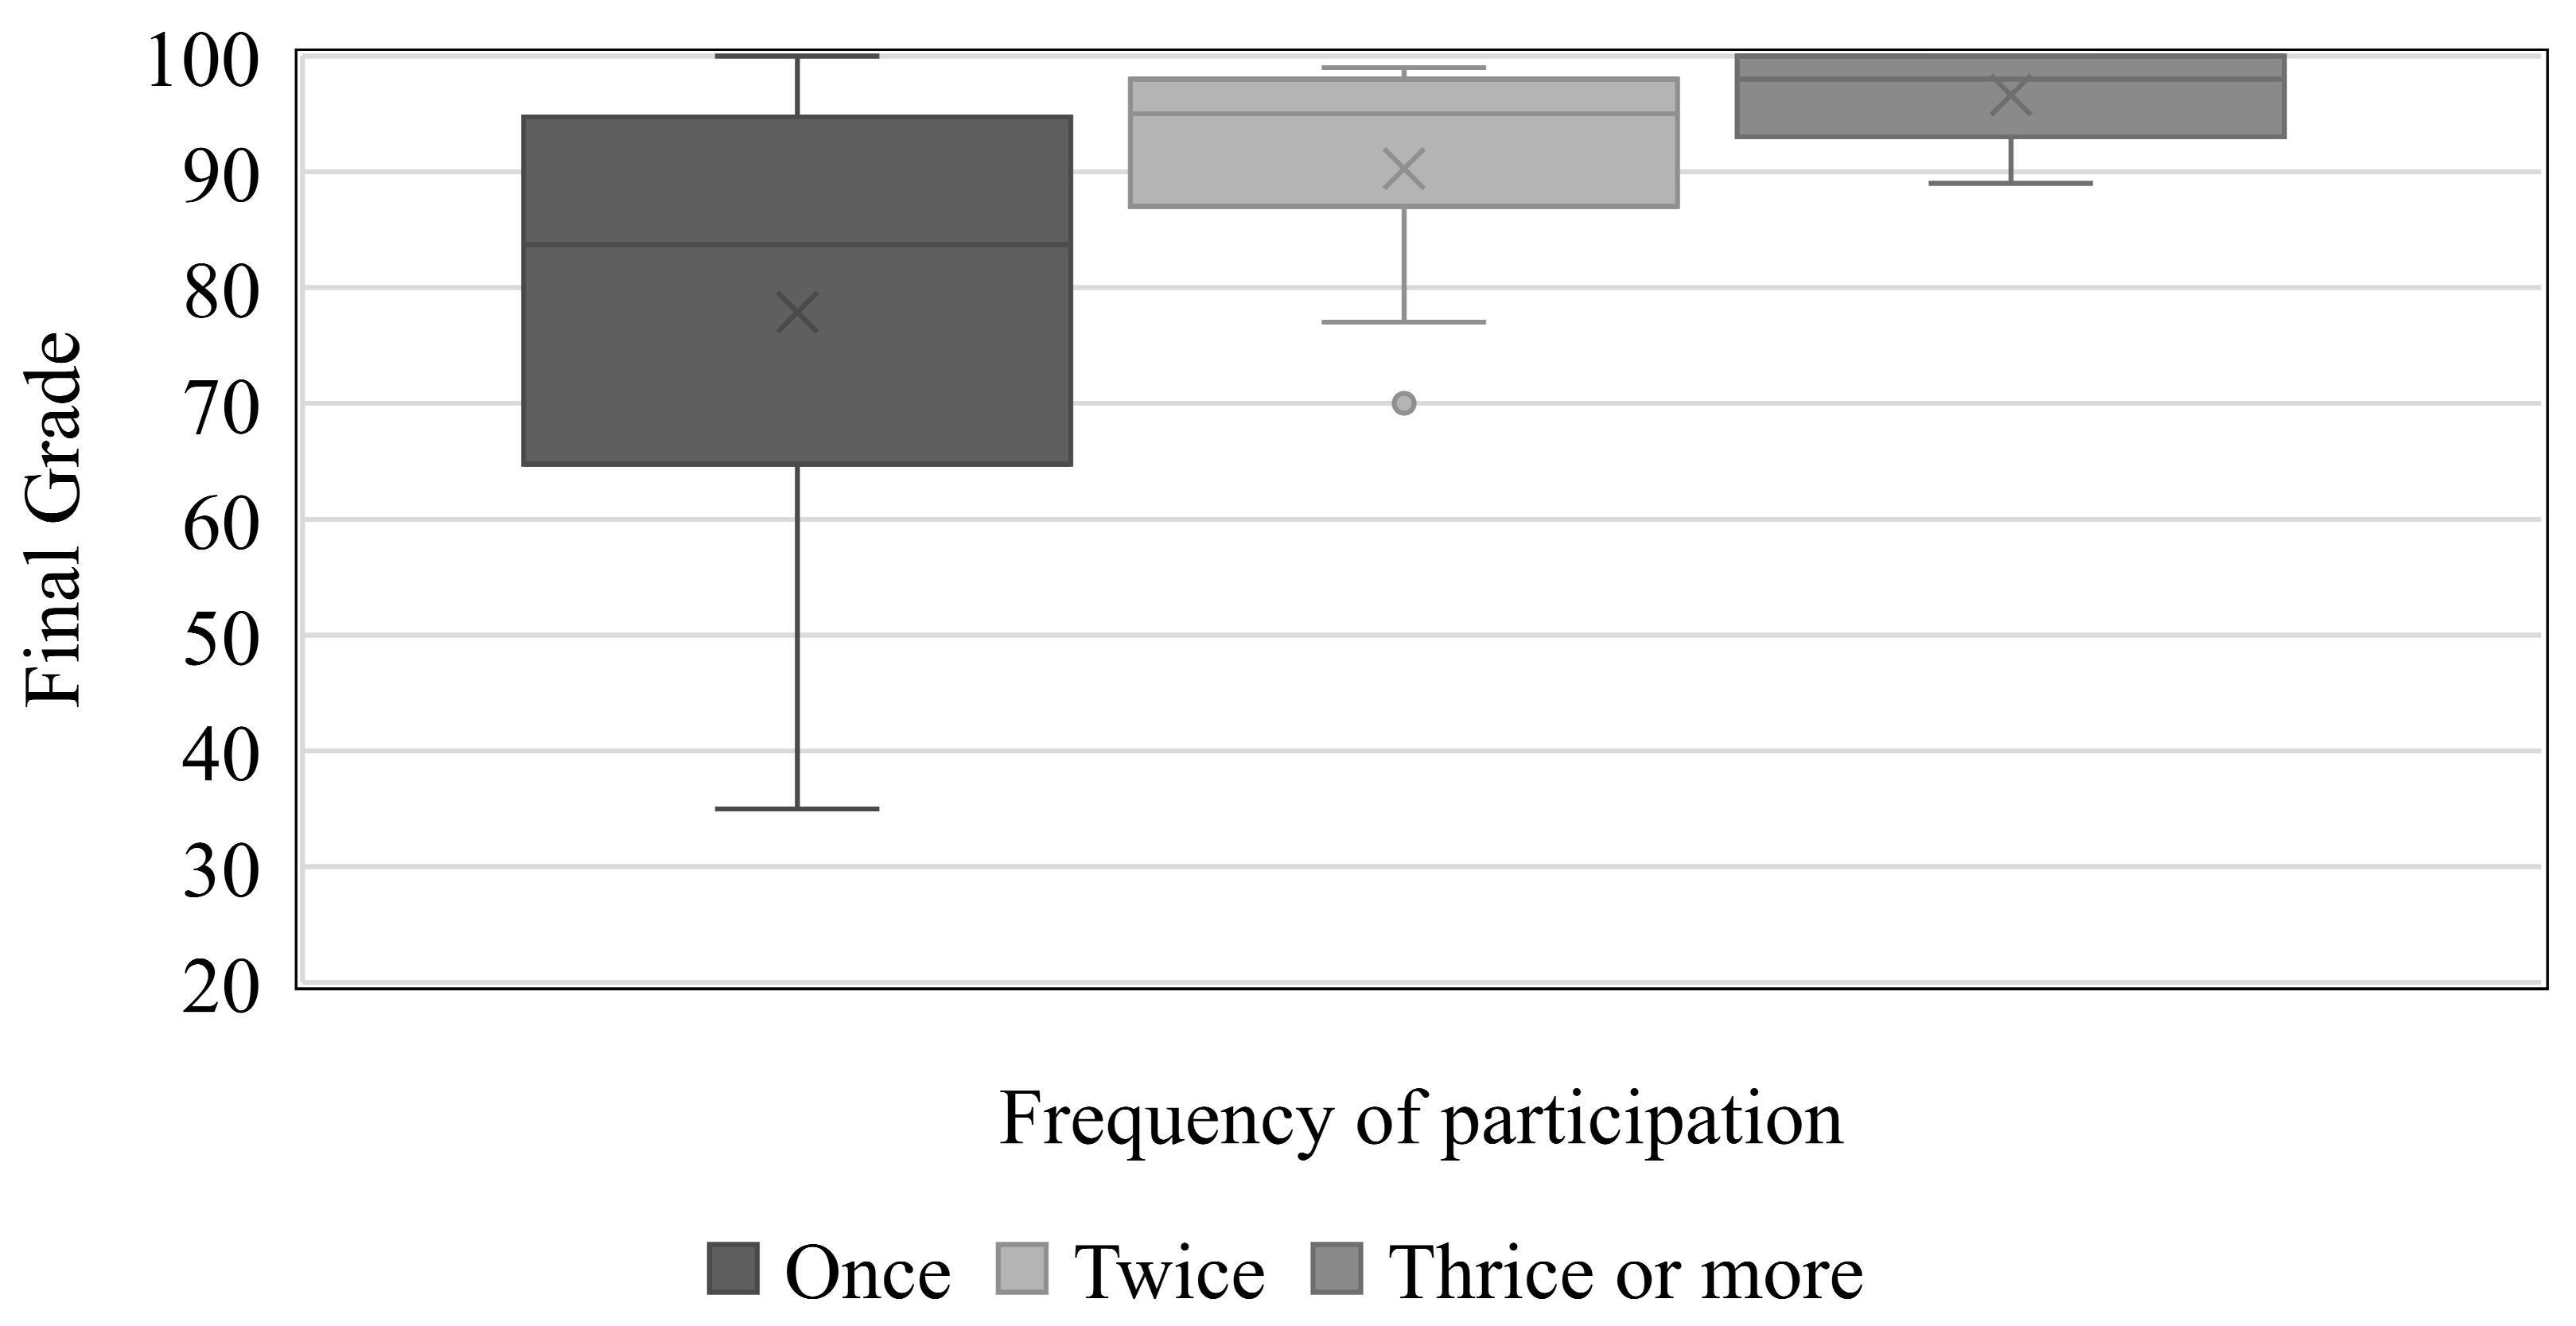
During the course period, the instructor offered extra problem-solving activities after several lectures as an incentive for students to enhance their learning. Participation in this activity was of one’s own volition, and accomplishing it effectively leads to the acquisition of enhanced knowledge. Notably, the proficient execution of the task engenders learning, independent of the motivational factors at play. A total of 46 students participated in the bonus problem-solving activity, with 24 participating once, 11 participating twice, and 11 participating three times or more. Figure 10 presents the distribution of final grades based on the number of times a student participated. The average final grade of the students who participated once was 77.87, with a median of 83.7. Students who participated twice had an average final grade of 90.27, with 54.5% receiving a final grade over 90. Students who participated three or more times achieved an average final grade of 96.63, which translates to an ‘A’ in the traditional grading scheme. Figure 10 also shows that the variability in the final grade decreases as the frequency of participation increases, indicating high reliability in high performance. Although students who participated once could still get a low final grade, participating more than once was significantly associated with achieving higher grades. Overall, the data suggests that the frequency of student participation has a significant effect on their final grade.
Participation in additional activities requires a willingness to learn and a genuine understanding of topics, which is viable through progressive learning. Students who participated multiple times achieved excellent final grades for the course. Thus, progressive participation in additional activities is a solid indicator of excellent course performance. This participation may be understood as a surrogate measure for student persistency in continuously active learning without procrastinating. Students who procrastinate are often passive in participating in such activities because of inability to complete problems given by the extra problem-solving activities.

5.3.2. Attendance

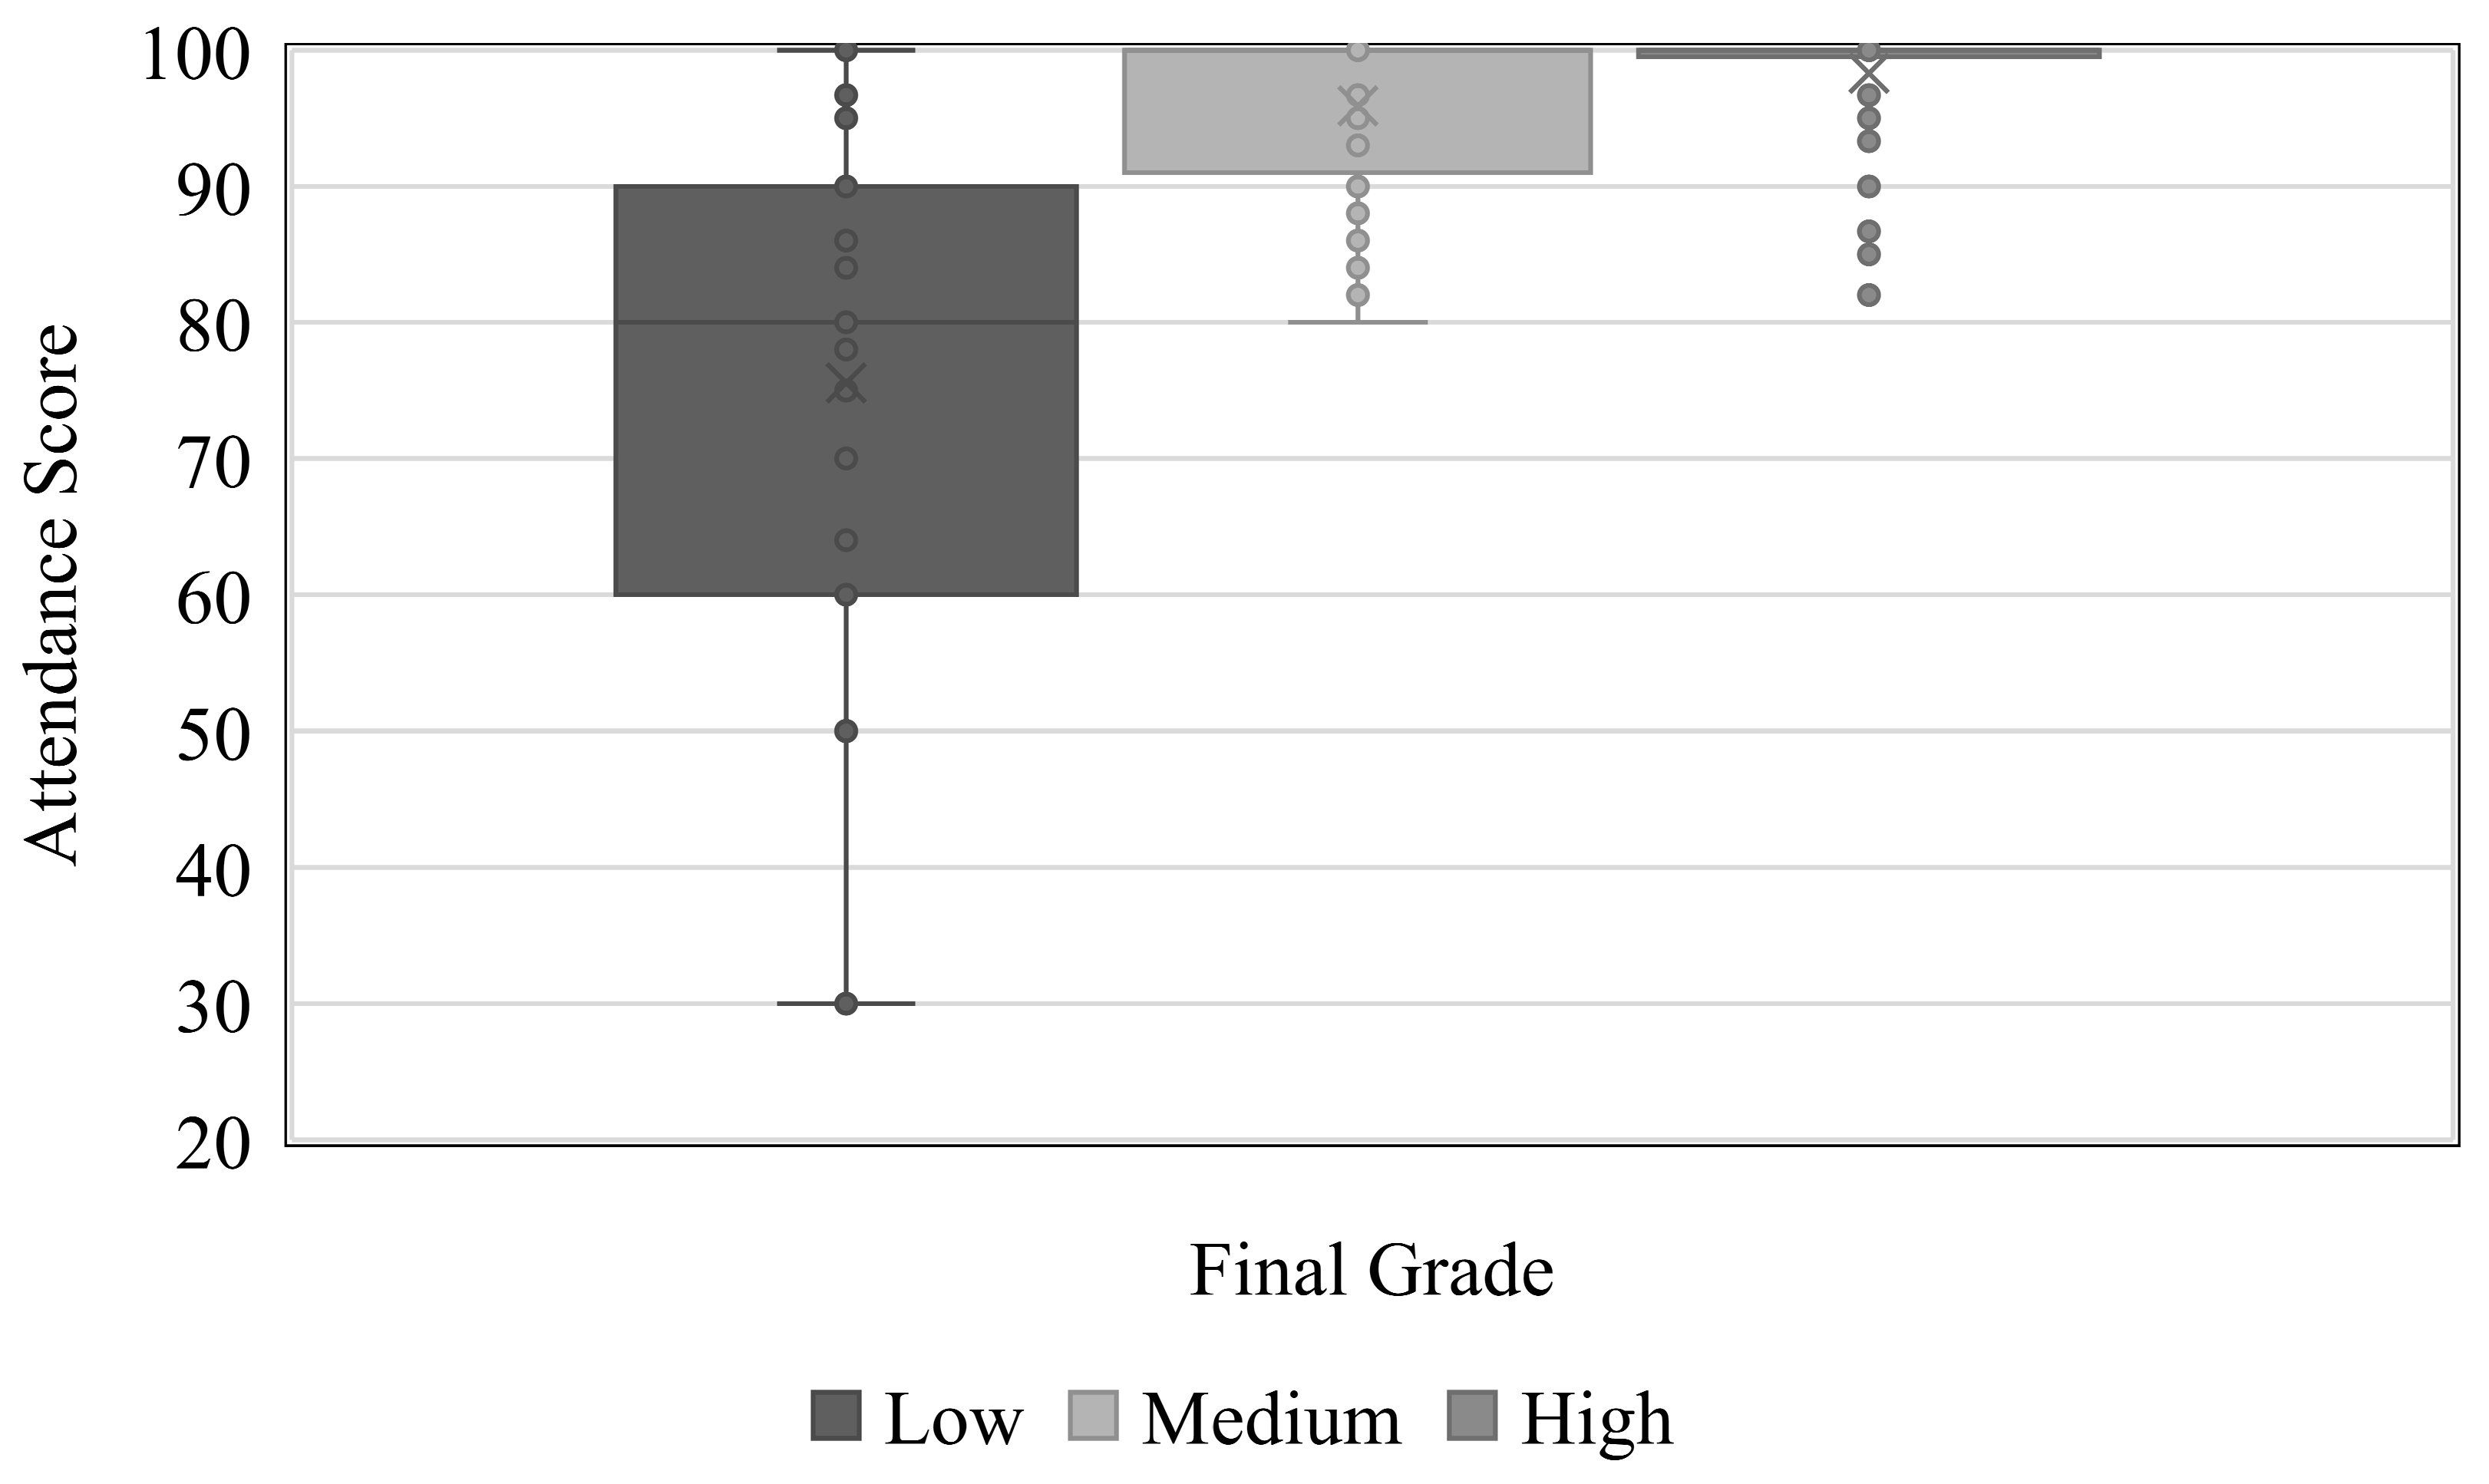
The course consisted of 29 to 30 lectures, depending on the number of holidays in a semester. Student attendance is a direct reflection of student participation and an indirect reflection of punctual learning, which is important for progressive learning in which subsequent lectures build on one another. Given this, participation by a means of student attendance is measured and presented with regard to the three-student performance groups (i.e., low, medium and high).
Figure 11 illustrates the distribution of attendance scores for students who achieved low, medium, and high final-grades. Students who achieved high and medium semester final grades had an average attendance score of 98.30 and 95.97, whereas low-performing students had an average attendance score of 75.05. Figure 11 also shows a smaller variability (dispersion) of the attendance score with higher final grades. As data indicate, many students who failed the course were inconsistent in attending lectures. In Statics, topics have higher levels of inter-dependencies, which imply that missing lectures negatively impacts progressive learning. Regularly attending lectures is important for students to successfully complete the course.

6. Discussion

While previous studies have examined progressive learning connections in a course-to-course fashion, our study focused on in-course progressive learning patterns. Given the limited literature on in-course progressive learning, we evaluate and contrast our findings on in-course progressive learning to existing literature on course-to-course progressive learning relations.
Our findings demonstrate that insufficient mastery of a particular topic leads to suboptimal performance in related subsequent topics. This is consistent with research on prerequisite course relations in grand scheme, which has shown that poor performance on prior courses negatively affect student performance [27,28].
Additionally, our results indicate that engage in progressive participation in additional activities perform well in the course. This is aligned with the positive effects of bonus points on final course performance [29] and the motivating effect of enhance learning [30].
Overall, our study sheds light on in-course progressive learning patterns and can assist educators in identifying knowledge gaps and designing course material to bridge topic connections. Additionally, integrating insights on progressive learning from a course into contemporary e-learning materials and tools that consist of greater student acceptability, such as ease of use, user interface, system quality [31], service learning [32], and quality assessment standard [33] can possibly improve student learning [34]. Moreover, it is worth noting that diverse e-learning platforms may elicit varying opinions from students regarding their efficacy and usability [35].

7. Conclusions

This research presented a three-year effort from data collection to various analyses aimed at uncovering students’ progressive learning within a course with sequentially built internal course topics. To quantitatively investigate the relations between course topics and student performance, the research utilized all graded and additional resources collected from the course, including homework assignments, exams, participations, and extra class activities. By analyzing the collected assessment data, we particularly studied three aspects (i.e., performance retention, critical topics of progressive learning, and progressive course interaction) to bring forth three valuable insights.
First, with regard to the performance retention analysis, we provided a mechanism and detailed analysis procedures to monitor student performance retention with respect to progressive learning using course assessment materials (e.g., exams and homework). Our analysis clearly demonstrated that the internal course topics’ relations exist and are clearly reflected in student performance in a meaningful manner. An important takeaway from our data and results is that students who progressively learn and perform well from the beginning build on that performance positively, and the opposite is true for students who do not. Second, we identified several critical topics that more profoundly impact student knowledge retention and thus performance. The analysis provided a mechanism to reveal critical topics in which failing students start to fall behind to a substantial degree where recovery becomes unlikely. In addition, we identified several points to relate to the core causes of this problem, which support the presence of critical topics. Third, our analysis provided strong evidence for the association between student participation and successful completion of the course, particularly in a course where progressive learning is important. We found that active student participation is a pathway to enhance learning and thus achieving excellent final grades.
Overall, the findings of this study provide valuable insights that can be leveraged in future implementation. Educators can adopt or utilize the approaches presented in this study to quickly provide diagnoses and remedial exercises to students to address conceptual lapses in other STEM courses where progressive learning is essential. Additionally, educators can encourage and promote active student participation in courses, which can enhance student learning and ultimately lead to better performance outcomes. Lastly, the insights provided by this study have practical implications for improving student performance and retention in STEM fields, which can ultimately benefit individuals, institutions, and society as a whole.
There are a few potential limitations to consider in relation to the findings of this research. First, the study primarily relied on quantitative data analysis, which may not fully capture the subjective experiences and perspectives of students or educators. Second, the study did not explicitly explore the potential impact of external factors, such as student demographics or socio-economic status, on the observed relationships between course topics and student performance. To address these limitations, it would be valuable to explore the impact of student engagement and motivation on their performance in courses with sequentially built internal course topics. This could involve collecting qualitative data through surveys or interviews to gain a deeper understanding of students’ experiences and perspectives. Moreover, it may be beneficial to conduct similar studies in other disciplines beyond STEM courses to determine the generalizability of the insights gained in this study.

Author Contributions

Conceptualization, J.P. and H.S.; methodology, J.P. and N.A.; software, N.A. and C.A.; validation, N.A. and C.A.; formal analysis, N.A. and C.A.; investigation, N.A., J.P., H.S. and C.A.; resources, J.P. and H.S.; data curation, J.P. and N.A.; writing—original draft preparation, J.P., N.A., and C.A.; writing—review and editing, J.P. and H.S.; visualization, N.A. and C.A.; supervision, J.P. and H.S.; project administration, J.P. and H.S.; funding acquisition, J.P. and H.S. All authors have read and agreed to the published version of the manuscript.

Funding

This material is based upon work supported by the National Science Foundation (Award #: 1928409). Any opinions, findings, and conclusions or recommendations expressed in this material are those of the authors and do not necessarily reflect the views of the National Science Foundation.

Institutional Review Board Statement

Not applicable.

Informed Consent Statement

Not applicable.

Data Availability Statement

The data that support the findings of this study are available from the corresponding author upon reasonable request.

Conflicts of Interest

The authors declare no conflict of interest. The funders had no role in the design of the study; in the collection, analyses, or interpretation of data; in the writing of the manuscript; or in the decision to publish the results.

References

  1. Roy, J.; Wilson, C. Engineering and Engineering Technology by the Numbers 2019; ASEE: Washington, DC, USA, 2019. [Google Scholar]
  2. NCES. Undergraduate Enrollment. Condition of Education; U.S. Department of Education, Institute of Education Sciences; National Center for Education Statistics: Washington, DC, USA, 2020.
  3. Aulck, L.; Velagapudi, N.; Blumenstock, J.; West, J. Predicting Student Dropout in Higher Education. arXiv 2016, arXiv:1606.06364. [Google Scholar] [CrossRef]
  4. Chen, Y.; Johri, A.; Rangwala, H. Running out of STEM. In Proceedings of the 8th International Conference on Learning Analytics and Knowledge, Sydney, Australia, 7–9 March 2018; ACM: New York, NY, USA; pp. 270–279. [Google Scholar] [CrossRef]
  5. Casanova, J.R.; Cervero, A.; Núñez, J.C.; Almeida, L.S.; Bernardo, A. Factors that determine the persistence and dropout of university students. Psicothema 2018, 30, 408–414. [Google Scholar] [CrossRef] [PubMed]
  6. Brandi, N.G.; Raman, D.R. Why They Leave: Understanding Student Attrition from Engineering Majors-Web of Science Core Collection. Int. J. Eng. Educ. 2013, 29, 914–925. [Google Scholar]
  7. Ghanat, S.T.; Davis, W.J. Assessing Students’ Prior Knowledge and Learning in an Engineering Management Course for Civil Engineers. In Proceedings of the ASEE Annual Conference and Exposition, Conference Proceedings, Tampa, FL, USA, 15 June–19 October 2019. [Google Scholar] [CrossRef]
  8. Moty, B.; Baronio, G.; Speranza, D.; Filippi, S. TDT-L0 a Test-Based Method for Assessing Students’ Prior Knowledge in Engineering Graphic Courses. Lect. Notes Mech. Eng. 2020, 1, 454–463. [Google Scholar] [CrossRef]
  9. Ghanat, S.T.; Kaklamanos, J.; Selvaraj, S.I.; Walton-Macaulay, C.; Sleep, M. Assessment of Students’ Prior Knowledge and Learning in an Undergraduate Foundation Engineering Course. In Proceedings of the ASEE Annual Conference and Exposition, Conference Proceedings, Columbus, OH, USA, 24–28 June 2017. [Google Scholar] [CrossRef] [Green Version]
  10. Smith, N.; Myose, R.; Raza, S.; Rollins, E. Correlating Mechanics of Materials Student Performance with Scores of a Test over Prerequisite Material; ASEE North Midwest Section Annual Conference 2020 Publications; ASEE: Washington, DC, USA, 2020. [Google Scholar]
  11. Derr, K.; Hübl, R.; Ahmed, M.Z. Prior knowledge in mathematics and study success in engineering: Informational value of learner data collected from a web-based pre-course. Eur. J. Eng. Educ. 2018, 43, 911–926. [Google Scholar] [CrossRef]
  12. Saher, R.; Stephen, H.; Park, J.W.; Sanchez, C.D.A. The Role of Prior Knowledge in the Performance of Engineering Students. In Proceedings of the ASEE Annual Conference and Exposition, Conference Proceedings, Virtual Conference, 26 July 2021. [Google Scholar]
  13. Durandt, R. Connection between Prior Knowledge and Student Achievement in Engineering Mathematics. In Proceedings of the ISTE—International Conference on Mathematics, Phalaborwa, South Africa, 23–26 October 2017. [Google Scholar]
  14. Nelson, K.G.; Shell, D.F.; Husman, J.; Fishman, E.J.; Soh, L.K. Motivational and self-regulated learning profiles of students taking a foundational engineering course. J. Eng. Educ. 2015, 104, 74–100. [Google Scholar] [CrossRef]
  15. Besterfield-Sacre, M.; Atman, C.J.; Shuman, L.J. Characteristics of Freshman Engineering Students: Models for Determining Student Attrition in Engineering. J. Eng. Educ. 1997, 86, 139–149. [Google Scholar] [CrossRef]
  16. Dollar, A.; Steif, P.S. Learning modules for the statics classroom. In Proceedings of the ASEE Annual Conference Proceedings, Nashville, TN, USA, 22–25 June 2003; pp. 953–960. [Google Scholar] [CrossRef]
  17. Hanson, J.H.; Williams, J.M. Using Writing Assignments to Improve Self-Assessment and Communication Skills in an Engineering Statics Course. J. Eng. Educ. 2008, 97, 515–529. [Google Scholar] [CrossRef]
  18. Danielson, S.G.D.E. Problem solving: Improving a critical component of engineering education. In Proceedings of the Creativity: Educating World-Class Engineers; Proceedings, 1992 Annual Conference of the ASEE, Worcester, MA, USA, 11–13 June 1992; Volume 2, pp. 1313–1317. [Google Scholar]
  19. Mejia, J.A.; Goodridge, W.H.; Call, B.J.; Wood, S.D. Manipulatives in engineering statics: Supplementing analytical techniques with physical models. In Proceedings of the ASEE Annual Conference and Exposition, Conference Proceedings, New Orleans, LA, USA, 26–29 June 2016. [Google Scholar] [CrossRef] [Green Version]
  20. Danielson, S. Knowledge Assessment In Statics: Concepts Versus Skills. In Proceedings of the 2004 Annual Conference Proceedings, Salt Lake City, UT, USA, 20–23 June 2004; pp. 9.834.1–9.834.10. [Google Scholar] [CrossRef]
  21. Lewis, M.; Terry, R.; Campbell, N. Registering risk: Understanding the impact of course-taking decisions on retention. In Proceedings of the 12th Annual National Symposium on Student Retention, Norfolk, VA, USA, 31 October–3 November 2016; pp. 364–371. [Google Scholar]
  22. John, B.; Ann, B.; Rodney, C. How People Learn: Brain Mind Experience and School Committee on Developments in the Science of Learning. In Commission on Behavioral and Social Sciences and Education; National Research Council, National Academy Press: Cambridge, MA, USA, 1999; Available online: https://www.nationalacademies.org/home (accessed on 26 February 2023).
  23. Streveler, R.; Geist, M.; Ammerman, R.; Sulzbach, C.; Miller, R.; Olds, B.; Nelson, M. Identifying and investigating difficult concepts in engineering mechanics and electric circuits. In Proceedings of the ASEE Annual Conference and Exposition, Conference Proceedings, Chicago, IL, USA, 18–21 June 2006. [Google Scholar] [CrossRef]
  24. Steif, P.S.; Dantzler, J.A. A statics concept inventory: Development and psychometric analysis. J. Eng. Educ. 2005, 94, 363–371. [Google Scholar] [CrossRef]
  25. Steif, P.S. An articulation of the concepts and skills which underlie engineering Statics. In Proceedings of the 34th Annual Frontiers in Education, Savannah, GA, USA, 20–23 October 2004; Volume 2. [Google Scholar] [CrossRef]
  26. Steif, P.; Dollar, A. An Interactive Web Based Statics Course. In Proceedings of the 2007 Annual Conference & Exposition Proceedings, Honolulu, HI, USA, 24–27 June 2007; pp. 12.224.1–12.224.12. [Google Scholar] [CrossRef]
  27. Valstar, S.; Griswold, W.G.; Porter, L. The Relationship between Prerequisite Proficiency and Student Performance in an Upper-Division Computing Course. In Proceedings of the 50th ACM Technical Symposium on Computer Science Education, Minneapolis, MN, USA, 27 February–2 March 2019. [Google Scholar] [CrossRef]
  28. Soria, K.M.; Mumpower, L. Critical Building Blocks: Mandatory Prerequisite Registration Systems and Student Success. NACADA J. 2012, 32, 30–42. [Google Scholar] [CrossRef]
  29. Dunn, B.; Fontanier, C.; Goad, C.; Dunn, B.L.; Luo, Q. Student Perceptions of Bonus Points in Terms of Offering, Effort, Grades, and Learning. NACTA J. 2020, 65, 169–173. Available online: https://www.researchgate.net/publication/353368881 (accessed on 17 April 2023).
  30. Moll, J.; Gao, S. Awarding bonus points as a motivator for increased engagement in course activities in a theoretical system development course. In Proceedings of the 2022 IEEE Frontiers in Education Conference (FIE), Uppsala, Sweden, 8–11 October 2022. [Google Scholar] [CrossRef]
  31. Prasetyo, Y.T.; Ong, A.K.; Concepcion, G.K.; Navata, F.M.; Robles, R.A.; Tomagos, I.J.; Young, M.N.; Diaz, J.F.; Nadlifatin, R.; Redi, A.A. Determining Factors Affecting Acceptance of E-Learning Platforms during the COVID-19 Pandemic: Integrating Extended Technology Acceptance Model and DeLone & McLean IS Success Model. Sustainability 2021, 13, 8365. [Google Scholar] [CrossRef]
  32. Lorenzo, C.; Lorenzo, E. Opening Up Higher Education: An E-learning Program on Service-Learning for University Students. Adv. Intell. Syst. Comput. 2020, 963, 27–38. [Google Scholar] [CrossRef]
  33. Singh, P.; Alhassan, I.; Binsaif, N.; Alhussain, T. Standard Measuring of E-Learning to Assess the Quality Level of E-Learning Outcomes: Saudi Electronic University Case Study. Sustainability 2023, 15, 844. [Google Scholar] [CrossRef]
  34. Alenezi, A. The role of e-learning materials in enhancing teaching and learning behaviors. Int. J. Inf. Educ. Technol. 2020, 10, 48–56. [Google Scholar] [CrossRef] [Green Version]
  35. Dospinescu, O.; Dospinescu, N. Perception over E-Learning Tools in Higher Education: Comparative Study Romania and Moldova. In Proceedings of the 19th International Conference on INFORMATICS in ECONOMY Education, Research and Business Technologies, Timisoara, Romania, 21–24 May 2020; Volume 2020, pp. 59–64. [Google Scholar] [CrossRef]
Figure 1. In-course topic connections within Statics.
Education 13 00576 g001
Figure 2. Example of a student work: (a) homework; (b) exam.
Education 13 00576 g002
Figure 3. Illustration of approach for analysis of performance retention.
Education 13 00576 g003
Figure 4. Exam-wise performance retention.
Education 13 00576 g004
Figure 5. Homework-wise performance retention.
Education 13 00576 g005
Figure 6. Homework performance progression of all failing students and H1-H2-H3 students.
Education 13 00576 g006
Figure 7. The progressive performance difference of failing students compared to H1-H2-H3 students.
Education 13 00576 g007
Figure 8. Homework performance progression of L1-L2-L3 and H1-H2-H3 students.
Education 13 00576 g008
Figure 9. The progressive performance difference of L1-L2-L3 students compared to H1-H2-H3 students.
Education 13 00576 g009
Figure 10. Frequency of participation and final grade.
Education 13 00576 g010
Figure 11. Semester final grade and attendance score.
Education 13 00576 g011
Table 1. Topic connections to homework and exam.
TopicHomeworkExam 1Exam 2Exam 3
Force Vector1
Free-body Diagram, Equilibrium2
Moment, Varignon’s Theorem, Couple3
Load Simplification, Distributed loads4
FBD, Equilibrium, Two Force Member, Support5
Truss, Frames, Friction6
Internal Forces: Shear and Moment7
Centroid8
Moment of Inertia9
Table 2. Student performance categorization based on performance score.
Performance CategoryPerformance Score (S)
HighS ≥ 85
Medium70 ≤ S < 85
LowS < 70
Table 3. Analysis of statistical significance of homework scores between all failing students and H1-H2-H3.
All Failing Students vs. H1-H2-H3p-ValueSignificant
Homework 1p = 0.078No
Homework 2p < 0.01Yes
Homework 3p < 0.01Yes
Homework 4p < 0.001Yes
Homework 5p < 0.001Yes
Homework 6p < 0.001Yes
Homework 7p < 0.001Yes
Homework 8p < 0.001Yes
Homework 9p < 0.001Yes
Table 4. Analysis of statistical significance of homework scores between groups L1-L2-L3 and H1-H2-H3.
L1-L2-L3 vs. H1-H2-H3p-ValueSignificant
Homework 1p = 0.072No
Homework 2p < 0.001Yes
Homework 3p < 0.001Yes
Homework 4p < 0.001Yes
Homework 5p < 0.001Yes
Homework 6p < 0.001Yes
Homework 7p < 0.001Yes
Homework 8p < 0.001Yes
Homework 9p < 0.001Yes
Disclaimer/Publisher’s Note: The statements, opinions and data contained in all publications are solely those of the individual author(s) and contributor(s) and not of MDPI and/or the editor(s). MDPI and/or the editor(s) disclaim responsibility for any injury to people or property resulting from any ideas, methods, instructions or products referred to in the content.