Article

TPACK’s Roles in Predicting Technology Integration during Teaching Practicum: Structural Equation Modeling

by
Muhammad Sofwan
1,*,
Akhmad Habibi
1,* and
Mohd Faiz Mohd Yaakob
2
1
Fakultas Ilmu Pendidikan dan Keguruan, Universitas Jambi, Jambi 36122, Indonesia
2
School of Education, Universiti Utara Malaysia, Sintok 06010, Kedah, Malaysia
*
Authors to whom correspondence should be addressed.
Educ. Sci. 2023, 13(5), 448; https://doi.org/10.3390/educsci13050448
Submission received: 11 February 2023 / Revised: 15 March 2023 / Accepted: 16 March 2023 / Published: 27 April 2023
(This article belongs to the Topic Education and Digital Societies for a Sustainable World)

Abstract

:
The current study aims to report the role of technological pedagogical and content knowledge (TPACK) in the integration of technology by preservice teachers during teaching practicum. As this study employed a survey as its methodological approach, instruments measuring TPACK and the integration of technology during teaching practicum were developed based on prior studies and validated through content validity and a pilot study. The main data (n. 1333) were analyzed through the partial least squares structural equation model (PLS-SEM), supported by importance performance map analysis (IPMA). The study’s results were satisfactory in determining the scale’s validity and reliability. The structural model shows that all the hypothetical interactions were positively significant. The strongest relationship between the TPACK factors emerged between technological pedagogical knowledge (TPK) and TPACK. Additionally, technology integration was most significantly affected by TPACK.

1. Introduction

Technological pedagogical and content knowledge (TPACK) combines the basic dynamics of teaching with the use of technology [1], that has been used to evaluate teachers’ integration of technology into their practice [2,3]. It was was founded on Shulman’s principle, PCK [4], which is primarily concerned with developing the most appropriate teaching methods. The debate was focused on the historical improvement in the quality of education, which suggested that content and pedagogy should be seen as one indistinguishable body of knowledge. Considering the importance of the PCK concept, TPACK was developed as a mechanism for defining the components of the successful integration of technology in educational activities [4]. Within this context, teachers must conceptualize the relationships between technology, pedagogy, and content factors to integrate technology effectively and efficiently [5]. Technological pedagogical and content knowledge comprises seven factors: TK, PK, CK, TPK, TCK, PCK, and TPACK (Figure 1).
Prior studies assessed the role of TPACK in predicting teachers’ use of technology in education [6,7,8]. These studies employ the role of TPACK in predicting the integration of technology during teaching through direct relationships. Limited studies explored the indirect relationships among the factors, especially in the context of developing countries. Therefore, this research aims to report the interconnection between TPACK factors and the role of TPACK in the integration of technology during teaching practicum, including its indirect effects. To support the relationship assessment, the scale for the study was validated and assessed for its reliability. Three research questions are proposed as the objectives of the study:
  • Is the scale proposed for the model valid and reliable?
  • What are relationships between the TPACK factors during teaching practicum?
  • What is the direct relationship between four TPACK components (TCK, PCK, TPK, TPACK) and the integration of technology during teaching practicum?
  • To what extent does TPACK mediate the relationship between three components (TCK, PCK, and TCK) and the integration of technology?

2. Literature Review

2.1. TPACK Scale Reliability and Validity

The first documented and, probably, the most frequently cited TPACK scale was proposed by Schmidt et al. [9] to assess preservice teachers in the USA. The instrument’s validity using Cronbach’s alpha and construct validity resulted in seven factors: TK, PK, CK, PCK, TCK, TPK, and TPACK. The authors proposed a pool of 47 indicators in the first process of establishment. The study’s remaining indicators resulted in 45 items, most of which were modified, and a few of which were deleted. Some researchers using Schmidt et al.’s [9] instrument failed to prove all the seven factors of knowledge when they validated the adaptations in different contexts and settings [10,11,12,13,14,15,16]. For example, Luik et al. [14] reported three valid factors, technology, pedagogy, and content, in the context of Estonian preservice teachers, while Chai et al. [12] reported eight factors. The instrument should always be validated and examined for its reliability, which we also addressed in this study.

2.2. TPACK Factors’ Inter-Correlation and Their Relations with the Integration of Technology

Prior studies examined the inter-correlations among TPACK components (Table 1). For instance, Dong et al. [17] surveyed 390 preservice teachers and 394 in-service teachers regarding the seven factors of TPACK. They reported the inter-correlation among these TPACK constructs; most of the correlational relationships were found to be significant, namely those between CK and TCK, CK and TPACK, TK and TCK, PK and PCK, PK and TPK, and TPK and TPACK. Furthermore, four TPACK components’ correlations were considered insignificant: PCK and TPACK, CK and PCK, TK and TPACK, and PK and TPACK. In addition, Wu et al. [18] reported that all the relationships between TPACK factors were significantly perceived by 211 school teachers in China. Pamuk et al. [19] mentioned some significance relationships among the following factors: TK and TPK, TK and TCK, PK and TPK, PK and PCK, CK and PCK, CK and TCK, TCK and TPACK, TPK and TPACK, and PCK and TPACK. Three correlations were insignificant: those between CK and TPACK, PK and TPACK, and TK and TPACK. Although many studies have reported valid instruments assessing TPACK factors, more studies should be conducted; the findings could be used to either refine or critique the prior instruments.
Studies have revealed the relationship between TPACK factors and the integration of technology (Table 2), such as between PK and the integration of ICT [23], TPK and the integration of technology [24], TPACK and the intention to use technology [6,7,8], perceived PK and the perception of the integration of technology [25], TPACK and the integration of technology [26], as well as digital nativity and TPACK [27]. However, these studies explored TPACK’s partial components. Within this study context, a complex relationship between all the TPACK components or factors and the integration of technology would lead to a comprehensive academic reference for future research. Reports on the systematic interconnection between the factors of TPACK and their connections with technology integration are still limited, especially in developing countries.
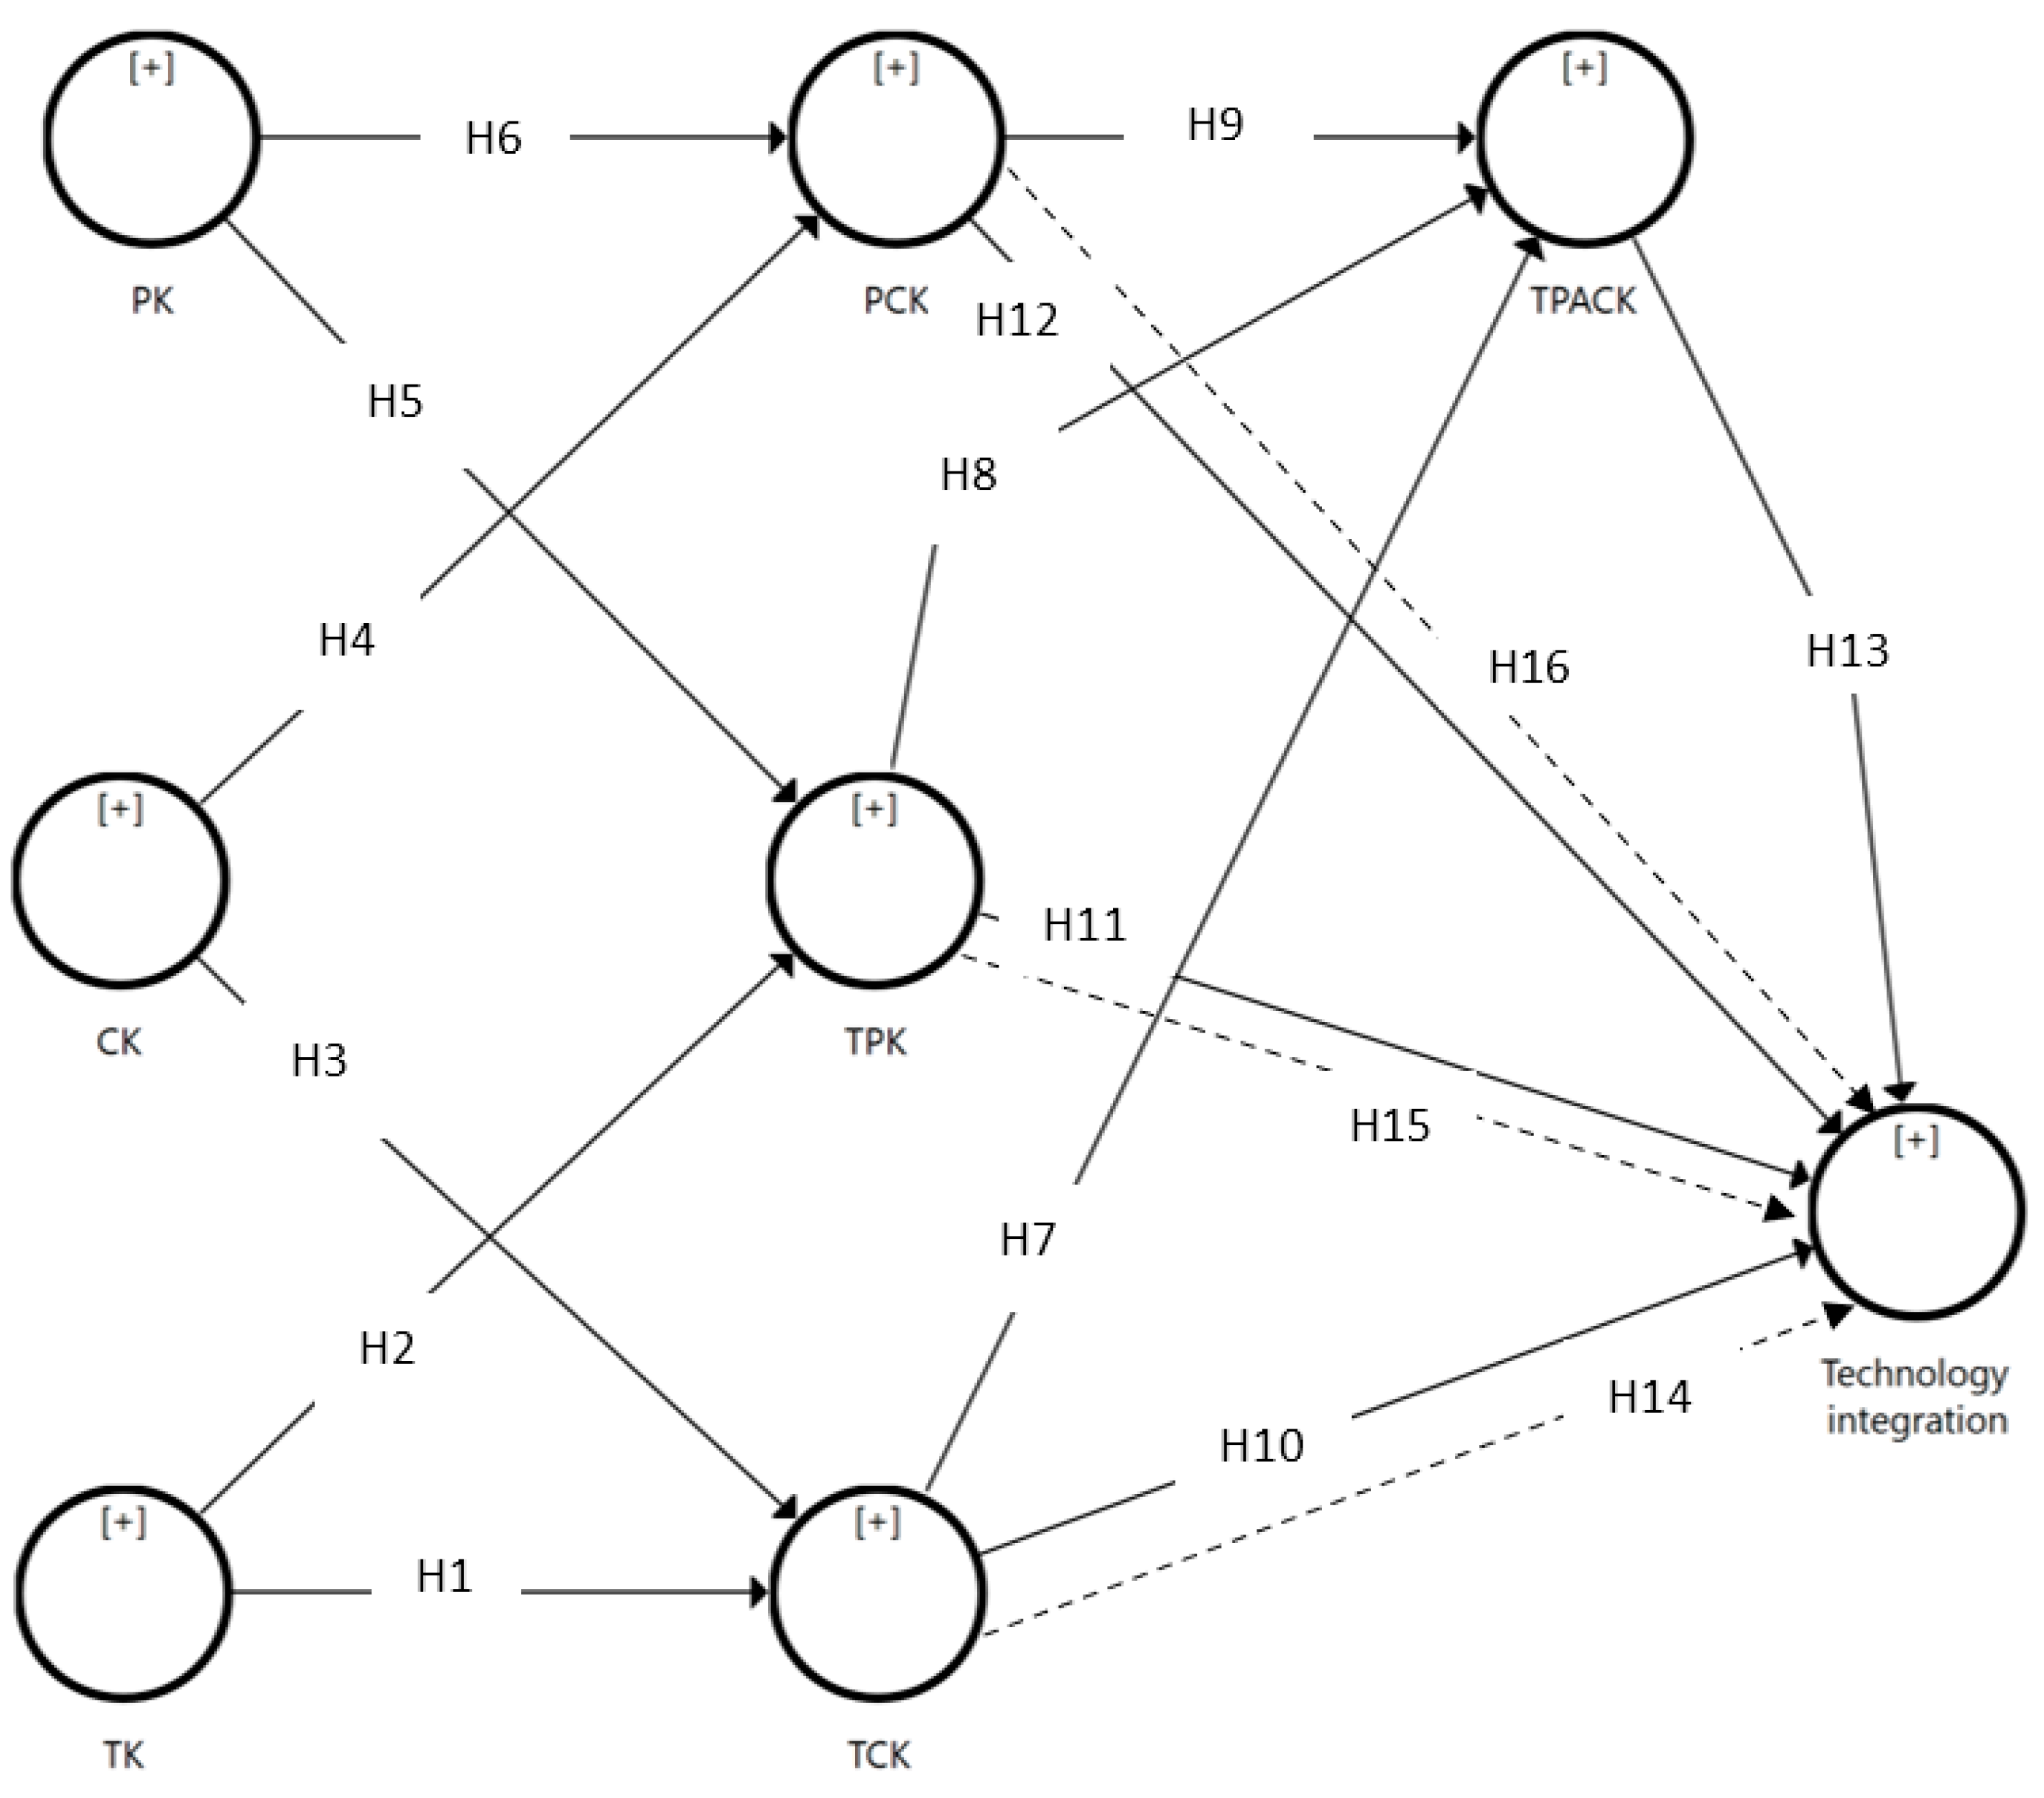
From the perspectives of preservice teachers, the main goal of this study was to explain the relationships between TPACK components and between TPACK and technology integration. Sixteen hypotheses, which included the seven TPACK factors and technology integration, were proposed for the conceptual model of this study; thirteen hypotheses were related to direct relationships (e.g., TK has a significant relationship with TCK, H1). In addition to these direct relationships, we included three indirect relationships that connect TPC, TCK, and PCK to technology integration through TPACK (e.g., TCK has a significant relationship with technology integration through TPACK, H13). All the hypotheses are exhibited in Figure 2.

3. Methods

3.1. Instrumentation

Since the concept of data propagation does not hamper the research method, we applied a predictive strategy to approximate the causality concept. Before the data collection, prior research was reviewed to evaluate the instrument’s validity and reliability. The study of the literature assists researchers in defining and analyzing the ideas and principles that establish the research’s theoretical context and determine suitable tools and instruments to use to achieve the research’s goals; we adapted prior valid instruments for this study (n. items = 44): TPACK [9,13,14] and technology integration ICT [23]. Five users (three preservice teachers, a staff member, and a lecturer) discussed the instruments for face validity. Five educational-technology and -policy experts were also invited to discuss the instruments for the content-validity process. We removed 6 items, leaving 38 items to be piloted. The instruments were evaluated using exploratory factor analysis (EFA) with the following criteria: Sphericity Bartlett Test (p < 0.500), Kaiser–Meyer–Olkin (>0.800), Factor Loading (0.500), Communalities (≥0.300), and Eigenvalue (>1.00), which resulted in eight different variables. Two hundred and eighty-seven preservice teachers participated in the pilot study of the survey instruments. All measurement values met the threshold. However, two indicators from TPACK were removed due to cross-loading detection in the EFA.

3.2. Data Collection

The target population covered all preservice teachers in three Indonesian universities. Through stratified sampling [32], the instruments were distributed. From the distribution of 1350 questionnaires, 127 respondents (9.41%) did not return a questionnaire, resulting in 1223 returned data. Hence, the outliers and missing data (90, or 6.67%) were deleted, which resulted in 1133 usable responses. Nine hundred and twenty-three respondents were females, while two hundred and ten were males. The number of respondents for each age range was as follows: 18 to 19, 15 respondents; 20 to 21, 935; and >21, 183. University A provided 631 respondents, University B provided 378, and University C provided 124. University A is an Indonesian public university that runs pre-service-teacher-training programs with more than 1200 PSTs; University B is also a public university, with almost 1000 PSTs; and University C is a private university with fewer than 300 PSTs. Regarding the participants’ majors, 217 respondents were from social science education, 457 respondents were from science education, 289 respondents were from language education, and 170 respondents were from preschool- and primary-teacher education. Similarly, respondents’ participation in ICT-based courses also varied; 1 course (455 respondents), 2–3 courses (500 respondents), and more than three courses (178 respondents).

3.3. Analysis and Findings

Skewness and kurtosis computations were conducted for the normality test. Skewness tests the evidence of skewed variable data distribution (towards the distribution’s left or right tail). Values greater than +1 or lower than −1 indicate that the data are substantial. Kurtosis is the extent to which data measure whether the distribution is too peaked, with a narrow distribution, and with most responses in the central part. The recommended kurtosis value is between −2 and +2 for the normal data [33,34]. The skewness and kurtosis for the TPACK factors and technology integration were satisfactory. The skewness values for the TPACK ranged from −0.252 (PCK) to 0.170 (TPACK); the kurtosis values ranged from −0.144 (PK) to 1.393 (PCK). Furthermore, the skewness and kurtosis for technology integration were −0.129 and 0.667, respectively, meeting the cut-off values.

4. Measurement Model

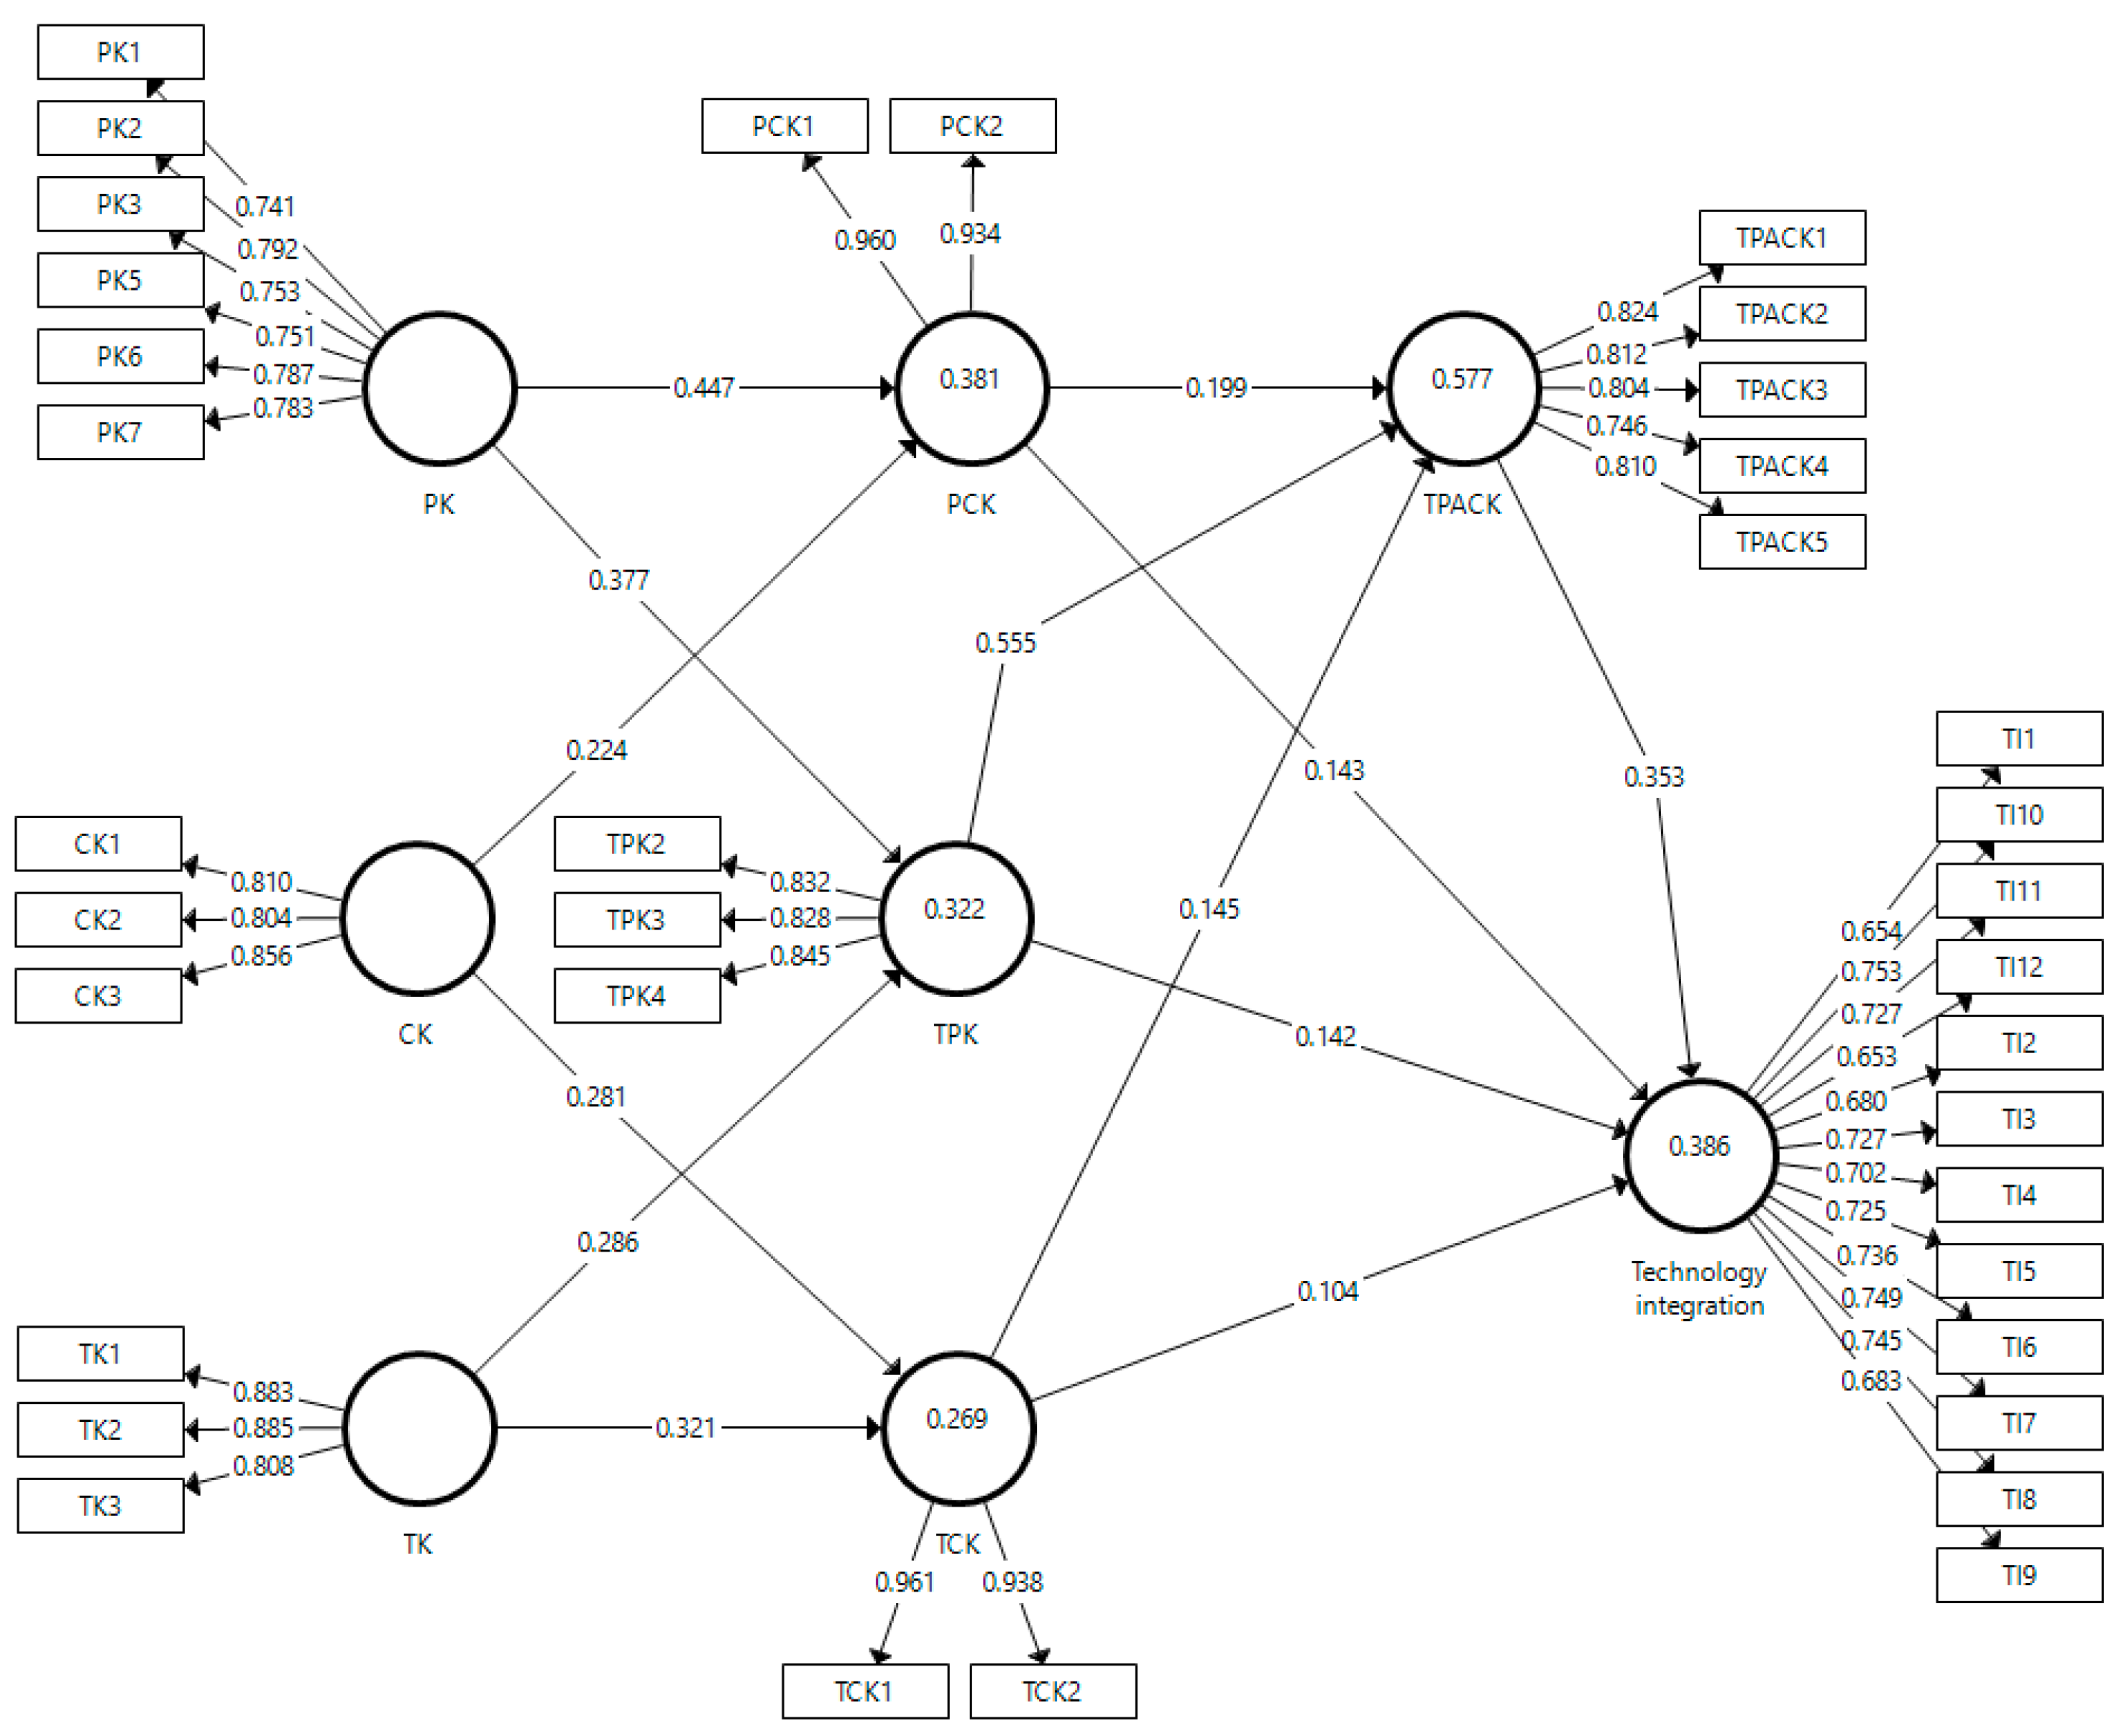
The loadings in the measurement model contributed significantly to their respective variables, as seen in Figure 3. The indicators that were loaded above 0.5 were held when the average variance extracted (AVE), rho_A, and composite stability (CR) exceeded their suggested values, respectively [35]. Table 3 shows that the AVE values of the model ranged between 0.5070 and 0.9010, indicating a good convergence validity. Similarly, the values of rho_A and CR (>0.700) demonstrated the constructs’ reliability and internal consistency [36]. To avoid any issues of multicollinearity, the VIF values were computed. The VIF values reported in Table 3 suggest that the data were free of multicollinearity issues. Furthermore, the heterotrait–monotrait ratio (HTMT) examination for values below 0.900 was reported for the assessment of discriminant validity; this is the most robust criterion for discriminant validity for PLS-SEM procedures [37,38]. The HTMT values differed and were below 0.900, affirming the discriminant validity (Table 4). In this study, standardized root mean squared residual (SRMR) was used to assess the model fit. The SRMR is the only proper model fit implemented for PLS-SEM [38]. In addition, dG and dULS were also recommended for the model fit; they are defined as distance measures that connect in more than one way when quantifying discrepancies between matrices [38]. Both values are presented in Table 2 (1.961 and 0.65), reflecting the quality of the model. Furthermore, the SRMR value of 0.054 was lower than the threshold of 0.08, which validates the model’s overall value [38].

5. Structural Model

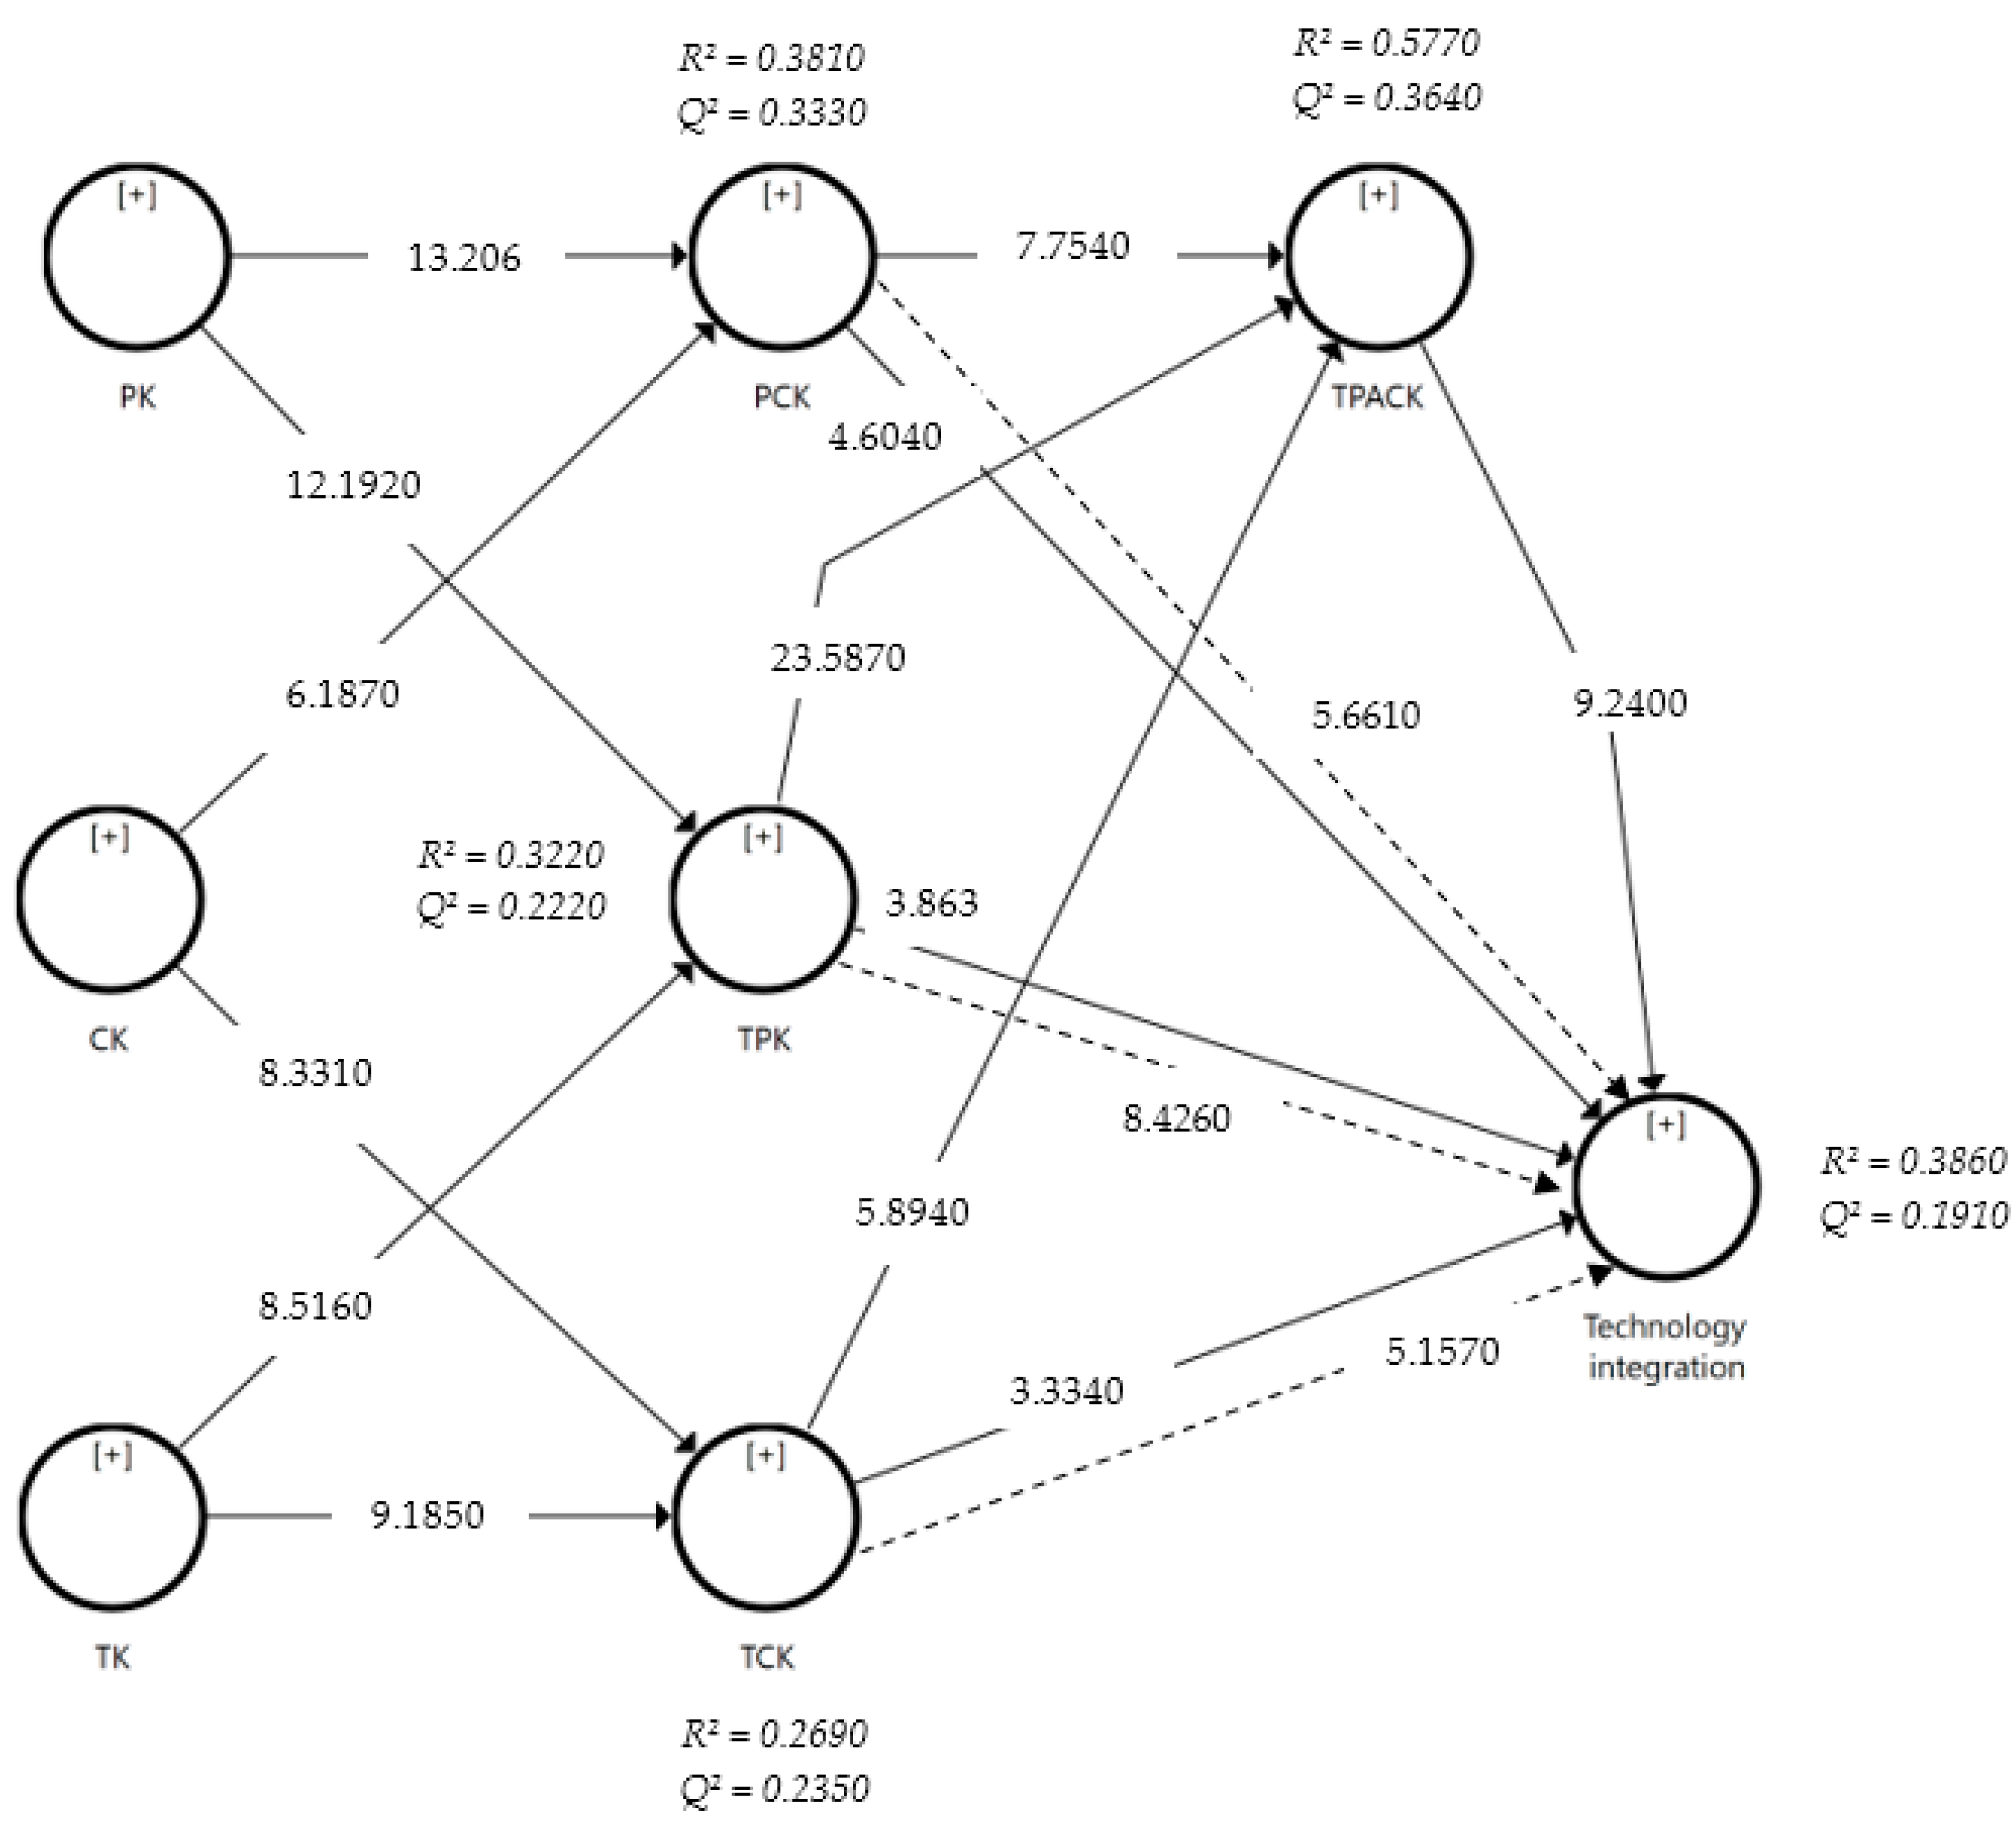
The data were bootstrapped with 5000 subsamples to investigate the link between the exogenous and endogenous factors. All the hypotheses were significant; we used a 5% significance threshold (Table 3 and Figure 3). The results support H1 and H2; TK is a significant predictor of TCK (β = 0.3210; t = 9.1850) and TPK (β = 0.2860; t = 0.85160). The TCK and PCK are also significantly predicted by CK, supporting H3 and H4. Similarly, H5 and H6 were also positively confirmed, and PK had significant relationships with TPK (β = 0.3770; t = 12.1920) and PCK (β = 0.4470; t = 13.2060). The TCK was a significant predictor of TPACK and technology integration, supporting H7 (β = 0.1450; t = 5.8940) and H10 (β = 0.1040; t = 3.3340), respectively. The TPK in this study had a significant relationship with TPACK and technology integration (β = 0.5550; t = 23.5870 and β = 0.1420; t = 3.6830), supporting H8 and H11. In addition, H9 and H12 were also confirmed; the SmartPLS 3.3 results showed a p-value of <0.001, suggesting significant relationships between PCK, TPACK (β = 0.1990; t = 7.7540), and technology integration (β = 0.11430; t = 4.6040). Regarding the indirect hypotheses (H14, H15, and H16) and the mediating role of TPACK in the effects of TCK, TPK, and PCK on technology integration, the present study reports that TCK has an indirect positive effect on technology integration, which is mediated by TPACK (β = 0.0510; t = 5.1570), H14. Furthermore, TCK also positively predicted technology integration through TPACK (β = 0.1960; t = 8.4260); this result supports H15. Finally, technology integration was also significantly predicted by PCK through TPACK (β = 0.0700; t = 5.6610).
When a particular exogenous variable is removed from the model, the f2 effect size is used to investigate the change in R2 values. According to the PLS-SEM guidelines, an f2 value of 0.02 indicates a small impact, 0.15 indicates a medium impact, and 0.35 indicates a large impact. The effect sizes of the endogenous factors were addressed by all the exogenous factors (Table 5). The largest effect emerged in the relationship between TPK and TPACK (0.4770), while the smallest effect resulted from the relationship between TPK and technology integration (0.0150). The coefficient of determination (R2) is a number that indicates how accurate a prediction is, calculated as the squared correlation between two dependent variables. For the range of 0 to 1, the R2 value is counted. A greater R2 number suggests a better level of predictability. An R2 score of 0.25 is deemed weak, a value of 0.50 is considered moderate, and a value of 0.75 is strong. From the data computation, all the endogenous variables of the model achieved proper levels of predictive accuracy. The R2 value of the TCK was 0.2690 (weak), that of the TPK was 0.3220 (moderate), that of the PCK was 0.3810 (moderate), that of the TPACK was 0.5770 (moderate), and that of technology integration was 0.3860 (moderate) (Figure 3). A Q2 score greater than zero implies that a model’s predictive relevance has been attained. The predictive relevance levels are 0.02 (low), 0.15 (mid), and 0.35 (large) [37,38]. In the SmartPLS, blindfolding computation was used to address the predictive relevance. All the Q2 values were greater than 0, indicating that they were predictive. The Q2 results in Figure 4 support the model’s predictive relevance for all the following endogenous variables: TCK (0.2350, mid), TPK (0.2220, mid), PCK (0.3330, large), TPACK (0.3640, large), and technology integration (0.1910, mid).

6. Importance of Performance Map Analysis (IPMA)

The goal of IPMA is to understand the impact of an independent variable’s overall unstandardized influence on the anticipation of a specific dependent variable. The IPMA is divided into significance and performance [39,40]. The components in this study were categorized based on their overall effects on performance and importance ratings. Before usage, the outer weights must be positive values, and all the indicators must have similar directions [41]. Higher coefficient values produce greater importance. The TCK had a high direct positive importance through the CK (0.3090) and TK (0.3260). The PK (0.4120) had a higher positive importance for the TPK than for the TK (0.2570). The PK (0.5540) demonstrated a significantly more positive importance for the PCK than for the CK (0.2470). The lowest exogenous variable regarding the TPACK’s importance effect was PCK (0.1670), while the greatest effect was demonstrated by TPK (0.5290). The TPACK (0.3590) had the strongest impact on technology integration, while the lowest impact was TCK on technology integration (0.1330).
In addition, high performance values emerging for a construct (1–100) indicate the higher performance of that construct [39,40]. The IPMA computation in the SmartPLS shows that technology integration (70.4130) demonstrated the highest performance, while the lowest performance was presented by the TPK (62.0710). The details of the performances of all the constructs are shown in Table 6. If educational stakeholders aim to improve the TPACK program in higher-education and technology integration for preservice teachers, their focus should be on all the constructs due to their high importance and performance.

7. Discussion

The instrument was distributed to 287 preservice teachers for a pilot study; we conducted EFA and reliability tests to purify the instrument measuring TPACK and technological integration. As recommended, the measurement-model process was conducted, informing reflective indicator loadings, internal consistency reliability, and convergent and discriminant validity [37]. The purification procedures were also suggested and conducted in other settings and contexts regarding TPACK and the integration of technology [7,8,25,26,41]. Thirty-six indicators were valid and reliable within the proposed mode, which confirmed the first research question (RQ1) of the current study.
The Intercorrelations between the TPACK factors for RQ2 were positively significant [12]. From the structural model assessment and IPMA, TPK had the highest importance level in predicting TPACK, followed by PCK and TCK. Furthermore, PK was the TPK and PCK’s key predictor, with the strongest performance. The TCK, on the other hand, was mostly predicted by TK, with 0.3260 of the importance levels compared to 0.3090, resulting from the effect of CK’s importance on TCK. Some of the associations were similar to those discovered in previous studies. Dong et al. [17] and Scherer et al. [20] found similar results; TPK was the most significant predictor of TPACK. Meanwhile, Pamuk et al., [19] reported TCK as the most significant predictor of TPACK; all the intercorrelations between the TPACK constructs were significant. The only prior study that contradicted the significance of this study’s TPACK intercorrelations was reported by Chai et al. [12]; TPACK was found not to be significantly correlated with TPK, TCK, and PCK.
The main goal of this study was to understand the roles of the combined knowledge of technology, pedagogy, and content (TCK, TPK, PCK, and TPACK) in predicting the integration of technology among Indonesian preservice teachers [21]. A few studies have been conducted regarding the relationships between all the TPACK factors and technology integration. Through the structural model assessment, all the hypotheses regarding the relationships between the TPACK factors and technology integration were positively confirmed. Technological pedagogical and content knowledge is the strongest predictor of technology integration during teaching practicum, followed by PCK, TPK, and TCK. Through IPMA, the results were slightly different; TPACK had the highest level of importance for technology integration, followed by TPK (not PCK). This discrepancy might have been caused by the role of TPACK in mediating the indirect correlations between TCK, TPK, PCK, and technology integration. These indirect relationships are also significant, suggesting that TPK is the strongest predictor of technology integration mediated by TPACK. These findings strengthen those of prior studies regarding the relationship between TPACK and technology integration, confirming the roles of TPACK factors (direct or mediated) in technology integration for RQ3 and RQ4 [28,29,30].

8. Conclusions

This study’s core contribution is the clarification of the roles of TPACK in technology integration during teaching practicum, as perceived by Indonesian preservice teachers. Before defining the role of TPACK in the integration of technology, the connectivity of TPACK factors was investigated. A deeper understanding of preservice teachers’ opinions of TPACK can improve program efficiency regarding the integration of technology by preservice teachers. One of the main goals of teacher-education programs is to assist preservice teachers in developing their understanding of the modern educational system’s demand for the integration of technology into the classroom. In addition, various methodological limitations should be addressed when interpreting the current study’s findings. This study developed a combination of technology models that consider TPACK factors, which explained the integration of technology in teaching practices. Thus, theoretical and empirical evidence is offered to all stakeholders to improve Indonesian PSTs and training programs’ performance by informing the roles of pedagogy, content, and technology knowledge for the use of technology in education to understand and explain the adoption of technology in teaching practice.

Author Contributions

Conceptualization, M.S. and A.H.; methodology, M.S.; software, A.H.; validation, M.F.M.Y.; formal analysis, M.S.; investigation, A.H.; resources, M.S.; data curation, M.F.M.Y.; writing—original draft preparation, M.S., A.H. and M.F.M.Y.; writing—review and editing, M.S. and M.F.M.Y.; visualization, A.H.; supervision, M.S.; project administration, M.F.M.Y.; funding acquisition, M.S. All authors have read and agreed to the published version of the manuscript.

Funding

This research was funded by Direktorat Jenderal Pendidikan Tinggi, Riset, dan Teknologi, Kementerian Pendidikan, Kebudayaan, Riset, dan Teknologi Republik Indonesia.

Institutional Review Board Statement

Ethical review and approval were waived for this study due to the policy of the institutions.

Informed Consent Statement

Written informed consent has been obtained from the respondents.

Data Availability Statement

The datasets generated and/or analyzed during the current study are available from the corresponding author on reasonable request.

Conflicts of Interest

The authors declare no conflict of interest.

Ethics Statement

Ethical review and approval for this study were not required by IRB of authors’ institution.

References

  1. Archambault, L.M.; Barnett, J.H. Revisiting technological pedagogical content knowledge: Exploring the TPACK framework. Comput. Educ. 2010, 55, 1656–1662. [Google Scholar] [CrossRef]
  2. Santos, J.M.; Castro, R.D.R. Technological Pedagogical content knowledge (TPACK) in action: Application of learning in the classroom by pre-service teachers (PST). Soc. Sci. Humanit. Open 2021, 3, 100110. [Google Scholar] [CrossRef]
  3. Schmid, M.; Brianza, E.; Petko, D. Self-reported technological pedagogical content knowledge (TPACK) of pre-service teachers in relation to digital technology use in lesson plans. Comput. Hum. Behav. 2021, 115, 106586. [Google Scholar] [CrossRef]
  4. Mishra, P.; Koehler, M.J. Technological pedagogical content knowledge: A framework for teacher knowledge. Teach. Coll. Record. 2006, 108, 1017–1054. [Google Scholar] [CrossRef]
  5. Valanides, N.; Angeli, C. Professional development for computer-enhanced learning: A case study with science teachers. Res. Sci. Technol. Educ. 2008, 26, 3–12. [Google Scholar] [CrossRef]
  6. Joo, Y.J.; Park, S.; Lim, E. Factors influencing preservice teachers’ intention to use technology: TPACK, teacher self-efficacy, and Technology Acceptance Model. Educ. Technol. Soc. 2018, 21, 48–59. [Google Scholar]
  7. Teo, T.; Milutinović, V.; Zhou, M.; Banković, D. Traditional vs. innovative uses of computers among mathematics pre-service teachers in Serbia. Interact. Learn. Environ. 2017, 25, 811–827. [Google Scholar] [CrossRef]
  8. Teo, T.; Sang, G.; Mei, B.; Hoi, C.K.W. Investigating pre-service teachers’ acceptance of Web 2.0 technologies in their future teaching: A Chinese perspective. Interact. Learn. Environ. 2019, 27, 530–546. [Google Scholar] [CrossRef]
  9. Schmidt, D.A.; Baran, E.; Thompson, A.D.; Mishra, P.; Koehler, M.J.; Shin, T.S. Technological pedagogical content knowledge (Track): The development and validation of an assessment instrument for preservice teachers. J. Res. Technol. Educ. 2009, 42, 123–149. [Google Scholar] [CrossRef]
  10. Baser, D.; Kopcha, T.J.; Ozden, M.Y. Developing a technological pedagogical content knowledge (TPACK) assessment for preservice teachers learning to teach English as a foreign language. Comput. Assist. Lang. Learn. 2016, 29, 749–764. [Google Scholar] [CrossRef]
  11. Cetin-Berber, D.; Erdem, A.R. An investigation of turkish pre-service teachers’ technological, pedagogical and content knowledge. Computers 2015, 4, 234–250. [Google Scholar] [CrossRef]
  12. Chai, C.S.; Koh, J.H.L.; Tsai, C.C. Exploring the factor structure of the constructs of technological, pedagogical, content knowledge (TPACK). Asia-Pac. Educ. Res. 2011, 20, 595–603. [Google Scholar]
  13. Koh, J.H.L.; Chai, C.S.; Tsai, C.C. Examining the technological pedagogical content knowledge of Singapore pre-service teachers with a large-scale survey. J. Comput. Assist. Learn. 2010, 26, 563–573. [Google Scholar] [CrossRef]
  14. Luik, P.; Taimalu, M.; Suviste, R. Perceptions of technological, pedagogical and content knowledge (TPACK) among pre-service teachers in Estonia. Educ. Inf. Technol. 2018, 23, 741–755. [Google Scholar] [CrossRef]
  15. Sang, G.; Tondeur, J.; Chai, C.S.; Dong, Y. Validation and profile of Chinese pre-service teachers’ technological pedagogical content knowledge scale. Asia-Pac. J. Teach. Educ. 2016, 44, 49–65. [Google Scholar] [CrossRef]
  16. Valtonen, T.; Sointu, E.; Kukkonen, J.; Kontkanen, S.; Lambert, M.C.; Mäkitalo-Siegl, K. TPACK updated to measure pre-service teachers’ twenty-first century skills. Australas. J. Educ. Technol. 2017, 33, 15–31. [Google Scholar] [CrossRef]
  17. Dong, Y.; Chai, C.S.; Sang, G.-Y.; Hwee, J.; Koh, L.; Tsai, C.-C. Pedagogical Content Knowledge (TPACK) in China. J. Educ. Technol. Soc. Educ. Technol. Soc. 2015, 18, 158–169. [Google Scholar]
  18. Wu, Y.T.; Chai, C.S.; Wang, L.J. Exploring secondary school teachers’ TPACK for video-based flipped learning: The role of pedagogical beliefs. Educ. Inf. Technol. 2022, 27, 8793–8819. [Google Scholar] [CrossRef]
  19. Pamuk, S.; Ergun, M.; Cakir, R.; Yilmaz, H.B.; Ayas, C. Exploring relationships among TPACK components and development of the TPACK instrument. Educ. Inf. Technol. 2015, 20, 241–263. [Google Scholar] [CrossRef]
  20. Scherer, R.; Tondeur, J.; Siddiq, F. On the quest for validity: Testing the factor structure and measurement invariance of the technology-dimensions in the Technological, Pedagogical, and Content Knowledge (TPACK) model. Comput. Educ. 2017, 112, 1–17. [Google Scholar] [CrossRef]
  21. Habibi, A.; Yusop, F.D.; Razak, R.A. The role of TPACK in affecting pre-service language teachers’ ICT integration during teaching practices: Indonesian context. Educ. Inf. Technol. 2020, 25, 1929–1949. [Google Scholar] [CrossRef]
  22. Irwanto, I.; Redhana, I.W.; Wahono, B. Examining Perceptions of Technological Pedagogical Content Knowledge (Tpack): A Perspective from Indonesian Pre-Service Teachers. J. Pendidik. IPA Indones. 2022, 11, 142–154. [Google Scholar] [CrossRef]
  23. Aslan, A.; Zhu, C. Investigating variables predicting Turkish pre-service teachers’ integration of ICT into teaching practices. Br. J. Educ. Technol. 2017, 48, 552–570. [Google Scholar] [CrossRef]
  24. Chuang, H.-H.; Ho, C.-J. An Investigation of Early Childhood Teachers’ Technological Pedagogical Content Knowledge(Tpack) in Taiwan Fulltext Pdf. Ahi Evran Üniversitesi Kırşehir Eğitim Fakültesi Derg. 2015, 12, 99–117. Available online: http://www.doaj.org/doaj?func=abstract&id=782294&recNo=6&toc=1&uiLanguage=en (accessed on 1 August 2022).
  25. Taimalu, M.; Luik, P. The impact of beliefs and knowledge on the integration of technology among teacher educators: A path analysis. Teach. Teach. Educ. 2019, 79, 101–110. [Google Scholar] [CrossRef]
  26. Tondeur, J.; Pareja Roblin, N.; van Braak, J.; Voogt, J.; Prestridge, S. Preparing beginning teachers for technology integration in education: Ready for take-off? Technol. Pedagog. Educ. 2017, 26, 157–177. [Google Scholar] [CrossRef]
  27. Kabakci Yurdakul, I. Modeling the relationship between pre-service teachers’ TPACK and digital nativity. Educ. Technol. Res. Dev. 2018, 66, 267–281. [Google Scholar] [CrossRef]
  28. Özgür, H. Relationships between teachers’ technostress, technological pedagogical content knowledge (TPACK), school support and demographic variables: A structural equation modeling. Comput. Hum. Behav. 2020, 112, 106468. [Google Scholar] [CrossRef]
  29. Raygan, A.; Moradkhani, S. Factors influencing technology integration in an EFL context: Investigating EFL teachers’ attitudes, TPACK level, and educational climate. Comput. Assist. Lang. Learn. 2020, 35, 1789–1810. [Google Scholar] [CrossRef]
  30. Jin, Y.; Harp, C. Examining preservice teachers’ TPACK, attitudes, self-efficacy, and perceptions of teamwork in a stand-alone educational technology course using flipped classroom or flipped team-based learning pedagogies. J. Digit. Learn. Teach. Educ. 2020, 36, 166–184. [Google Scholar] [CrossRef]
  31. Habibi, A.; Riady, Y.; Samed Al-Adwan, A.; Awni Albelbisi, N. Beliefs and Knowledge for Pre-Service Teachers’ Technology Integration during Teaching Practice: An Extended Theory of Planned Behavior. Comput. Sch. 2022. [Google Scholar] [CrossRef]
  32. Creswell, J. Qualitative, quantitative, and mixed methods approaches. In Research Design; SAGE Publications: Thousand Oaks, CA, USA, 2013. [Google Scholar]
  33. Habibi, A.; Yaakob, M.F.M.; Mukminin, A.; Muhaimin, M.; Prasojo, L.D.; Yusop, F.D.; Muzakkir, M. Teachers’ digital technology access to motivation, skills and use: A structural equation modeling study. Aslib J. Inf. Manag. 2021; 73, 543–559. [Google Scholar] [CrossRef]
  34. Hair, J.; Black, W.; Babin, B.; Anderson, R. Multivariate Data Analysis: A Global Perspective. In Multivariate Data Analysis: A Global Perspective, 7th ed.; Pearson Education: London, UK, 2010. [Google Scholar]
  35. Md Noor, S.; Rasoolimanesh, S.M.; Jaafar, M.; Barghi, R. Inscription of a destination as a world heritage site and residents’ perceptions. Asia Pac. J. Tour. Res. 2019, 24, 14–30. [Google Scholar] [CrossRef]
  36. Sarstedt, M.; Hair, J.F.; Ringle, C.M.; Thiele, K.O.; Gudergan, S.P. Estimation issues with PLS and CBSEM: Where the bias lies! J. Bus. Res. 2016, 69, 3998–4010. [Google Scholar] [CrossRef]
  37. Hair, J.F.; Risher, J.J.; Sarstedt, M.; Ringle, C.M. When to use and how to report the results of PLS-SEM. Eur. Bus. Rev. 2019, 31, 2–24. [Google Scholar] [CrossRef]
  38. Henseler, J.; Hubona, G.; Ray, P.A. Using PLS path modeling in new technology research: Updated guidelines. Ind. Manag. Data Syst. 2016, 116, 2–20. [Google Scholar] [CrossRef]
  39. Hair, J.; Hult, T.; Ringle, C.; Sartstedt, M. A Primer on Partial Least Squares Structural Equation Modeling (PLS-SEM); Sage Publications, Inc.: Thousand Oaks, CA, USA, 2013. [Google Scholar]
  40. Kabak, Ö.; Önsel Ekici, Ş.; Ülengin, F. Analyzing two-way interaction between the competitiveness and logistics performance of countries. Transp. Policy 2020, 98, 238–246. [Google Scholar] [CrossRef]
  41. Habibi, A.; Yaakob, M.F.M.; Sofwan, M. Student use of digital libraries during COVID-19: Structural equation modelling in Indonesian and Malaysian contexts. Elec. Lib. 2023, 40, 472–485. [Google Scholar] [CrossRef]
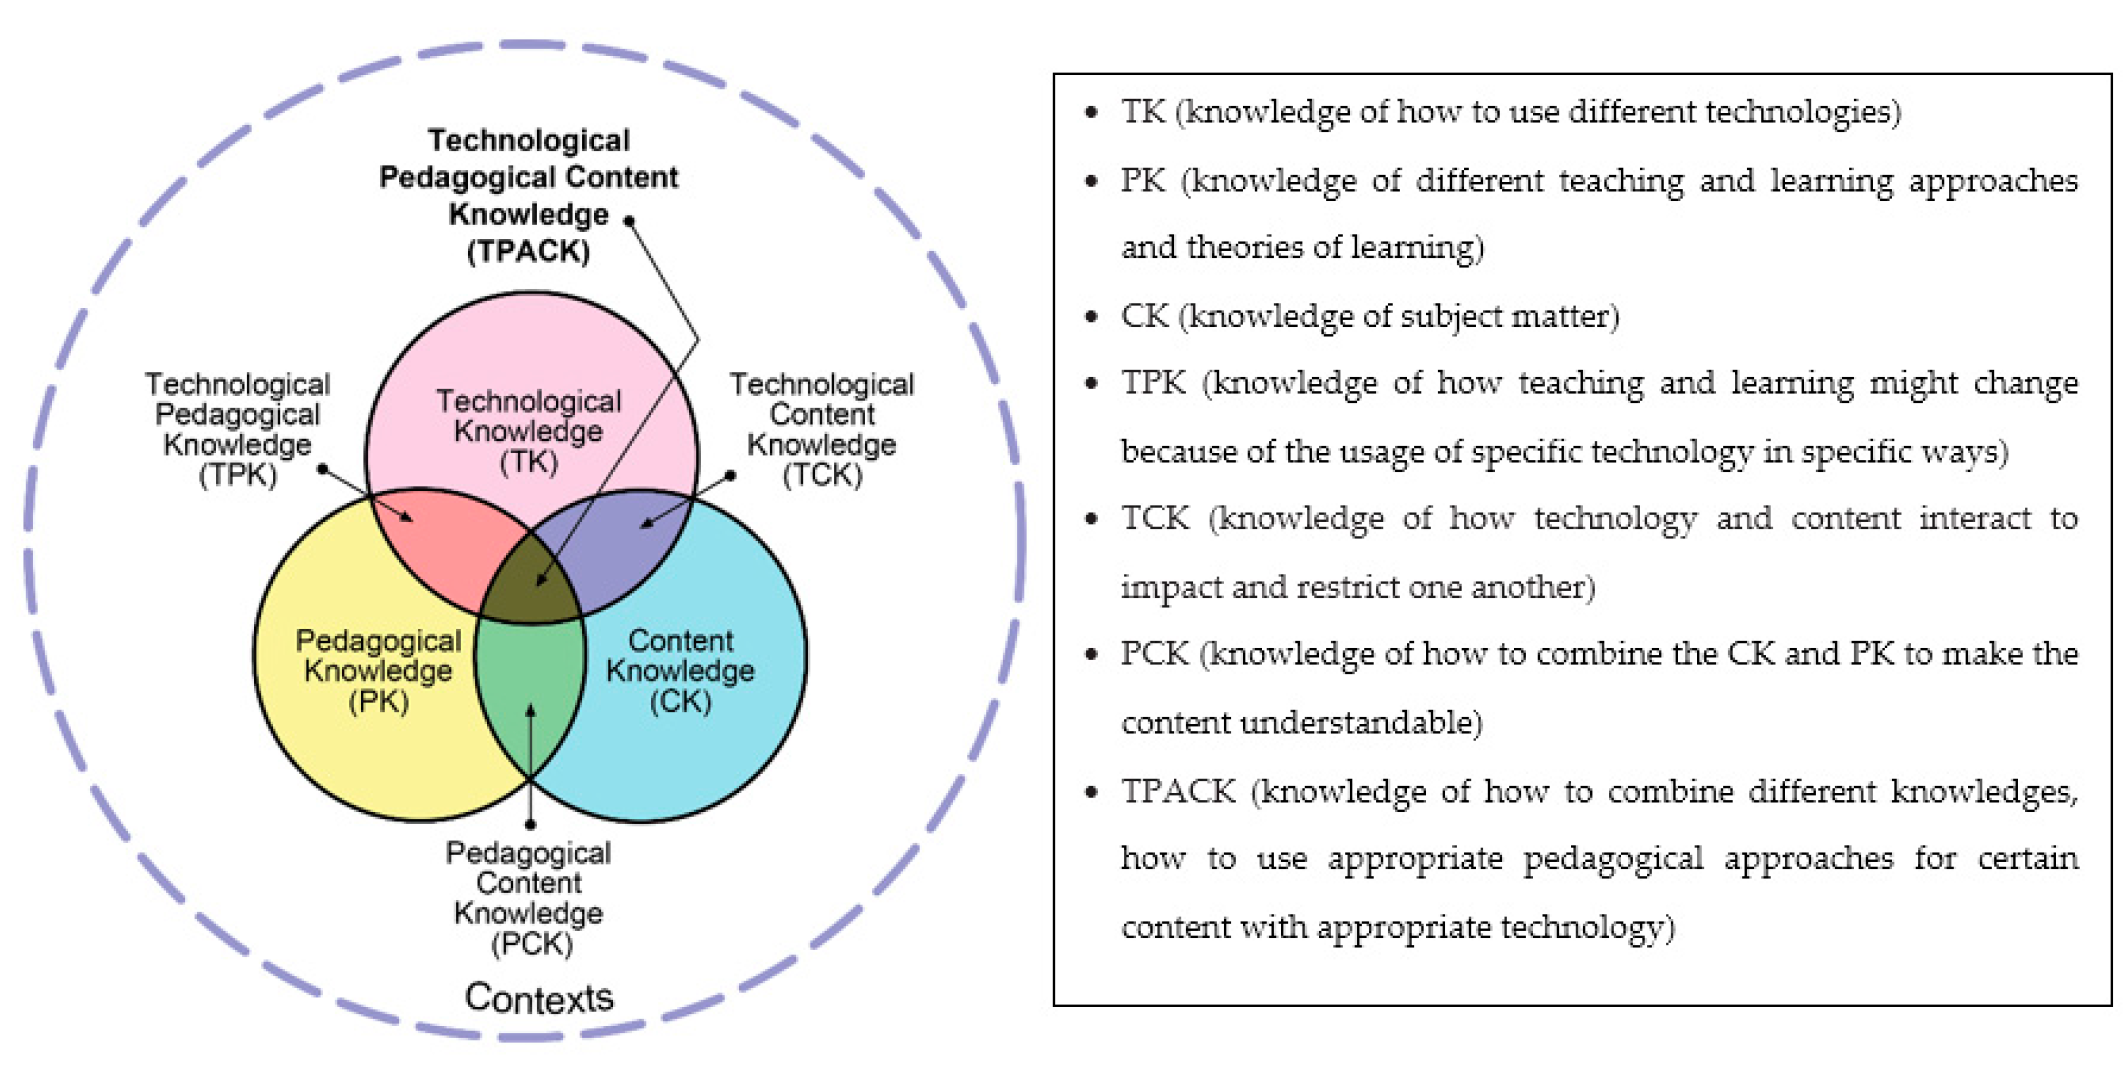
Figure 1. The TPACK conceptual model and definitions; TPACK figure is rights-free; retrieved from http://tpack.org (accessed on 1 August 2022).
Education 13 00448 g001
Figure 2. A proposed model that elaborates on intercorrelations within TPACK and correlations between TPACK’s knowledge combination and technology integration among Indonesian preservice teachers (direct effects, Education 13 00448 i001; indirect effects, Education 13 00448 i002).
Education 13 00448 g002
Figure 3. Measurement model showing the substantial loading of the scale of the construct.
Education 13 00448 g003
Figure 4. The t value, coefficient of determination (R2), and predictive relevance (Q2) of the final model.
Education 13 00448 g004
Table 1. TPACK-factors-intercorrelation studies.
Authorn. SampleMethodInter-Correlation
[18]211 school teachersPearson product-moment correlations (r)PK -> CK (r = 0.63) **
CK -> PCK (r = 0.42) **
CK -> TK (r = 0.29) **
TK -> TPCK (r = 0.56) **
PCK -> TPK (r = 0.54) **
TCK -> PCK (r = 0.43) **
TPK -> TPCK (r = 0.73) **
TPCK -> CK (r = 0.27) **
etc.
[17]390 PSTs
394 in-service teachers
CB-SEMCK -> TCK (β = 0.13) **
CK -> TPACK (β = 0.10) *
TK -> TCK (β = 0.63) **
TK -> TPK (β = 0.46) **
PK -> PCK (β = 0.64) **
PK -> TPK (β = 0.35) **
TPK -> TPACK (β = 0.31) **
[19]177 Turkish PSTs (1st phase)
882 Turkish PSTs (2nd phase)
Path analysis (CB-SEM)TK -> TPK (β = 0.74) **
TK -> TCK (β = 0.62) **
PK -> TPK (β = 0.28) **
PK -> PCK (β = 0.70) **
CK -> PCK (β = 0.34) **
CK -> TCK (β = 0.19) **
TCK -> TPACK (β = 0.58) **
TPK -> TPACK (β = 0.41) **
PCK -> TPACK (β = 0.16) **
[20] 665 PSTs in 18 Belgium training institutionsFactor correlationTPK -> TCK (0.98) **
TPK -> TPACK (0.99) **
TCK -> TPACK (0.98) **
TK -> TPK (0.86) **
TK -> TPK (0.81) **
TK -> TPCK (0.81) **
[16]276 PSTs from FinlandPearson product-moment correlations (r)PK21 -> PCK21 (r = 0.74) **
CK -> PCK 21 (r = 0.47) **
CK -> TK (r = 0.25) **
PCK21 -> TK (r = 0.21) **
TCK -> PK21 (r = 0.62) **
TK -> PK21 (r = 0.22) **
TPK21 -> PK21 (r = 0.51)
TCK -> TK (r =0.44) **
TPK21 -> TCK (r = 0.72) **
TPK21 -> PCK21 (r = 0.62) **
TCK -> PCK21 (r = 0.62) **
etc.
[21] 287 preservice language teachers PLS-SEMTK -> TCK (β = 0.321) **
TK -> TPK (β = 0.286) **
CK -> TCK (β = 0.281) **
CK -> PCK (β = 0.224) **
PK -> TPK (β = 0.377) **
PK -> PCK (β = 0.447) **
TCK -> TPACK (β = 0.144) **
TPK -> TPACK (β = 0.555) **
PCK -> TPACK (β = 0.199) **
[22]481 Indonesian PSTsPearson product-moment correlations (r)TK -> CK (r = 0.51) **
CK -> PCK (r = 0.69) **
TK -> TPK (r = 0.59) **
PCK -> TPK (r = 0.74) **
PK -> TPK (r = 0.65) **
TPK -> TPACK (r = 0.89) **
etc.
Note. * p < 0.05; ** p < 0.01.
Table 2. The correlations between TPACK and technology integration in education.
AuthorSampleMethodSignificant Correlation
[28]349 in-service high-school teachers in TurkeySEMTPACK -> Technostress (β = −0.240) *
[21] 287 preservice language teachers PLS-SEMTPK -> use of ICT (β = 0.153) **, PCK -> TPACK (β = 0.199) **, PCK -> use of ICT (β = 0.092) **, TPACK -> use of ICT (β = 0.354) **
[29] 209 Iranian EFL teachersCB-SEMTPACK -> Technology integration (β = 0.262) *
[30]Two preservice teachersRegressionTPACK -> Behavioral intention attitude to ICT (β = 0.560) **
[23]599 Turkish PSTs from 6 universitiesCB-SEMPK -> Integration of ICT * (β = 0.330) **
[31]1181 PSTsPLS-SEMTPACK -> Behavioral intention (β = 0.235) **
[6]296 Koran PSTsCB-SEMTPACK -> intention to use ICT (β = 0.560) **
[25]54 teacher educatorsCB-SEMPerceived PK -> Perceived technology integration (β = 0.18) **
Perceived TK -> perceived technology integration (β = 0.720) **
[7]226 Serbian PSTsCB-SEMTPCK -> Behavioral intention, traditional use of technology (β = 0.30) **
TPCK -> Behavioral intention, innovative use of technology (β = 0.33) **
[8]464 Chinese PSTsCB-SEMTPACK -> intention to use Web 2.0 technology (β = 0.260) **
[26]688 PSTsSEMTPACK -> Technology integration (r = 0.12) **
[27]1439 Turkish PSTsCB-SEMDigital nativity -> TPACK (β = 0.59) **
Note. * p < 0.05; ** p < 0.01.
Table 3. Factor loading, reliability, and validity of measurement model.
ConstructItemsLoadingrho_ACRAVEVIF
CKCK10.81000.76800.86400.67901.448
CK20.8040 1.577
CK30.8560 1.704
PCKPCK10.96000.92400.94600.89702.737
PCK20.9340 2.737
PKPK10.74100.86200.89600.59001.687
PK20.7920 1.921
PK30.7530 1.692
PK50.7510 1.726
PK60.7870 1.859
PK70.7830 1.866
TCKTCK10.96100.92400.94800.90102.832
TCK20.9380 2.832
Technology integrationTI10.65400.91300.92500.50701.791
TI100.7530 2.232
TI110.7270 2.134
TI120.6530 1.753
TI20.6800 1.687
TI30.7270 2.243
TI40.7020 1.985
TI50.7250 2.267
TI60.7360 2.463
TI70.7490 2.201
TI80.7450 2.231
TI90.6830 1.801
TKTK10.88300.83300.89400.73802.024
TK20.8850 2.218
TK30.8080 1.615
TPACKTPACK10.82400.86200.89900.64001.974
TPACK20.8120 1.942
TPACK30.8040 1.916
TPACK40.7460 1.624
TPACK50.8100 1.902
TPKTPK20.83200.78500.87400.69701.635
TPK30.8280 1.623
TPK40.8450 1.629
Table 4. HTMT < 0.900 and model fit [37].
CKPCKPKTCKTKTPACKTPKSaturated Model
PCK0.6180 SRMR0.054
PK0.80000.6700 d_ULS1.961
TCK0.52000.50200.5060 d_G0.65
TK0.60900.43900.53900.5240
TPACK0.66800.56500.69600.60900.5830
TPK0.60200.50400.61500.65700.56800.8740
Technology integration0.53000.46700.58300.47600.52400.65300.6050
Table 5. Structural model, TPACK factors’ intercorrelation and correlation with technology integration.
HCoefficientβt-Valuep-Valuef2Remarks
H1TK -> TCK0.32109.1850p < 0.0010.1080, mediumSupported
H2TK -> TPK0.28608.5160p < 0.0010.0960, mediumSupported
H3CK -> TCK0.28108.3310p < 0.0010.0830, smallSupported
H4CK -> PCK0.22406.1870p < 0.0010.0470, smallSupported
H5PK -> TPK0.377012.1920p < 0.0010.1660, mediumSupported
H6PK -> PCK0.447013.2060p < 0.0010.1860, mediumSupported
H7TCK -> TPACK0.14505.8940p < 0.0010.0310, smallSupported
H8TPK -> TPACK0.555023.5870p < 0.0010.4770, largeSupported
H9PCK -> TPACK0.19907.7540p < 0.0010.0700, mediumSupported
H10TCK -> Technology integration0.10403.3340p < 0.010.0110, smallSupported
H11TPK -> Technology integration0.14203.8630p < 0.0010.0150, smallSupported
H12PCK -> Technology integration0.14304.6040p < 0.0010.0230, smallSupported
H13TPACK -> Technology integration0.35309.2400p < 0.0010.0860, mediumSupported
H14TCK -> TPACK -> Technology integration0.05105.1570p < 0.001-Supported
H15TPK -> TPACK -> Technology integration0.19608.4260p < 0.001-Supported
H16PCK -> TPACK -> Technology integration0.07005.6610p < 0.001-Supported
Table 6. IPMA results.
Importance and # (Rank)Performance
TCKTPKPCKTPACKTechnology Integration
CK0.3090, #2 0.2470, #2 66.5700
PCK 0.1670, #20.1830, #366.6570
PK 0.4120, #10.5540, #1 67.4310
TCK 0.1220, #30.1330, #467.4200
TK0.3260, #10.2570, #2 62.4450
TPACK 0.3590, #165.2350
TPK 0.5290, #10.3280, #262.0710
Technology integration 70.4130
Disclaimer/Publisher’s Note: The statements, opinions and data contained in all publications are solely those of the individual author(s) and contributor(s) and not of MDPI and/or the editor(s). MDPI and/or the editor(s) disclaim responsibility for any injury to people or property resulting from any ideas, methods, instructions or products referred to in the content.