Abstract
Distributed leadership (DL) is defined as the degree of contact and involvement of various people in making choices or carrying out responsibilities, and is an increasingly used concept among researchers, policymakers, and educationalists worldwide. However, few studies have investigated the cross-cultural comparability of the distributed leadership scale for school principals, and few have ranked countries according to their levels of distributed leadership. This study employs an innovative alignment optimisation approach to compare the latent means of distributed leadership, as perceived by school principals, across 40 countries, using data from the OECD Teaching and Learning International Survey (TALIS, 2018). We found that South Korea, Colombia, Shanghai (China), and Lithuania had the highest levels of distributed leadership in school decisions, from the perspective of school principals. In contrast, the Netherlands, Belgium, Argentina, and Japan had the lowest levels. Our findings may serve as guidance for education stakeholders over which nations they could learn from in order to enhance school principal distributed leadership.
1. Introduction
Over the last decade, distributed leadership (DL) has increased in popularity worldwide (see, for example [1,2,3]). According to [4], a distributed viewpoint frames leadership practice in a specific way; it is seen as the result of the interactions between school leaders, followers, and their environment. The literature indicates that if principals distribute leadership appropriately among stakeholders such as the management team, teachers, and students, school performance as determined by the effectiveness of its education and the academic progress of its students tends to improve [5,6,7,8]. A growing body of research has analysed distributed leadership and its association with quality of education [9], teacher job satisfaction [10,11], organisational commitment [12,13,14], organisational change [15], and school climate [16], across diverse countries. However, authors like [17,18] highlighted the importance of contextual and cultural influences in the implementation of school leadership policy. Specifically, Ref. [19] (p. 2) emphasised the importance of country context for distributed leadership, concluding that “distributed leadership varies by leadership function and appears to be influenced by country education policy”. Due to these cultural differences in leadership processes [20,21,22], it is important to investigate further the equivalence of leadership concepts across countries. In other words, we need to test whether the definition and conceptualisation of such leadership constructs are the same across diverse cultures.
International large-scale assessments (ILSAs) are designed to investigate the relationship between various characteristics of teachers, principals, and schools by using background questionnaires. Background questionnaires are questionnaires that include a broad range of questions for school teachers and principals. The Teaching and Learning International Survey (TALIS, 2018) is one of the most widespread ISLAs and is conducted by the Organisation for Economic Cooperation and Development (OECD) across the world [23]. Although TALIS collects data on different leadership styles and their association with different aspects of school- and teacher-related factors, there still appear to be validity issues in the cross-cultural comparison of these theoretical constructs [24,25]. To be able to interpret survey scores acquired from different cultural groups in the same way, we need to establish cross-cultural comparability using empirical data. This is known as measurement equivalence or invariance.
A key reason why measurement invariance is often violated in ILSAs is the assumed universality of attitudinal constructs across cultures. Attitudinal constructs may not be comparable across cultures since cultural factors might shape how a background questionnaire is interpreted and, accordingly, how it is responded to [26]. For this reason, studies of principals using international large-scale assessments such as TALIS face potential difficulties in making cross-cultural comparisons [23].
Specific leadership strategies might work effectively in some countries but not others because of the diversity of culture across contexts. For example, principals who work in socioeconomically disadvantaged schools might engage other stakeholders for leadership activities less frequently than principals who work in more affluent schools [27]. In this sense, school contextual factors, country characteristics, and educational systems may influence the attitudes and strategies of principals because of the diverse educational system-level characteristics and policies [28]. It is important to be able to make comparisons of the mean of theoretical constructs (e.g., distributed leadership) across countries to understand their relationship with student outcomes and teacher-related factors in multi-country analysis. There are, however, very few studies that have tested for invariance in order to compare the latent factor means of school principal constructs across education systems or countries [29,30].
In this study, we used a relatively novel and recent approach known as Alignment Optimisation [31,32]. We use this to compare latent means, across countries, of the “Distributed Leadership Scale”, the most studied leadership concept of the last decade [1]. We use distributed leadership scores from the perspective of principals from The Teaching and Learning International Survey (TALIS, 2018) [23]. The use of alignment optimisation is a strength of this study, both theoretically and methodologically, due to the greater robustness of analysis when compared to traditional methods of comparing latent means across groups such as Multi-Group Confirmatory Factor Analysis (MGCFA). This study should be seen as a starting point for improving international comparison through finding equivalent scores (measurement invariance) across countries for the “Distributed Leadership Scale”. The study results provide valuable information to improve the measurement of concepts such as principal school leadership and caution the inferences drawn from international comparisons. National and local governments and the organisations that carry out international assessments could be the primary beneficiaries of the procedures and conclusions developed in this research.
In the following section, we provide a brief conceptual summary of distributed leadership and its conceptualisation in the context of the OECD’s TALIS study. Later, we present an overview of measurement invariance and empirical research on measurement invariance of teacher and leadership constructs in ILSAs, mainly using TALIS data. Then, we introduce our sample, variables, analytical strategy, and present our findings. Lastly, we discuss our results and present implications for both policymaking and future research.
2. Theoretical Framework
Distributed Leadership
In the literature, there is not yet an agreed universal conceptualisation of distributed leadership among researchers, despite the substantial attention it has received over the last decade [1,33,34]. From one perspective [35] defined distributed leadership as the level of interaction and involvement of different individuals in making decisions or completing tasks. From another perspective [4], (p. 144) stated, “a distributed perspective frames leadership practice in a particular way; leadership practice is viewed as a product of the interactions of school leaders, followers, and their situation”. In Spillane’s conceptualisation, there is no distinct border between leaders and followers. Whether someone is a leader or follower varies between situations. Spillane conceives of situation as being comprised of organisational routines, structures, and tools.
Ref. [4] (p. 145) posits that situation forms “leadership practice”. Tools incorporate everything from student evaluation evidence to teacher evaluation formalities. An evaluation made over a certain period is an example of a routine. Structure is the sum of routines. These structures can include teachers’ planning periods before the beginning of each term or the routine of parent–teacher conferences/parent’s evenings. In some cases, teachers may be able to request approval from the principal to take ownership of the organisation of these structures and then engage other stakeholders to execute the task [36].
Contemporary literature has also provided a wide range of leadership functions to elucidate how leadership might be distributed in the school context [5,37]. Ref. [37] outlined four different functions in distributing leadership—setting school direction, developing people, redesigning the organisational structure, and managing the instructional program. The setting school direction component refers to instilling a general understanding of the group members in a way that addresses the general objectives and purposes of the organisation [38]. The developing people component refers to establishing environments to enable interaction and collaboration among teachers. For example, in the context of teachers’ professional development, procedures may be set up such as observing other teachers’ teaching activities, informing parents about students’ progress, and the process for evaluating students [39,40]. The instructional management component refers to administering, structuring, and assessing instruction, arranging the educational programme, and taking an active role in the evaluation processes of students by supervising student progress [41]. The organisational decision-making component refers to supporting the interaction among associates of a school regarding problem solving, communication, and shared decision making [42]. Therefore, sharing decision making responsibilities enables other stakeholders such as teachers, students, and the managerial team to be involved in school leadership to a greater degree [15].
In this study, the construction of distributed leadership is restricted to the last component of distributed leadership (shared decision making). This component is comprised of two dimensions. The first is the strength of the participation of teachers, students, and parents and guardians in the decision-making process [43]. The second is school culture. School culture is strongly related to establishing an environment that facilitates shared responsibility for school issues and the creation of a collaborative school culture based on mutual support for all stakeholders [43].
3. Techniques of Testing Measurement Invariance
The primary purpose of TALIS is to produce internationally comparable background information regarding teachers and their teaching practices, and principals and school management, which directly or indirectly influence student learning and academic achievement [44]. However, cross-cultural comparability of the constructs derived from TALIS’s questions might be problematic. This is due to the lack of evidence of the generalisability of the instruments across countries. Participants from different countries and cultures may understand and interpret questions differently, therefore, affecting cross-country comparability [45]. To address the issue of cross-country comparability, the measurement invariance of instruments used in TALIS should be investigated [46]. To be able to make the mean comparison of these constructs across countries, measurement invariance should satisfy the more restrictive level (scalar invariance), though this is often difficult to achieve.
TALIS experts evaluate measurement invariance within the Confirmatory Factor Analysis (CFA) framework [24,47]. Measurement invariance implies that using the same questionnaire in different groups (e.g., countries or at various points in time) does measure the same theoretical construct in the same way and, therefore, that the resulting scores can be interpreted in a comparative fashion [48]. Most tests of measurement invariance include configural, metric, and scalar steps [29,46]. Configural invariance or structural equivalence implies that the same model holds for all the groups. Metric invariance implies that the factor loadings are the same across the groups and, therefore, comparing unstandardised regression coefficients and/or covariances across groups is allowed. Finally, scalar invariance or full score equivalence implies that the intercepts are the same across all countries being compared and, therefore, the latent factor means can be compared (see Figure 1 for a graphical representation of these concepts). However, reaching this level of invariance is almost always unrealistic in the context of ILSAs such as TALIS. Therefore, latent mean comparisons of constructs such as principal distributed leadership across countries should be made with caution as they do not reach scalar-level invariance [23].
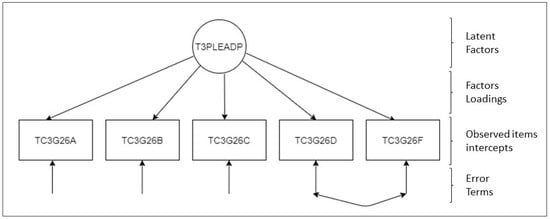
Figure 1.
Measurement model for principal perceptions of participation among stakeholder scale.
When the scalar invariance level is not reached, a partial invariance method can be used that increases the invariance level of the model by making some adjustments. This can be used instead of completely sacrificing the model. The partial invariance approach contains the adjustment in modification indices by stages in which the items in the construct with most invariance are first detected and later constrained equally across the groups for the latent mean comparison of the model to be tested, and the items with non-invariance are freely estimated across the groups [49]. However, the partial measurement invariance approach can be laborious. This is mainly because once there are many groups or items within each factor in the model, the model requires manual adjustment according to the modification indices [31]. Moreover [50] suggested that the partial invariance method should not be preferred when many indicators are found to be noninvariant.
Alignment optimisation, a relatively new and novel approach, has been recommended over traditional measurement invariance approaches for the comparison of latent averages across diverse groups [31,32]. The process of alignment optimisation first determines the most non-invariance items. Later, those items’ influence on the scalar non-invariance of the measurement model is optimised iteratively. Thus, the minimum scalar non-invariance is obtained to make average comparisons of the measurement model [32]. This technique can be employed to compare unobserved averages across diverse groups and rank the countries with the highest and lowest averages in the measurement model (in the construct).
However, in the literature, relatively few studies employ alignment optimisation in the context of International Large-Scale Assessments (ILSAs) [26,51,52]. Although, some examples include the following. Ref. [51] analysed the measurement invariance of the CIVED99 and ICCS 2009 data’s adolescents’ support for an immigrants’ rights construct using alignment optimisation across 92 groups (by country, cohort, and gender) and found that unbiased group comparisons were possible despite the presence of significant non-invariance in some groups. Ref. [52] compared the latent means of a job satisfaction scale using alignment optimisation across 48 countries using TALIS 2018 data. Ref. [26] compared the TIMSS’ 2015 teacher-related characteristics using alignment optimisation and argued that these constructs could be validly compared across educational systems, and a subsequent comparison of latent factor means compares differences across the groups.
There are relatively few studies on the comparability of the distributed leadership concept across countries. Recently, Printy and Liu [19] and Liu [28], using TALIS 2013 data across 32 countries, found that country and contextual factors and educational policies in each education system may influence distributed leadership activities and may be associated with how leadership is distributed within schools. To the best of our knowledge, no previous studies have used alignment optimisation to study school principal constructs such as the principal distributed leadership scale. We see alignment optimisation as a more appropriate method for making cross-cultural comparisons than traditional methods such as MGCFA. For this reason, we use alignment optimisation [31,32] to compare latent means of the “distributed leadership scale” from the perspective of principals. We can then, to some extent, compare our results to those of Printy and Liu [19] and Liu [28] and other related studies in the literature.
The scope of this study is the examination of how principals’ perceived distributed leadership styles differ across countries. In this study, in our conceptualisation of distributed leadership, we address the subordinates’ roles from the perspective of principals. We conceive countries as a unit of analysis, in the sense that scores may differ between schooling systems and cultural contexts [21,22,53]. Therefore, in this study, we aim to test the cross-cultural comparability of principals’ perceived distributed leadership.
4. Methodology
4.1. Data
This study uses data from the OECD’s Teaching and Learning International Survey (TALIS) 2018 survey. TALIS is an international survey that collects information from teachers and school principals about working conditions and learning environments in their schools to help countries confront various challenges. The last cycle of TALIS (2018) was administered in 48 countries.
In each participating country, approximately 200 schools, and 20 teachers within each school, were selected using a probabilistic sampling technique [23]. This survey includes information on teachers and principals from primary school International Standard Classification of Education (ISCED 1), lower secondary school (ISCED 2), and upper secondary school (ISCED 3). Our focus is on “ISCED level 2” (i.e., lower secondary school) since ISCED level 2 comprises all countries included at ISCED level 1 and ISCED level 3, as well as additional countries. The final sample size is 9247 principals from 48 countries.
4.2. Measures
In this study, our interest is on the “participation among stakeholders, from the principals’ perspective” (T3PLEADP), which has been operationalised and measured in TALIS 2018 with five items, each using a 4-point Likert scale. Principals were asked to reply to the question of “How strongly do you agree or disagree with these statements as applied to this school?” regarding a four-level rating level (1 = Strongly disagree, 2 = Disagree, 3 = Agree, 4 = Strongly agree). Descriptive statistics of the countries in the sample and each item that comprises the T3PLEADP scale are provided in Table 1.

Table 1.
Descriptive Statistics of the T3PLEADP scale.
Originally, there were plans to construct four other scales measuring different aspects of distributed leadership in the TALIS study. These scales were not included in the final international dataset for a variety of reasons. For example, there was a scale labelled as Distributed Leadership, which contained some of the same items used for T3PLEADP. However, the TALIS technical experts considered that T3PLEADP measured this latent construct more accurately (i.e., distributed leadership) [23] (p. 429). For this reason, we continue our analysis using the T3PLEADP scale as the focus of our study. Furthermore, this scale has been used by previous studies to operationalise principals’ perspective of distributed leadership (see, for example [11,16,54,55]).
4.3. Analytical Strategy
Our analytical strategy consisted of four main steps. (i) We first established the internal consistency of the scale, that is, the extent to which the items proposed by TALIS as part of the T3PLEADP scale measure aspects of the same characteristic or construct (i.e., distributed leadership). (ii) We then evaluated the extent to which the proposed measurement (theoretical) model (see Figure 1) fit the empirical data collected in each country. (iii) The next step was to test for measurement invariance, also known as measurement equivalence. This is a statistical property of measurement that indicates that the same construct is being measured across different groups (e.g., countries) of respondents. (iv) We finally used the alignment optimisation technique to produce scores that are strictly comparable across countries. Please note that alignment optimisation allows the estimation of comparable means based on partially noninvariant measurements. So, if the analysis described in step iii reveals full invariance of the construct, then alignment optimisation would not be needed.
5. Internal Consistency
Figure 1 provides a schematic visualisation of the T3PLEADP measurement model used in the present study. “Participation among stakeholders, principals” (T3PLEADP) is a latent (unobserved) construct that consists of five items (observed indicators) as presented by the TALIS research team. The double-headed arrow between TC3G26D’s and TC3G26F’s error variance represents the residual/error covariance between these two items in the measurement model. The TALIS research team suggested adding this error covariance in order to improve the model fit [23].
Before moving to measurement invariance and alignment analysis, we first checked the internal consistency of the T3PLEADP scale. This is done as a preliminary analysis given that construct validity is a precondition that needs to be taken into account as a first step in the measurement invariance and alignment method approach. We found that the values of McDonald’s omega [56] for each participating country met the criteria of internal consistency [57]. In almost all cases, values were 0.6 or greater (in a scale from 0 to 1). We preferred using McDonald’s omega rather than Cronbach’s alpha because it is more suitable for a one-factor model, as it demands fewer assumptions [58,59]. Results for each country can be consulted in Appendix A.
5.1. Measurement Model (Confirmatory Factor Analysis)
A confirmatory factor analysis (CFA) was estimated to evaluate the measurement model in each country. Model fit was assessed using the Comparative Fit Index (CFI) and the Tucker–Lewis index (TLI) as goodness of fit statistics. The root-mean squared error of approximation (RMSEA) and the standardised root mean-squared residual (SRMR) were used as residual fit statistics. The closer the CFI and TLI values are to 1, and the closer the RMSEA and SRMR values are to 0, the better the model fit. Acceptable model fit is indicated by CFI > 0.90; TLI > 0.90; RMSEA < 0.10; and SRMR < 0.08 as proposed by [60,61,62].
5.2. Measurement Invariance Analysis
Following the common practice in the field, we evaluated measurement invariance of the T3PLEADP scale in three steps: configural, metric, and scalar [29,46]. Configural invariance was examined by implementing a multiple group confirmatory factor analysis (MCFA) to validate the measurement model (Figure 1). Later, metric invariance and scalar invariance models were estimated. Change in CFI (ΔCFI) and change in RMSEA (ΔRMSEA) values were considered in order to evaluate metric and scalar invariance. We used the criteria suggested by [60,62]. To determine metric invariance, these authors suggest a slightly more liberal criterion of around −0.020 for ΔCFI and 0.030 for ΔRMSEA. To determine scalar invariance, the traditional cut-off values were taken into consideration, i.e., −0.010 for ΔCFI and a ΔRMSEA of 0.010.
It is important to highlight that Chen [60] and Rutkowski and Svetina [62] recommended that the traditional chi-square difference test (Satorra and Bentler [63]) is not recommended when comparing models with large samples and groups, as in these cases the test statistics are highly sensitive to small changes. Moreover, the Robust Maximum Likelihood (MLR) estimator was used since it performs a component capacity in the analysis of ordinal data [64], and alignment optimisation, which is our further analysis, is only appropriate for MLR estimation [32].
5.3. Alignment Optimisation Analysis
The process of the alignment optimisation approach is based on an exploratory multiple-group factor analysis to seek an optimal design of measurement invariance with the most satisfactory means and variance even in the existence of non-invariance to make group mean comparisons across groups [31]. There are two stages in alignment optimisation. First, a configural invariance model is fit across the groups, in which factor loadings and intercepts should be free across groups, factor means are fixed at zero, and factor variances are fixed at one. Second, the factor means and variances are freed, which means we do not “assume measurement invariance and can estimate the factor mean and variance parameters in each group while discovering the most optimal measurement invariance pattern. The method incorporates a simplicity function similar to the rotation criteria used with exploratory factor analysis (EFA)” (Asparouhov and Muthen [31], p. 496). Finally, following Asparouhov and Muthen [31], after the alignment estimation is completed, a detailed analysis is conducted to determine which measurement parameters are approximately invariant and which are not, both by visualising and by counting the misfit for factor loadings and intercepts. To evaluate the quality and reliability of the alignment results, Asparouhov and Muthen [31] and Muthen and Asparouhov [65] suggest a limit of 25% non-invariance as a threshold.
6. Results
6.1. The Results of Confirmatory Factor Analysis (CFA) and Measurement Invariance
First, a single factor measurement model shown in Figure 1 was fitted for each participating country. At this stage, Australia, Czech Republic, Denmark, Iceland, Italy, Mexico, Singapore, Slovak Republic, and Flemish Belgium were discarded from further analysis as they did not have acceptable goodness of fit and residual fit statistics as suggested by Hu and Bentler [61] and Rutkowski and Svetina [62]. We continued our analysis with the remaining 40 countries. As can be seen in Table 2, measurement invariance analysis indicated that both configural and metric invariance indicated acceptable model fits, but the scalar invariance model did not reach the specified thresholds (i.e., −0.010 for ΔCFI and a ΔRMSEA of 0.010). Therefore, we applied the alignment optimisation approach to construct scores that allow for the comparison of latent means across countries.
Table 2.
Multiple group configural, metric, and scalar invariance of the T3PLEADP scale (model comparison).
6.2. The Results of Alignment Method
After we could not establish scalar invariance, we employed the alignment optimisation approach to make cross-cultural latent mean comparisons of the T3PLEADP scale across countries. First, the FREE alignment estimation procedure offered by MPlus (Muthén and Muthén [66]) was used. However, this resulted in an error warning stating that the standard error comparison indicates that the free alignment model was poorly identified. So, we used the FIXED alignment option to solve this problem. Muthen and Asparouhov [32] recommend that the FIXED alignment method should be used when a country mean is equal to 0 or close to 0. In our case, this country was found to be Kazakhstan (mean = −0.030). Table 3 presents non-invariance items in factor loadings and intercepts and non-invariance countries and economies in factor loadings; intercepts are provided in parentheses in bold text.
Table 3.
Results of non-invariance of factor loadings and intercepts of each item of the T3PLEADP scale across 40 countries and economies.
Table 3 shows that the item TC3G26F has the most significant non-invariance in factor loadings (five countries) across the 40 countries analysed. The item TC3G26D has significant non-invariance factor loadings only in one country (Shanghai (China), country = 156,001). The rest of the items, TC3G26A, TC3G26B, and TC3G26C, have no countries with significant non-invariance. On the other hand, all the items show significant non-invariance in intercepts across the analysed countries. The item TC3G26F has the most significant non-invariance in intercepts (nine countries), whilst TC3G26B has the least significant non-invariance in intercepts (three countries).
Table 4 provides the R-squared results from the aligned modelling procedure for the latent construct T3PLEADP. The highest R-squared of the intercept is captured for the variables “This school provides students with opportunities to actively participate in school decisions” (TC3G26C) and “This school provides parents or guardians with opportunities to actively participate in school decisions” (TC3G26B). In other words, approximately 80% of the variation in the intercept in the configural model can be explained by the variation in the unobserved variable mean and variance in the alignment model, representing a high level of invariance. The least R-squared of the intercept is observed for the variable “There is a collaborative school culture which is characterized by mutual support”.
Table 4.
Alignment Fit Statistics.
For the factor loadings, the highest R-squared of the factor loading is captured for the variable “This school provides staff with opportunities to actively participate in school decisions”. The lowest R-squared of the factor loading is observed for the variable “There is a collaborative school culture which is characterized by mutual support”. Overall, the R-squared values of the item TC3G26F in factor loadings and intercept show that the item made the least contribution to the simplicity function. This item has the most significant non-invariance across the 40 countries and economies.
For country parameter estimates in Table 5, we find that Saudi Arabia has the lowest intercept estimates in the item ” This school provides staff with opportunities to actively participate in school decisions”, while Hungary has the lowest factor loading estimate. England has the highest intercept estimates in the item ”This school provides staff with opportunities to actively participate in school decisions”, whereas Cyprus has the highest factor loading estimate. The average invariance index is 45% for the T3PLEADP scale. The percentage of significant non-invariance groups is 8.75%, which is dramatically lower than the limit (25%) recommended by Muthen and Asparouhov [43]. As a result, whilst a considerably higher number of countries show invariance in factor loadings, this appears to be less of an issue for intercepts (in Table 3, Table 4 and Table 5).
Table 5.
Results from the aligned model of principal distributed leadership (T3PLEADP)—Item Parameter Estimates in the Alignment Optimisation Metric.
After the specification of items with significant non-invariance both in factor loadings and in intercepts, and each items’ contribution to the scale’s scalar non-invariance (Table 4), the iterative optimisation procedure was employed. This gives us the latent mean comparison of the T3PLEADP scale with significance levels, and each country’s latent mean is presented in descending order according to their ranking in Table 6.
Table 6.
Latent mean comparison and ranking of the T3PLEADP scale across 40 participating countries and economies in the TALIS 2018 survey.
As shown in Table 6, South Korea (country code 410) has the highest mean ranking on the T3PLEADP scale with a mean of 0.634 and Japan (country code 392) has the lowest mean ranking with a mean of −1.388, among the 40 countries and economies. This shows that, for the countries included in TALIS 2018, from the perspective of principals, leadership is most distributed in lower secondary schools in Korea, and least distributed in Japan. After the principals in Korea, principals in Colombia (country code 170), Shanghai (China) (country code 156001), Lithuania (country code 440), Georgia (country code 268), and the Russian Federation (country code 643) report having the highest levels of distributed leadership in school decision-making procedures in lower secondary school. The countries with the lowest levels of distributed leadership, following Japan, were Argentina (country code 32001), Belgium (country code 56), Netherlands (country code 528), Saudi Arabia (country code 682), and Israel (country code 376). On average, these countries have the lowest distributed leadership in decision-making procedures in schools across the countries that took part in TALIS 2018. Principals in the countries of the United Arab Emirates (country code 784), Hungary (country code 348), Kazakhstan (country code 398), Spain (country code 724), Brazil (country code 76), and Portugal (country code 620) took their position in the middle of Table 6.
Levels of principals’ distributed leadership in decision making in lower secondary schools vary from one country to another (Table 6). For example, lower secondary school principals in Turkey (country code 792) have less distributed leadership in decision making compared to the first 12 countries and economies in the ranking. On the other hand, principals in Turkey have greater distributed leadership in school decision making than 27 countries in the sample, such as Slovenia (country code 705), the United Arab Emirates (country code 784), Hungary (country code 348), Kazakhstan (country code 398), Spain (country code 724), Brazil (country code 76), and Portugal (country code 620). Similar comparisons can be made for any other country of interest in the sample. Using these rankings, we can see which countries have the highest levels of distributed leadership, such as Austria, Colombia, and Shanghai (China), and investigate how these countries achieve these levels of distributed leadership within their schools. Using this information, countries with lower levels of distributed leadership may learn how to emulate those countries higher in the rankings.
7. Discussion
Distributed leadership is understood as a way to include teachers, students, parents. and other stakeholders in decision-making processes, thus increasing schools’ organisational capacity and students’ outcomes. The current study adds to the literature by providing information on cross-country mean comparisons of distributed leadership. Few studies have investigated this, all of which have used a more restricted traditional measurement invariance approach compared to the alignment optimisation method. Using TALIS 2018 data from 40 countries, the results verify that we can validly and reliably compare levels of distributed leadership, as perceived by principals, between countries. In the traditional measurement invariance approach (MGCFA), the principal-perceived distributed leadership construct only met metric-level invariance, which means that the score means cannot be reliably compared across countries. Consequently, it is necessary to improve the measurement of this construct to allow for cross-cultural comparisons, which is particularly important in the context of International Large-Scale Assessments (ILSAs).
In doing so, this study employed the alignment optimisation method to address group mean comparisons considering that the principal-perceived distributed leadership construct did not satisfy with scalar invariance. This indicated that the latent factor mean of this construct cannot be comparable across countries using a traditional measurement invariance approach (MG-CFA). However, the results of the alignment optimisation approach yield a comparable pattern across countries. Our approach enables us to obtain the most optimal measurement invariance form in evaluating comparability considering the parameters of latent variable indicators of the partial invariance [31,32]. Considering the configural-level invariance model as a basis, this study uncovered that there were many variables in the principal distributed leadership construct and countries with significant non-invariance. This method allows us to see the details in the invariance model such as the underlying assistance to most scalar non-invariance as well as offers the opportunity to examine each item separately in detail (items’ factor loadings and intercepts).
Although there are few studies on cross-cultural comparison of the perceived distributed leadership of school principals, the findings of our study are comparable with some findings of Printy and Liu [19] and Liu [28]. Our findings corroborate those of Printy and Liu’s [19] study, to some extent. They found that Korea, Serbia, Bulgaria, Denmark, and Latvia have the highest levels of collaboration between teachers and principals in the organisational decision-making process (see page 310) using TALIS 2013 data. Our study found that Korea has the highest levels of distributed leadership among the 40 countries participating in TALIS 2018. We also found that Latvia ranked highly. Unlike Printy and Liu’s [19] study, however, we found that Colombia, Shanghai (China), Lithuania, Georgia, the Russian Federation, Estonia, Romania, and Alberta (Canada) have some of the highest levels of distributed leadership, ranked from two to nine, respectively.
Our results can also be explained by other school characteristics. For example, in the two countries with the highest levels of distributed leadership (Colombia and Korea), more than 80% of principals reported that parents and/or guardians are represented in their school management team. Moreover, in Colombia, more than 80% of principals reported that students are also involved in their management team [44]. In contrast, in the two countries with the lowest levels of distributed leadership (Argentina and Japan), principals tended to be more engaged in direct instructional activities, with these two countries being among those with the highest proportion of principals reporting that they are involved in direct instructional leadership activities (ibid.).
There is a need to further investigate countries that score highly on distributed leadership to understand what they are doing differently to enable greater distribution in leadership. One way of explaining why Shanghai (China) has higher levels of distributed leadership is that teachers might receive greater support from their principals for participating in school decisions and that this support may also extend to students, students’ parents, and other stakeholders.
Similar to Printy and Liu [19], we find that Japan, Israel, and the Netherlands have the lowest mean scores for distributed leadership. Schools in these countries tend to have a traditional authority structure, where principals take on most of the decision-making responsibility. Our findings support this view with Japan, the Netherlands, and Israel being ranked lowest on levels of distributed leadership. For example, in the case of Japan, following the same line of reasoning of Printy and Liu [19] and Liu [28], we posit that principals in these countries are required to take responsibility for decisions and hierarchical pressures prevent teachers from influencing school decisions. We might be able to extend this interpretation to other stakeholders.
The unique contribution of our study is to precisely rank countries according to their mean distributed leadership scores for school decision-making exercises. We restrict our focus, however, only to the “organisational decision making” component of distributed leadership. This is unlike Printy and Liu [19], who analysed the four components of distributed leadership and used their findings to categorise countries into four quadrants of distributed leadership. However, when compared to findings from TALIS 2013 (Printy and Liu [19]) and TALIS 2018 (our study), we find some similar results. This is despite the use of different analytical approaches. For example, Korea was among the highest level of distributed leadership in school decisions in 2013 and it was the highest level country in distributed leadership in school decisions in 2018. This shows that over the five-year period, Korea has more or less maintained its position in terms of levels of distributed leadership in school decision making. In this five-year period, different countries have moved towards the top of the ranking of distributed leadership such as Colombia, Shanghai (China), Lithuania, Georgia, the Russian Federation, and Estonia. For example, although Printy and Liu [19] found that Estonia had one of the lowest distributed leadership levels in TALIS 2013, this study, using TALIS 2018 data, found that Estonia ranked seventh for levels of distributed leadership in school decision making. It would therefore be of interest to investigate what changes have occurred in the Estonian educational system that have led to an increase in the levels of distributed leadership.
Although the results of this study contribute to the literature as the first robust evidence for the possible comparability of the principal-perceived distributed leadership construct, the principal-perceived distributed leadership construct did not give us clear evidence to cluster countries according to geographical regions or continents as suggested by Liu [28]. We can only observe, from Table 6 Nordic European countries (Finland, Norway, and Sweden) situated close to each other, in the ranks of 24, 25, and 27, respectively. Future research could examine these similarities and differences between countries in a comprehensive way, for example, drawing on qualitative case studies.
Furthermore, the findings of this study provide a framework for comparing one country with another based on the average principal distributed leadership. We believe that the findings of this contribution to the literature will have implications for government agencies, ministries of education, policymakers, research centres, and other stakeholders (e.g., practitioners in classrooms) in education. Our results provide robust empirical criteria to compare the levels of principals’ distributed leadership across countries.
When making decisions about how to allocate leadership responsibilities to achieve the best results, practitioners need evidence to support their decisions. This study closes the evidence gap by demonstrating how leadership responsibilities are carried out by multiple leaders rather than a single one and how the process may differ between schools and nations. Such findings inspire more experimental investigations on DL behaviours in various nations because the prevailing data, which were mostly produced in the United States and the United Kingdom, might not apply to nations with diverse cultural alignments. This, in turn, can help decision makers to identify those education systems that have contextual, cultural, or historical similarities to their own in order to carry out in-depth studies that allow them to learn from each other. We believe that this kind of in-depth analysis can assist in the development of educational institutions and practices. The perceptions of principals’ distributed leadership are important to schools’ organisational capacity, as well as for student outcomes (see, for example [5,6,7]) and it has been argued that it can contribute to school effectiveness and improvement.
8. Strengths and Limitations of the Study
The purpose of this study was to test the validity of latent mean comparisons of principal distributed leadership across different countries. Given the number of countries and the diversity of the sample in TALIS worldwide, it is almost impossible to reach the scalar level of invariance which is required for multiple groups mean comparison. However, implementing a relatively new and practical alignment optimisation approach [31,32], depending on an approximate scalar invariance, enables us to compare the means of the principal-perceived distributed leadership scale across 40 countries and economies. Korea was found to have the highest levels of distributed leadership in school decisions from the perspective of principals, whereas Japan was found to have the lowest levels of distributed leadership. Furthermore, the findings of this study allow us to make comparisons between one country and another as these types of findings are relatively scarce in previous research.
Although this study used large-scale international data, a clear theoretical framework, and a relatively new efficient alignment optimisation method, there are important limitations to consider. First of all, researchers should be careful and cautious in their interpretation of findings. This is because the study uses principals’ self-reported data, which may be subject to common self-report data biases [67]. Therefore, for future studies, student, teacher, and other stakeholder opinions should also be taken into consideration for a more robust analysis. Another limitation of this study is the impossibility of combining two scales that measure the other components of distributed leadership in the TALIS 2018 questionnaire (Printy and Liu [19]) using the alignment optimisation approach. We chose to only consider the “organisational decision making” component of distributed leadership. This is because it is not suitable to combine multiple scales when using alignment optimisation.
Another limitation of this study is that we analysed only one component of distributed leadership: organisational decision making. Distributed leadership, however, is an extensive and multidimensional concept that consists of dimensions such as setting school direction, developing people, redesigning organisational structure, and managing instructional practice. Our study is therefore limited by the fact we do not measure all dimensions of distributed leadership as it is typically conceived in the literature. Further studies should attempt to include all these dimensions.
9. Suggestions for Future Studies
Researchers might also benefit from the use of alignment optimisation, firstly, to investigate whether distributed leadership, as perceived by principals, is capturing the same phenomena, and is therefore comparable, across TALIS surveys. Secondly, researchers can use alignment optimisation to investigate the variation in principal-perceived distributed leadership across the last decade (TALIS 2008, 2013, 2018) for each country. Furthermore, we suggest that researchers conduct in-depth comparisons of distributed leadership, as perceived by principals, across subpopulations within countries. This is because schools that have a large number of minority students tend to have more parties involved in management, and teachers are more likely to engage in leadership roles than schools that have fewer minority students. Also, schools that are in a socio-economically disadvantaged position are unable to apply efficient distributed leadership procedures; instead, they are forced to rely on an instructional form of leadership.
10. Conclusions
All in all, the results of this study are methodologically robust in terms of their comparability across diverse linguistic, economic, and socio-cultural backgrounds. The alignment optimisation method may be considered a potential up-and-coming approach to assess background questionnaires and their comparability, providing information about non-invariance for each item in the scale. The investigation of non-invariance across countries and cultures may aid the development of future background questionnaires in improving cross-cultural comparability. Moreover, this method ensures that we “purify” results from background questionnaires comprised of a sample of diverse countries or groups using the same scale. Alignment optimisation can strengthen the present International Large-Scale Assessment (ILSA) datasets by providing information on invariant, non-invariant measurement parameters, and factor scores for all background questionnaires [51]. This is important because researchers using ILSA datasets are mainly interested in comparing multiple countries. For this reason, we made our scale scores publicly available through a data repository (DOI: 10.17632/s5hrms2y52.1). So, our scale can be used by any researchers interested in running additional secondary analyses on the patterns and mechanisms explaining different levels of principals’ distributed leadership. This approach might strengthen the analyses and conclusions that can be drawn from ILSA datasets by supplying empirically comparable scales for researchers’ statistical analysis and preventing researchers from making insubstantial comparisons from pooled data. With the implementation of this method, ILSAs might ultimately serve their purpose and uncover their actual potential and provide more practical information to policymakers and education systems for future studies.
Author Contributions
Conceptualization, N.E. and A.S.-H.; methodology, N.E. and A.S.-H.; software, N.E. and A.S.-H.; validation, N.E. and A.S.-H.; formal analysis, N.E. and A.S.-H.; investigation, N.E. and A.S.-H.; resources, N.E. and A.S.-H.; data curation, N.E. and A.S.-H.; writing—original draft preparation, N.E. and A.S.-H.; writing—review and editing, N.E. and A.S.-H.; visualization, N.E. and A.S.-H.; supervision, N.E. and A.S.-H.; project administration, N.E. and A.S.-H. All authors have read and agreed to the published version of the manuscript.
Funding
This research was funded by the Ministry of National Education, Turkey.
Informed Consent Statement
Not applicable.
Conflicts of Interest
The authors declare no conflict of interest.
Appendix A
Table A1.
Country-specific sample sizes and reliability (internal consistency) of the T3PLEADP scale.
Table A1.
Country-specific sample sizes and reliability (internal consistency) of the T3PLEADP scale.
| Country Code | Country | n (Observation) | Omega Coefficient |
|---|---|---|---|
| 40 | Austria | 270 | 0.721 |
| 56 | Belgium | 288 | 0.712 |
| 76 | Brazil | 183 | 0.821 |
| 100 | Bulgaria | 200 | 0.603 |
| 152 | Chile | 167 | 0.842 |
| 158 | Chinese Taipei | 201 | 0.670 |
| 170 | Colombia | 136 | 0.830 |
| 191 | Croatia | 185 | 0.815 |
| 196 | Cyprus | 88 | 0.768 |
| 233 | Estonia | 192 | 0.762 |
| 246 | Finland | 148 | 0.701 |
| 250 | France | 186 | 0.718 |
| 268 | Georgia | 175 | 0.814 |
| 348 | Hungary | 180 | 0.738 |
| 376 | Israel | 160 | 0.750 |
| 392 | Japan | 195 | 0.588 |
| 398 | Kazakhstan | 331 | 0.726 |
| 410 | Korea | 147 | 0.830 |
| 428 | Latvia | 135 | 0.695 |
| 440 | Lithuania | 194 | 0.838 |
| 470 | Malta | 53 | 0.703 |
| 528 | Netherlands | 117 | 0.660 |
| 554 | New Zealand | 183 | 0.765 |
| 578 | Norway | 160 | 0.567 |
| 620 | Portugal | 200 | 0.822 |
| 643 | Russian Federation | 230 | 0.809 |
| 682 | Saudi Arabia | 182 | 0.765 |
| 704 | Vietnam | 195 | 0.745 |
| 705 | Slovenia | 117 | 0.772 |
| 710 | South Africa | 165 | 0.812 |
| 724 | Spain | 396 | 0.810 |
| 752 | Sweden | 157 | 0.639 |
| 784 | United Arab Emirates | 461 | 0.841 |
| 792 | Turkey | 192 | 0.873 |
| 840 | United States | 156 | 0.795 |
| 926 | England | 149 | 0.774 |
| 9134 | Alberta (Canada) | 124 | 0.788 |
| 9642 | Romania | 198 | 0.780 |
| 32001 | Argentina | 121 | 0.721 |
| 156001 | Shanghai (China) | 198 | 0.898 |
References
- Gumus, S.; Bellibas, M.S.; Esen, M.; Gumus, E. A systematic review of studies on leadership models in educational research from 1980 to 2014. Educ. Manag. Adm. Leadersh. 2018, 46, 25–48. [Google Scholar]
- Harris, A.; Spillane, J. Distributed leadership through the looking glass. Manag. Educ. 2008, 22, 31–34. [Google Scholar]
- Mifsud, D. Distribution dilemmas: Exploring the presence of a tension between democracy and autocracy within a distributed leadership scenario. Educ. Manag. Adm. Leadersh. 2017, 45, 978–1001. [Google Scholar] [CrossRef]
- Spillane, J.P. Distributed leadership. Educ. Forum 2005, 69, 143–150. [Google Scholar]
- Heck, R.H.; Hallinger, P. Assessing the contribution of distributed leadership to school improvement and growth in math achievement. Am. Educ. Res. J. 2009, 46, 659–689. [Google Scholar]
- Heck, R.H.; Hallinger, P. Testing a longitudinal model of distributed leadership effects on school improvement. Leadersh. Q. 2010, 21, 867–885. [Google Scholar]
- Liu, Y. Distributed leadership practices and student science performance through the four-path model: Examining failure in underprivileged schools. J. Educ. Adm. 2021, 59, 472–492. [Google Scholar]
- Marks, H.M.; Printy, S.M. Principal leadership and school performance: An integration of transformational and instructional leadership. Educ. Adm. Q. 2003, 39, 370–397. [Google Scholar]
- Liu, Y. How Leadership is Distributed and How it is Associated with Teaching Quality? A Cross-Country Study with the TALIS 2013; Michigan State University: East Lansing, MI, USA, 2016. [Google Scholar]
- Sun, A.; Xia, J. Teacher-perceived distributed leadership, teacher self-efficacy and job satisfaction: A multilevel SEM approach using the 2013 TALIS data. Int. J. Educ. Res. 2018, 92, 86–97. [Google Scholar]
- Liu, Y.; Bellibaş, M.Ş.; Gümüş, S. The effect of instructional leadership and distributed leadership on teacher self-efficacy and job satisfaction: Mediating roles of supportive school culture and teacher collaboration. Educ. Manag. Adm. Leadersh. 2021, 49, 430–453. [Google Scholar]
- Hulpia, H.; Devos, G.; Rosseel, Y. The relationship between the perception of distributed leadership in secondary schools and teachers’ and teacher leaders’ job satisfaction and organizational commitment. Sch. Eff. Sch. Improv. 2009, 20, 291–317. [Google Scholar]
- Liu, Y.; Werblow, J. The operation of distributed leadership and the relationship with organizational commitment and job satisfaction of principals and teachers: A multi-level model and meta-analysis using the 2013 TALIS data. Int. J. Educ. Res. 2019, 96, 41–55. [Google Scholar]
- Liu, Y.; Watson, S. Whose leadership role is more substantial for teacher professional collaboration, job satisfaction and organizational commitment: A lens of distributed leadership. Int. J. Leadersh. Educ. 2020, 19, 1–29. [Google Scholar]
- Harris, A.; Leithwood, K.; Day, C.; Sammons, P.; Hopkins, D. Distributed leadership and organizational change: Reviewing the evidence. J. Educ. Change 2007, 8, 337–347. [Google Scholar]
- Bellibas, M.S.; Liu, Y. The effects of principals’ perceived instructional and distributed leadership practices on their perceptions of school climate. Int. J. Leadersh. Educ. 2018, 21, 226–244. [Google Scholar]
- Harris, A.; Jones, M. Transforming education systems: Comparative and critical perspectives on school leadership. Asia Pac. J. Educ. 2015, 35, 311–318. [Google Scholar]
- Gu, Q.; Seymour, K.; Rea, S.; Knight, R.; Ahn, M.; Sammons, P.; Kameshwara, K.K.; Hodgen, J. The Research Schools Programme in Opportunity Areas: Investigating the Impact of Research Schools in Promoting Better Outcomes in Schools. 2021. Available online: https://d2tic4wvo1iusb.cloudfront.net/documents/pages/OA-RS-Evaluation_Final-Report_October-2021.pdf (accessed on 15 December 2022).
- Printy, S.; Liu, Y. Distributed Leadership Globally: The Interactive Nature of Principal and Teacher Leadership in 32 Countries. Educ. Adm. Q. 2020, 57, 290–325. [Google Scholar]
- Brunning, M.; Fischetti, J.; Smith, M. Renewing the Promise and Potential of School-Based Management. NASSP Bull. 2020, 104, 177–201. [Google Scholar]
- Chhokar, J.S.; Brodbeck, F.C.; House, R.J. (Eds.) Culture and Leadership across the World: The GLOBE Book of in-Depth Studies of 25 Societies; Routledge: Oxfordshire, UK, 2007. [Google Scholar]
- House, R.J.; Hanges, P.J.; Javidan, M.; Dorfman, P.W.; Gupta, V. (Eds.) Culture, Leadership, and Organizations: The GLOBE Study of 62 Societies; Sage Publications: New York, NY, USA, 2004. [Google Scholar]
- OECD. TALIS 2018 Technical Report. OECD Publishing. 2019. Available online: https://www.oecd.org/education/talis/TALIS_2018_Technical_Report.pdf (accessed on 31 October 2020).
- Oliveri, M.E.; von Davier, M. Investigation of model fit and score scale comparability in international assessments. Psychol. Test Assess. Model. 2011, 53, 315. [Google Scholar]
- Rutkowski, L.; Rutkowski, D. Improving the comparability and local usefulness of international assessments: A look back and a way forward. Scand. J. Educ. Res. 2018, 62, 354–367. [Google Scholar]
- Glassow, L.N.; Rolfe, V.; Hansen, K.Y. Assessing the comparability of teacher-related constructs in TIMSS 2015 across 46 education systems: An alignment optimisation approach. Educ. Assess. Eval. Account. 2021, 33, 105–137. [Google Scholar]
- Bush, T. Leadership and context: Why one-size does not fit all. Educ. Manag. Adm. Leadersh. 2018, 46, 3–4. [Google Scholar]
- Liu, Y. Focusing on the practice of distributed leadership: The international evidence from the 2013 TALIS. Educ. Adm. Q. 2020, 56, 779–818. [Google Scholar]
- Eryilmaz, N.; Sandoval Hernandez, A. Improving cross-cultural comparability: Does school leadership mean the same in different countries? Educ. Stud. 2021, 1–22. [Google Scholar] [CrossRef]
- Sandoval-Hernandez, A.; Rutkowski, D.; Matta, T.; Miranda, D. Back to the drawing board: Can we compare socioeconomic background scales?[Pensémoslo de nuevo:¿ Podemos comparar las escalas de antecedentes socioeconómicos?]. Rev. Educ. 2019, 383, 37–61. [Google Scholar]
- Asparouhov, T.; Muthén, B. Multiple-group factor analysis alignment. Struct. Equ. Model. Multidiscip. J. 2014, 21, 495–508. [Google Scholar]
- Muthén, B.; Asparouhov, T. Recent methods for the study of measurement invariance with many groups: Alignment and random effects. Sociol. Methods Res. 2018, 47, 637–664. [Google Scholar]
- Bolden, R. Distributed leadership in organizations: A review of theory and research. Int. J. Manag. Rev. 2011, 13, 251–269. [Google Scholar]
- Tian, M.; Risku, M.; Collin, K. A meta-analysis of distributed leadership from 2002 to 2013: Theory development, empirical evidence and future research focus. Educ. Manag. Adm. Leadersh. 2016, 44, 146–164. [Google Scholar]
- Gronn, P. Distributed leadership as a unit of analysis. Leadersh. Q. 2002, 13, 423–451. [Google Scholar]
- Sebastian, J.; Huang, H.; Allensworth, E. Examining integrated leadership systems in high schools: Connecting principal and teacher leadership to organizational processes and student outcomes. Sch. Eff. Sch. Improv. 2017, 28, 463–488. [Google Scholar]
- Leithwood, K.A.; Mascall, B.; Strauss, T.; Sacks, R.; Memon, N.; Yashkina, A. Distributing leadership to make schools smarter: Taking the ego out of the system. Leadersh. Policy Sch. 2007, 6, 37–67. [Google Scholar]
- Hallinger, P.; Heck, R. What do you call people with visions? The role of vision, mission, and goals in school leadership and improvement. In Second International Handbook of Educational Leadership and Administration; Leithwood, K., Hallinger, P., Eds.; Kluwer: Alphen aan den Rijn, The Netherlands, 2002; pp. 9–40. [Google Scholar]
- Ingersoll, R.M.; Sirinides, P.; Dougherty, P. Leadership Matters: Teachers’ Roles in School Decision Making and School Performance. Am. Educ. 2018, 42, 13. [Google Scholar]
- Spillane, J.P.; Shirrell, M.; Hopkins, M. Designing and deploying a professional learning community (PLC) organizational routine: Bureaucratic and collegial arrangements in tandem. Doss. Sci. l’Éduc. 2016, 35, 97–122. [Google Scholar]
- Hallinger, P.; Murphy, J. Assessing the instructional management behavior of principals. Elem. Sch. J. 1985, 86, 217–247. [Google Scholar]
- Angelle, P.S. An organizational perspective of distributed leadership: A portrait of a middle school. RMLE Online 2010, 33, 1–16. [Google Scholar]
- Ainley, J.; Carstens, R. Teaching and Learning International Survey (TALIS) 2018 Conceptual Framework; OECD Education Working Papers, No. 187; OECD Publishing: Paris, France, 2018. [Google Scholar] [CrossRef]
- OECD. TALIS 2018 Results (Volume I): Teachers and School Leaders as Lifelong Learners; OECD Publishing: Paris, France, 2019. [Google Scholar]
- Van de Vijver, F.J.; Avvisati, F.; Davidov, E.; Eid, M.; Fox, J.P.; Le Donné, N.; Lek, K.; Meuleman, B.; Paccagnella, M.; van de Schoot, R. Invariance Analyses in Large-Scale Studies; OECD Education Working Papers, No. 201; OECD Publishing: Mexico City, Mexico, 2019. [Google Scholar]
- Cheung, G.W.; Rensvold, R.B. Evaluating goodness-of-fit indexes for testing measurement invariance. Struct. Equ. Model. 2002, 9, 233–255. [Google Scholar]
- OECD. TALIS 2013 Technical Report. OECD, Paris. 2014. Available online: http://www.oecd.org/edu/school/TALIS-technical-report-2013.pdf (accessed on 15 December 2022).
- Treviño, E.; Sandoval-Hernández, A.; Miranda, D.; Rutkowski, D. Invariance of socioeconomic status scales in international studies. In Validity of Evaluation Systems in Latin America; Manzi, J., Taut, S., Garcia, M.R., Eds.; Springer: Cham, Switzerland, 2021. [Google Scholar] [CrossRef]
- Brown, T.A. Confirmatory Factor Analysis for Applied Research; Guildford Press: New York, NY, USA, 2015. [Google Scholar]
- Vandenberg, R.J.; Lance, C.E. A review and synthesis of the measurement invariance literature: Suggestions, practices, and recommendations for organizational research. Organ. Res. Methods 2000, 3, 4–70. [Google Scholar]
- Munck, I.; Barber, C.; Torney-Purta, J. Measurement invariance in comparing attitudes toward immigrants among youth across Europe in 1999 and 2009: The alignment method applied to IEA CIVED and ICCS. Sociol. Methods Res. 2018, 47, 687–728. [Google Scholar]
- Zakariya, Y.F.; Bjørkestøl, K.; Nilsen, H.K. Teacher job satisfaction across 38 countries and economies: An alignment optimization approach to a cross-cultural mean comparison. Int. J. Educ. Res. 2020, 101, 101573. [Google Scholar]
- Hallinger, P.; Bickman, L.; Davis, K. School context, principal leadership, and student reading achievement. Elem. Sch. J. 1996, 96, 527–549. [Google Scholar]
- Liu, Y.; Bellibas, M.S.; Printy, S. How school context and educator characteristics predict distributed leadership: A hierarchical structural equation model with 2013 TALIS data. Educ. Manag. Adm. Leadersh. 2018, 46, 401–423. [Google Scholar]
- Bellibaş, M.Ş.; Gümüş, S.; Liu, Y. Does school leadership matter for teachers’ classroom practice? The influence of instructional leadership and distributed leadership on instructional quality. Sch. Eff. Sch. Improv. 2021, 32, 387–412. [Google Scholar]
- Zinbarg, R.E.; Revelle, W.; Yovel, I.; Li, W. Cronbach’s alpha, Revelle’s beta, McDonald’s omega: Their relations with each and two alternative conceptualizations of reliability. Psychometrika 2005, 70, 123–133. [Google Scholar]
- Trizano-Hermosilla, I.; Alvarado, J.M. Best alternatives to Cronbach’s alpha reliability in realistic conditions: Congeneric and asymmetrical measurements. Front. Psychol. 2016, 7, 769. [Google Scholar]
- Deng, L.; Chan, W. Testing the difference between reliability coefficients alpha and omega. Educ. Psychol. Meas. 2017, 77, 185–203. [Google Scholar]
- Dunn, T.J.; Baguley, T.; Brunsden, V. From alpha to omega: A practical solution to the pervasive problem of internal consistency estimation. Br. J. Psychol. 2014, 105, 399–412. [Google Scholar]
- Chen, F.F. Sensitivity of goodness of fit indexes to lack of measurement invariance. Struct. Equ. Model. Multidiscip. J. 2007, 14, 464–504. [Google Scholar]
- Hu, L.T.; Bentler, P.M. Cutoff criteria for fit indexes in covariance structure analysis: Conventional criteria versus new alternatives. Struct. Equ. Model. Multidiscip. J. 1999, 6, 1–55. [Google Scholar]
- Rutkowski, L.; Svetina, D. Assessing the hypothesis of measurement invariance in the context of large-scale international surveys. Educ. Psychol. Meas. 2014, 74, 31–57. [Google Scholar]
- Satorra, A.; Bentler, P.M. A scaled difference chi-square test statistic for moment structure analysis. Psychometrika 2001, 66, 507–514. [Google Scholar]
- Suh, Y. The performance of maximum likelihood and weighted least square mean and variance adjusted estimators in testing differential item functioning with nonnormal trait distributions. Struct. Equ. Model. Multidiscip. J. 2015, 22, 568–580. [Google Scholar]
- Muthén, B.; Asparouhov, T. IRT studies of many groups: The alignment method. Front. Psychol. 2014, 5, 978. [Google Scholar]
- Muthén, L.K.; Muthén, B.O. Mplus User’s Guide, 8th ed.; Muthén & Muthén: Los Angeles, CA, USA, 2017. [Google Scholar]
- Rosenman, R.; Tennekoon, V.; Hill, L.G. Measuring bias in self-reported data. Int. J. Behav. Healthc. Res. 2011, 2, 320–332. [Google Scholar]
Disclaimer/Publisher’s Note: The statements, opinions and data contained in all publications are solely those of the individual author(s) and contributor(s) and not of MDPI and/or the editor(s). MDPI and/or the editor(s) disclaim responsibility for any injury to people or property resulting from any ideas, methods, instructions or products referred to in the content. |
© 2023 by the authors. Licensee MDPI, Basel, Switzerland. This article is an open access article distributed under the terms and conditions of the Creative Commons Attribution (CC BY) license (https://creativecommons.org/licenses/by/4.0/).