Abstract
In this exploratory eye tracking study, gaze behavior during an experiment on electrolysis of a zinc iodide solution has been examined. The experiment is designed according to inquiry-based learning and therefore well suited to students’ self-directed experimenting in science classrooms. Scaffolding by means of stepwise presented digital hints (sequential scaffolds), here by means of augmented reality (AR), supported learners during the experiment. Two succeeding AR-hints were offered. This research focuses on the set-up of the experiment by learners and the change of gaze between the AR-hints and the real experiment. This was investigated by means of mobile eye tracking. For the analysis of the gaze changes, scanpath analyses are used. Areas of Interest-based visualizations such as radial transition graphs and scarf plots are used to compare and detect similar or different gaze behaviors of participants. Results reveal that students first look at the AR-hints, try to memorize the construction and then switch to setting up the experiment. Recurrent changes of gaze between the AR-hints and the experiment hardly, or do not, occur. Furthermore, students who had already set up the experiment correctly with the first hint only use the second hint for evaluating correctness of their own set-up.
1. Introduction
Inquiry-based learning is widely accepted as a teaching and learning concept in science education. Here, students’ self-conducted experiments are an important component of this concept [1,2,3]. For the experimental process, core competencies include set-up, execution, accurate observation and evaluation of the experiment [4]. The set-up of the experiment is very central, as it is essential for further experimentation [4]. However, studies on inquiry learning still show ambiguous results regarding students’ experimental competencies [5]. A major predictor for learning success seems to be teacher support during the experimental process [6]. Nevertheless, listening to instruction during experimenting might be experienced as a dual task and, thus, increase learners’ cognitive load [7,8]. Another way to support learners might be the use of digital media, for example, by means of sequential scaffolds that can be accessed individually (e.g., with a tablet) depending on needs and abilities [9]. In this exploratory study, the focus is on sequential scaffolds for setting up an experiment on “Electrolysis of a Zinc Iodide Solution”. These scaffolds in the form of hints were designed to support students in setting up the experiment and were operationalized in two stages. The first stage included a hint for partial set-up of the experiment by means of AR that showed the necessary 3D objects at the workplace of the experiment in the lab. The second stage included the complete set-up. The entire experiment (hints, when they were used and the real experiment situation) was recorded with a mobile eye-tracker (eye tracking glasses) in order to analyze how students use the sequenced hints to set up the experiment. In addition, analysis focused on detection of different patterns in the use of the hints. Thus, change of gaze between the hints and the experiment (setup) were analyzed. To obtain more information about the use of the sequential scaffolds, short interviews were conducted and related to the eye tracking data.
1.1. Self-Directed Experimenting
To gradually release students into “independence”, Banchi and Bell [10] and Bell et al. [7] suggest a four-stage model of inquiry learning. In this model, students are initially still taken by the hand, accompanied through the respective steps and gradually the process is opened to independence. On level 1, the students know the research question, method, and solution (so-called confirmation activity). Level 2 provides research questions and method only (so-called structured inquiry). At level 3, only the research question is provided (guided inquiry) and at Level 4 (open inquiry), students identify and work on all parts of an experiment in a self-directed manner [7,8]. The experiment provided here is located between level 1 and level 2: the procedure and the objective (according to Bell et al. [7] the “research question”) was broadly provided, but sequential scaffolds could be used when needed and wanted. This approach was chosen in order to provide support without creating a dual task situation and so as not to overstrain the students (see above; cf. [7,8]).
1.2. Sequential Scaffolding
Research, especially on cognitive load, has shown, that procedural knowledge is not efficiently acquired by having students solve mainly practice problems [11]. Especially, inexperienced students benefit from studying examples of fully worked-out solution procedures and (subsequently) completing partially worked-out solution procedures and then solving conventional practice problems on their own. Results of Instructional Design Research show that learning from worked-examples is less effortful for novice learners [11,12]. Experiments in inquiry-based learning approaches can quickly overstrain learners [7]. Students therefore can and should be supported when necessary and appropriate [10]. One supportive strategy here can be provision of sequential scaffolds [8,9]. By sequential scaffolds, we refer here to hints consisting of worked examples at different stages ranging from first basic (partial) hints up to full worked examples. Positive effects of such sequential help strategies have already been demonstrated (e.g., [9,13]). Such hints can be used in order to allow students to progress in their experiments if necessary but also as validation after finalizing an experiment or its set-up.
What needs to be considered is how many scaffolds are given and how the learners use them. The amount of help offered usually depends on the difficulty level of the task. Therefore, the latter can be determined to some extent independently by the students and adapted to their own performance level [9,14].
Looking more closely at the question of “how students use sequential scaffolding,” the question is whether students begin by studying an example before moving on to a practice problem, which is known as effective task sequencing [12,15,16,17]. Foster et al. [18] found that, when given the choice, students are more likely to start with the practice exercises (60%) than with the worked examples (40%). However, the more frequently mistakes were made, the more likely that students were using the worked examples, but students rarely started the training phase with example study. Another picture was shown in a study done by Van Harsel et al. [16] with university students learning to solve math problems on the trapezoid rule. Here, 77% of the participants started with a video modeling example, 19% with a worked example and only 5% went directly to the practice problems. However, so far, we know little about task selection choices students make. As Van Gog et al. [11] point out, data shows that learners seem to be (implicitly or explicitly) aware of the fact that examples are efficient for learning, as they make substantial use of them.
Here, we use eye tracking in combination with interviews as one approach to examine whether sequential scaffolds can contribute to the successful set-up of an experiment and how these digital hints are used while setting up an experiment.
1.3. Augmented Reality
In literature there are two prominent approaches describing AR. Putting these approaches by Azuma [19] and Milgram et al. [20] together, AR is the combination of virtual and real content. Here, the reality/real world is supplemented by virtual/digital content, and this is done with three-dimensional registration as well as in real time [21,22]. In general, teaching and learning with AR are considered to have learning potential [23,24]. However, to date, there is still too little clarification or research on what content and characteristics a learning-effective AR learning environment should contain. So far, the focus has often been on the subject-didactic design of the teaching–learning environment based on an example, as this forms the indispensable cornerstone for further work with the AR content, without showing concrete effects, for example, on self-efficacy, subject knowledge, or motivation [21,25]. Nevertheless, for science education, there are few studies as yet showing a positive effect regarding learning. Huwer et al. [26] added digital AR content to classical worksheets on experiments in electrochemistry. These could be accessed on demand if students needed assistance around the experiment or experimentation. In addition to expertise, self-efficacy as well as intrinsic motivation could be positively influenced without causing too much cognitive load when using AR [26]. Similar positive effects on the previously mentioned metrics were found by Probst et al. [27] in their investigation of particle motion in liquids.
Here, two self-designed AR sequential hints are offered. Leaners can decide themselves if and when to use them, as this is the usual procedure in science teaching using sequential scaffolds. The AR hints show the set-up in a three-dimensional manner. AR presents the equipment to be deployed as an overlay to the actual workplace.
1.4. Eye Tracking
Regarding the relationship of eye movements and cognition, there are two main assumptions: the immediacy assumption and the eye-mind assumption. The former states that individuals process objects immediately when they look at them. As soon as a new object is fixated upon, this new information is processed immediately. The latter assumption states that there is an eye–mind connection, so that every fixated object is processed. Based on these assumptions, it can be hypothesized that visual attention has an impact on cognitive processing of information [28,29,30]. Several studies have already shown the connection between fixations and visual attention [31,32,33]. Often classical eye tracking indicators, such as total number of fixations or total fixation duration, are used to investigate attention or task difficulty [34,35,36]. However, if the focus is on the change of gaze, as in this case between sequential scaffolds and experimental task, so-called scanpath analyses are more appropriate. A scanpath generally describes the course of subjects’ eye movements through space in a given time span. Thus, it is assumed that a scanpath has a beginning, an end and a length [34,37]. In particular, visualizations of one or more scanpaths can help to understand, compare, and interpret the spatiotemporal aspects of eye tracking data and are especially suitable for exploratory studies [37,38], as in the study presented here. Blascheck et al. [37] and Holmqvist et al. [34] provide an overview of different visualization options. The focus of this paper is on the so-called Areas of Interest (AOI) based visualizations. A typical visualization here is the so-called gaze plot. Newer visualizations include gridded AOIs, parallel scanpath visualizations, Sankey plots, scarf plots and radial transition graphs [34,37,38,39]. For the comparison of two or more individuals, the combination of radial transition graphs and scarf plots according to Blascheck et al. [38] seems to be appropriate, because it enables the direct comparison of two individuals or a pairwise comparison of several individuals. Thus, persons (or groups) with similar or different gaze behavior can be detected and compared. Therefore, here radial transition graphs and scarf plots according to Blascheck et al. [38] are applied. Gaze plots are not suitable here, since this form of presentation leads to overlapping of the individual fixations, which makes the gaze plots uninterpretable.
1.5. Research Questions
The focus of this exploratory study (quantitative with qualitative interview elements) is the analysis of learners’ change of gaze between AR-based sequential scaffolds and the set-up of the experiment on electrolysis of a zinc iodide solution. The research questions are:
(Q1) How do the students use the sequential hints to set up the experiment (gaze transition between hint and experiment)?
Little is known on how students use sequential scaffolds and research results still remains unclear here. We hypothesize that students gaze at all relevant parts of the sequential scaffolds, so that they can set up the experiment partially or completely. We know that learners seem to be aware of the importance of worked examples as they make subsequential use of them [12]. Another point could be that students are curious about the AR hints and thus more likely to start using them. Therefore, we hypothesize that students make use of the hints and switch continuously between the sequential scaffolds and the experiment instead of starting the experiment alone. To get more information about the use of the sequential scaffolds, short interviews were conducted.
(Q2) Which patterns can be identified in the use of these sequential hints?
Affeldt et al. [9] observed in their study of analogous sequential scaffolds that the last scaffold is called on for control. Thus, we hypothesize that there is a similar pattern for these digital sequential scaffolds. As this is an exploratory study, data analysis will show if other patterns ca be identified.
2. Materials and Methods
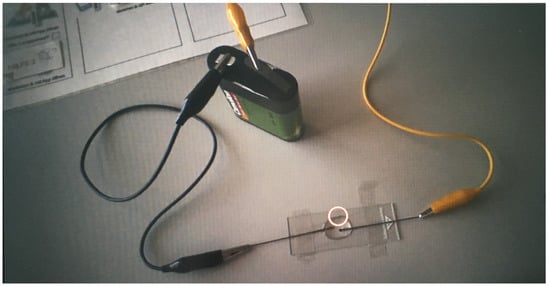
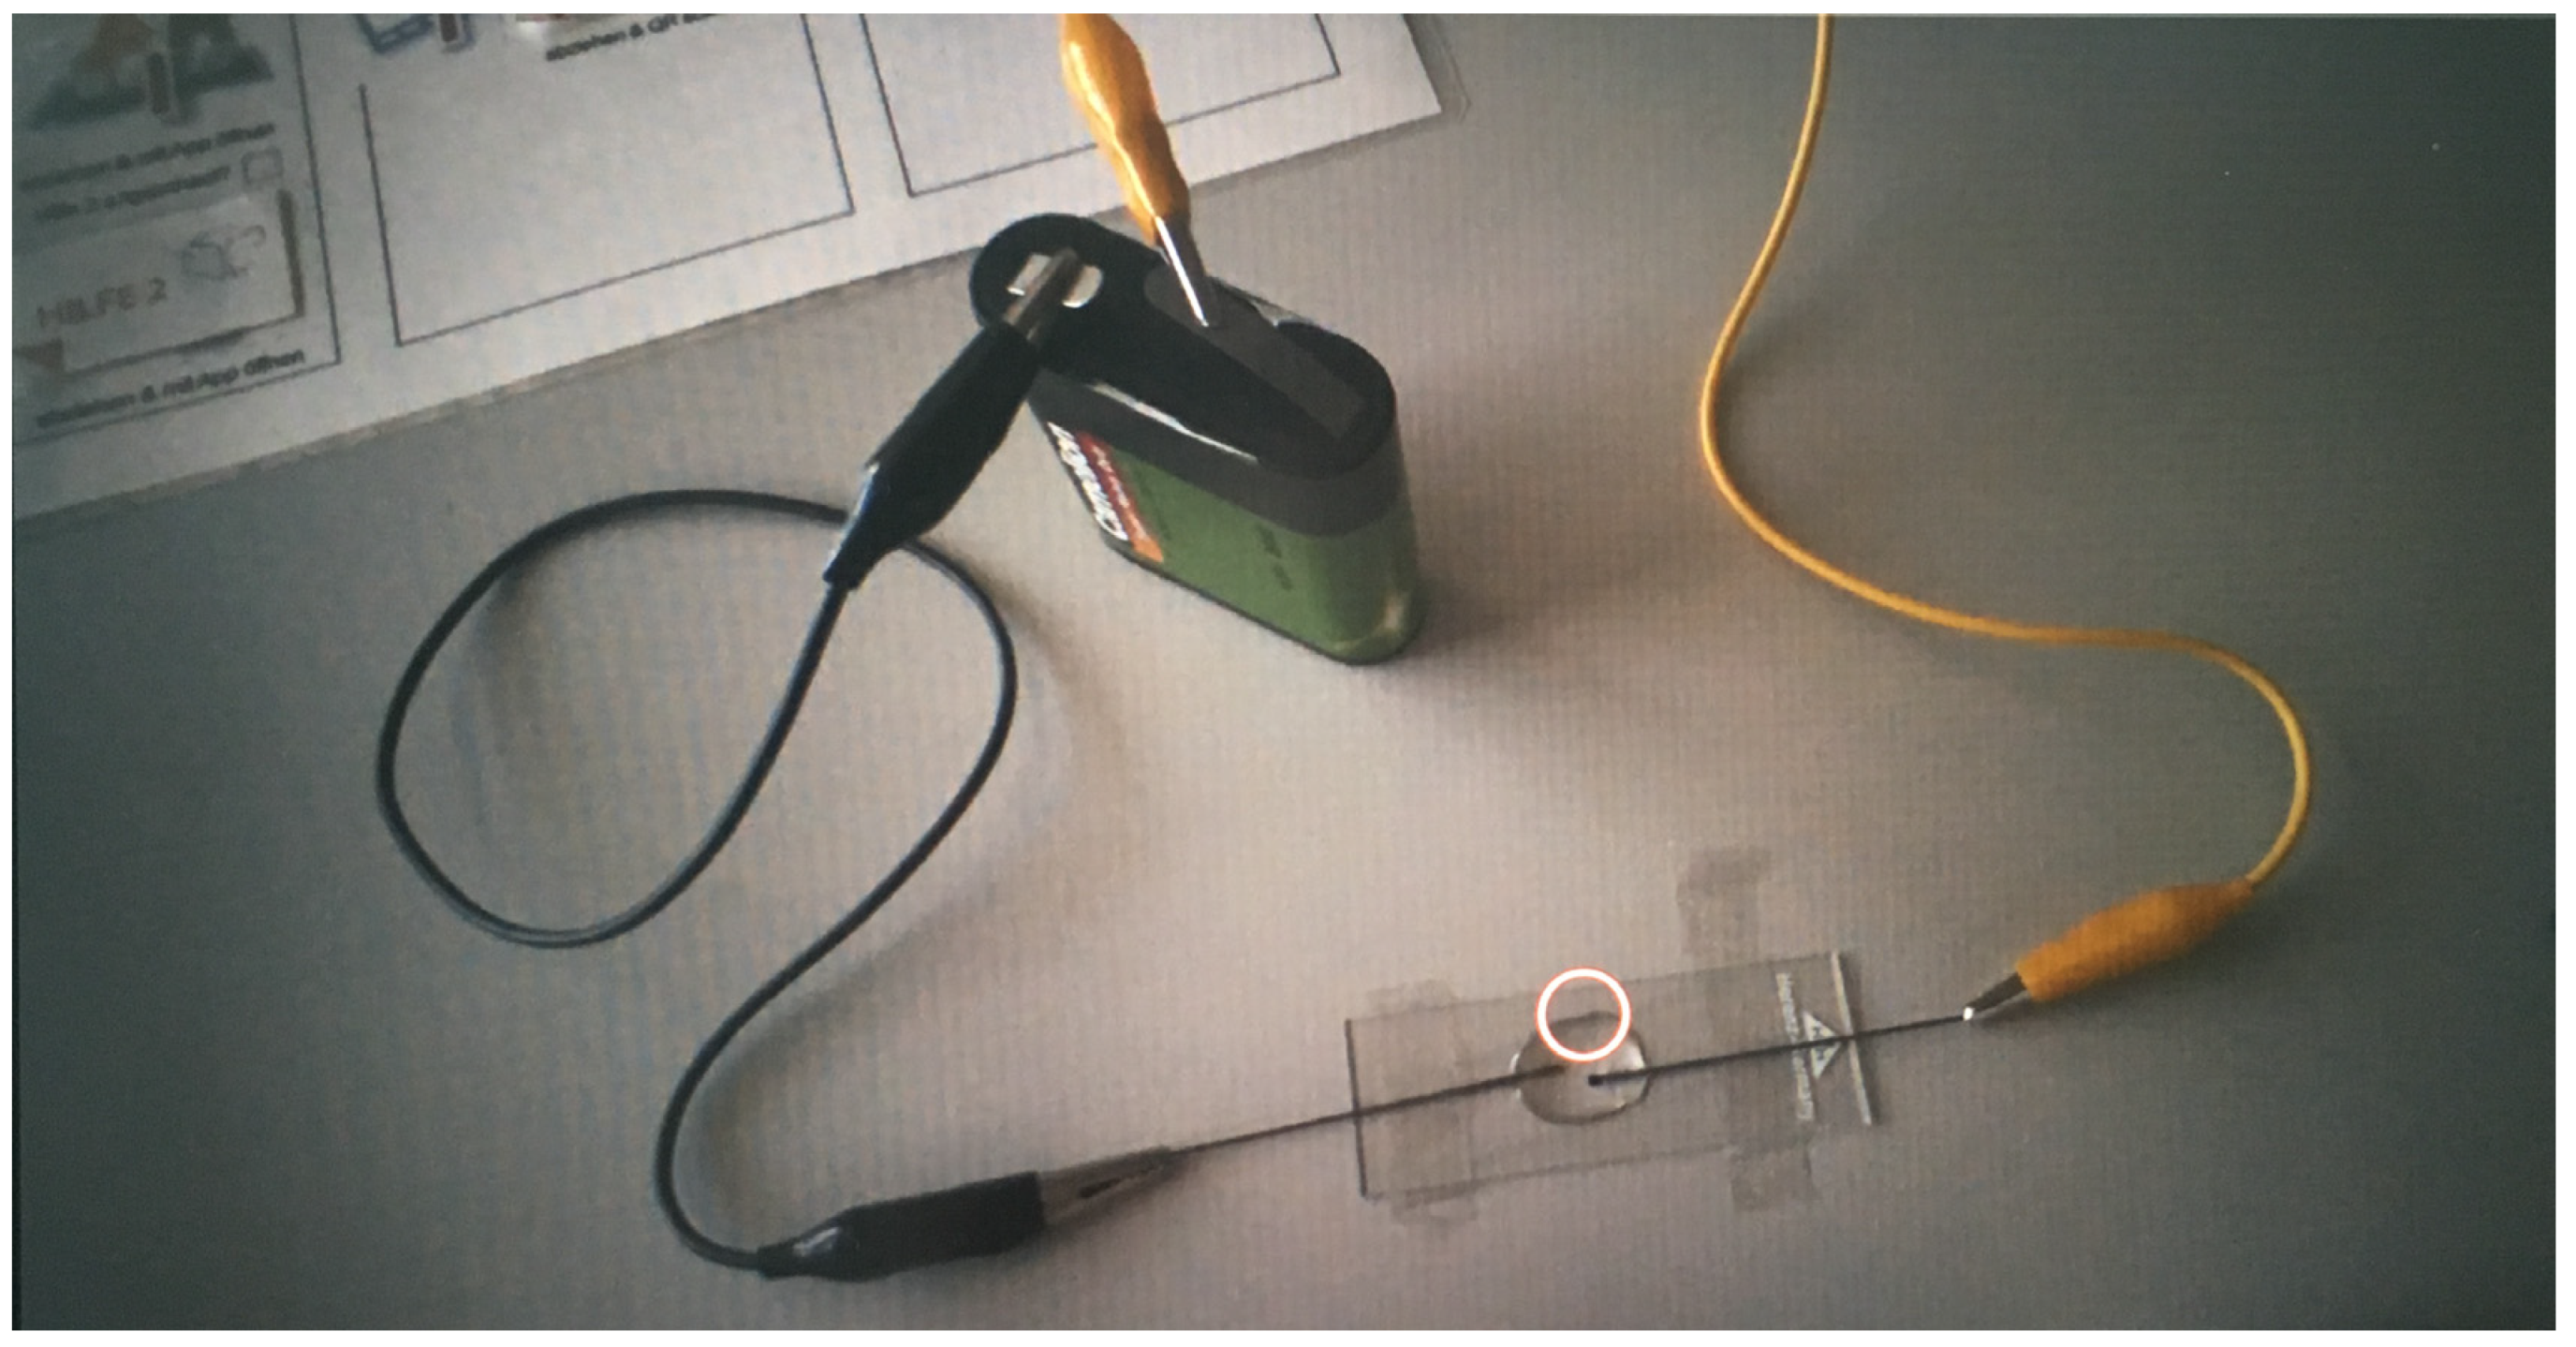
Leaners had to set up and conduct the electrolysis of a zinc iodide solution (as a so-called microscale experiment). The experiment set-up consists of six components (battery, adhesive tape, pencil leads, cable, microscope slide, zinc iodide solution), which were all provided in a small box. The complete and correct set-up and how the individual materials belong together is shown in Figure 1. This experiment was new for the learners.
Figure 1.
Complete and correct set-up for a student.
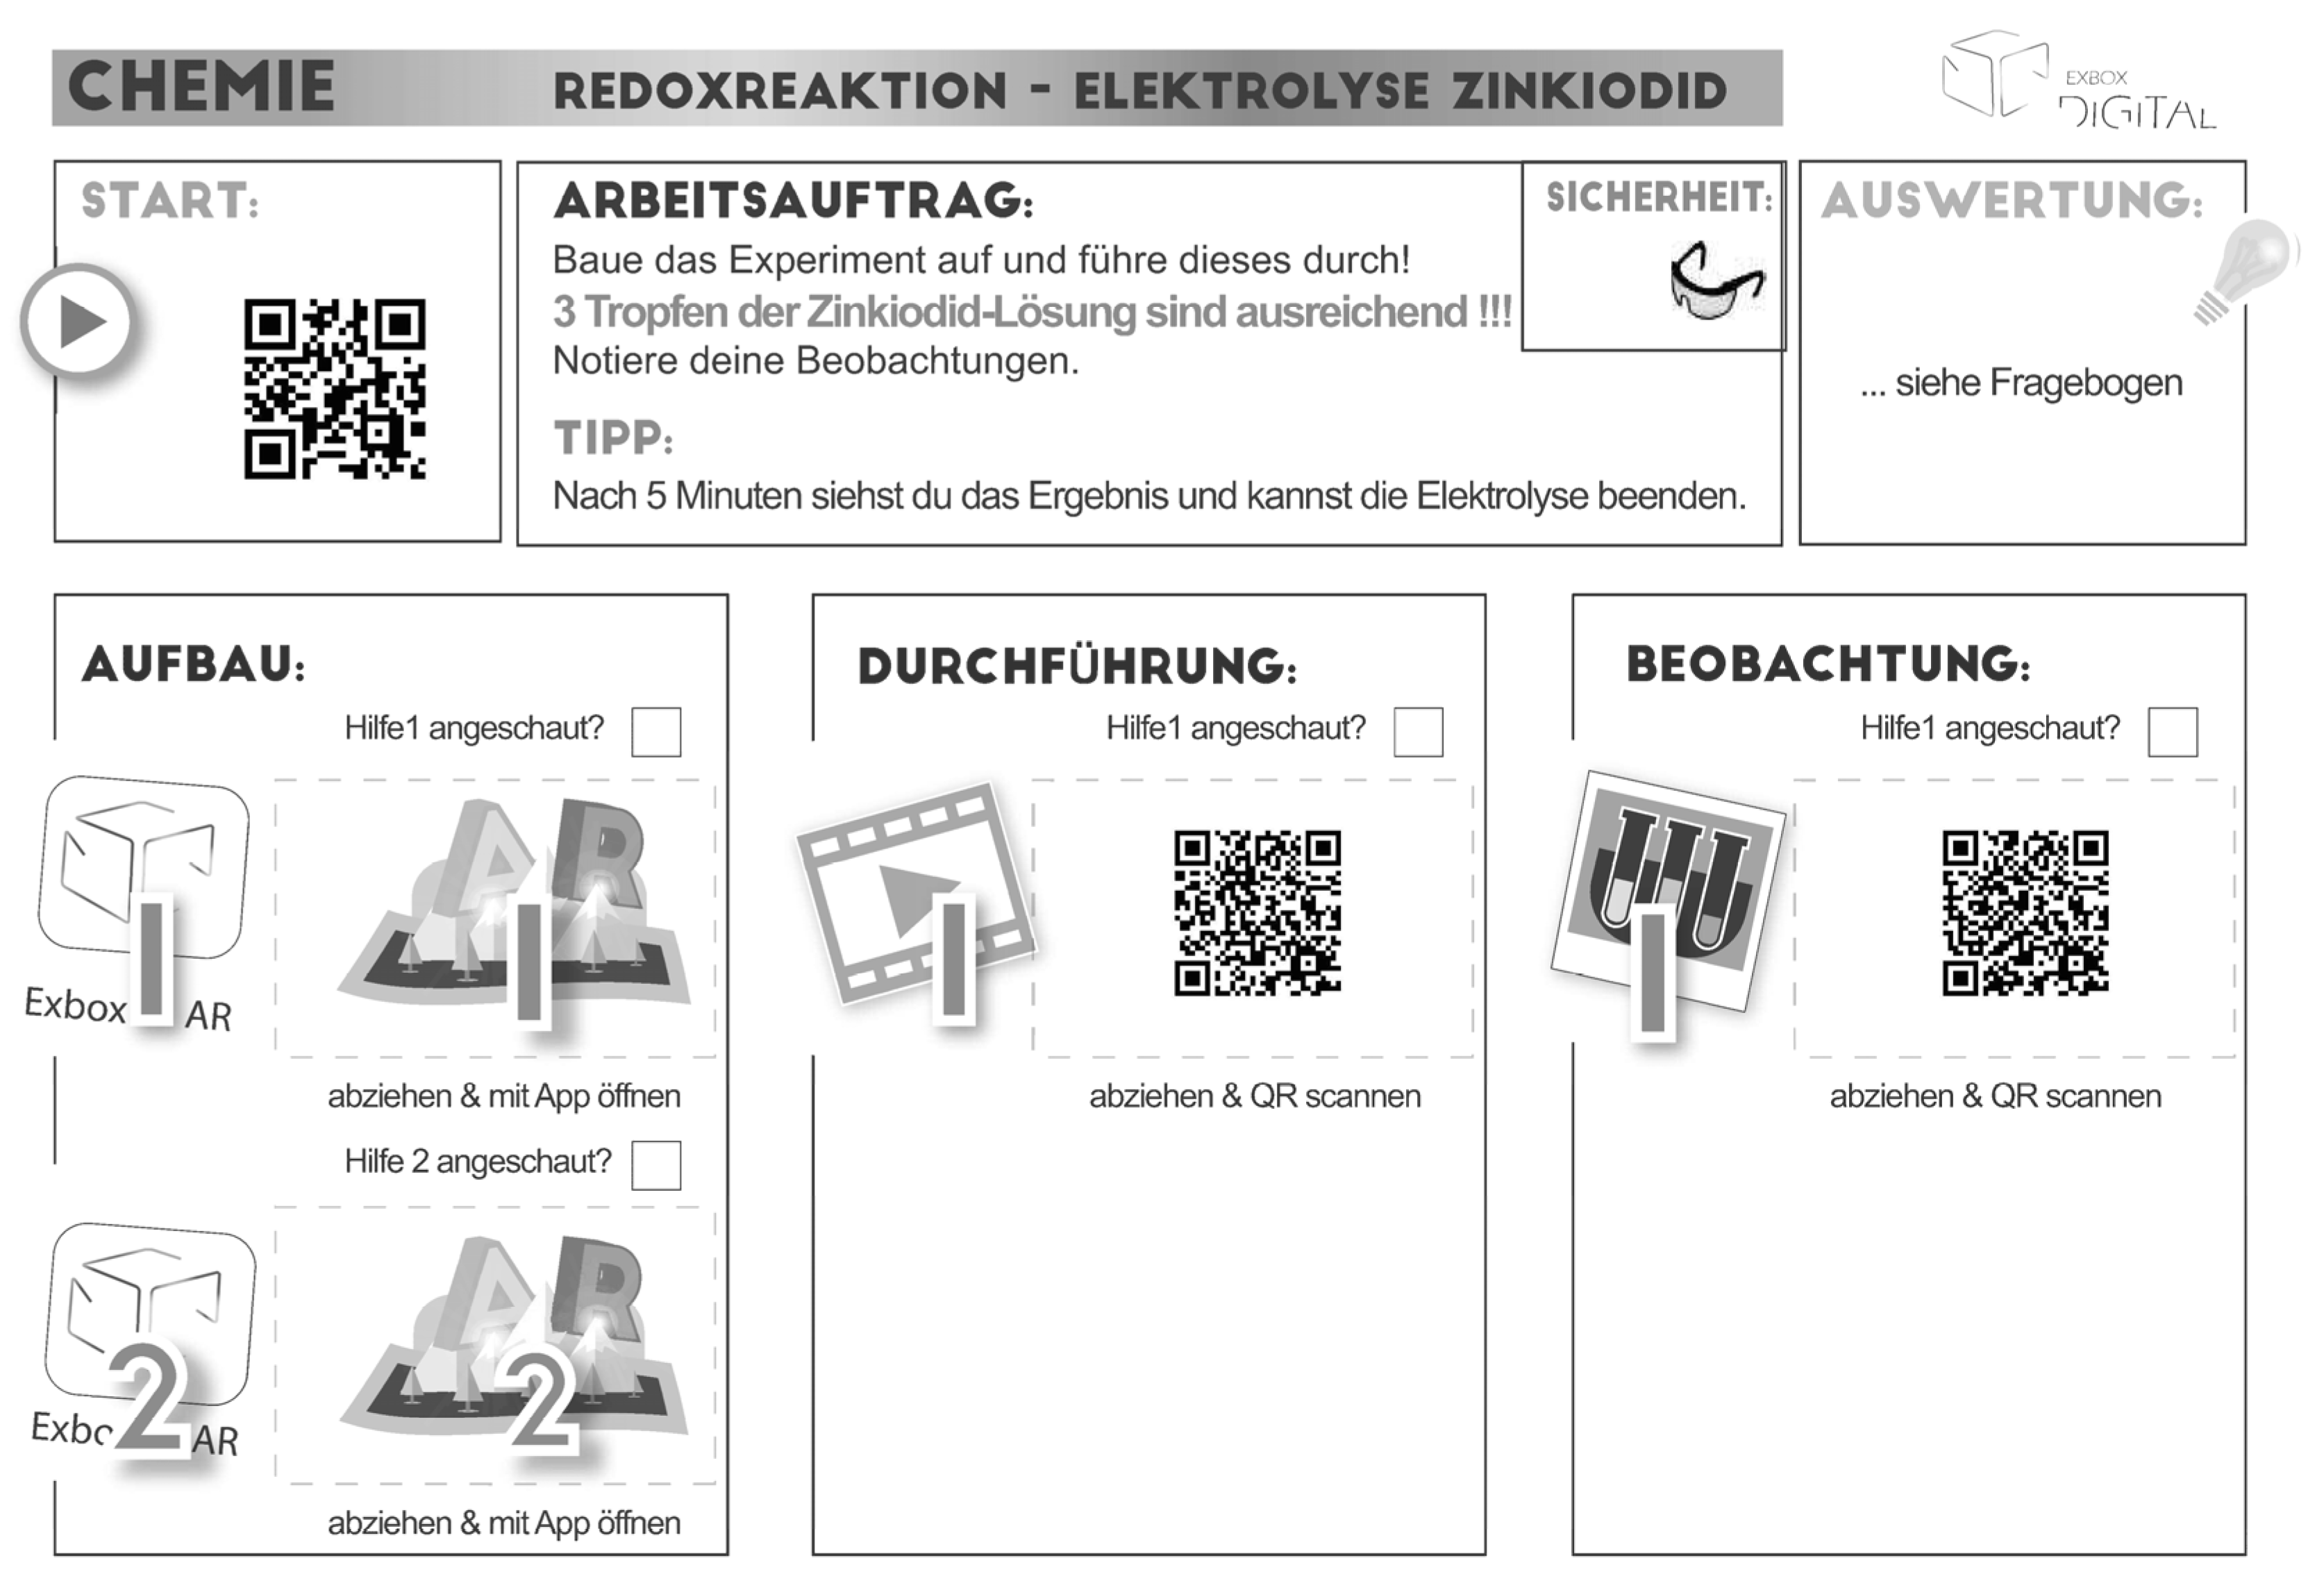
The instruction as well as the sequential scaffolds were provided by means of a worksheet (see Figure 2, English translation of all relevant parts below the figure). According to inquiry-based learning, the instruction was rather basic and located between level 1 and level 2 (see above; cf. [7]).
Figure 2.
Original worksheet for the experiment.
- Heading: Chemistry Redox reaction—electrolysis of a zinc iodide solution (Chemie Redoxreaktion—Elektrolyse Zinkiodid)
- Instruction (Arbeitsauftrag): Set up and conduct the experiment (For safety during the experiment there is also the following hint: three drops of the zinc iodide solution are sufficient, along with a symbol for safety glasses)
- Evaluation (Auswertung): … see additional worksheet
- Tip (Tipp): After 5 min you will see the result and can finish the electrolysis.
- Set-up (Aufbau): Two succeeding AR-hints
- Conducting the experiment (Durchführung): One video hint
- Observation of the experiment (Beobachtung): One image hint
- Checkboxes: Hint 1 viewed?/Hint 2 viewed?
- Description below the AR marker (Set-up/Aufbau): Pull off and open with app
- Description below the QR Codes: Pull off and scan QR
For setting up the experiment, two self-designed AR sequential hints are offered. Leaners can decide themselves if and when to use them. During the study, the hints were initially covered with a removable sticker and labeled “Hint 1” and “Hint 2”. To retrieve hints for the set-up, the AR markers have to be scanned with a tablet using a self-developed app. The app reveals the set-up in a three-dimensional manner in AR. AR presents the equipment to be deployed as an overlay to the actual workplace. Two hints (scaffolds) were provided for the following reason. Hint 1 (H1) shows a partial set-up of the experiment as well as unbuilt equipment (see Figure 3, left side). Here, the students get a first hint as to how to set up the experiment. They can continue to think independently about how the complete setup should look like. Hint 2 (H2) demonstrates the complete set-up of the experiment (see Figure 4, left side). The presentation of the complete set-up was chosen so that students were able to set up and subsequently conduct the experiment independently without failure [40]. All participants in this study successfully completed the experiment.
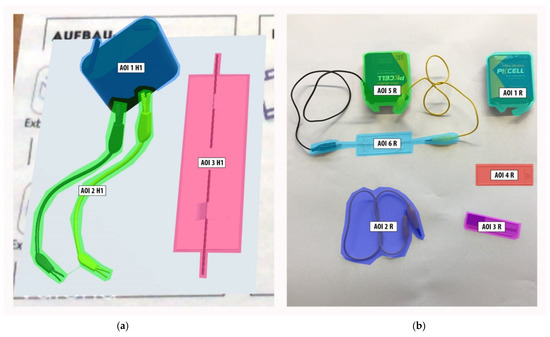
Figure 3.
Hint 1 (H1)/Experiment (R). Three AOIs on the hint (a) and six AOIs in the experiment (b). (a) AOI1 H1 = battery, AOI2 H1 = cable, AOI3 H1 = slide set up, (b) AOI1 R = battery, AOI2 R = cable, AOI3 R, pencil leads, AOI4 R = slide, AOI5 R = battery with cable connection, AOI6 R = slide with cable connection.
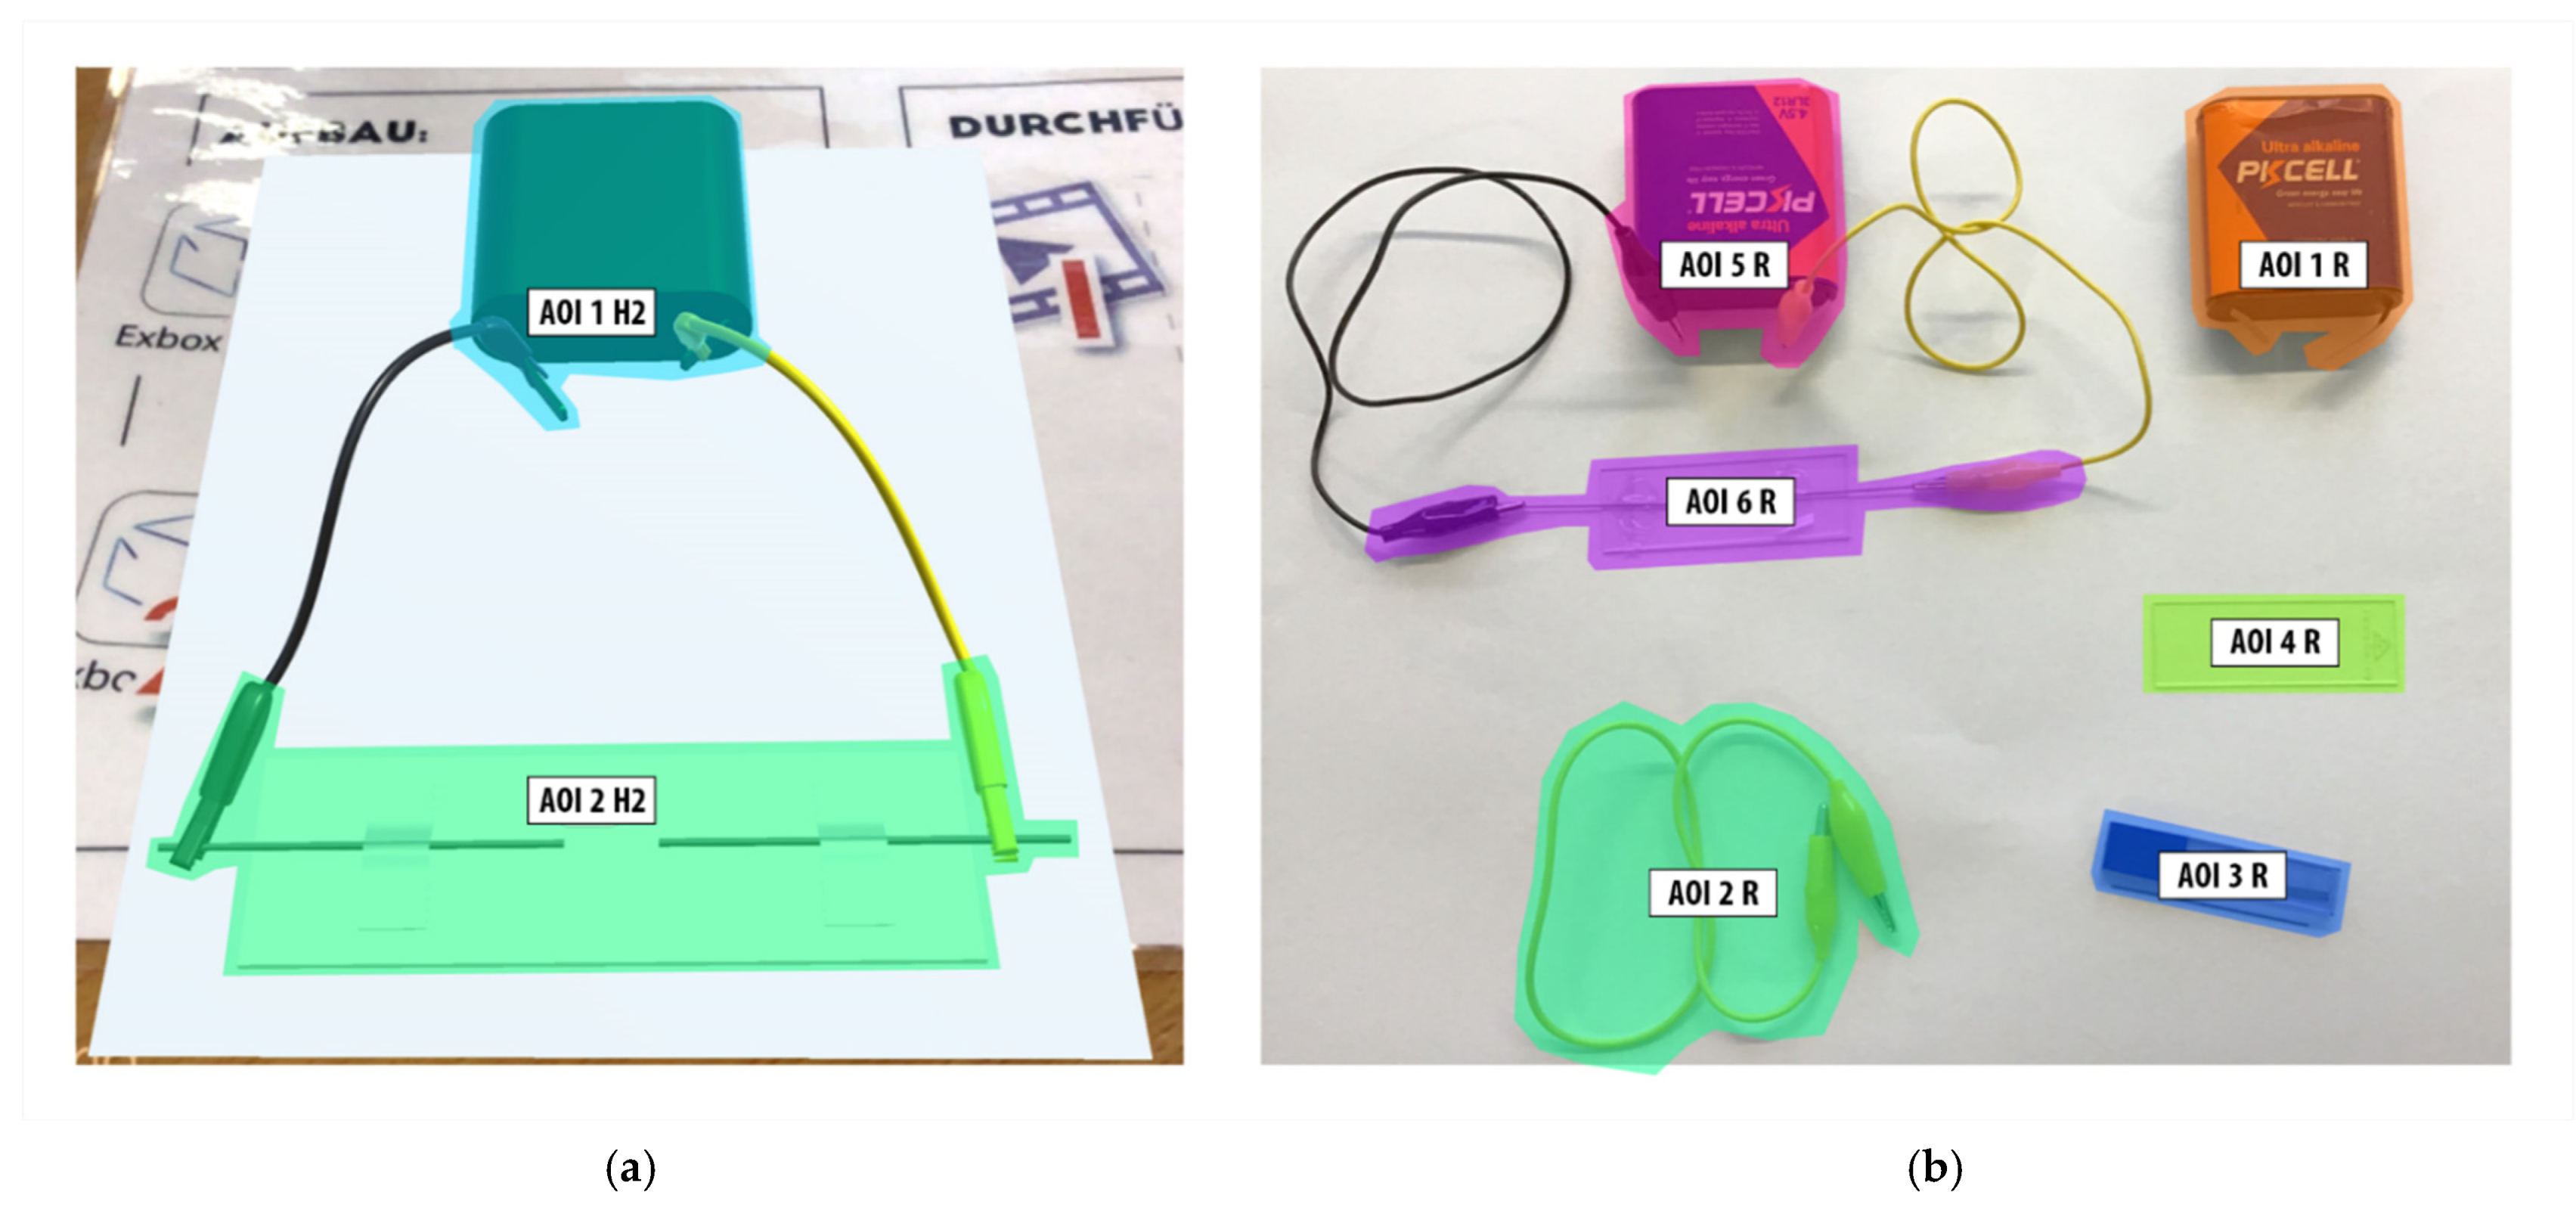
Figure 4.
Hint 2 (H2)/Experiment (R). Two AOIs on the hint (a) and six AOIs in the experiment (b). (a) AOI1 H2 = battery with cable connection, AOI2 H2 = slide with cable connection, (b) AOI1 R = battery, AOI2 R = cable, AOI3 R, pencil leads, AOI4 R = slide, AOI5 R = battery with cable connection, AOI6 R = slide with cable connection.
2.1. Eye Tracking Glasses and Software
For eye tracking of the experimentation, including the use of the hints, Tobii Pro Glasses 2 were used. The Tobii Glasses Controller software was used to calibrate the eye tracker. The eye tracker has a gaze sampling frequency of 50 Hz with a single-point calibration that is automatically validated. The tracking technology supports corneal reflection, is binocular and allows tracking of dark pupils. The device has a total of four eye cameras as well as a gyroscope and accelerometer. Additionally, there is a scene camera H.264 with 1920 × 1080 pixels @23 fps. The scene camera’s recording angle is 82° horizontally and 52° vertically. Audio recording was not used in this study. The recorded data were analyzed using Tobii Pro Lab software (version 1.123; [41]). Scarf plots and transition graphs were generated using the freely available online program Radial Transition Graph Comparison Tool: http://www.rtgct.fbeck.com/ (accessed on 1 December 2022) [38].
2.2. Sample
A total of 10 students (8th grade) from an Austrian middle school were recruited for this exploratory study. Participation was anonymous, i.e., all data were collected and analyzed anonymously, on a voluntary basis in summer 2019. No persons are visible on the recordings, only the workplace and participants’ hands. All study participants were informed about the scientific purpose of the study. Of the participants, N = 5 were female and N = 5 were male with a mean age of M = 14.20 years (SD = 0.42).
2.3. Data Collection
Data collection took place in the chemistry room of the middle school on five consecutive days, each in a separate eye tracking session. The procedure of the study as well as the functionality of the self-developed app for scanning the sequential scaffolds were described at the beginning. It was explained that they could use all the hints independently in case they need or want help or do not know what to do next. On the part of the school there was a time limit of 60 min for the whole session. We set no time limit to finish the experiment. All participants finished the experiment within 50 min (one lesson). Therefore, we had about ten minutes for a short interview with two questions, regarding the use of the sequential scaffolds, after the experiment
2.4. Data Analysis
For data analysis, snapshots (images) were created combining the view on the scaffolds (hints) and the experiment. Since the automatic mapping, which is integrated in the Tobii Pro Lab software, was not applicable to the snapshots (images) (incorrect automatic mapping), data of all participants had to be mapped manually. Since the focus is on the change of gaze between the help and the real experiment, the mapping was started as soon as a marker was used. The mapping was stopped as soon as the experiment was successfully set up. The Tobii I-VT Attention Filter (Threshold 100 (°/s)) recommended by Tobii Pro AB [42] was used for the mapping. This filter was used for the entire evaluation and is optimized for mobile eye tracking under dynamic motion [42]. Areas of Interest (AOIs) were created for both hints (H1 and H2) as well as for the experiment. The AOIs for Hint 1/experiment are shown in Figure 3, and those for Hint 2/experiment are shown in Figure 4. For both Hint 1/experiment and Hint 2/experiment, the AOIs were defined for the equipment or their combination relevant to the set-up (see Figure 3 and Figure 4).
In order to answer the research questions, AOI-based similarity indices, radial transition graphs, and scarf plots are created for both Hint 1/experiment and Hint 2/experiment. Participants were compared using these measures/visualizations (see [38]). In the radial transition graph method of Blascheck et al. [38], scanpaths are abstracted by AOIs and fixations in an AOI are aggregated to dwells. Here, a dwell describes a visit from entry to exit from an AOI [34]. Each dwell is assigned to a unique AOI, so that the so-called dwell time can be presented for each AOI. After the experiment was completed, the students were interviewed regarding the use of the sequential scaffolds. Due to the time limit, it was not possible to show the gaze plots during the interviews. The short interview consisted of the following two questions: (1) Why did you feel you needed the sequential scaffolds to set up the experiment? (2) Did the sequential scaffolds help you to set up the experiment: why yes, or why not? In the radial transition graph (see Figure 5), the individual AOIs are represented in a circle as sectors, where the length of the sectors represents the total dwell time of the respective AOI. The AOIs have a unique color and are sorted alphabetically. Using the radial transition graph, transitions, i.e., gaze movement from one AOI to another AOI [34], are also represented as lines or curves. The thicker the line or curve, the more transitions have occurred. An outgoing transition is represented with a black circle and an incoming transition with a white circle. The comparison of individuals becomes possible, for example, by the comparative juxtaposition of several transition graphs or the integrated representation of two transition graphs, the so-called “Transition Graph Diff View” ([38] (p. 91); see Figure 5 and Figure 6). In the integrated transition graph (Diff View), there are two additional circles, an inner circle and an outer circle, again divided into AOI sectors. Either the inner or outer sector has the same length as the colored sector, which means that this sector has the higher dwell time on this AOI. The other person’s sector is shorter in percentage. The gray scale of these sectors shows the Dwell Time compared to the highest Dwell Time overall (black represents maximum). To compare the transitions directly, the transitions now illustrate the difference between both single transition graphs. A red or blue line means that one person had more transitions from one AOI to another than the other did. A black line means that both persons had the same number of transitions.
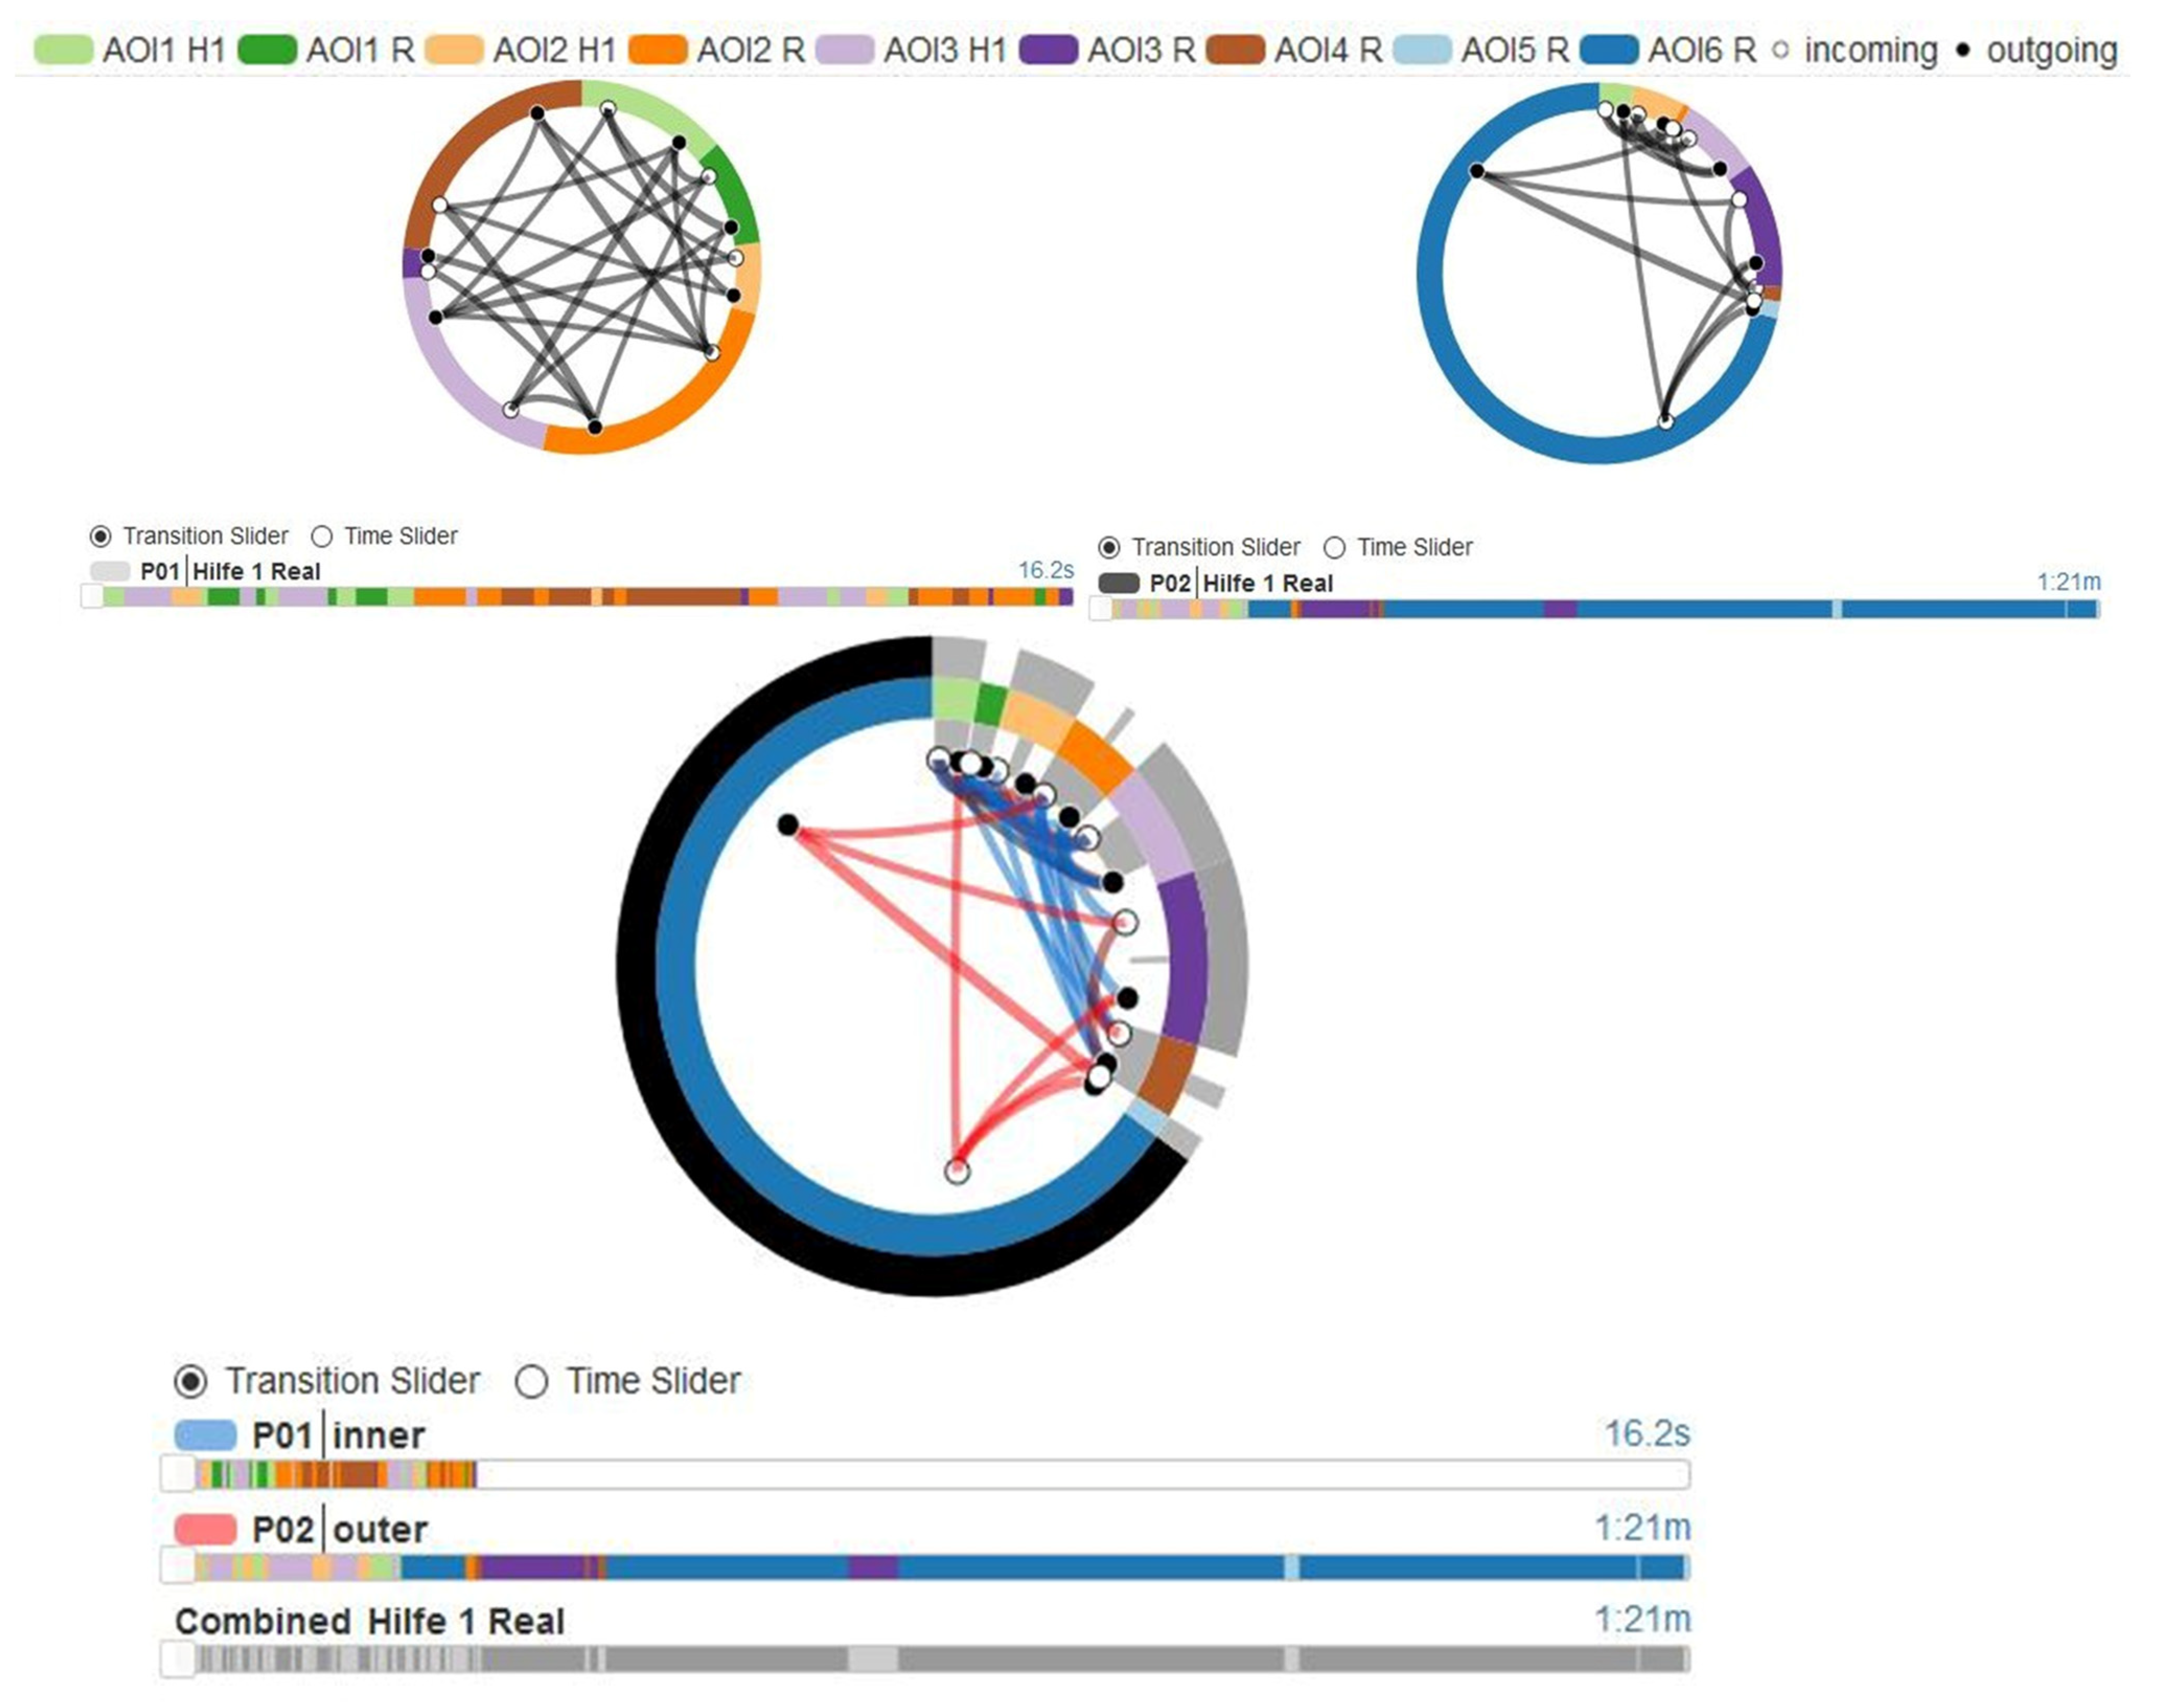
Figure 5.
Transitions graphs for P01 and P02, hint 1 (H1)/experiment (R). Three AOIs on the hint and six AOIs in the experiment. AOI1 H1 = battery, AOI2 H1 = cable, AOI3 H1 = slide set up, AOI1 R = battery, AOI2 R = cable, AOI3 R, pencil leads, AOI4 R = slide, AOI5 R = battery with cable connection, AOI6 R = slide with cable connection.
Figure 6.
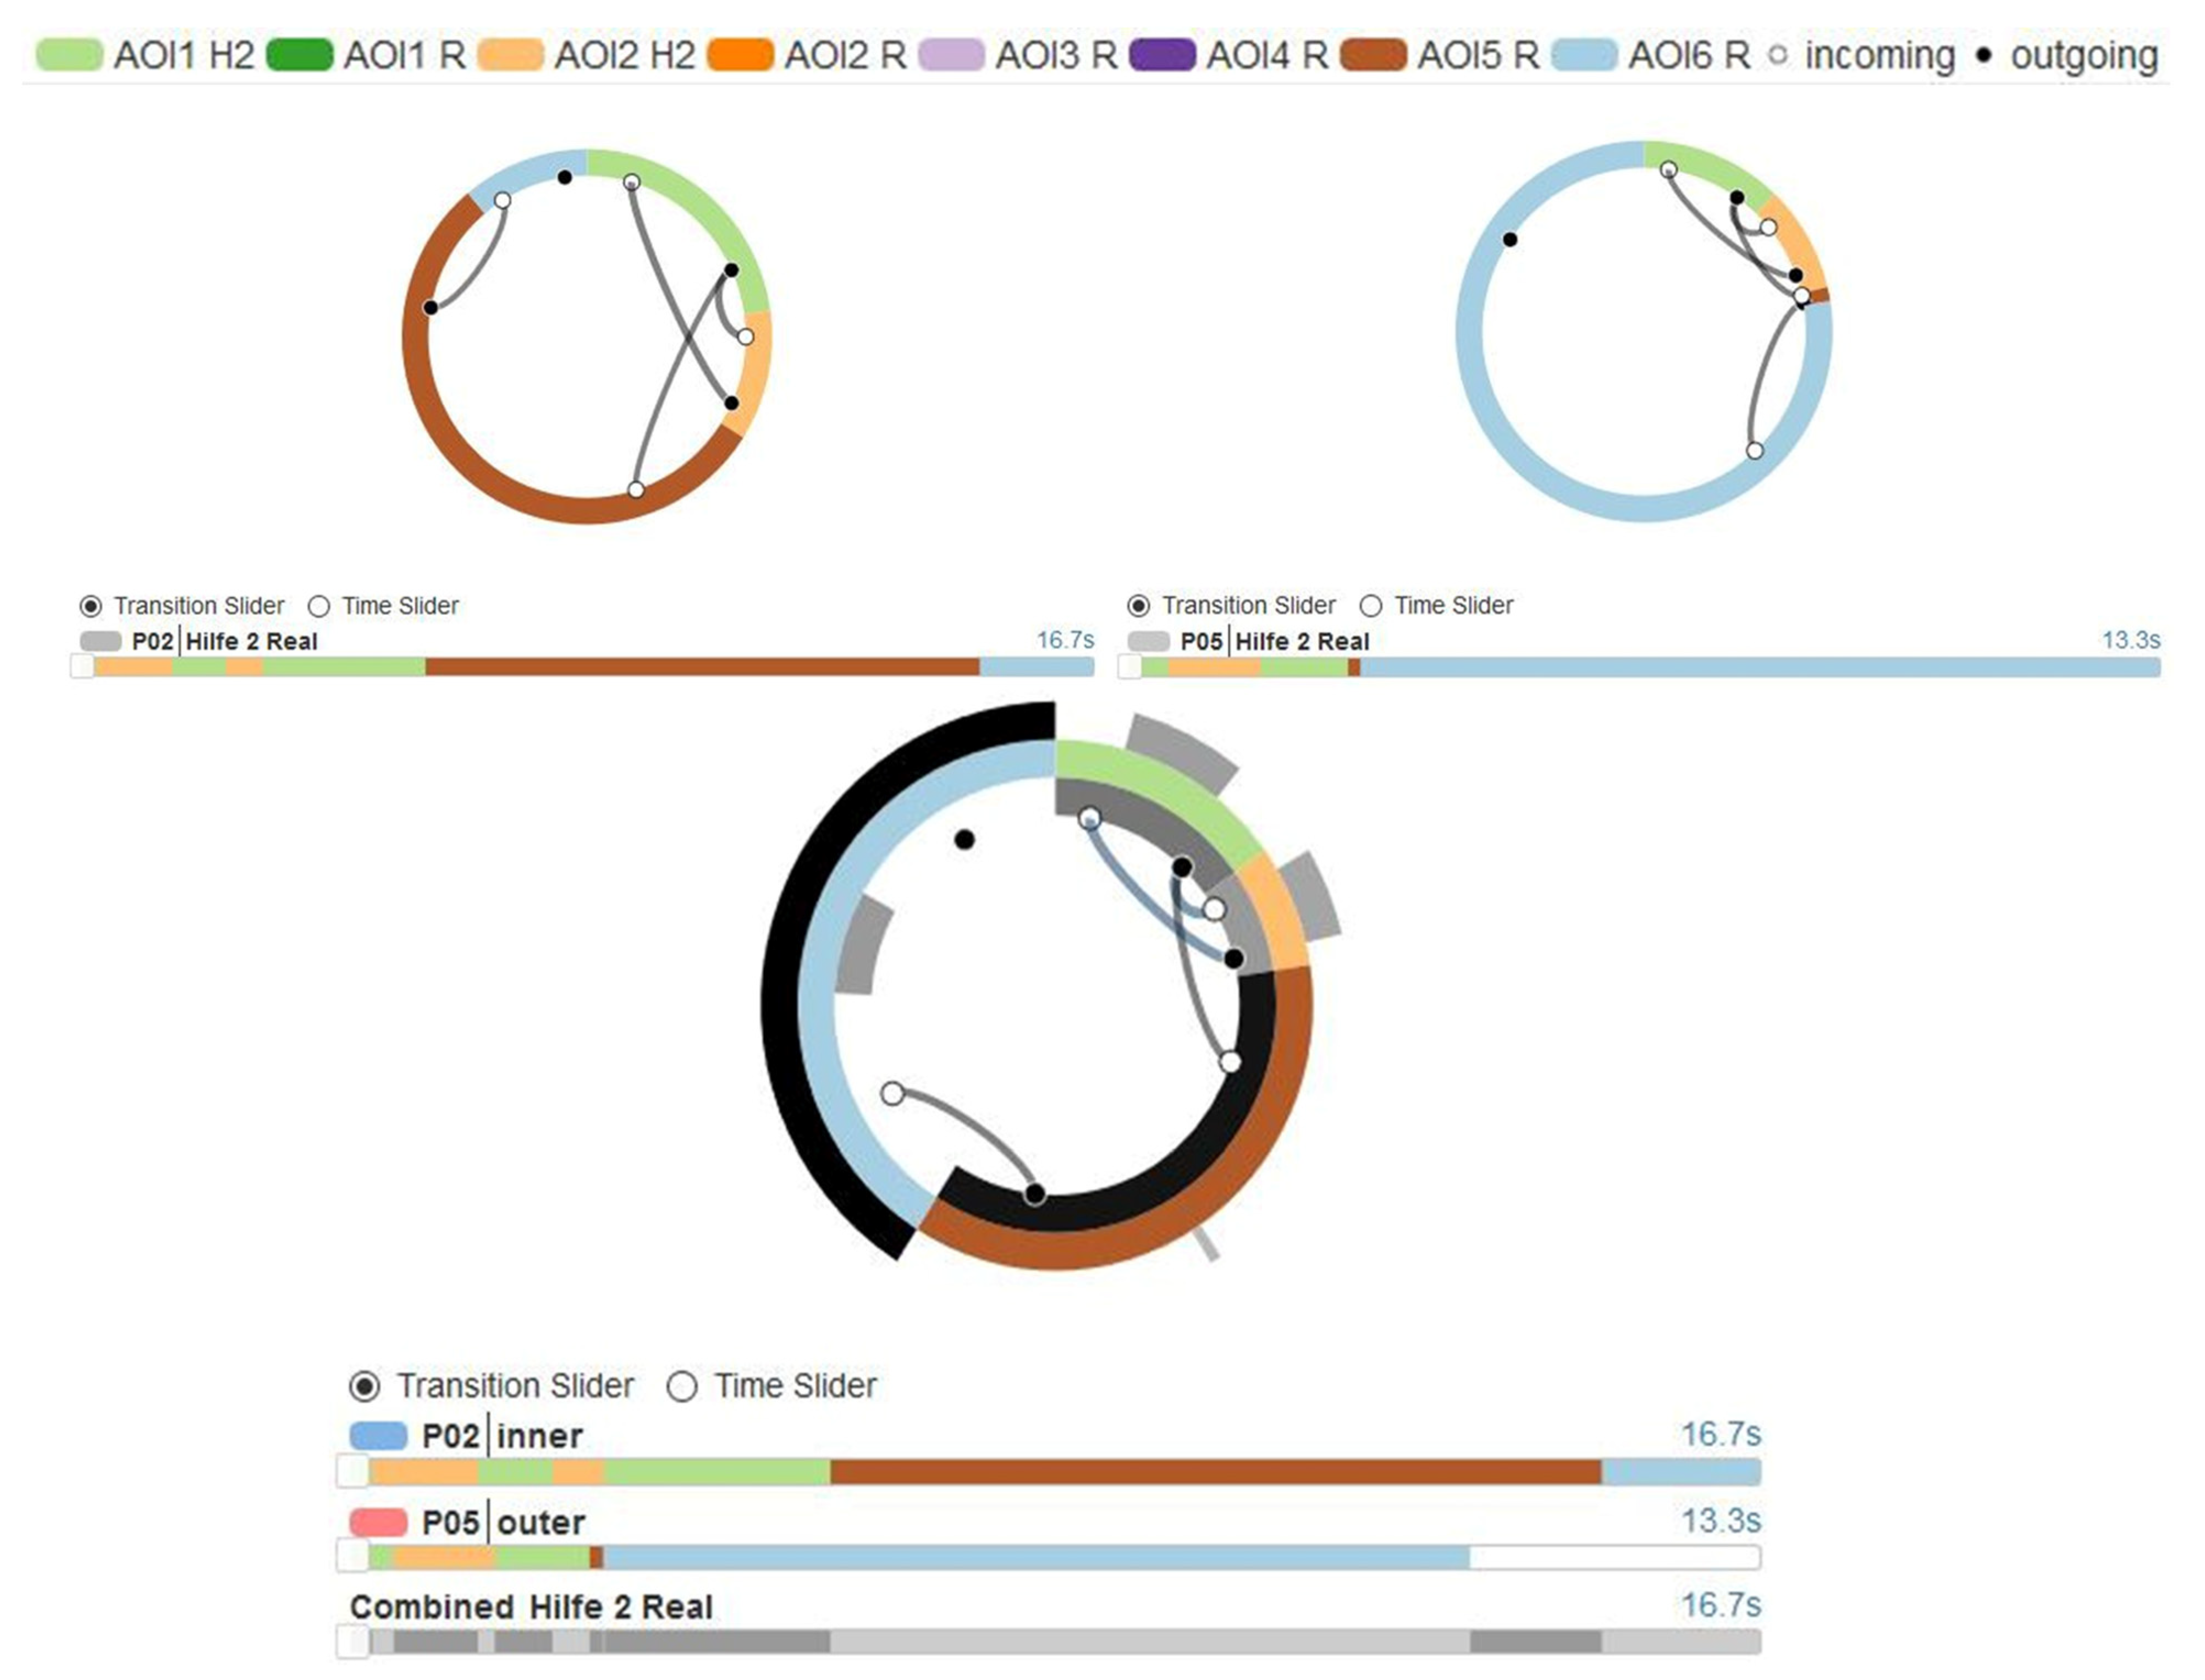
Transition graphs for P02 and P05, hint 2 (H2)/experiment (R). Two AOIs on the hint and six AOIs in the experiment. AOI1 H2 = battery with cable connection, AOI2 H2 = slide with cable connection, AOI1 R = battery, AOI2 R = cable, AOI3 R, pencil leads, AOI4 R = slide, AOI5 R = battery with cable connection, AOI6 R = slide with cable connection.
Furthermore, the scarf plots of several persons can be compared to analyze the dwell times and AOI sequences. This enables the investigation of the temporal order of the transitions (see Figure 7. For the comparison of the transition graphs, the so-called similarity index is also determined, which is based solely on the transition weights (see [38]). To calculate the similarity of two transition graphs, the difference is needed. “The difference is calculated by subtracting the transition counts wpq1, wpq2 between two AOIs ap and aq and summing the absolute difference for all pairs of AOIs of the two transition graphs. Then, the sum of the differences is divided by the total weight of all transitions for both transition graphs” [38] (p. 91):
This index can take a value between 0 and 1, where 0 means no match and 1 means a complete match of two graphs. To achieve this, the value is inverted to sim = 1 − d [42]. The calculation of the similarity index is the first step, using radial transition graphs. Based on these indices, the exemplary pairwise comparisons (see Section 3.1 and Section 3.2) were selected.
Figure 7.
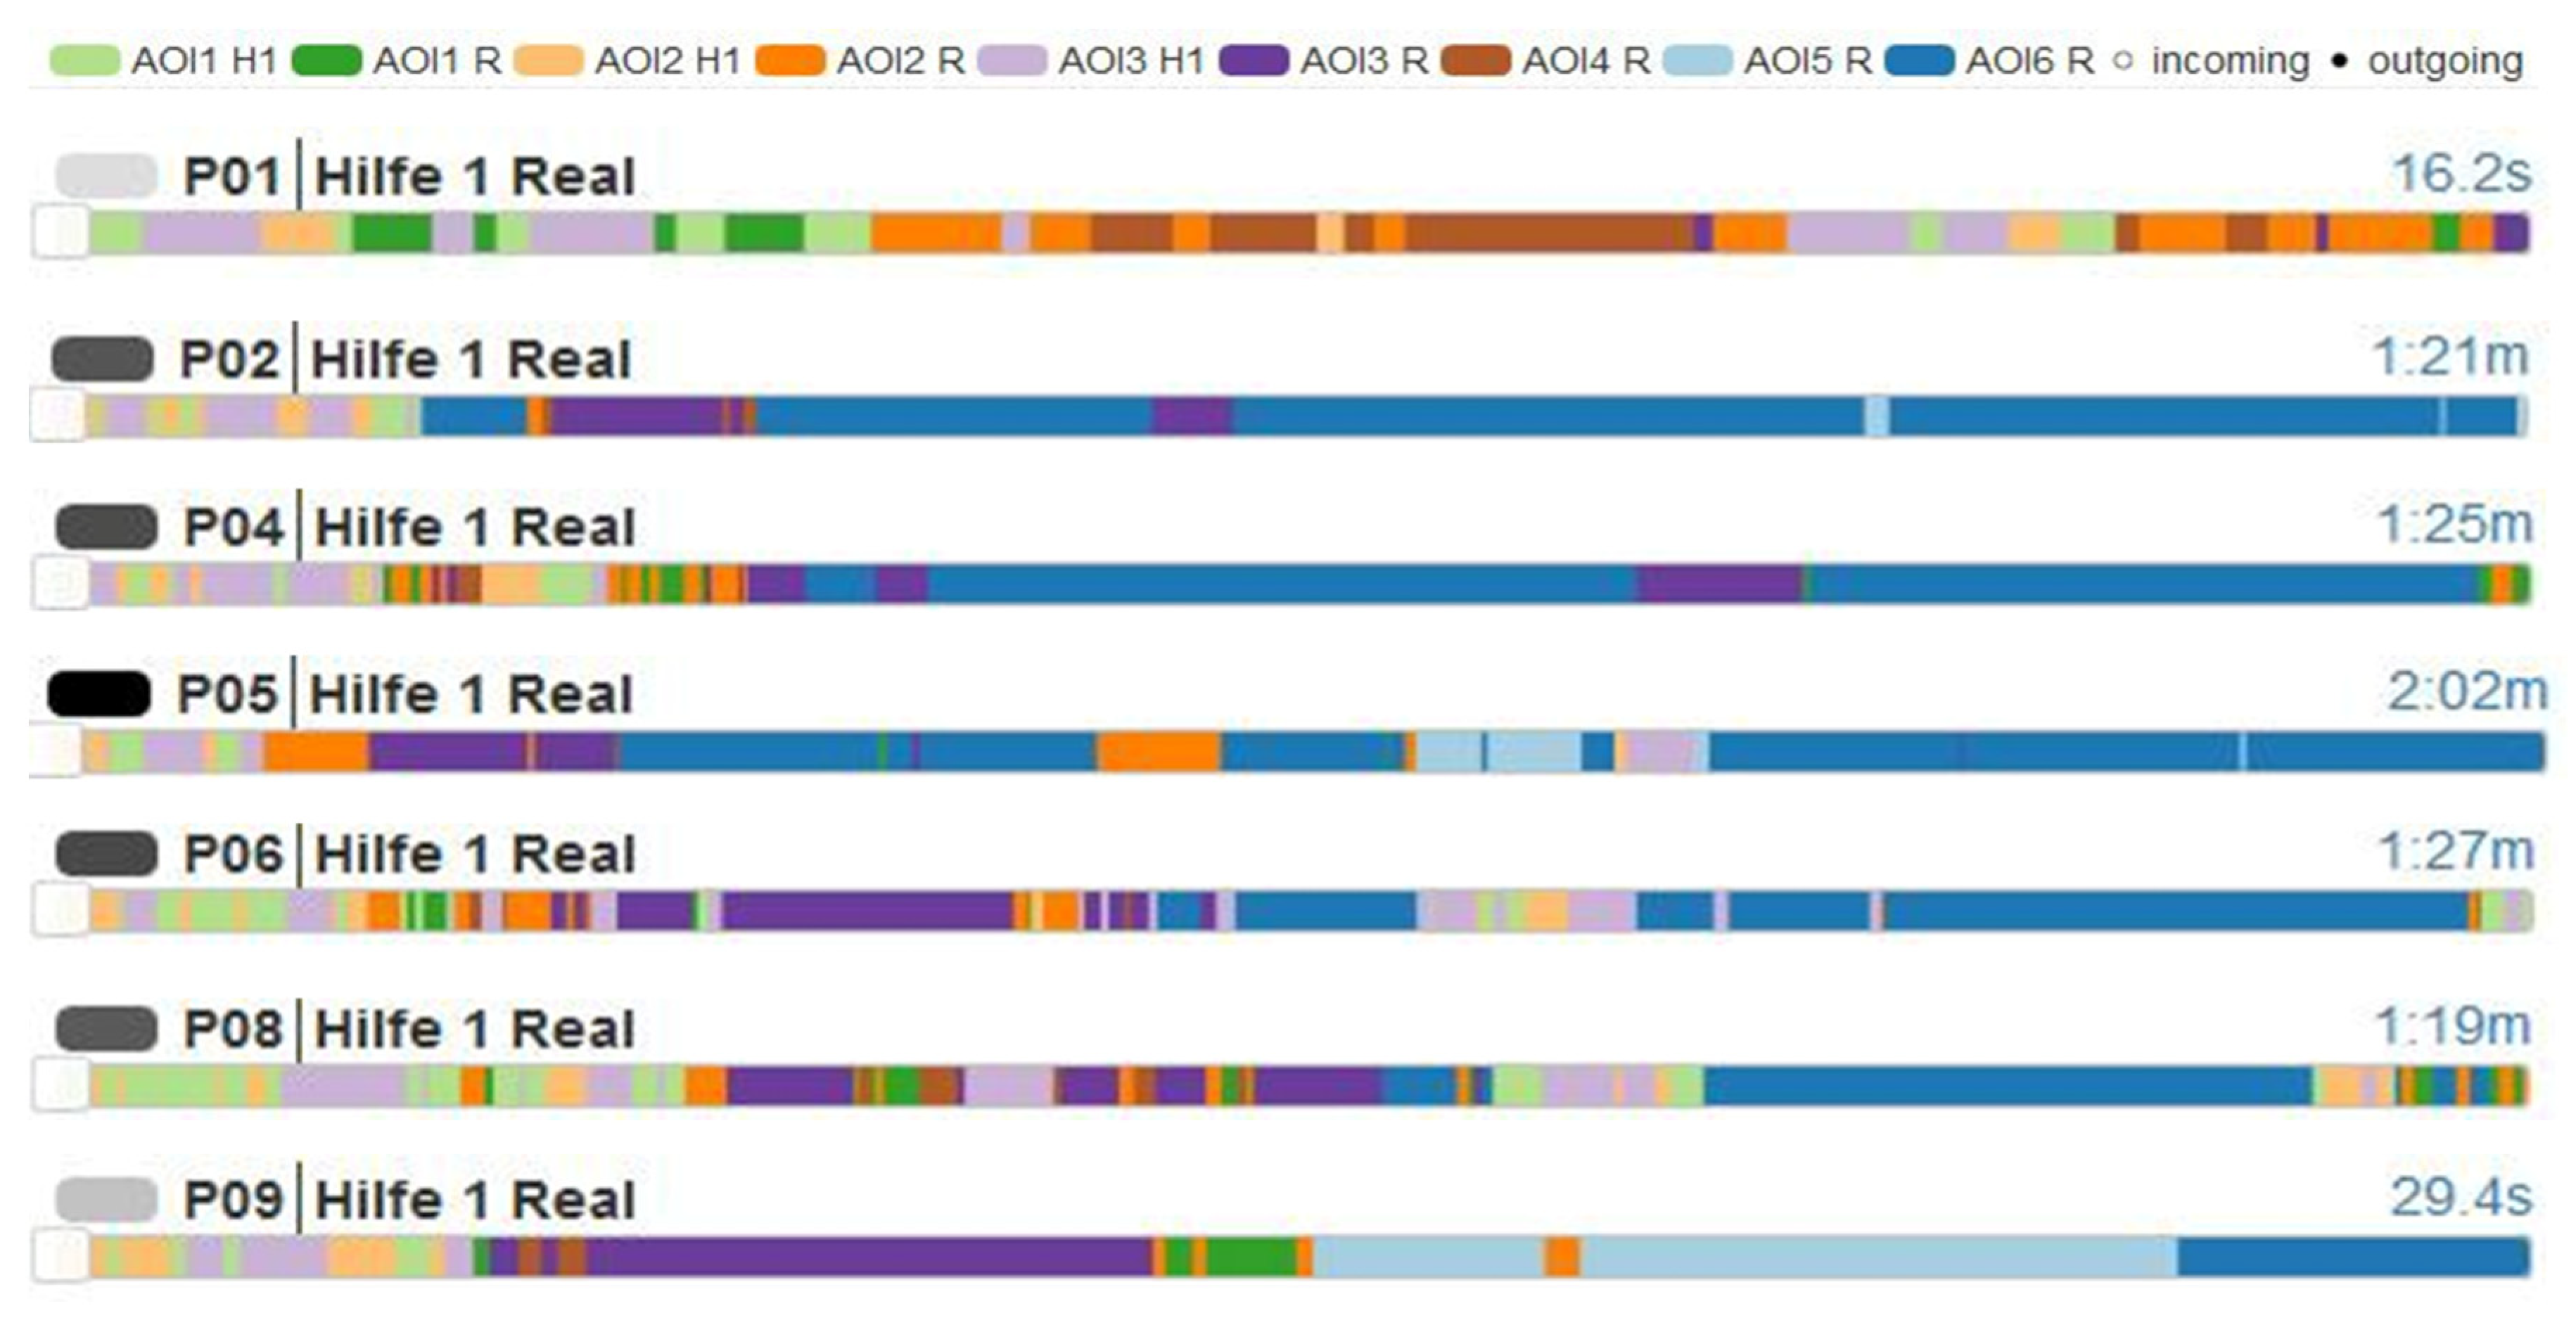
Scarf plots of all participants, hint 1 (H1)/experiment (R). AOI1 H1 = battery, AOI2 H1 = cable, AOI3 H1 = slide set up, AOI1 R = battery, AOI2 R = cable, AOI3 R, pencil leads, AOI4 R = slide, AOI5 R = battery with cable connection, AOI6 R = slide with cable connection.
3. Results
Table 1 shows the procedure of the students based on the recording of the mobile eye tracker. Participant 7 (P07) did not use any hint (no eye tracking data for the set-up) and was therefore excluded from further eye tracking analyses. In the set-up box of Participant 10 (P10), the microscope slide was missing and, thus, was also excluded from further eye tracking analyses. Except for Participant 3 (P03; used only hint 2) and Participant 9 (P09; used only hint 1), all students used both hints and all of them were able to set up the experiment correctly. Participant 01 (P01) used both hints but was not able to set up the experiment correctly. P01 was only able to set up the experiment correctly after using the hint for the conduction of the experiment (see Table 1). In order to gain deeper insight into the exact use of the sequential AR hints, the AOI based evaluation of the data from the mobile eye tracker was applied.
Table 1.
Procedure of the students in setting up zinc iodide electrolysis.
Further results are displayed separately according to hint 1/experiment or hint 2/experiment.
3.1. Hint 1/Experiment
First, the similarity indices were determined (see Table 2). All participants who called for hint 1 are shown.
Table 2.
Similarity indices of the students for hint 1/experiment.
Based on the similarity indices, results reveal that P04 and P08 have the highest consistency with 0.61, based on their weighted transitions. P01 and P02 have the lowest consistency with 0.25. All other persons are in the range between 0.25 and 0.61.
The pairwise comparison of two participants is made possible by the radial transition graphs and Transition Graph Diff View in combination with scarf plots. Due to this new analysis method, a deeper insight can be obtained into the strategies of students while working with the sequential scaffolds. To show the potential for this AOI based eye tracking analysis, the further analysis describes exemplarily the results for the persons with the lowest agreement (P01 and P02). For further comparison of all participants regarding the use of the sequential scaffolds (hints), scarf plots were used. (All other radial transition graphs can be found in Appendix A, see Figure A1).
Figure 5 shows the individual transition graphs for P01 (top left) and P02 (top right), the integrated transition graph (P01/P02, middle) and the corresponding scarf plots (below). Looking at the transition graph of P01 (see Figure 5, top left), it is noticeable that AOIs 5R and 6R (battery with cable connection and slide with cable connection in reality) were not considered at all. This is consistent with the results presented in Table 1, since P01 did not manage a (partial) set-up and these AOIs could only have been considered if at least a partial set-up existed. In combination with the scarf plot, results reveal that P01 first looked at the AOIs of the hint, then at the AOIs of the materials of the experiment, then again at those of the hint and again at the AOIs of the experiment. Among these, AOIs 2R (cable, experiment; 4.0 s), 4R (slide, experiment; 3.8 s), and AOI 3 H1 (slide set up, hint 1; 3.3 s) were viewed the longest. The highest number of transitions (4 each) were from AOI4 R (slide, experiment) to AOI2 R (cable, experiment) and vice versa, followed by 3 transitions from AOI1 H1 (battery, hint 1) to AOI3 H1 (slide built, hint 1), and 3 transitions from AOI1R (battery, experiment) to AOI1 H1 (battery, hint 1). These results indicate a search and identification of the equipment shown in the hint and in the experiment.
A closer look at the transition graph of P02 (see Figure 5, top right) reveals that all AOIs except for AOI1 R (battery, experiment) were in gaze. The reason here is that P02 had already connected the battery to the cables before using the first hint (see Table 1). Together with the scarf plot, results show that P02 first looked at the AOIs of the hint (total of about 12.0 s) and then looked exclusively at the AOIs of the experiment (about 69.0 sec.). Here, the AOI6 R (slide with cable connection, experiment) was viewed for the longest time with 58.1 sec., followed by AOI3 R (pencil leads, experiment) with 8.7 s and AOI3 H1 (slide built up, hint 1; 5.9 s). The highest number of transitions occurred between hint 1 AOIs, with five transitions from AOI3 H1 (slide built, Hint 1) to AOI2 H1 (cable, hint 1) and four transitions each from AOI2 H1 (cable, hint 1) to AOI3 H1 (slide built, hint 1) and AOI2 H1 (cable, hint 1) to AOI1 H1 (battery, hint 1). In the experiment, there was the most frequent change of gaze from AOI6 R (slide with cable connection, experiment) to AOI5 R (battery with cable connection, experiment) with three transitions. It is also noticeable that there is only one transition from the hint to the experiment (AOI1 H1 → AOI6 R). These results suggest that P02 first looked intensively at the AOIs of the hint and then switched to the experiment to set it up. In doing so, P02 seems to have understood the presented hint, since the set-up succeeded with hint 1 alone and there was no more change in gaze back to the AOIs of hint 1 (see also Figure 5).
The direct comparison of both persons becomes possible with the integrated transition graph (see Figure 5, bottom). Results show that both students are the only ones to have an almost identical dwell time for AOI1 H1 (battery, hint 1). For all other AOIs, the dwell times of both students differ from each other, with P01 viewing AOI1 R (battery, experiment), AOI2 R (cable, experiment), and AOI4 R (slide, experiment) longer than P02. All other AOIs, both those of hint 1 and those of the, were viewed longer by P02 (see Figure 5). When comparing the number of transitions, findings show that P01 has more transitions between almost all AOIs within Hint 1, as well as between the AOIs of Hint 1 and the experiment, than P02 (see blue lines, Figure 5). P02 has more transitions away from or to AOI5 R (battery with cable connection, experiment) as well as AOI6 R (slide with cable connection, experiment). Results of the integrated transition graph are plausible because P02 first looked exclusively at the AOIs of hint 1 and then only at those of the experiment, which means that P02 set up the experiment after the hint was used (see Figure 5, top right). In contrast, P01 had a constant change of gaze between the AOIs of hint 1 and the experiment (see Figure 5), without setting up anything.
Below are all the scarf plots for students who used hint 1 (see Figure 7).
Comparing scarf plots of all students reveals that P01 seems to be an outlier, since only this person did not look at AOI5 R (battery with cable connection, experiment) and AOI6 R (slide with cable connection, experiment). All participants looked at the AOIs of hint 1 before they switched to the experiment (AOIs experiment). In the experiment, the AOIs of the individual materials (AOI1 R, AOI2 R, AOI3 R, and AOI4 R) were considered first, followed by those of the combined individual components (AOI5 R and AOI6 R; see Figure 7). P02, P04, P05, and P09, after looking at the AOIs of hint 1, looked (almost) exclusively at the AOIs of the experiment and did not switch back to the AOIs of hint 1. P06 and P08 switched to the experiment after looking at the AOIs of hint 1, then briefly switched back to the AOI1 H1 (battery, hint 1), AOI2 H1 (cable, hint 1) and AOI3 H1 (slide set up, hint 1), and then again looked at the AOIs of the experiment with the combined components (AOI5 R and AOI6 R).
3.2. Hint 2/Experiment
First, the similarity indices were calculated (see Table 3). All students who used hint 2 are shown here.
Table 3.
Similarity indices of the students for hint 2/experiment.
P02 and P05 have the highest consistency with 0.80, based on their weighted transitions. P01 and P08 have the lowest consistency with 0.12. All other persons are in the range between 0.13 and 0.48.
Like the above, to show the potential of the radial transition graphs and Transition Graph Diff View in combination with scarf plots for AOI based eye tracking analysis, the further analysis is again focused exemplarily on two persons. The authors decided to present the results for participants with the highest level of consistency (P02/P05) to obtain a deeper insight into the strategies of students while working with the sequential scaffolds and to fully show the potential of this scanpath analysis in order to compare two persons directly from lowest (see example “Hint 1/experiment”) to highest consistencies. For further comparison of all participants regarding the use of the sequential scaffolds (hints), scarf plots were used. (All other radial transition graphs can be found in the Appendix A, see Figure A2).
Figure 6 shows the transition graphs for P02 (top left) and P05 (top right), the integrated transition graph (P02/P05, middle) and the corresponding scarf plots (below).
The transition graph of P02 (see Figure 6, top left) shows that both AOIs of hint 2 (AOI1 H2, battery with cable connection/AOI2 H2, slide with cable connection) as well as only the AOIs with the combined devices (AOI5 R, battery with cable connection/AOI6 R, slide with cable connection) of the experiment were gazed at. The scarf plot shows in combination that P02 first looked alternately at both AOIs of hint 2 and then at AOI5 R and AOI6 R. The well time of AOI5 R (battery with cable connection, experiment) is the highest at 9.2 s, followed by AOI1 H2 (battery with cable connection, hint 2) at 3.8 s With two transitions each, the most frequent transition was from AOI2 H2 to AOI1 H2 and back again (see Figure 6). Furthermore, there was one transition each from AOI1 H2 (battery with cable connection, hint 2) to AOI5 R (battery with cable connection, experiment) and from AOI5 R to AOI6 R (slide with cable connection, experiment). Bearing in mind that P02 had already set up the experiment correctly before using hint 2, these results indicate that P02 gazed at hint 2 (AOIs of hint 2) in order to evaluate the set-up of the experiment.
The transition graph of P05 (see Figure 6, top right) reveals that exactly the same AOIs were considered as P02. P05 had also finished setting up the experiment before hint 2 was used. The scarf plot shows that P02 first looked at the AOIs of hint 2 and then switched to the AIOs of the experiment (see Figure 6). Here, the dwell time for the AOI6 R (slide with cable connection, experiment) is highest at 10.3 s, followed by AOI1 H2 (battery with cable connection, hint 2) at 1.6 sec. Each transition for P05 shown in Figure 6 occurred once. The results for P05 also indicate that this hint was used to evaluate the set-up of the experiment.
For direct comparison of both participants, the integrated transition graph was used (see Figure 6, middle). Results reveal that P02 looked at both AOIs of hint 2 for slightly longer than P05. AOI5 R was longer in gaze by P02, whereas AOI6 R was longer in gaze by P05. With the help of the scarf plot, it can be seen that the sequence of the considered AOIs is almost identical (see Figure 6, below). The number of transitions of both students are identical from AOI1 H2 (battery with cable connection, hint 2) to AOI5 R (battery with cable connection, experiment) as well as from AOI5 R (battery with cable connection, experiment) to AOI6 R (slide with cable connection, experiment). From AOI1 H2 to AOI2 H2 and in the reverse direction, P02 had two transitions each, i.e., one transition more than P05, which can be seen from the blue-gray lines.
Below are all scarf plots of students using hint 2 (see Figure 8).
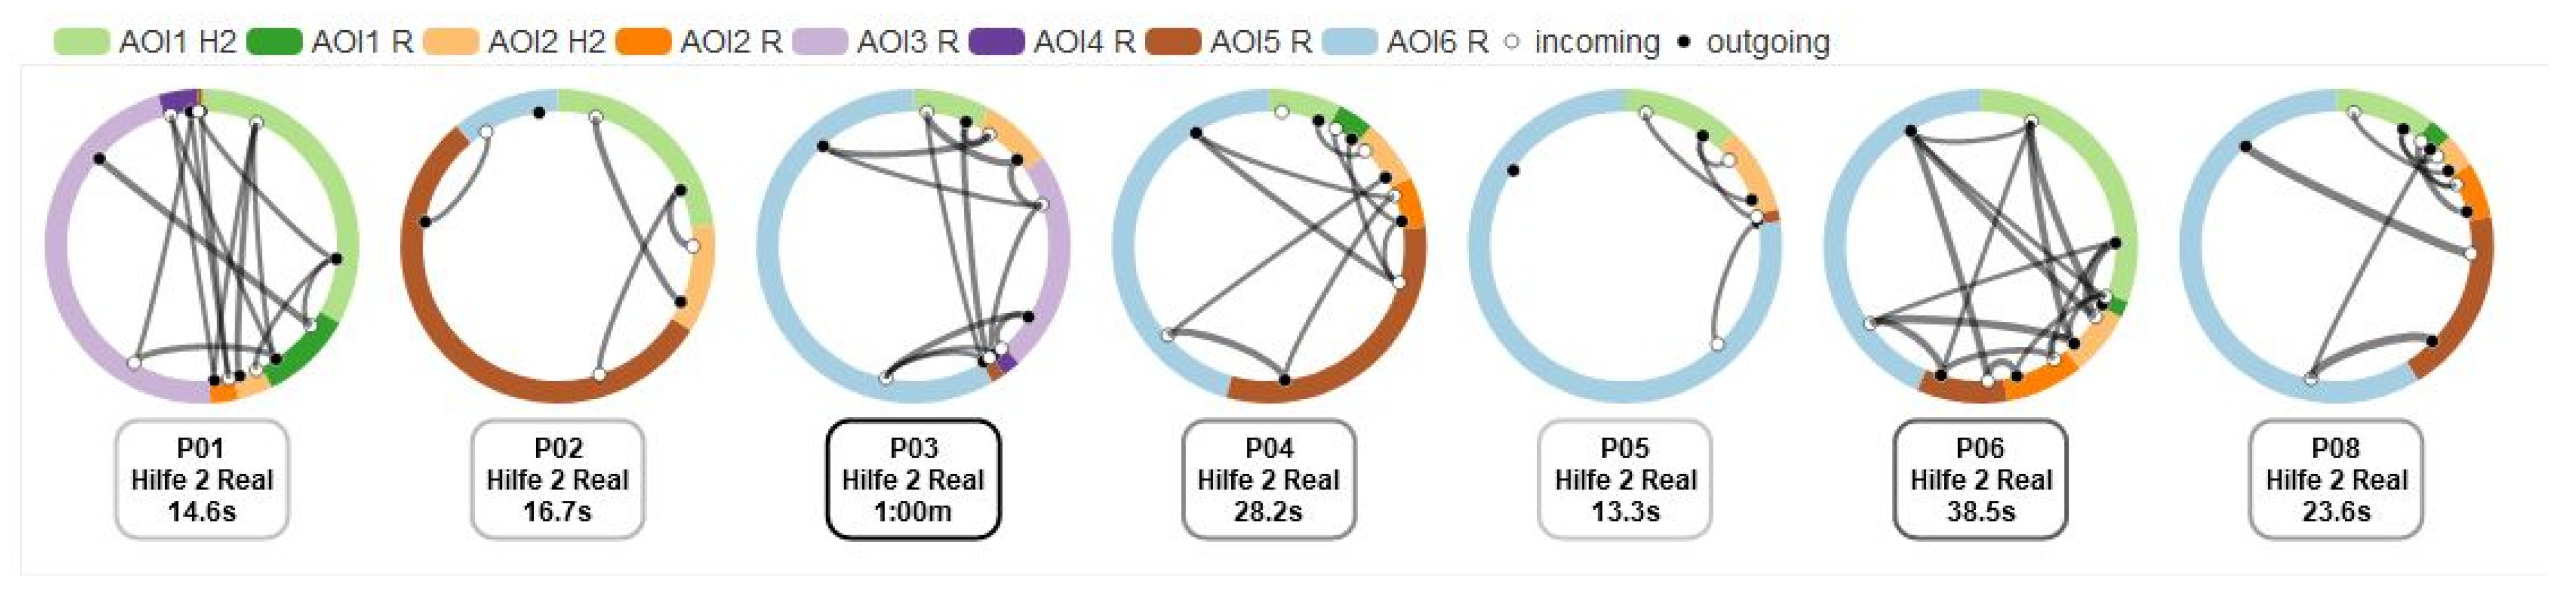
Figure 8.
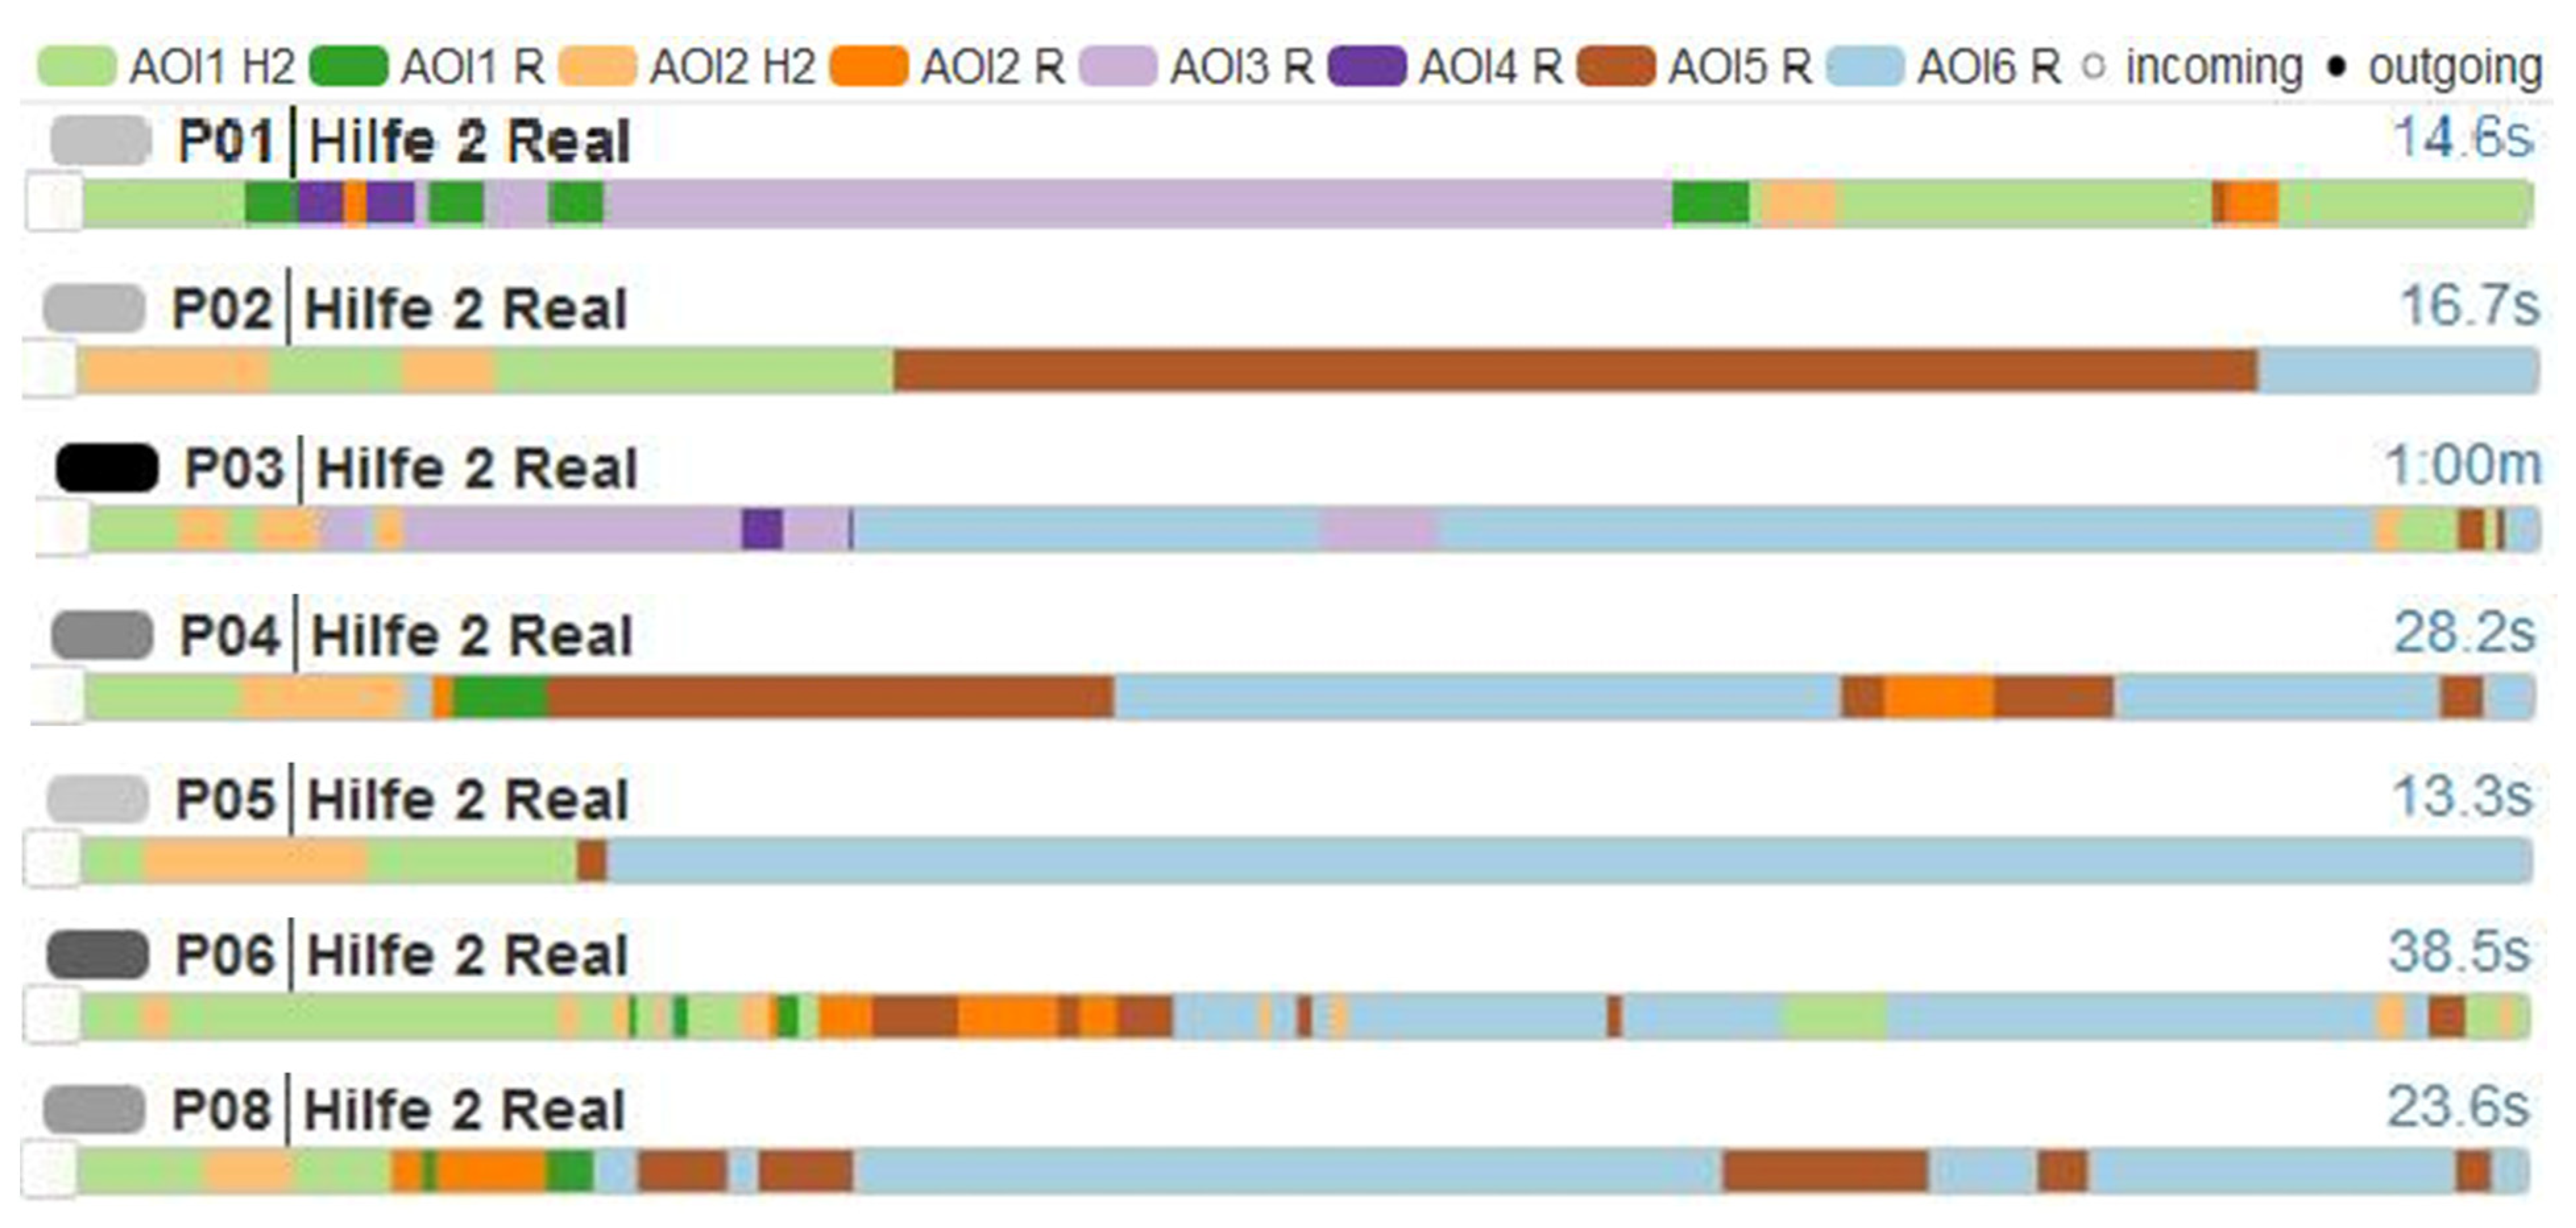
Scarf plots of all participants, hint 2 (H2)/experiment. AOI1 H2 = battery with cable connection, AOI2 H2 = slide with cable connection, AOI1 R = battery, AOI2 R = cable, AOI3 R, pencil leads, AOI4 R = slide, AOI5 R = battery with cable connection, AOI6 R = slide with cable connection.
Comparing scarf plots of all participants with each other, P01 again seems to be an outlier due to hardly or not at all looking at AOI5 R (battery with cable connection, experiment) and AOI6 R (slide with cable connection, experiment). All participants looked at the AOIs of hint 2 before they turned to the experiment (AOIs experiment). All participants remained almost exclusively in the experiment after they turned to it for the first time (after using the scaffold; except for P03 and P06, who again switched to the AOIs of hint 2 towards the end).
3.3. Short Interview
The results of the interview are summarized in Table 4. All students are shown here, including P07 and P10 (excluded from eye-tracking analyses, see above). Due to the lack of eye tracking data for these persons, the interviews cannot be correlated with the eye tracking data, but they do provide an insight into the use of the sequential scaffolds (see research question Q 1).
Table 4.
Results of the short interviews.
4. Discussion
For this exploratory study of gaze change between sequential AR-based scaffolding and experiment (hint 1/experiment and hint 2/experiment), the first step was to analyze the similarity indices based on the transitions. Thus, all participants can be compared at a glance and similarities or differences in gaze behavior can be identified based on the transitions [38]. However, the higher the number of AOIs, the lower the likelihood of a large match based on the transitions alone. The reason here lies in the high number of possibilities for different transitions with nine (hint 1/experiment) or eight (hint 2/experiment) AOIs. Therefore, values in the range 0.3 to 0.4 are interpreted here as mediocre consistency and values above 0.4 (see Table 2 and Table 3) are interpreted as (relatively) high consistency. Since these values are not based on the dwell times, the gaze behavior of the students should be further analyzed with the transition graphs or integrated transition graphs as well as scarf plots, since the dwell times and the temporal sequence of the visited AOIs can also be examined and compared (see [34,38]). Further, the students were interviewed after they finished the experiment, regarding the use of the sequential scaffolds (see Table 4).
With regard to research question Q1, concerning how the students use the sequential hints to set up the experiment (gaze transition between hint and experiment), results allow the following conclusions:
Based on the similarity indices, transition graphs, and scarf plots of both hints (H1/experiment and H2/experiment), it can be seen that P01 is an outlier, as this person’s gaze behavior is clearly different from all other students (see transition graphs Figure 5 and scarf plots Figure 7 and Figure 8). Only P01 had recurrent gaze changes between the hint and corresponding experiment in both hint 1/experiment and hint 2/experiment. This indicates a search and identification of the equipment shown in the hints and in the real experiment and that P01 did not understand how to set up the experiment based on the set-up hints. In the interview, P01 said “I did not know how this should be set up and could not bring the presented materials in relation to the set-up”. Further, P01 said that the two AR scaffolds were not helpful. These statements support the interpretation of the eye tracking data because P01 did not know how to set up the experiment despite calling on both AR hints.
We had hypothesized that students gaze at all relevant parts of the sequential scaffolds, so that they are able to set up the experiment partially or completely. Regarding the dwell times, for all students (except P01), those of the AOIs of the experiment were higher than those of the hints. This leads to the conclusion that participants (except P01) first briefly looked at the hints. Here they gaze at all AOIs of the hints, which means they gaze at all relevant materials displayed as 3D AR elements (see Figure 7 and Figure 8). The students remembered and/or understood the displayed content and then turned to the experiment where they partially set it up, as far as is shown in hint 1 (P06), or completely set up the experiment (P02, P04, P05, P08 and P09 only used hint 1 to completely set up the experiment) as shown in hint 2 (P03 only used hint 2 to set up the experiment). This was done without constantly switching between the AOIs of the hints and those of the experiment. These interpretations are supported by the interview data. All students (except P01) said that the AR scaffolds they used helped them to set up the experiment (see Table 4). Since these students were able to set up the experiment successfully using the sequential AR scaffolds, we assume that the content of the scaffolds was understood, but it can only be understood if all AOIs have been gazed at, because all relevant materials for the set-up are displayed in these AOIs. For example, P06 said that “both hints were very helpful, so I knew how to do it and then did it correctly”. P03 said “I didn’t know exactly how to set it up and then I understood how to do it”. P08 said that “the content of the hint was clear”. The statements of the other students can also be interpreted in the sense of understanding (see Table 4, right column). Thus, we can confirm the above hypothesis.
The higher dwell time of the AOIs in the experiment can be explained due to the fact that these AOIs are viewed during practical/haptic work and the partial or complete setup takes time, since, for example, attaching the cables to the pencil leads requires a certain amount of dexterity.
The second hypothesis was that students make use of the hints and switch continuously between the sequential scaffolds and the experiment instead of starting the experiment alone. Due to the low level of prior knowledge of the students, the experiment was designed between level 1 and level 2, according to Bell et al. [7]. In addition, sequential scaffolds were offered, which we refer to as hints, that are worked examples at different stages ranging from a first basic hint (partial set-up of the experiment) up to a full worked example (complete set-up of the experiment). This was done because learning from worked-examples is less effortful for inexperienced learners [11,12]. Based on the results presented, this hypothesis cannot be confirmed in this way. Although all students start gazing at the AOIs of the hints before setting up the experiment, repetitive gaze changes between hints (AOIs of the hints) and experiment (AOIs of the experiment) do not occur (see scarf plots Figure 7 and Figure 8). Almost all students, except P07 (no AR hint), stated in their interviews (see Table 4) that they did not know how to start the set-up with the given materials, if they had tried the set-up without calling a hint (like P02 and P03), how the given materials should be combined. For example, P02 said “I didn’t know where to connect the mines” (pencil leads). Therefore, the students decided independently to call a scaffold to be able to set up the experiment. That the self-designed sequential scaffolds were helpful for the students can be seen in Table 4. This means that the students begin by studying an example before moving on to a practice problem, which is known as effective task sequencing [12,15,16]. In contrast to Forster et al. [18], who found that when given the choice, students are more likely to start with the practice exercises than with the worked examples, the students in this study start with the sequential scaffolds (worked examples) and then turn to the practice exercise (setting up the experiment). The results of this study are more consistent with the findings of Van Harsel et al. [16], in which only 5% started directly with the practical problem and all other with an example. In conclusion, as Van Gog et al. [11] point out, the learners in this study seem to be (implicitly or explicitly) aware of the fact that examples are efficient for learning, as they make substantial use of them here to set up the experiment correctly. Even if the approaches of the studies mentioned differ slightly (scaffolded approach instead of problem solving), it still shows that it is not entirely trivial to create materials in such a way that students work independently on the one hand, but still receive support at the right time and use it.
With regard to research question Q2, concerning which patterns can be identified in the use of these sequential hints, the following conclusions result:
Interpreting the previously described findings, a first pattern in the use of the sequential scaffolds would be that the students who need help first look at all AOIs of the hints in which the 3D AR materials are displayed. This is true for hint 1 and hint 2. Only after the AOIs of the hints have been examined in detail do participants turn to the experiment (AOIs experiment) to set it up (see scarf plots Figure 7 and Figure 8). Again, this indicates that the students understand the content of the hints (as stated above, see also Table 4) and then implement it in the experiment. This supports the basic idea of the scaffolds in helping the students to set up the experiment (except P01 as an outlier) [9,13].
In addition, there is a pattern of evaluation of the set-up as shown by P02 and P05 with the help of the radial transition graphs and integrated transition graph (Transition Graph Diff View). These participants correctly performed the set-up of the experiment by only using hint 1. As shown in Figure 6, the AOIs of hint 2 (complete set-up shown) were briefly gazed at first and then the two corresponding AOIs in the experiment were gazed at. The relatively short dwell time for all viewed AOIs strongly suggests that the set-up was controlled based on the second sequential hint. This interpretation of the eye tracking data is supported by the interviews, as P02 stated: “I only looked at the second AR hint to check that the set-up was correct. I would not have needed it to set up the experiment”, and P05 stated: “I found the second AR-help the most helpful where you can see the whole setup”. As shown in Figure 8 (scarf plots hint 2/experiment), P03 and P06 switched their gaze from the AOIs of the experiment back to the AOIs of hint 2 toward the end of the set-up. This can also be interpreted as a control gaze for checking the correctness of the set-up with the help of hint 2. Affeldt et al. [9] observed similar results for analogous sequential scaffolds, whereby these authors also interpret using the last hint, as it is in this case, for some students in their study as a control call.
A major limitation of this research is the small sample size. However, the chosen sample size here is not unusual for exploratory studies that use eye tracking as a method of analysis in an explorative way (see [34,37]). Therefore, results of this exploratory study were presented and analyzed with descriptive methods, which are well suited for scanpath analyses. They only show a trend and should be interpreted as such. As is usual in exploratory studies, conclusions made here are therefore interpreted in terms of hypotheses, which can be tested in the context of further studies with a larger sample size, e.g., using statistical methods (see [37]). In addition, participants here had little or no prior knowledge with regard to redox reactions (zinc iodide electrolysis (experiment) is one of these reactions). The extent to which prior knowledge influences the use of sequential scaffolds in setting up experiments should also be controlled in subsequent analyses. Taken together, this study shows that sequential AR-based scaffolds seem to be a promising approach to support leaners in self-directed experimenting in the science classroom.
Author Contributions
Conceptualization, T.F., I.D., S.M. (Stephanie Moser), A.S., S.M. (Simone Maier) and J.Z.; Methodology, T.F., I.D., S.M. (Stephanie Moser), A.S., S.M. (Simone Maier) and J.Z.; Validation, T.F. and J.Z.; Investigation, T.F., I.D. and A.S.; Data curation, T.F., I.D., S.M. (Stephanie Moser), A.S., S.M. (Simone Maier) and J.Z.; Writing—original draft, T.F., I.D., S.M. (Stephanie Moser), A.S., S.M. (Simone Maier) and J.Z.; Writing—review & editing, T.F., I.D., S.M. (Stephanie Moser), A.S., S.M. (Simone Maier) and J.Z.; Visualization, T.F. and S.M. (Simone Maier); Project administration, T.F., I.D., S.M. (Stephanie Moser), A.S. and J.Z.; Funding acquisition, T.F., I.D., S.M. (Stephanie Moser), A.S. and J.Z. All authors have read and agreed to the published version of the manuscript.
Funding
This research was funded by Robert Bosch Stiftung, Stuttgart, Germany. Grant number: 00906424-003.
Institutional Review Board Statement
All participants were students from an Austrian middle school. Participation was anonymous, i.e., all data were collected and analyzed anonymously, on a voluntary basis. No persons are visible on the eye tracking recordings, only the workplace and participants’ hands. All study participants were informed about the scientific purpose of the study. Due to all these measures in the implementation of this study an audit by an ethics committee was waived.
Informed Consent Statement
Informed consent was obtained from all participants involved in the study.
Data Availability Statement
The data presented in this study are available on request from the corresponding author. The data are not publicly due to the ongoing study.
Acknowledgments
Our thanks also go to all project partners, participants as well as Tobii Pro Eye Tracking.
Conflicts of Interest
The authors declare no conflict of interest.
Appendix A
Figure A1.
Radial transition graphs Hint 1/experiment (all participants).
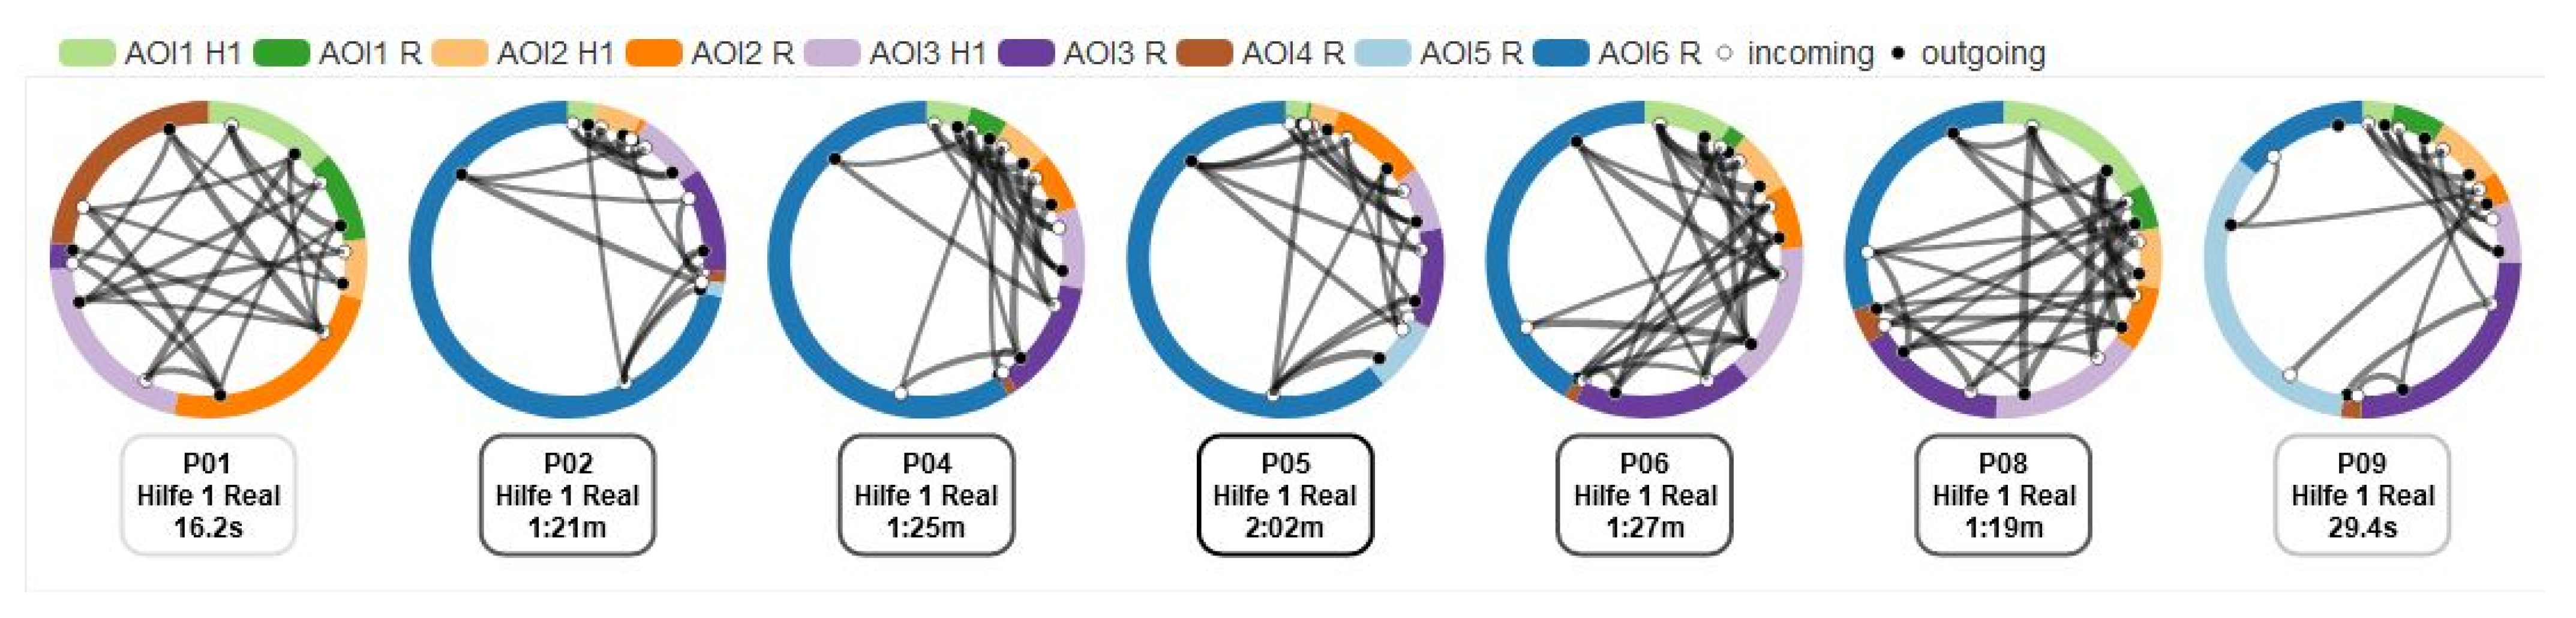
Figure A2.
Radial transition graphs Hint 2/experiment (all participants).
References
- Baur, A.; Hummel, E.; Emden, M.; Schröter, E. Wie offen sollte offenes Experimentieren sein? Ein Plädoyer für das geöffnete Experimentieren [How open should open experimentation be? A plea for open experimentation]. MNU J. 2020, 72, 125–128. [Google Scholar]
- Eckhardt, M.; Urhahne, D.; Conrad, O.; Harms, U. How effective is instructional support for learning with computer simulations? Instr. Sci. 2013, 41, 105–124. [Google Scholar] [CrossRef]
- Sommer, K.; Pfeifer, P. Experiment und Erkenntnis [Experiment and cognition]. In Konkrete Fachdidaktik Chemie; Sommer, K., Wambach-Laicher, J., Pfeifer, P., Eds.; Aulis: Seelze, Germany, 2018; pp. 70–88. [Google Scholar]
- Maiseyenka, V.; Schecker, H.; Nawrath, D. Kompetenzorientierung des naturwissenschaftlichen Unterrichts. Symbiotische Kooperation der Entwicklung eines Modells experimenteller Kompetenz [Competence orientation of science education. Symbiotic cooperation of the development of a model of experimental competence]. Phys. Didakt. Sch. Hochsch. 2013, 1, 1–17. [Google Scholar]
- Arnold, J.; Kremer, K.; Mayer, J. Scaffolding beim Forschenden Lernen. Eine empirische Untersuchung zur Wirkung von Lernunterstützungen [Scaffolding in inquiry-based learning. An empirical investigation of the effect of learning supports]. ZfDN-Zeitschrift Für Didaktik Der Naturwissenschaften 2017, 23, 21–37. [Google Scholar] [CrossRef]
- Hmelo-Silver, C. Problem-based learning: What and how do students learn? Educ. Psychol. Rev. 2004, 16, 235–266. [Google Scholar] [CrossRef]
- Bell, R.L.; Smetana, L.; Binns, I. Simplifying Inquiry Instruction. Sci. Teach. 2005, 72, 30–33. [Google Scholar]
- Schumacher, A. Forschendes Lernen im Chemieunterricht [Inquiry-based learning in chemistry education]. In Chemie Vermitteln. Fachdidaktische Grundlagen und Implikationen; Reiners, C.S., Ed.; Springer Spektrum: Berlin/Heidelberg, Germany, 2017; pp. 177–191. [Google Scholar]
- Affeldt, F.; Markic, S.; Eilks, I. Über die Nutzung abgestufter Lernhilfen beim forschenden Lernen [On the use of sequential scaffolds in inquiry-based learning]. Chem. Sch. 2019, 34, 17–21. [Google Scholar]
- Banchi, H.; Bell, R. The Many Levels of Inquiry. Sci. Child. 2008, 46, 26–29. [Google Scholar]
- Van Gog, T.; Hoogerheide, V.; Harsel, M. The Role of Mental Effort in Fostering Self-Regulated Learning with Problem-Solving Tasks. Educ. Psychol. Rev. 2020, 32, 1055–1072. [Google Scholar] [CrossRef]
- Van Gog, T.; Rummel, N.; Renkl, A. Learning how to solve problems by studying examples. In The Cambridge Handbook of Cognition and Education; Rawson, J.D.K., Ed.; Cambridge University Press: Cambridge, UK, 2019; pp. 183–208. [Google Scholar]
- Stäudel, L.; Franke-Braun, G.; Schmidt-Weigand, F. Komplexität erhalten—Auch in heterogenen Lerngruppen: Aufgaben mit gestuften Lernhilfen [Maintain complexity—Even in heterogeneous learning groups: Tasks with sequwntial scaffolding]. In CHEMKON: Forum für Unterricht und Didaktik; Wiley-VCH: Weinheim, Germany, 2007; Volume 14, pp. 115–122. [Google Scholar]
- Wieczorek, R.; Sommer, K. Strukturen nachweisen—Gestufte Lernhilfen und deren Einsatz bei eigenverantwortlichen Schülerexperimenten [Detecting structures—Sequential scaffolds and their use in independent student experiments]. Unterr. Chem. 2008, 19, 88–93. [Google Scholar]
- Renkl, A.; Atkinson, R.K. Structuring the transition from example study to problem solving in cognitive skills acquisition: A cognitive load perspective. Educ. Psychol. 2003, 38, 15–22. [Google Scholar] [CrossRef]
- van Harsel, M.; Hoogerheide, V.; Verkoeijen, P.; van Gog, T. Examples, practice problems, or both? Effects on motivation and learning in shorter and longer sequences. Appl. Cogn. Psychol. 2020, 34, 793–812. [Google Scholar] [CrossRef]
- Van Merriënboer, J.J.G. Training Complex Cognitive Skills: A Four-Component Instructional Design Model for Technical Training; Educational Technology Publications: Englewood Cliffs, NJ, USA, 1997. [Google Scholar]
- Foster, N.L.; Rawson, K.A.; Dunlosky, J. Self-regulated learning of principle-based concepts: Do students prefer worked examples, faded examples, or problem solving? Learn. Instr. 2018, 55, 124–138. [Google Scholar] [CrossRef]
- Azuma, R.T. A Survey of Augmented Reality. Teleoper. Virtual Environ. 1997, 6, 355–385. [Google Scholar] [CrossRef]
- Milgram, P.; Takemura, H.; Utsumi, A.; Kishino, F. Augmented Reality: A Class of Displays on the Reality-Virtuality Continuum. Telemanip. Telepresence Technol. 1994, 2351, 282–292. [Google Scholar] [CrossRef]
- Krug, M.; Czok, V.; Weitzel, H.; Müller, W.; Huwer, J. Gestaltungsparameter für Lehr-Lernszenarien mit Augmented-Reality-Anwendungen im naturwissenschaftlichen Unterricht—Ein Review [Design parameters for teaching-learning scenarios with augmented reality applications in science education—A review]. In Digitalisation in Chemistry—Digitales Lehren und Lernen an Hochschule und Schule im Fach Chemie; Graulich, N., Huwer, J., Banerji, A., Eds.; Waxmann: Münster, Germany; New York, NY, USA, 2021; pp. 51–57. [Google Scholar]
- Thyssen, C. Augmented Reality (AR) in der naturwissenschaftlichen Unterrichtspraxis [Augmented reality (AR) in science teaching practice]. In Lernprozesse mit Digitalen Werkzeugen Unterstützen; Meßinger-Koppelt, J., Schanze, S., Groß, J., Eds.; Joachim Herz Stiftung: Hamburg, Germany, 2017; pp. 177–191. [Google Scholar]
- Garzon, J.; Kinshuk; Baldiris, S.; Gutierrez, J.; Pavon, J. How do pedagogical approaches affect the impact of augmented reality on education? A meta-analysis and research synthesis. Educ. Res. Rev. 2020, 31, 100334. [Google Scholar] [CrossRef]
- Akçayır, M.; Akçayır, G. Advantages and challenges associated with augmented reality for education: A systematic review of the literature. Educ. Res. Rev. 2017, 20, 1–11. [Google Scholar] [CrossRef]
- Buchner, J.; Zumbach, J. Die Förderung von TPACK durch den Learning-Technology-by-Design-Ansatz [The Promotion of TPACK through the Learning-Technology-by-Design-Approach] In Neue Impulse in der Naturwissenschaftsdidaktik; Zumbach, J., Maresch, G., Fleischer, T., Strahl, A., Eds.; Waxmann: Münster, Germany; New York, NY, USA, 2020; Volume 8, p. 271-248. [Google Scholar]
- Huwer, J.; Lauer, L.; Seibert, J.; Thyssen, C.; Dorrenbacher-Ulrich, L.; Perels, F. Re-Experiencing Chemistry with Augmented Reality: New Possibilities for Individual Support. World J. Chem. Educ. 2018, 6, 212–217. [Google Scholar] [CrossRef]
- Probst, C.; Fetzer, D.; Lukas, S.; Huwer, J. Effekte von Augmented Reality (AR) zur Visualisierung eines dynamischen Teilchenmodells—Virtuelle Modelle zum Anfassen [Effects of Augmented Reality (AR) for the visualization of a dynamic particle model—Virtual models to touch]. Chemkon 2022, 29, 164–170. [Google Scholar] [CrossRef]
- Bolzer, M.; Strijbos, J.W.; Fischer, F. Inferring mindful cognitive-processing of peer-feedback via eye-tracking: Role of feedback-characteristics, fixation-durations and transitions. J. Comput. Assist. Learn. 2015, 31, 422–434. [Google Scholar] [CrossRef]
- Cullipher, S.; Hansen, S.J.R.; VandenPlas, J.R. Eye-Tracking as a Research Tool: An Introduction. In Eye-Tracking for the Chemistry Education Researcher; VandenPlas, J.R., Hansen, S.J.R., Cullipher, S., Eds.; American Chemical Society: Washington, DC, USA, 2018; pp. 1–9. [Google Scholar]
- Just, M.A.; Carpenter, P.A.A. A Theory of Reading: From Eye Fixations to Comprehension. Psychol. Rev. 1980, 87, 329–354. [Google Scholar] [CrossRef] [PubMed]
- Cullipher, S.; VandenPlas, J.R. Using Fixations to Measure Attention. In Eye-Tracking for the Chemistry Education Researcher; VandenPlas, J.R., Hansen, S.J.R., Cullipher, S., Eds.; American Chemical Society: Washington, DC, USA, 2018; pp. 53–72. [Google Scholar]
- Rodemer, M.; Eckhard, J.; Graulich, N.; Bernholt, S. Decoding Case Comparisons in Organic Chemistry: Eye-Tracking Students’ Visual Behavior. J. Chem. Educ. 2020, 97, 3530–3539. [Google Scholar] [CrossRef]
- Van Gog, T.; Paas, F.; Van Merrienboer, J.J.G. Uncovering Expertise-Related Differences in Troubleshooting Performance: Combining Eye Movement and Concurrent Verbal Protocols. Appl. Cogn. Psychol. 2005, 19, 205–221. [Google Scholar] [CrossRef]
- Holmqvist, K.; Nyström, M.; Andersson, R.; Dewhurst, R.; Jarodzka, H.; Van de Weijer, J. Eye-Tracking: A Comprehensive Guide to Methods and Measures; Oxford University Press: New York, NY, USA, 2011. [Google Scholar]
- Nehring, A.; Busch, S. Chemistry Demonstrations and Visual Attention: Does the Setup Matter? Evidence from a Double-Blinded Eye-Tracking Study. J. Chem. Educ. 2018, 95, 1724–1735. [Google Scholar] [CrossRef]
- Scheiter, K.; Eitel, A. The Use of Eye-Tracking as a Research and Instructional Tool in Multimedia Learning. In Eye-Tracking Technology Applications in Educational Research; Was, C., Sansosti, F., Morris, B., Eds.; IGI Global: Hershey, PA, USA, 2017; pp. 143–165. [Google Scholar]
- Blascheck, T.; Kurzhals, K.; Rascheke, M.; Burch, M.; Weiskopf, D.; Ertl, T. Vizualization of Eye Tracking Data: A Toxonomy and Survey. Comput. Graph. Forum 2017, 26, 260–284. [Google Scholar] [CrossRef]
- Blascheck, T.; Schweizer, M.; Beck, F.; Ertl, T. Visual Comparison of Eye Movement Patterns. Comput. Graph. Forum 2017, 36, 87–97. [Google Scholar] [CrossRef]
- Burch, M.; Timmermans, N. Sankeye: A Visualization Technique for AOI Transition. In Proceedings of the 2020 Symposium on Eye Tracking Research and Applications, Stuttgart, Germany, 2–5 June 2020; Volume 48, pp. 1–5. [Google Scholar]
- Fleischer, T.; Deibl, I.; Strahl, A.; Moser, S.; Maier, S.; Zumbach, J. EXBOX-Digital—Praxisorientiertes Unterrichtskonzept zum Einsatz digitaler Medien im Chemie- und Physikunterricht [Practice-oriented teaching concept for the use of digital media in chemistry and physics education]. In Neue Impulse in der Naturwissenschaftsdidaktik; Zumbach, J., Maresch, G., Fleischer, T., Strahl, A., Eds.; Waxmann: Münster, Germany; New York, NY, USA, 2020; Volume 8, pp. 211–223. [Google Scholar]
- Tobii Pro AB. Tobii Pro Glasses 2: Product Description, 1.95 ed.; Tobii Pro AB: Danderyd, Sweden, 2018. [Google Scholar]
- Tobii Pro AB. Tobii Pro Lab User Manual, 1.145 ed.; Tobii Pro AB: Danderyd, Sweden, 2014. [Google Scholar]


Disclaimer/Publisher’s Note: The statements, opinions and data contained in all publications are solely those of the individual author(s) and contributor(s) and not of MDPI and/or the editor(s). MDPI and/or the editor(s) disclaim responsibility for any injury to people or property resulting from any ideas, methods, instructions or products referred to in the content. |
© 2023 by the authors. Licensee MDPI, Basel, Switzerland. This article is an open access article distributed under the terms and conditions of the Creative Commons Attribution (CC BY) license (https://creativecommons.org/licenses/by/4.0/).