Article

Brain Science and Geographic Thinking: A Review and Research Agenda for K-3 Geography

Department of Geography, University of Minnesota, Minneapolis, MN 55455, USA
Educ. Sci. 2023, 13(12), 1199; https://doi.org/10.3390/educsci13121199
Submission received: 16 October 2023 / Revised: 16 November 2023 / Accepted: 21 November 2023 / Published: 29 November 2023
(This article belongs to the Special Issue Progress in Geography Education Research)

Abstract

:
How does a child learn to read a map? In 2007, the authors of an article in the Journal of Geography proposed a tentative list of eight “modes of spatial reasoning” that children may use to organize their perceptions of information on a map. As an update, this article has short descriptions of these modes, brief reviews of research since 2007, and some suggestions of topics for future investigation. This article includes a brief look at some implications for teaching math and reading, followed by an extended report about a classroom activity that underscores the main point about the parallel perception and processing of different kinds of spatial information. A technical appendix has a more detailed summary of the process used to identify and classify the modes of spatial reasoning.

How does a child learn to use a map? As noted in the title of a popular book about map use, the skill of using maps has three facets: reading, analysis, and interpretation [1]. Reading consists of perceiving colors, shapes, sizes, and other graphic symbols and figuring out what they represent. Analysis deals with enclosures, distances, directions, groups, sequences, and other spatial relationships among these symbols. Interpretation adds context by drawing on the map reader’s prior knowledge of the subject and considering the background, skill, and goals of the mapmaker. The focus of this article is on empirical research that mainly deals with the first two aspects: visual perception and spatial analysis.

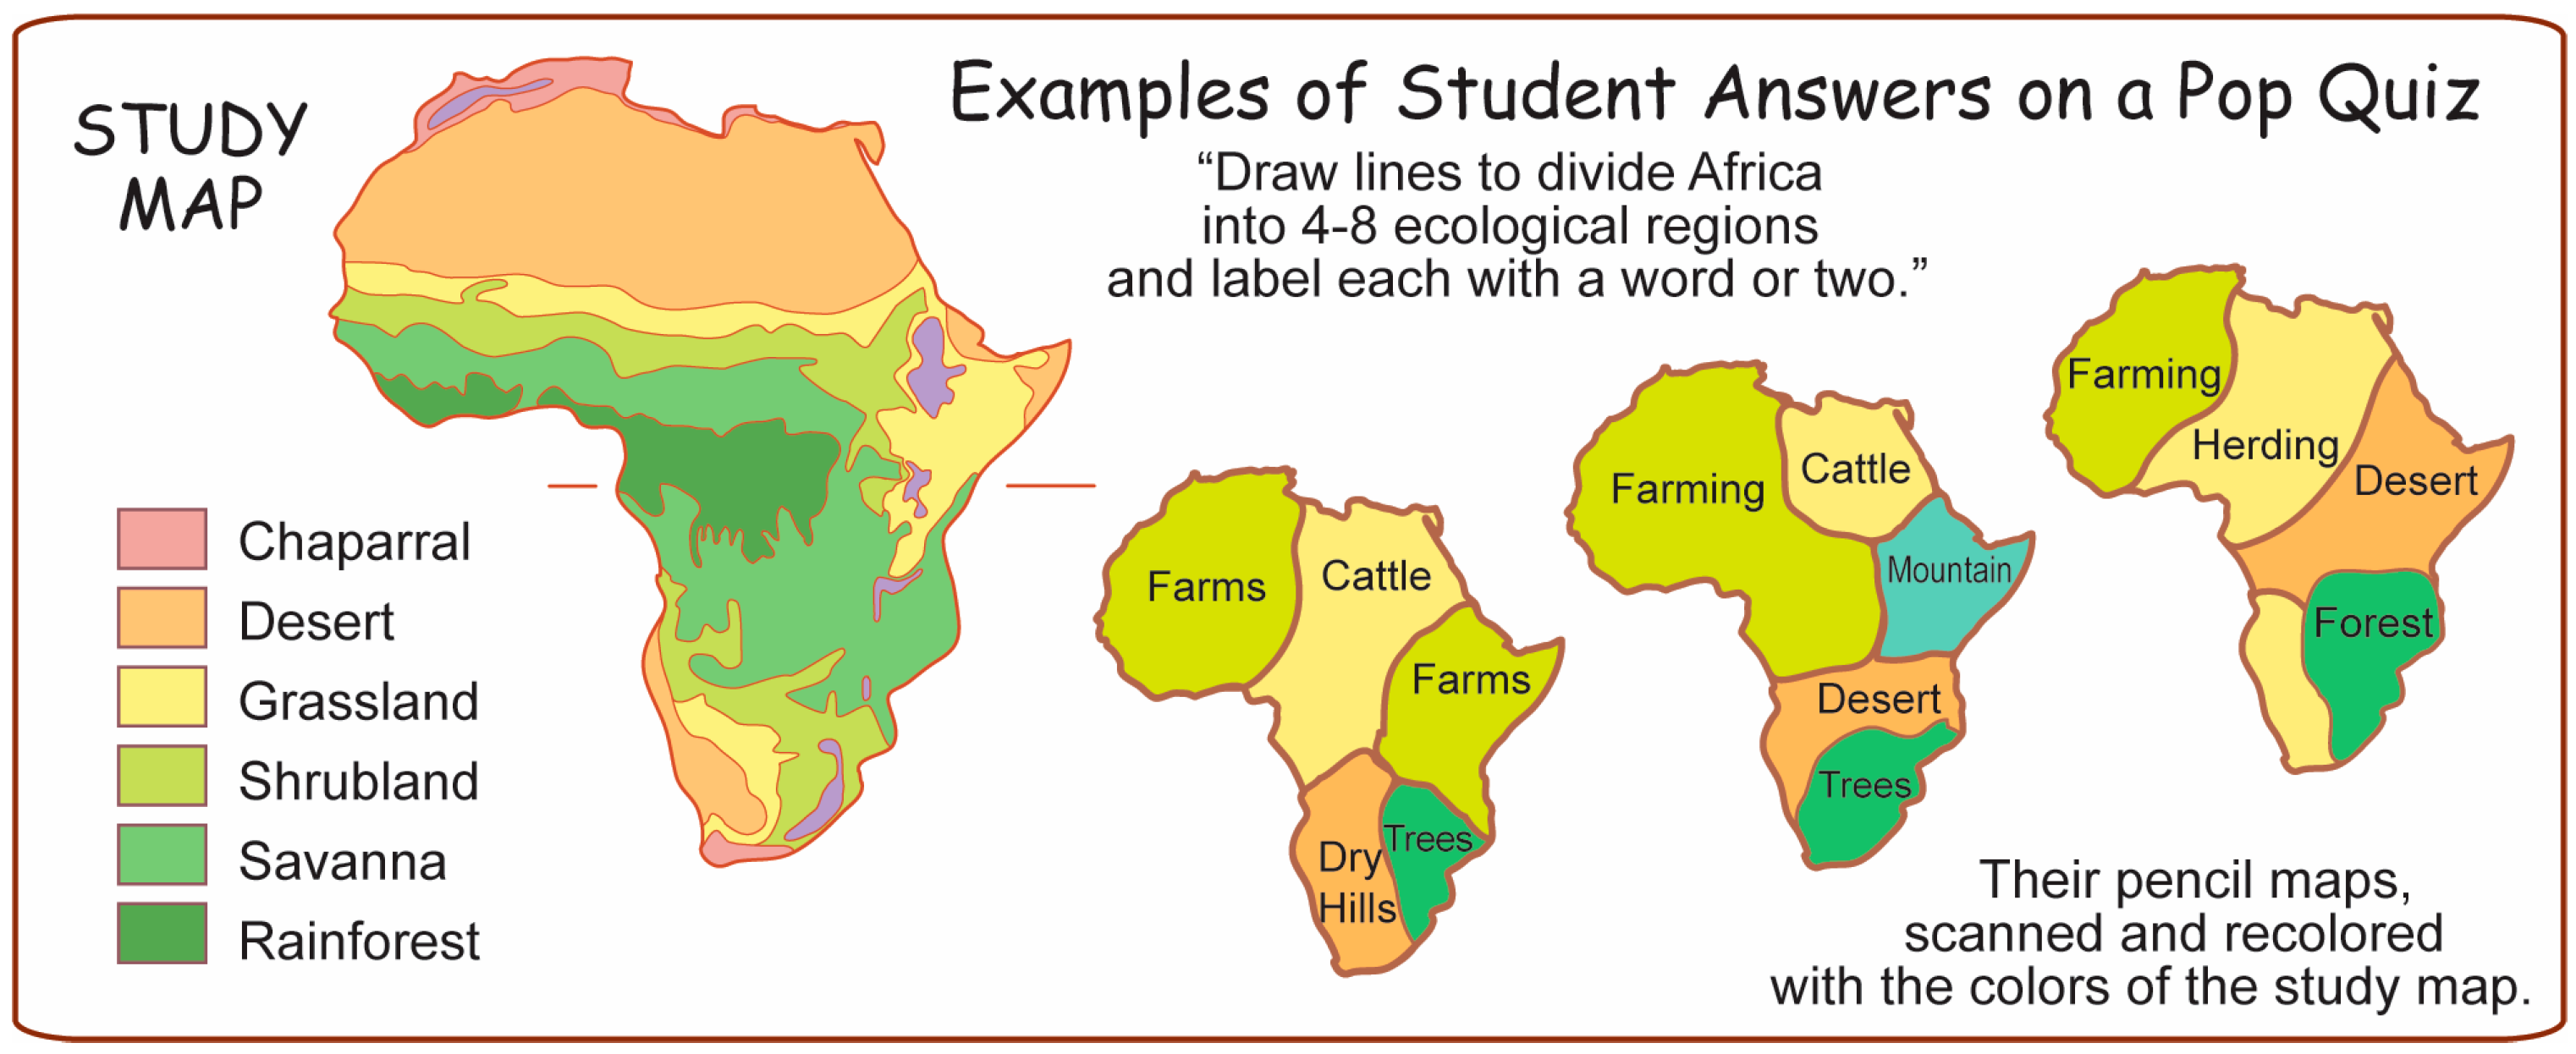
1. Visual Perception

As Robert Lloyd noted, skill in visual detection is essential for finding meaningful symbols in the clutter of information on a map [2,3]. In the late 1900s, Lloyd used a clock to measure the amount of time students used to find and identify specific symbols. Today, powerful technologies for eye tracking and brain scanning can help identify the brain networks that are active when people try to locate and identify a feature in a visual scene. In 2012 and 2013, teams of neuroscientists and cognitive psychologists conducted reviews of nearly 500 research studies about visual perception [4,5].
These reviews offer an important message for geography teachers: visual perception is not a straightforward process. People do not just “perceive” symbols on a map, “decode” them, and then “form a mental image” (as suggested by popular communication models in the mid-1900s, e.g., [6]. On the contrary, visual perception appears to involve a swarm of separate brain networks that deal with different aspects of a scene—colors, edges, textures, orientations, groups, quantities, distances, etc. These brain networks operate more or less independently and often at the same time [7,8,9,10,11,12].
Parallel processing of sensory information is a lifesaving way for a mobile animal to deal with a complex world. Consider the following scenario:
“Imagine that you are on a safari. The guide cautions you to beware of tigers hiding in the tall grass. Which visual features will you enhance or suppress in order to quickly detect a tiger?” [13].
One obvious problem is the fact that tigers can move, sometimes quite quickly. As a result, you may see one for only a fraction of a second. In fact, you are more likely to see only part of it, half a face, perhaps, or maybe just a paw among masses of leaves and branches. To help you survive (as an edible mammal!), your brain has to perform several tasks in a fraction of a second. It has to fill in the missing pieces, decide whether they are the right color and shape to be a tiger, see if it is moving toward you, identify protective barriers, and look for an escape route. It might take too long to carry out all these tasks one at a time.
One can illustrate this parallel processing to a group of teachers by flashing a partial image of a tiger for about four-tenths of a second during a presentation about some other topic. Then, one can finish their sentence, stop the presentation, and ask if anyone saw the flash and if they know what it was.
The answers I have observed in teacher workshops are illuminating. If the tiger’s face appears in an upper corner of the screen, typically only half of the people see the flash, and barely a quarter can identify the image as a tiger. Things are different if the image flashes in a lower corner of the screen. Nearly everyone sees it, and more than two-thirds can confidently say they saw a tiger. What accounts for this difference?

2. Visual Analysis

In the decade since the reviews described above, research has changed focus in a way that might help us understand the differences in tiger perception (and map reading). In the first years after the development of brain-scanning technologies, the focus was on the brain areas that process a visual image in relatively straight logical paths from eyeball input “up” via the visual cortex to a mental image. More recent researchers are paying more attention to other brain networks that can quickly evaluate specific parts of the image and send messages back “down” toward the primary visual areas in the back part of the brain. These top-down messages can help guide both eye movements and brain processing. This often-unconscious guidance, in turn, has complicated effects on what we consciously perceive. The whole process is staggeringly complex, as illustrated in summary articles from researchers with different perspectives [14,15,16,17,18,19,20,21,22,23,24,25]).
In the case of the tiger, the position of the flashing image on the screen is useful information. Because tigers do not fly, the brain is likely to ignore a tiger-colored flash near the top of the visual field. A flashed image in a lower position, however, might indeed be a tiger.
This rule, however, has a huge exception: the brain ignores the distinction between high and low positions if you are in a forest. Tigers can climb trees, and therefore, the context around the flash is also important. The brain has separate networks to deal with position and context [26,27,28,29,30,31,32].
These top-down messages about position and context help the visual system focus on things that might be important (like watching for a tiger). The unconscious processing of position and context is also important for geography teachers because, for better or worse, this is the visual system that students use to look at a map.
Here is a simple illustration: novice map readers soon learn to ignore blue areas on a map if they are searching for a city. They realize that mapmakers usually color oceans and lakes blue, and people seldom build cities in oceans and lakes. Expert map readers have acquired a much larger suite of context clues like these. They use these clues, often quite unconsciously, to get information more quickly from a map than a novice can. This difference underlies one key research question: at what age and with what kinds of activity can teachers help students gain expertise in using context on a map to guide eye movements and visual perception?
This basic question will reappear in many forms as we review research about different modes of spatial thinking. The first step is acknowledging that human brains process visual information via multiple and somewhat independent networks, which may develop differently in each individual. To this realization, add the fact that students bring different backgrounds to a map-reading task. Unique combinations of nature and nurture can predispose students to engage different brain networks, which, in turn, direct their eye movements to focus on different aspects of the map. As a result, different students remember the map differently (Figure 1).

3. Modes of Spatial Reasoning

In 2007, an article called “Spatial Thinking in Early Childhood” appeared in the Journal of Geography [33]. This article was a preliminary review of research about the neuroscience and psychology of spatial reasoning, especially as it applies to children using maps and other geographic representations.
Technical note: Scholars conduct research about spatial thinking in many disciplines, including neurobiology, vision science, psychology, linguistics, architecture, planning, robot engineering, and artificial intelligence, as well as geography, cartography, and geospatial information systems. Some of this research is greatly aided by new technologies for brain scanning and eye tracking. There is also a substantial body of research about spatial perception and reasoning by congenitally and late-blinded individuals. A review of this research is far beyond the scope of this paper, but one should note that it has provided insights that are also relevant for sighted individuals. Unfortunately, researchers in all these different disciplines often use different words for the same basic idea (or, even worse, they mean different things when they use the same words). This complicates the task of reviewing research and drawing conclusions.
Based on the research at the time, the Journal of Geography article described eight different ways in which a child’s brain could organize geographic information by engaging different brain networks. One important implication is that dissimilar brain networks could offer a reason for some individual differences in the classroom. Despite literally thousands of research studies since then, the basic list of eight modes of spatial reasoning still appears reasonably sound (see the Appendix A for a summary of the process used back in 2007 to identify neurologically distinct modes of spatial reasoning).
The following paragraphs have capsule descriptions of each of these modes of spatial reasoning. These feature a brief review of key research that has been performed since 2007, including some candidate topics for future inquiry (like an early-grade version of the GIS research agenda described by others [34,35,36]).
a. Comparison. The process of comparing sizes is not the first thing that happens in the visual brain, but it is a good place to start because it is neurologically the most distinctive. When people compare sizes or amounts, brain scans always show activation in a relatively small brain “valley” located behind and above the ear, primarily on the left side of the head. Brain cells around this fissure, called the intraparietal sulcus, become active when people make many kinds of quantitative comparisons, from the loudness of sounds to the numerosity, size, brightness, or color intensity of visual objects [37].
Why is this important? Because numerosity, size, brightness, and color intensity are visual variables that cartographers use to make maps of topics like crops, city population, temperature, or per-capita income [38].
The location and general role of this brain network were already fairly well understood back in 2007. Since then, however, there has been a simmering debate about the nature and even existence of a “mental number line” to support quantitative comparison. Many researchers (and there have been a lot of them) have explored the idea that brains have specific structures to represent magnitudes [39,40,41,42,43,44,45,46,47,48,49].
Amid all this controversy, there seems to be an early consensus that the mental processing of numbers is logarithmic—the perceived “distance” between small numbers like 3 and 4 is greater than the apparent spacing between higher numbers like 25 and 26 [50,51]. This helps explain why a circle with twice the area of another circle on a map does not look twice as big. For half a century, thoughtful cartographers have deliberately exaggerated the sizes of larger circles in order to maintain what they call “psychophysical” accuracy on maps that show quantities, such as the populations of cities or the amount of iron produced from different mines [52,53].
Using this same brain network to compare the brightness or intensity of colors, people can also easily tell the difference between small percentages of color on a map (say 10 vs. 20 percent), but they have a hard time seeing a difference between 80 and 90 percent of a given color. For this reason, thoughtful cartographers have chosen sequences of colors to fit this perceptual non-linearity [54,55].
In the internet age, with masses of static and interactive maps available online, one point is worth emphasizing to students: good cartographers carefully design symbols to compensate for these well-known visual effects, as well as for red–green “color blindness” and other common forms of visual impairment. Unfortunately, many self-taught internet mappers do not seem to be aware of these issues.
One important message for teachers, therefore, is that students need to be cautioned to read map legends carefully because many internet (and even some textbook) mapmakers do not always understand the basic principles of visual size or brightness comparison. The best way to promote this awareness is through well-designed map-making activities, preferably linked with inquiry about important environmental or economic issues. It also helps to trigger the comparison network in students’ brains by just casually mentioning size differences, like “on this satellite image, the tan area in northern Africa is a desert called the Sahara—As you can see, it’s at least three times as big as the green rainforest near the equator. The southern desert is called the Kalahari-how does its size compare to the rainforest area?”
Sample research questions: What insights from math educators could help geography teachers design better lessons (and vice versa)? How effective are different ways to “nudge” students to shift from a classificatory (qualitative) to a comparative (quantitative) mode of perception and analysis? What kinds of size comparison activities are likely to be most effective for students who come from different backgrounds? How should comparison activities be deployed for different topics, like deforestation, trade, crime, or voting? Note: Research questions about the effectiveness of specific student activities or nudging strategies will also be appropriate for every other mode of thinking in this article. So, on to the next one.
b. Region (Group). Of the eight modes of spatial thinking described in the 2007 article, the idea of region is the only one listed among the “Five Themes of Geography” that became popular in the late 20th century. There may be a good reason for this—A process similar to regionalization is usually the first thing that human brains perform when they start interpreting a visual image. This neurological priority makes sense because the visual system must decide whether a particular patch of light or color is a separate object before it is possible to name it, compare it with another one, see what it is inside or between, or describe its direction or distance from something.
Brains identify visual entities by grouping similar patches of color, texture, orientation, or brightness. Our visual systems effortlessly (and usually unconsciously) decide that these green specks are part of a tree, while those shiny blue areas are part of a car, and so forth. This grouping process, however, is still not well understood. As one research team wrote: “Across the natural world as well as the artificial worlds of maps, diagrams, and data visualizations, feature similarity (e.g., color and shape) links spatially separate areas into sets. Despite a century of study, it is yet unclear what mechanism underlies this gestalt similarity grouping” [quote from [56]; see also [57,58,59,60,61,62,63,64]].
One fact is important for teachers: the brain networks that identify trees or houses are the same ones that become engaged when a person groups a bunch of dots or similarly colored counties into a visual region on a map. The brain does this grouping only if the colors are similar enough and if the dots or color patches are close enough to each other. And this, in turn, is the core definition of a geographic region—A group of places that have something in common and are close to each other.
Mapmakers often do this grouping for the viewer by drawing a line around a group of similar places and painting the resulting area a distinctive color (as on the study map of African ecoregions in Figure 1). Students, however, need to learn that someone had to make decisions about similarity and closeness in order to make this kind of map. In other words, students need to realize that all maps of regions are human creations. The makers of these maps have to make specific decisions about regional boundaries in addition to the usual choices about what reference features to put in and what to leave out. A geography curriculum should, therefore, provide plenty of opportunities for students to work with raw data and make regional maps themselves, preferably of topics that are causally important.
If this sounds like an argument against teaching map skills with already-completed maps of “kid-friendly” topics like UFO sightings or soft-drink names, so be it. A better alternative is for students to make their own regional maps of topics that are important in other subjects they are studying in the same part of the school year. Then, they can make frequent use of these mental maps to help them interpret maps of other topics. This is the logic behind the creation of online “clickable” maps that allow users to select topics for display (e.g., http://textbooks.wmisd.org/GeographicBigIdeas.html accessed on 16 November 2023).
Sample research questions: Because the first topics for regional mapping in each school year are likely to be the most memorable, what specific topics can help build the most useful foundation for later inquiry in that class? (This question is likely to have different answers in states where the social studies standards for a particular grade level might mandate a focus on the state, the country, a hemisphere, or the world.) What is a plausible learning progression for map complexity, from simple maps that have well-defined visual regions to more complicated ones with multiple regions, fuzzy boundaries, and many outliers or inliers? How can classroom, playground, and local community maps be designed and used to support the skill of identifying regions as well as decoding specific symbols? What role could aerial photographs or satellite images play in this skill development?
Technical note: Unfortunately, a discussion of regionalizing as a grouping process is complicated by the fact that some geographers recognize many different kinds of regions, including formal regions (as described above), functional regions (places that are connected in some way), administrative regions (areas defined as regions by government or business), multi-factor regions (statistically similar places), and folk or vernacular regions (regions perceived as such by a group of people). Some geographers also talk about “subregions” within regions, “parallel regions” on other continents, or a “regional scale” between state and country. Meanwhile, teachers rightly complain that these complications are perplexing and hard to teach. In effect, a simple and powerful organizing tool has been turned into a confusing vocabulary exercise. We cannot solve this problem here except to urge teachers to be precise in their use of terms like “region” and so on to the next mode of spatial thinking.
c. Enclosure (Hierarchy, Inside-ness). Separate brain networks deal with the relationships between small features that are part of larger ones [65,66,67,68].
The simple geometric notion of “inside” is useful when talking about many geographic features, such as small watersheds inside of larger ones, counties inside states, store service areas inside larger warehouse service areas, and so on. Hierarchical thinking can help people trace water pollutants as they move downstream and are diluted by mixing with water from other tributaries in a larger watershed. Hierarchical thinking also helps students in civics classes debate whether specific kinds of problems should be handled by township, county, state, or federal governments—A political hierarchy of nested areas that was created specifically to address problems that present themselves at different scales. In short, it is both neurologically sound and geographically useful to treat the idea of enclosure and the resulting spatial hierarchies as a separate form of spatial reasoning.
Sample research questions: How many levels in a spatial hierarchy are appropriate for students making physical, economic, or political hierarchies in a specific grade (like first graders making a hierarchy of “all my insides” to describe their home address, as a room inside a house numbered ___, inside a street named ___, inside a town named ____, and on through state, country, continent, planet)? At what age (and in what context) is it appropriate to begin building a hierarchical mental map of the world, with important countries within continents and important cities within countries? What kinds of activities can help students begin to link current events with their developing world map?
d. Proximity (nearness, aura, influence area). Fifty years ago, a geographer named Waldo Tobler called proximity “the first law of geography”. He wrote, “everything is related to everything else, but near things are more related than distant things” [69].
As noted above, assessing the closeness of similar objects is part of the process of regional grouping [59]. Proximity, however, is also important when we are considering the relationship between things that are different rather than similar. For example, the analysis of proximity can help people assess how house values are affected by things like noisy airports, nice parks, smelly smokestacks, or nuclear reactors [70,71].
Proximity is also important in geopolitics—To understand any geopolitical situation in history or current events, students need to know what other countries are nearby. At a more personal scale, proximity is a consideration in selecting a site for a business, a destination for a trip, or even a place to live. Is this house or apartment close to stores, school, a favorite restaurant, or public transportation?
In a classroom, note that deliberately engaging a “proximity viewer” can also help students remember a map like the one about Africa. The key is to encourage the students to look at the map and name the plant cover that occurs close to another prominent feature, like the equator, the Nile River, or a Tropic line.
In short, Tobler made a good point: proximity (and the ability to discern it on a map) is indeed a crucially important concept in geography. It is as important as, but qualitatively different from, ideas like regional group or area hierarchy (and it uses a different, parallel brain network). A valid assessment of geographic proximity, however, is not just a matter of using the map scale to estimate or measure distance. A place that is connected by a good road is “closer” than a place on the far side of a high mountain or impassable swamp. Assessing the effect of barriers or avenues, however, usually involves engaging another brain network, one that makes a sequence of observations in order to look at how conditions change between two places. That is the next mode to be considered.
Sample research questions: What manipulables or kinesthetic activities can help students learn how to measure distance in a classroom or on the playground? What is an appropriate balance between individual exploration and step-by-step guidance in learning how to use different kinds of map-scale indications? What pair of locally significant landmarks or places can be suggested as a kind of distance indicator that students can use to give other distance statements a more concrete meaning? What inquiry activities can help students learn that factors like prevailing wind, land slope, or population density can cause the influence of something to extend farther in particular directions?
e. Spatial Sequence (transition). The nature of change from one place to another can often be described as a kind of slope, a physical slope in the case of a landform, or a mathematical slope of something more abstract, like annual rainfall, population density, or per-capita income. Describing a slope involves two reasoning skills: comparing and sequencing. To measure a hillslope, for example, a surveyor makes a sequence of observations along a line going uphill and then compares their elevation. The same mental procedure is used when skillful viewers look at maps of things like temperature, crop yield, or house value. The goal is to “see” the relative position of highs, lows, and gradients on the map, not just to obtain one fact, like the amount of rain at a specific place. To achieve this, viewers must force their eyes to look at a number of places along a line and then use their brains to draw a conclusion about how things change from one end of the line to another (like going north from the rainy equator to the dry Sahara in Africa).
Expert map readers use this skill quite frequently (often unconsciously), but novices often find it difficult. For this reason (and because graph reading is also a worthwhile skill), geography teachers could work with math teachers to use geographical examples when teaching about bar and line graphs. Students can learn to visualize the slope on a contour map by making a side profile or cross-section of the land. This visual aid is a graphic depiction of a sequence of elevation observations along a line. While it is true that modern GIS software can make a profile graph in microseconds, the ultimate goal is not just to see a particular profile; it is also to develop the skill to recognize a gradient without taking the time to make a graph.
Remembering a sequence of observations in proper order, however, is a complicated mental process. Many psychologists and neuroscientists have tried to figure out how people carry it out (and why some people have difficulty with it). Some analysts view it as a kind of temporal position-linking process, using a brain network on the lower right side of the head to build a separate memory of the measurement or observation that is associated with each position along a sequence. Other studies seem to conclude that sequencing engages a different brain network, including some parts of the frontal lobe. Moreover, organizing knowledge by association or sequencing can provide different perspectives on similar issues. For these reasons, it seems worthwhile to continue regarding spatial sequencing as a qualitatively different kind of reasoning from spatial association, the topic of the next section [72,73,74,75].
Technical note: Reviewing research about spatial sequences is complicated by the fact that some researchers use the phrase to describe a temporal sequence of different locations that are viewed in a specific order, like visually jumping around a clock face to look at (and remember) the 3, 8, 2, and 5 in that order. In geography, however, a spatial sequence has a spatial order, like the stops on a bus line or scenes along a path.
Sample research questions: What activities might help students see how the analysis of a spatial sequence in geography involves a kind of reasoning that is similar to number lines in mathematics, timelines in history, and even musical notation [76,77,78]? When asking students to arrange photos in order along a path, how many separate images constitute a reasonable challenge for students at a specific age? What age or other student characteristics might guide the use of two different strategies for building a mental map of the United States: a traditional puzzle approach, which involves looking at the shape of the state and trying to figure out where it fits on the map, or a spatial-sequence game that involves naming two states and asking for the name of the state that is between them? What kind of place-sequencing games or other activities might provide timely support for primary school teachers when they try to get beginning readers to process sequences of letters into words, words into phrases, and phrases into sentences [79]?
f. Spatial Association. To many neuroscientists and psychologists, a spatial association is simply an association of some fact with a location in space, like mentally associating the Eiffel Tower with a place called Paris. Meanwhile, geographers (especially GIS specialists) and many psychologists have a narrower definition: a spatial association is a pair of features that tend to occur together in many places–like peanut butter and jelly, caves and limestone, or mosquitoes and malaria [80,81]. At its extreme (i.e., with perfect correlation), “you do not see one without the other”.
Technical note: The concept of association is important in many disciplines, but unfortunately, they often use different words, including coincidence, conjunction, correlation, interdependence, joint probability, pairwise occurrence, and statistical regularity. This complicates the strategy of using keywords in a web search for research articles. Teachers in upper grades need to be aware of at least the possibility of these synonyms to ease confusion when students happen to encounter them in web searches.
The example of malaria shows why spatial associations are important in geographic inquiry. Comparing maps to see whether specific things often occur together is a very useful way to identify possible causes (and to rule out implausible ones, as in Figure 2). The notion of association can also help people remember the general positions of geographic regions. For example, a teacher could have briefly mentioned malaria and then projected a map of its occurrence to help students remember the general position of humid rainforests and floodplains in Africa [82].
Identifying spatial associations is a particular strength of the Geographic Information System (GIS). The ease of map overlaying and statistical comparison within a GIS has tempted some students (and even some GIS teachers) to see this as the main mode of spatial reasoning. To counter this temptation, teachers should remind students that spatial association is like region, sequence, enclosure, or analogy—it is just one of several different ways of organizing and analyzing geographic information.
Sample research questions: What in-home, in-school, or in-community pairs of things might serve as useful examples of spatial associations for students in rural, suburban, or urban environments? What features do students associate with specific kinds of places in their home community or state (like gas stations with freeway exits, stoplights with busy streets, or law offices with courthouses)? What topic has the most “predictive power” (the largest number of meaningful spatial associations) to help students remember the geography of other features within a given area? For example, what feature in your state is as useful as knowing the latitude in Africa, the length of growing season in Michigan, or the elevation in Colorado)? Could this preferred state feature be different for students in different grades or in the context of different inquiries?
g. Spatial Pattern (arrangement, shape). The definition is simple: a spatial pattern is a non-random arrangement of things. Human brains “naturally” try to see faces or other patterns when they look at things like clouds, rocks, boxes, chessboards, graphs, or maps [83,84]. When people are instructed to study a map and look for patterns, they often start by noticing obvious imbalances within an area, like “the copper mines are mostly in the western part of the continent”. With practice, they learn how to discern and describe other kinds of spatial patterns—clusters, alignments, rings, wavelike patterns, and so forth.
Unfortunately, “pattern” is another word, like region, that has a number of different meanings, from drum sequences and dance moves to chemical bonds and snowflake shapes. When describing a map, people sometimes use “pattern” in ways that overlap with the ideas of region, association, hierarchy, or sequence [85]. Meanwhile, research by vision scientists may justify treating things like balances, alignments, waves, and symmetries as separate ways of organizing geographic information. The neural processes are complex, and evidence for clearly separate brain networks is still inconclusive despite a lot of ongoing and often very specific research [86].
At this time, it may be safer to err on the side of caution and continue to use the term “spatial pattern” to describe any non-random spatial arrangement of things. It is more important for teachers and students to realize that the ability to recognize and describe patterns, shapes, and symmetries on a map is a cumulative skill. As people learn more about the world, they become able to see and name more different kinds of patterns on maps.
The rationale for searching for map patterns is simple—when things are arranged in a non-random way, there usually is a cause. For example, when a map shows several earthquake epicenters arranged in a line, geologists infer the presence of a linear fault in the rocks there. When robberies occur in a few clusters on a street map of a city, crime investigators want to know who lives there and whether there is something about the area that makes robbery attractive as a “career choice”. When half a dozen capitals of ancient African empires occur in a narrow band between 14 and 16 degrees north latitude, it might be worthwhile to inquire about the environment there, like what animals can be hunted there, what crops can be grown in that rainfall belt, what trade routes go there, or what diseases do not occur there. In short, when people see a non-random pattern on a map, they often try to form hypotheses about causes. An important part of geographic analysis is the three-part process of harnessing this instinctive pattern-seeking activity, learning the words that, over time, have become conventional names for specific patterns, and channeling the results into a rigorous inquiry into possible causes.
Sample research questions: What guidelines can help geography teachers choose effective local examples to illustrate different kinds of spatial patterns, e.g., lines, rings, clusters, etc.? What desktop manipulables are effective in engaging students in the process of creating and naming spatial patterns? How can specific words about spatial patterns help students discriminate letter shapes when learning to read? (See [87] for a discussion of research about the neuroscience of visual symmetry as a particular kind of spatial pattern and its application in teaching students how to read.)
h. Spatial analogy. Like a verbal or mathematical analogy, a spatial analogy is easier to illustrate than to define in a simple way. For this reason, teachers need to find good local examples so that prior knowledge of facts can help students to concentrate on the spatial relationship. In Michigan, for example, an effective example is an analogy about lake-effect snow. Even very young children know that places that are close to Lake Michigan tend to get more snow than places in a different position in the lower peninsula. To extend the prior knowledge of students, a Michigan teacher can make a simple spatial analogy, like “Buffalo, New York, is to Lake Erie as Muskegon is to Lake Michigan. Both cities are east of a large body of water in an area where the wind usually blows from west to east, and the similarity of their positions gives both cities a well-deserved reputation as a very snowy place”. In Nevada, with its swarm of separate mountain ranges, one might point to the similarity of vegetation at the same elevation on different ranges. Growers of wine grapes note that the desirable climate of France, with mild, rainy winters and hot, dry summers, is also found in analogous locations in California, Chile, and Australia. Meanwhile, urban geographers note that a gentrifying old warehouse district between the central business district and an old railyard in Lincoln, Nebraska, is analogous to similar areas in many other cities. This knowledge is useful to realtors and entrepreneurs because areas like this have become trendy residential districts for graphic artists and other young professionals in many cities. As a result, they are also good locations for “experimental” restaurants and microbreweries. In short, a spatial analogy is a structured comparison of something that can be observed in similar positions in two different cities, mountains, watersheds, continents, or other areas. Reasoning with spatial analogies engages brain networks that are different from those used in outlining regions or looking at spatial hierarchies, sequences, associations, or patterns. Analogic reasoning, therefore, can provide a different perspective on many practical questions.
In a more abstract sense, a map is a spatial analogy [88]. A place that is east of a lake in real life is portrayed as east of the lake on the map. Likewise, a feature that is between a central business district and a railyard on a map has the same position in the sequence of places in the real world. In short, a map symbol does not just identify something and show where it is located but also lets the reader see what is close to it, east of it, uphill from it, connected by a road, and so on. Once students grasp this idea, the map becomes a vastly more powerful tool for investigating other relationships in the world [89]. This use of analogy in learning, in turn, appears to have an influence on brain connections and, thus, on future perception [90,91,92,93].
Sample research questions: What familiar objects can be cited as illustrations of analogous positions (like the front, side, and back of a person’s head or of a bicycle, car, or house)? What local examples can ease the transition to a more abstract understanding of the idea of structural alignment, the key concept in constructing or interpreting a spatial analogy? What clues should a teacher provide in order to guide students in choosing a place that is spatially analogous to their school or home community (i.e., “in a similar position in another state or country”)?
Unfortunately, some language arts curricula treat analogies and metaphors as advanced topics to be taught in later grades. For example, the Common Core first introduced the idea of analogy as a rhetorical device in 11th grade. This is at least ten years after the age when human brains start performing this kind of reasoning [94,95,96,97].
This observation about a mismatch between developmental psychology and curriculum design leads us to a closer (but very brief) look at other links between spatial thinking, reading, and math.

4. Spatial Thinking, Language Arts, and Mathematics

A focus on spatial analogies, sequences, patterns, and other spatial relationships on maps can be a good way for geography lessons to support instruction in both language arts and mathematics. The simplest analogical fact about a map is the idea that a square near a line on a map can represent a desk near a wall in the room. A well-designed classroom mapping activity, therefore, can help some pre-school students get over the hurdle of realizing that a shape like “3” can represent a number of blocks or paperclips, and a shape like “M” can represent the sound you make by humming with your lips closed [98].
The curricular links go far beyond this simple notion of symbolic representation, however, because there is considerable evidence that children use spatial cues to help form and organize their mental representations of both letters and numbers [99,100,101,102,103,104,105,106,107,108,109].
In short, providing engaging illustrations of the idea of symbolic representation offers a good first reason for teaching map skills in primary school. Map instruction also gives teachers a richer vocabulary and a wider range of examples for other troublesome aspects of math and language arts. As neuroscientist Stanislas Dehaene wrote in an important research summary:
“Visuospatial attention is of paramount importance to the normal development of reading. Good decoding skills do not arise from associations between letter [shapes] and speech sound alone–letters must also be perceived in their proper orientation, at the appropriate spatial location, and in their correct left-right order. In the young reader’s brain, collaboration must take place between the ventral visual pathway, which recognizes the identity of letters and words, and the dorsal pathway, which codes for their location in space and programs eye movements and attention. When any one of these actors stumbles, reading falls flat on its face”.
S. Dehaene, Reading in the Brain, p. 298, emphasis mine [110].
When students are guided to think about location, orientation, left–right order, and other spatial relationships in making and interpreting maps of their desks, classrooms, and playgrounds, they are using some of the same skills (and brain networks) that they employ to recognize the following:
-
The difference between a written “b” and “d” (or “n” and “u”) is the direction it faces;
-
The difference between “tar”, “art”, and “rat” is the spatial sequence of the letters;
-
Proximity helps clarify what “white” modifies in a phrase like “White House lawn”;
-
Prepositions are spatially close to and logically associated with nouns, not verbs;
-
Spatial transitions can offer concrete examples that can illustrate different kinds of abstract mathematical gradients on graphs;
-
Spatial frameworks can be useful in organizing some kinds of writing (and making sense out of reading some kinds of texts).
As a logical framework for organizing text, the Common Core mentions causal and chronological themes but fails to note spatial themes. These include place comparisons, panoramic surveys, point-to-point walkthroughs, scale-changing zoom-ins or -outs, and analogies with other places. For many topics, a spatial organizing theme can help writers create more effective prose. Spatial frameworks can also help readers organize ideas as they read some kinds of text [78,111,112].
Exploring these links between spatial thinking, reading, and math, however, is much too broad a task for this brief review of spatial thinking research. Space also precludes any consideration of the uses of spatial thinking in other disciplines, such as history, economics, or earth science [113]. Let us, therefore, consider a summarizing example from a primary school classroom before concluding this article.

5. An Example from a Primary School

For several days, the children in an eight-room K-1 school in Harlem, New York, had been adding details to a model of their classroom. Each classroom model started as a big open-top box with drawings of the classroom windows taped to one inside wall of the box. One of the first tasks for the students was to “turn the model so that it lines up with our room”. This simple but important activity reinforced the idea of representation and helped the children take ownership of the model.
Over the next few days, the students added pieces of colored paper to the walls of the model to represent the door, the green board, the clock, and other things attached to the walls in the classroom. Then, teachers taped big letters (N, E, S, and W) on the appropriate walls, and students used small letters to name the corresponding walls in their model. Teachers could then use those direction names in games and other classroom activities (like “line up near the west wall so we can walk to the cafeteria”).
Then came “rug-in-the-model day”. Each classroom had a large, colorful rug where the children sat for story time. The teachers had already used the rug to illustrate some geographic ideas. For example, “Last week we colored the flower between the M and the O on our map of the rug. Now that we have named the walls in our room, let’s turn our rug maps to fit the room and then color the flower in the southeast corner of our map of the rug”.
On the rug-in-the-model day, the teacher held up a drawing of the rug at an appropriate scale and asked groups of students to put the rug symbol “where it should go in the model of our classroom”. Observers described this as a high-interest activity in every classroom. Students vied for the privilege of being in the group to place the model rug into the box. In room after room, however, students approached the model classroom and placed the rug right in the middle, in some cases, high-fiving each other and grinning about a job well done.
Several teachers noted this and learned how to phrase a very important follow-up question: “Good job! But is the rug really in the middle, or is it closer to the windows? or maybe near the corner by the greenboard?”
Hearing this, the same students went back to the box and pushed the model rug closer to the wall or corner to match where it was in their room. One observer commented that she could almost hear their minds click to another track as they switched from an enclosure perspective (“it’s inside the room”) to a more complicated and accurate proximity perspective (“it’s closer to the greenboard wall”). Neuroscience research tells us that the brains of these students were already performing several kinds of spatial thinking. The follow-up question helped these young students access more of these parallel ways of thinking about the geography of their classroom [114].
In short, timely teacher prompts can push students to use different modes of spatial reasoning. This suggests another category of research questions (which can be asked about the Africa map in Figure 1):
What prompt could push students to refine a simple hierarchical notion—“The Sahara is a dry area inside Africa”—and replace it with a more nuanced proximity idea—“The Sahara is near the north shore of Africa”—or a spatial association and inferred cause idea—“The Sahara is caused by upper-air sinking down near the Tropic line”—or a sequence/transition idea—“rainfall is high around the equator, where the rainforest is, but it decreases to a low near the Tropic of Cancer, where the Sahara is”?—or a causal extension via analogy—“The Sahara is a vast desert in northern Africa, formed by the same process that made smaller deserts at similar latitudes on other continents”.
Better still, we should not wait until high school to teach about environments in Africa. Teachers could read aloud about camels in first grade. (Kids like these ungainly animals, especially after viewing videos that show how camels chew sideways, slobber a lot, and sound like Chewbacca). Then, teachers will pass out a simple map like the leftmost one in Figure 3 and have students draw a line around “the area where camels like to live”. Teachers should have kids color that area, call it the camel region, and then describe its shape and position in words. If children do this in first grade, they will start to build a mental map of Africa. This map, in turn, can help them interpret and remember other maps in future classes: deserts in earth science, Arabic language in human geography, Islam in world history, and desertification in current events. In short, the students have not only learned how to learn from maps, but they have also added a useful mental map that can help to interpret other maps in the future.
Final sample research question: What primary school map activities can provide strong foundations of map-reading skills and factual knowledge for advanced inquiry in economics, political science, history, or environmental science, as well as geography? This is, indeed, a loaded question, but it is one that geographers must answer in order to justify their place in changing school curricula.

6. Conclusions

This update is based on a review of more than 2700 relevant research studies that were published since the widely cited 2007 Journal of Geography paper about spatial thinking by young children. The main conclusion is that ongoing research continues to support the recognition of several (at least seven or eight?) different ways of organizing geographic information perceived on maps. Like the initial aspects of perception in the primary visual cortex, these modes of spatial thinking engage different brain networks. Some of these networks operate in parallel, often at the same time, but a person may be consciously aware of only one at a time.
Some topics are clearly easier to analyze using specific modes of spatial reasoning. Examples include regions for languages, hierarchies for government, gradients for precipitation or population density, analogies for climates or gentrifying neighborhoods, associations for diseases, and so forth. Many topics, however, can be viewed in several different ways. Snowfall in western Michigan, for example, can be seen as an aura of Lake Michigan, a region of heavy snow, an unbalanced spatial pattern of snow in the Lower Peninsula, a spatial sequence of declining snow depths as you go across the peninsula from west to east, or (as noted earlier) a spatial analogy to Buffalo, New York. A similar list can be crafted for many other topics, from earthquakes in California to trendy restaurants in urban areas. Especially important for teachers is the fact that different people seem to “naturally” prefer using different modes of thinking when looking at a map. Whether it occurs as a result of genetics or experience, this fact helps us understand why different people can see different things when they look at the same map. These differences also make it extremely difficult (if not impossible) to design a student activity or test question that reliably engages the same mode of reasoning in every user. This complication should be considered by geographers doing research on spatial thinking [115,116].
To complicate things even more, people are likely to access different brain networks during different phases of thinking about a visual image, or even something as straightforward as a math problem [117].
The good news is that every student can learn how to do every mode of spatial reasoning better. Uttal and his colleagues offer a comprehensive review, although with a focus mainly on “personal-space” topics such as wayfinding and mental rotation [118].
The not-so-good news is that teachers who routinely phrase questions that fit their own preferred mode(s) of thinking about spatial relationships may be discriminating against students who may tend to access other modes first. Teachers are people who deal with representational symbols for a living. As a result, most teachers have learned to be relatively skillful at switching from one mode of spatial, temporal, or causal reasoning to another. It is vitally important to remember that many students are just acquiring these skills. For this reason, teachers should observe how students are looking at a map and then nudge them to try other ways of “seeing” it. Many of the suggestions for future research deal with assessing the effectiveness of different ways to help students learn how to employ each mode of spatial reasoning.
A final bit of good news for teachers is that the ability to get information from a map increases as students learn to use different modes of spatial reasoning. In short, learning how to think spatially is a form of learning how to learn, and it can also help with math and language instruction, even in pre-school [119].

Funding

This research received no external funding.

Institutional Review Board Statement

Not applicable.

Informed Consent Statement

Not applicable.

Data Availability Statement

No new data were created or analyzed in this study. Data sharing is not applicable to this article.

Conflicts of Interest

The author declares no conflict of interest.

Appendix A. Technical Note about How We Know Where in the Brain We Think about Something

It is often said that the human brain is the most complex object of its size anywhere in the universe.
Studying the human brain was really difficult a hundred years ago. Investigators could analyze animal brains, but they could not be sure that the results would apply to humans. An alternative was to find people whose brains were damaged by accidents, battle wounds, or strokes, and try to measure what those people were no longer able to do. Then, X-ray detectors were invented, but the brain images they could provide were quite crude, and not without risk.
Then, in the late 20th century, inventors developed several technologies for observing or inactivating specific parts of living brains. These tools include Electroencephalography (EEG), Positron Emission Tomography (PET), Functional Magnetic Resonance Imaging (fMRI), Transcranial Magnetic Stimulation (TCMS), and Transcranial Direct Current Stimulation (tDCS). The first three are passive technologies–they just record the parts of the brain that become active under specific conditions, like when people do particular tasks. EEG and PET make almost instantaneous measures but are not very accurate spatially; fMRI can be spatially precise but is temporally vague. TCMS is different—It is an active technology, which can temporarily “turn off” a small brain area without lasting effects.
These technologies did not become safe enough (and cheap enough!) to use in research until near the end of the 20th century. Almost immediately, researchers in hundreds of universities and other labs around the world began to apply the new technologies to problems they were already studying. One result was a flood of publications about the brain areas that became active under certain conditions.
The next event is a personal coincidence, with two parts. One part was the fact that I had to stand in a crowded New York subway train at least a dozen times every week from 2004 through 2009. Computers and phones do not work there, conversation is difficult, and writing or dictation is impossible. In short, it was hard to do almost anything that might be useful, except read. And, because page-turning is awkward when you are standing in a crowded and randomly swaying train, it is actually better if the text is complicated and just one page can occupy attention for the whole time between stops.
The second part of the coincidence was an electronic library that allowed easy downloading of current articles from hundreds of research journals–easy to print for reading while standing in a crowded subway car.
One result of this coincidence was a rapid accumulation of illustrations and key quotations from thousands of research reports about the psychology and neuroscience of spatial thinking.
After reading the first few hundred of these research reports, it became obvious that human brains seemed to have specific areas that became engaged when people did particular kinds of thinking. Injuries or damage to these brain areas often cause significant problems in doing specific tasks, like catching a ball, recognizing a face, reading a text, or calculating a sum.
This raised a question: have researchers identified specific brain areas that became active when people think about different kinds of spatial relationships–like position inside an area, proximity to a landmark, sequences of scenes along a route, or similar places on other continents?
The next step was to try to sort the research reports into categories–groups of studies that deal with clearly different ways of thinking about the spatial relationship between places. This task was made more difficult by two simple facts. One fact is that research about spatial reasoning was being done in many different disciplines, including neuroscience, developmental psychology, vision science, linguistics, architecture, robot engineering, and artificial intelligence, in addition to geography and geographic information systems. The second fact is that researchers in different disciplines used different tests, with different tools, and often used different words for similar ideas (or, worse, the same words for different ideas). Over the next few years, an initial list of six “modes of spatial thinking” became nine, then eleven [120]. Then, we reduced the number to eight in the Journal of Geography article that is being updated here [33].
Because the research was often confusing, and sometimes contradictory, it seemed wise to adopt a fairly stiff multi-criteria method for identifying brain areas that seemed to be associated with particular kinds of spatial thinking. After some discussion with colleagues, this is the rule we chose: we will call a part of the brain “essential” for a particular kind of spatial thinking ONLY if it has been identified as such in at least three studies from different labs, using different tools. At least one passive brain scan (either PET or fMRI) must clearly identify the area as engaged when people do that kind of thinking. In addition, at least one lesion or TCMS study must show that people are less able to do that kind of thinking if that part of the brain is damaged or inactivated. Using those criteria, we suggested that brain researchers had identified separate brain networks that support at least eight different and somewhat independent modes of spatial thinking–neurologically distinct ways to perceive and organize spatial information from maps or graphs.
Meanwhile, other scholars have proposed other lists of spatial thinking skills, and several have criticized our tentative list of eight modes. The criticisms are in two main groups–statistical studies and dismissals.
Examples of dismissals include blunt assertions that the list is “naïve”, “misguided”, or is an example of “new phrenology”. Here, it is probably wise just to acknowledge that this kind of criticism is not rare. It can be deeply counter-productive because it tends to close the discussion, but in the end, I agree with MIT neuroscientist Nancy Kanwisher, who wrote “The approach to neuroimaging in which cognitive functions are assigned to [specific] brain regions has been widely maligned as ‘mere phrenology,’ as if the label itself is an argument against the whole enterprise. But name-calling is not argumentation any more in science than in the schoolyard” [121]. In short, dismissals sting, but they are best ignored until they are supported by actual evidence.
Statistical critiques seem more scientific, and therefore they deserve more attention. Most of them used some form of factor analysis to analyze participant responses to a battery of test questions [115]. Although I was part of a research team that did factor-analytic studies of urban areas back in the 1970s, I make no claim to be a statistician. One can, however, note when the bibliography in a publication does not mention any of the books or review articles about the use of factor analysis in either psychology or neuroscience-like the widely cited 800+ page tome by J.B. Carroll entitled Human Cognitive Abilities: A Survey of Factor Analytic Studies [122]. I admit that I have not read every page of this book or even one-tenth of the more than 1400 references in its bibliography. But several chapters and a couple dozen cited articles did seem relevant and, therefore, worth reading, even before the critical articles were published. Re-reading them raised questions about the way that factor analysis was applied.
A much more serious problem is the apparent failure to appreciate the complexity of the human visual system, which has multiple parallel networks and memory systems that “see” different parts of a visual image and often function without conscious awareness. This complexity makes it difficult, if not impossible, to design a test question or prompt that reliably engages the same network in every viewer’s brain. This fact, in turn, is likely to make any factor analysis of spatial-thinking test results unreliable, even if it was done with proper methods.
Since publishing the tentative list of spatial-thinking modes in 2007, I have summarized the main results of more than 2700 new research studies, with the goal of making these summaries available online. This additional reading has added substantial support to the conclusion that human brains have separate networks that process spatial information in specific ways. This neurological fact is pedagogically important because the parallel and often unconscious operation of at least partially independent brain networks could be responsible for individual differences in the ability to do some spatial tasks, like finding locations, giving directions, or reading maps.
Somewhat surprisingly, the tentative list of eight modes that was suggested in 2007 is still useful, with four modifications. First, it would be useful to recognize two different kinds of comparison, qualitative and quantitative [123]. Second, it might be better to use the word enclosure to label the idea that was called hierarchy in 2007. This is the idea that small places can be perceived, described, and remembered as being inside of larger areas. Third, it might be desirable to divide the complex concept of spatial pattern into several subcomponents, using some mix of alignment, curvature, orientation, clustering, dispersion, several kinds of symmetry, and a notion of shape. These basic spatial relationships are all processed in the primary visual cortex in the back part of the human brain, with slightly different but occasionally overlapping parallel structures (as described in the section about spatial patterns). Finally, thinking about a spatial analogy apparently engages a much more complex brain network than the other modes. As a result of this complexity, the way that a person uses analogical reasoning seems to be even more dependent on exactly how a task or question is presented. At the same time, the use of spatial analogy is an extraordinarily powerful mode of geographic reasoning. Its neural complexity should not be used as an excuse to exclude it from the curriculum at any grade level; the challenge is to present it in grade-appropriate ways, with grade-level topics.
With these modifications, it still seems appropriate to recognize that reading a map could involve (at least) eight different ways of perceiving and organizing spatial relationships. I submit that this way of looking at map reading is both scientifically sound and very useful in teaching geography.

References

  1. Kimerling, A.J.; Muehrcke, P.C.; Muehrcke, J.O.; Muehrcke, P.M. Map Use: Reading, Analysis, Interpretation, 8th ed.ESRI Press Academic: Redlands, CA, USA, 2016. [Google Scholar]
  2. Lloyd, R. Attention on maps. Cartogr. Perspect. 2005, 52, 28–57. [Google Scholar] [CrossRef]
  3. Lloyd, R. Visual search processes used in map reading. Cartographica 1997, 34, 11–32. [Google Scholar] [CrossRef]
  4. DiCarlo, J.J.; Zoccolan, D.; Rust, N.C. How does the brain solve visual object recognition? Neuron 2012, 73, 415–434. [Google Scholar] [CrossRef]
  5. Kravitz, D.J.; Saleem, K.S.; Baker, C.I.; Ungerleider, L.G.; Mishkin, M. The ventral visual pathway: An expanded neural framework for the processing of object quality. Trends Cogn. Sci. 2013, 17, 26–49. [Google Scholar] [CrossRef]
  6. Koláčný, A. Cartographic information—A fundamental concept and term in modern cartography. Cartogr. J. 1969, 6, 47–49. [Google Scholar] [CrossRef]
  7. Luck, S.J.; Hollingworth, A. Visual Memory; Oxford University Press: New York, NY, USA, 2008. [Google Scholar]
  8. Vinberg, J.; Grill-Spector, K. Representation of shapes, edges, and surfaces across multiple cues in the human visual cortex. J. Neurophysiol. 2008, 99, 1380–1393. [Google Scholar] [CrossRef]
  9. Cavina-Pratasi, C.; Kentridge, R.W.; Heywood, C.A.; Milner, A.D. Separate channels for processing form, texture, and color: Evidence from fMRI adaptation and visual object agnosia. Cereb. Cortex 2010, 20, 2819–2832. [Google Scholar] [CrossRef]
  10. Shigihara, Y.; Zeki, S. Parallel processing in the brain’s visual form system: An fMRI study. Front. Hum. Neurosci. 2013, 8, 506–514. [Google Scholar] [CrossRef]
  11. Silson, E.H.; McKeefry, D.J.; Rodgers, J.; Gouws, A.D.; Hymers, M.; Morland, A.B. Specialized and independent processing of orientation and shape in visual field maps LO1 and LO2. Nat. Neurosci. 2013, 16, 267–271. [Google Scholar] [CrossRef]
  12. Buetti, S.; Cronin, D.A.; Madison, A.M.; Wang, Z.; Lleras, A. Towards a better understanding of parallel visual processing in human vision. J. Exp. Psychol. Gen. 2016, 145, 672–707. [Google Scholar]
  13. Navalpakkam, V.; Itti, L. Search goal tunes visual features optimally. Neuron 2007, 53, 605–617. [Google Scholar] [CrossRef]
  14. Lauritzen, T.Z.; D’Esposite, M.; Heeger, D.J.; Silver, M.A. Top–down flow of visual spatial attention signals from parietal to occipital cortex. J. Vis. 2009, 9, 18. [Google Scholar] [CrossRef]
  15. Shomstein, S.; Lee, J.; Behrmann, M. Top-down and bottom-up attentional guidance: Investigating the role of the dorsal and ventral parietal cortices. Exp. Brain Res. 2010, 206, 197–208. [Google Scholar] [CrossRef]
  16. Wen, X.; Liu, Y.; Yao, L.; Ding, M. Top-down regulation of default mode activity in visual spatial attention. J. Neurosci. 2013, 33, 6444–6453. [Google Scholar] [CrossRef]
  17. O’Callaghan, C.; Kveraga, K.; Shine, J.M.; Adams, R.B., Jr.; Bar, M. Predictions penetrate perception: Converging insights from brain, behaviour and disorder. Conscious. Cogn. 2017, 47, 63–74. [Google Scholar] [CrossRef]
  18. Poltoratski, S.; Ling, S.; McCormack, D.; Tong, F. Characterizing the effects of feature salience and top-down attention in the early visual system. J. Neurophysiol. 2017, 118, 564–573. [Google Scholar] [CrossRef]
  19. de Lange, F.P.; Heilbron, M.; Kok, P. How Do Expectations Shape Perception? Trends Cogn. Sci. 2018, 22, 764–779. [Google Scholar] [CrossRef]
  20. Hollingworth, A.; Matsukura, M. Feature-based guidance of attention during post-saccadic selection. Atten. Percept. Psychophys. 2019, 81, 1822–1835. [Google Scholar] [CrossRef]
  21. Jo, H.G.; Kellermann, T.; Baumann, C.; Ito, J.; Holthausen, B.S.; Schneider, F.; Grün, S.; Habel, U. Distinct modes of top-down cognitive processing in the ventral visual cortex. Neuroimage 2019, 193, 201–213. [Google Scholar] [CrossRef]
  22. Travis, S.L.; Dux, P.E.; Mattingley, J.B. Neural correlates of goal-directed enhancement and suppression of visual stimuli in the absence of conscious perception. Atten. Percept. Psychophys. 2019, 81, 1346–1364. [Google Scholar] [CrossRef]
  23. Fehringer, B.C. Spatial thinking from a different view: Disentangling top-down and bottom-up processes using eye tracking. Open Psychol. 2020, 2, 138–212. [Google Scholar] [CrossRef]
  24. Fischer, M.; Moscovitch, M.; Alain, C. A systematic review and meta-analysis of memory-guided attention: Frontal and parietal activation suggests involvement of fronto-parietal networks. Wiley Interdiscip. Rev. Cogn. Sci. 2020, 12, e1546. [Google Scholar] [CrossRef]
  25. Forstinger, M.; Grüner, M.; Ansorge, U. Unseeing the white bear: Negative search criteria guide visual attention through top-down suppression. J. Exp. Psychol. Hum. Percept. Perform. 2022, 48, 613–638. [Google Scholar] [CrossRef]
  26. Oliva, A.; Torralba, A. The role of context in object recognition. Trends Cogn. Sci. 2007, 11, 520–527. [Google Scholar] [CrossRef]
  27. Kravitz, D.J.; Kreigeskorte, N.; Baker, C.L. High-level visual object representations are constrained by position. Cereb. Cortex 2010, 20, 2916–2925. [Google Scholar] [CrossRef]
  28. Travis, S.L.; Mattingley, J.B.; Dux, P.E. On the role of working memory in spatial contextual cuing. J. Exp. Psychol. Learn. Mem. Cogn. 2013, 39, 208–219. [Google Scholar] [CrossRef]
  29. Goujon, A.; Didierjean, A.; Thorpe, S. Investigating implicit statistical learning mechanisms through contextual cueing. Trends Cogn. Sci. 2015, 19, 524–533. [Google Scholar] [CrossRef]
  30. Anderson, B.A.; Kim, H. Mechanisms of value-learning in the guidance of spatial attention. Cognition 2018, 178, 26–36. [Google Scholar] [CrossRef]
  31. Becker, S.I.; Martin, A.; Finlayson, N.J. At what stage of the visual processing hierarchy is visual search relational and context-dependent vs. feature-specific? J. Vis. 2019, 19, 132. [Google Scholar] [CrossRef]
  32. Buckley, M.G.; Austen, J.M.; Myles, L.A.; Smith, S.; Ihssen, N.; Lew, A.R.; McGregor, A. The effects of spatial stability and cue type on spatial learning: Implications for theories of parallel memory systems. Cognition 2021, 214, 104802. [Google Scholar] [CrossRef]
  33. Gersmehl, P.; Gersmehl, C. Spatial thinking in early childhood: What can they do and when can they start? J. Geogr. 2007, 106, 181–191. [Google Scholar]
  34. Baker, T.R.; Battersby, S.; Bednarz, S.W.; Bodzin, A.M.; Kolvoord, B.; Moore, S.; Sinton, D.; Uttal, D. A research agenda for geospatial technologies and learning. J. Geogr. 2015, 114, 118–130. [Google Scholar] [CrossRef]
  35. Downs, R.M.; de Souza, A. Learning to Think Spatially; The National Academies Press: Washington, DC, USA, 2006. [Google Scholar]
  36. Bednarz, S.W.; Heffron, S.; Huynh, N.T. (Eds.) A Road Map for 21st Century Geography Education: Geography Education Research; A report from the Geography Education Research Committee of the Road Map for 21st Century Geography Education Project; Association of American Geographers: Washington, DC, USA, 2013. [Google Scholar]
  37. Bueti, D.; Walsh, V. The parietal cortex and the representation of time, space, number and other magnitudes. Philos. Trans. R. Soc. 2009, 364, 1831–1840. [Google Scholar] [CrossRef]
  38. Bertin, J. Sémiologie Graphique. Les Diagrammes, Les Réseaux, Les Cartes. With Marc Barbut [et al.] (translated as Semiology of Graphics); Berg, W.J., Translator; Gauthier-Villars: Paris, France, 1967. [Google Scholar]
  39. Wood, G.; Willmes, K.; Nuerk, H.-C.; Fischer, M.H. On the cognitive link between space and number: A meta-analysis. Psychol. Sci. 2008, 50, 489–525. [Google Scholar]
  40. Chen, Q.; Verguts, T. Beyond the mental number line: A neural network model of number–space interactions. Cogn. Psychol. 2010, 60, 218–240. [Google Scholar] [CrossRef]
  41. Núñez, R.E. No innate number line in the human brain. J. Cross-Cult. Psychol. 2011, 42, 651–668. [Google Scholar] [CrossRef]
  42. Zhang, H.; Chen, C.; Zhou, X. Neural correlates of numbers and mathematical terms. NeuroImage 2012, 60, 230–240. [Google Scholar]
  43. Tibber, M.S.; Greenwood, J.A.; Dakin, S.C. Number and density discrimination rely on a common metric: Similar psychophysical effects of size, contrast, and divided attention. J. Vis. 2012, 12, 8. [Google Scholar] [CrossRef]
  44. Damarla, S.R.; Just, M.A. Decoding the representation of numerical values from brain activation patterns. Hum. Brain Mapp. 2013, 34, 2624–2634. [Google Scholar] [CrossRef]
  45. Harvey, B.M.; Fracasso, A.; Petridou, N.; Dumoulin, S.O. Topographic representations of object size and relationships with numerosity reveal generalized quantity processing in human parietal cortex. Proc. Natl. Acad. Sci. USA 2015, 112, 13525–13530. [Google Scholar] [CrossRef]
  46. Shaki, S.; Fischer, M.H. Deconstructing spatial-numerical associations. Cognition 2018, 175, 109–113. [Google Scholar] [CrossRef]
  47. Kutter, E.F.; Bostroem, J.; Elger, C.E.; Mormann, F.; Nieder, A. Single neurons in the human brain encode numbers. Neuron 2018, 100, 753–761. [Google Scholar] [CrossRef]
  48. Hawes, Z.; Sokolowski, H.M.; Ononye, C.B.; Ansari, D. Neural underpinnings of numerical and spatial cognition: An fMRI meta-analysis of brain regions associated with symbolic number, arithmetic, and mental rotation. Neurosci. Biobehav. Rev. 2019, 103, 316–336. [Google Scholar] [CrossRef]
  49. Sixtus, E.; Krause, F.; Lindemann, O.; Fischer, M.H. A sensorimotor perspective on numerical cognition. Trends Cogn. Sci. 2023, 27, 367–378. [Google Scholar] [CrossRef]
  50. Dehaene, S. The neural basis of the Weber-Fechner law: A logarithmic mental number line. Trends Cogn. Sci. 2003, 7, 145–147. [Google Scholar] [CrossRef]
  51. Siegler, R.S.; Thompson, C.A.; Opfer, J.E. The logarithmic-to-linear shift: One learning sequence, many tasks, many time scales. Mind Brain Educ. 2009, 3, 143–150. [Google Scholar] [CrossRef]
  52. Flannery, J. The relative effectiveness of some common graduated point symbols in the presentation of quantitative data. Can. Cartogr. 1971, 8, 96–109. [Google Scholar] [CrossRef]
  53. Chen, L.; Qiao, C.; Wang, Y.; Jiang, Y. Subconscious processing reveals dissociable contextual modulations of visual size perception. Cognition 2018, 180, 259–267. [Google Scholar] [CrossRef]
  54. Jenks, G.E.; Knos, D. The use of shading patterns in graded series. Ann. Assoc. Am. Geogr. 1961, 51, 316–334. [Google Scholar] [CrossRef]
  55. Göbel, F.; Kiefer, P.; Giannopoulos, I.; Duchowski, A.T.; Raubal, M. Improving map reading with gaze-adaptive legends. In Proceedings of the 2018 ACM Symposium on Eye Tracking Research & Applications, Warsaw, Poland, 14–17 June 2018. [Google Scholar]
  56. Yu, D.; Xiao, X.; Bemis, D.K.; Franconeri, S.L. Similarity grouping as feature-based selection. Psychol. Sci. 2019, 30, 376–385. [Google Scholar] [CrossRef]
  57. MacEachren, A.M. Grouping. In How Maps Work; Guilford Press: New York, NY, USA, 1995; pp. 71–86. [Google Scholar]
  58. Xu, Y.; Chun, M.M. Visual grouping in human parietal cortex. Proc. Natl. Acad. Sci. USA 2007, 104, 18766–18771. [Google Scholar] [CrossRef]
  59. Wagemans, J.; Elder, J.H.; Kubovy, M.; Palmer, S.E.; Peterson, M.A.; Singh, M. A century of Gestalt psychology in visual perception: I. Perceptual grouping and figure-ground organization. Psychol. Bull. 2012, 138, 1172–1217. [Google Scholar] [CrossRef]
  60. Montoro, P.R.; Luna, D.; Ortells, J.J. Subliminal Gestalt grouping: Evidence of perceptual grouping by proximity and similarity in absence of conscious perception. Conscious. Cogn. 2014, 25, 1–8. [Google Scholar] [CrossRef]
  61. Huang, L. Grouping by similarity is mediated by feature selection: Evidence from the failure of cue combination. Psychon. Bull. Rev. 2015, 22, 1364–1369. [Google Scholar] [CrossRef]
  62. Kimchi, R.; Devyatko, D.; Sabary, S. Can perceptual grouping unfold in the absence of awareness? Conscious. Cogn. 2018, 60, 37–51. [Google Scholar] [CrossRef]
  63. Kim, J.; Linsley, D.; Thakkar, K.; Serre, T. Disentangling neural mechanisms for perceptual grouping. arXiv 2019, arXiv:1906.01558. [Google Scholar]
  64. Peng, P.; Yang, K.F.; Li, Y.J. A computational model for gestalt proximity principle on dot patterns and beyond. J. Vis. 2021, 21, 23. [Google Scholar] [CrossRef]
  65. Harrison, T.B.; Stiles, J. Hierarchical forms processing in adults and children. J. Exp. Child Psychol. 2009, 103, 222–240. [Google Scholar] [CrossRef]
  66. Huizinga, M.; Burack, J.A.; van der Molen, M.W. Age-related change in shifting attention between global and local levels of hierarchical stimuli. J. Cogn. Dev. 2010, 11, 408–436. [Google Scholar] [CrossRef]
  67. Sturz, B.R.; Gaskin, K.A.; Robert, J.E. Incidental encoding of enclosure geometry. Mem. Cogn. 2014, 42, 935–942. [Google Scholar] [CrossRef]
  68. Choi, M.J.; Lim, J.J.; Torralba, A.; Willsky, A.S. Exploiting hierarchical context on a large database of object categories. In Proceedings of the 2010 IEEE Computer Society Conference on Computer Vision and Pattern Recognition, San Francisco, CA, USA, 13–18 June 2010; pp. 129–136. [Google Scholar]
  69. Tobler, W. A computer movie simulating urban growth in the Detroit region. Econ. Geogr. 1970, 46, 234–240. [Google Scholar] [CrossRef]
  70. Venables, D.; Pidgeon, N.F.; Parkhill, K.A.; Henwood, K.L.; Simmons, P. Living with nuclear power: Sense of place, proximity, and risk perceptions in local host communities. J. Environ. Psychol. 2012, 32, 371–383. [Google Scholar] [CrossRef]
  71. Hansen, T. Substitution or overlap? The relations between geographical and non-spatial proximity dimensions in collaborative innovation projects. Reg. Stud. 2015, 49, 1672–1684. [Google Scholar] [CrossRef]
  72. Histed, M.H.; Miller, E.K. Microstimulation of Frontal Cortex Can Reorder a Remembered Spatial Sequence. PLoS Biol. 2006, 4, 826–834. [Google Scholar] [CrossRef]
  73. Dehaene, S.; Meyniel, F.; Wacongne, C.; Wang, L.; Pallier, C. The neural representation of sequences: From transition probabilities to algebraic patterns and linguistic trees. Neuron 2015, 88, 2–19. [Google Scholar] [CrossRef]
  74. Hurlstone, M.J.; Hitch, G.J. How is the serial order of a spatial sequence represented? Insights from transposition latencies. J. Exp. Psychol. Learn. Mem. Cogn. 2015, 41, 295–324. [Google Scholar] [CrossRef]
  75. Spalding, K.N.; Schlichting, M.L.; Zeithamova, D.; Preston, A.R.; Tranel, D.; Duff, M.C.; Warren, D.E. Ventromedial prefrontal cortex is necessary for normal associative inference and memory integration. J. Neurosci. 2018, 38, 3767–3775. [Google Scholar] [CrossRef]
  76. Davis, B.; Spatial Reasoning Study Group. Spatial Reasoning in the Early Years; Routledge: New York, NY, USA, 2015. [Google Scholar]
  77. Anaya, E.M.; Pisoni, D.B.; Kronenberger, W.G. Visual-spatial sequence learning and memory in trained musicians. Psychol. Music. 2017, 45, 5–21. [Google Scholar] [CrossRef]
  78. Gouldthorp, B.; Katsipis, L.; Mueller, C. An investigation of the role of sequencing in children’s reading comprehension. Read. Res. Q. 2018, 53, 91–106. [Google Scholar] [CrossRef]
  79. Hachmann, W.M.; Cashdollar, N.; Postiglione, F.; Job, R. The relationship of domain-general serial order memory and reading ability in school children with and without dyslexia. J. Exp. Child Psychol. 2020, 198, 104789. [Google Scholar] [CrossRef]
  80. Hollingworth, A. Object-position binding in visual memory for natural scenes and object arrays. J. Exp. Psychology. Hum. Percept. Perform. 2007, 33, 31–47. [Google Scholar] [CrossRef]
  81. Van Buuren, M.; Kroes, M.C.W.; Wagner, I.C.; Genzel, L.; Morris, R.G.M.; Fernandez, G. Initial investigation of the effects of an experimentally learned schema on spatial associative memory in humans. J. Neurosci. 2014, 34, 16612–16620. [Google Scholar] [CrossRef]
  82. Earth Environments. Interactive Maps, Online Text, and Activities to Explore Associations with Different Climates. 2022. Available online: http://textbooks.wmisd.org/EarthEnvironments.html (accessed on 16 November 2023).
  83. Turk-Browne, N.B.; Scholl, B.J.; Chun, M.M.; Johnson, M.K. Neural evidence of statistical learning: Efficient detection of visual regularities without awareness. J. Cogn. Neurosci. 2008, 21, 1934–1945. [Google Scholar] [CrossRef]
  84. Alais, D.; Xu, Y.; Wardle, S.; Taubert, J. Expression in human and illusory faces (pareidolia) shows cross-domain serial dependence: Evidence for common processing. J. Vis. 2020, 20, 1748. [Google Scholar] [CrossRef]
  85. MacEachren, A.M.; Ganter, J. A pattern identification approach to geovisualization. Cartographica 1992, 27, 64–81. [Google Scholar] [CrossRef]
  86. Keefe, B.D.; Gouws, A.D.; Sheldon, A.A.; Vernon, R.J.; Lawrence, S.J.; McKeefry, D.J.; Wade, A.R.; Morland, A.B. Emergence of symmetry selectivity in the visual areas of the human brain: fMRI responses to symmetry presented in both frontoparallel and slanted planes. Hum. Brain Mapp. 2020, 39, 3813–3826. [Google Scholar] [CrossRef]
  87. Gersmehl, P. The National Council’s Geography Education Research Fund: Because It Would Still Be Nice to Have Data. J. Geogr. 2022, 121, 141–144. [Google Scholar] [CrossRef]
  88. Yuan, L.; Uttal, D.; Gentner, D. Analogical processes in children’s understanding of spatial representations. Dev. Psychol. 2017, 53, 1098–1114. [Google Scholar] [CrossRef]
  89. Guelke, L. Cartographic communication and geographic understanding. Cartographica 1977, 14, 129–145. [Google Scholar] [CrossRef]
  90. Wartenburger, I.; Heekeren, H.R.; Preusse, F.; Kramer, J.; ven der Meer, E. Cerebral correlates of analogical processing and their modulation by training. NeuroImage 2009, 48, 291–302. [Google Scholar] [CrossRef]
  91. Uttal, D.H.; Sheehan, K.J. The development of children’s understanding of maps and models. J. Cogn. Educ. Psychol. 2014, 13, 2014. [Google Scholar] [CrossRef]
  92. Vendetti, M.S.; Wu, A.; Rowshanbdshad, E.; Knowlton, B.J.; Holyoak, K.J. When reasoning modifies memory: Schematic assimilation triggered by analogical mapping. J. Exp. Psychol. Learn. Mem. Cogn. 2014, 40, 1172–1180. [Google Scholar] [CrossRef] [PubMed]
  93. Kroczek, B.; Ciechanowska, I.; Chuderski, A. Uncovering the course of analogical mapping using eye tracking. Cognition 2022, 225, 105140. [Google Scholar] [CrossRef]
  94. Gentner, D. Children’s performance on a spatial analogies task. Child Dev. 1977, 48, 1034–1039. [Google Scholar] [CrossRef]
  95. Marzolf, D.P.; DeLoache, J.S.; Kolstad, V. The role of relational similarity in young children’s use of a scale model. Dev. Sci. 1999, 2, 296–305. [Google Scholar] [CrossRef]
  96. Vasilyeva, M.; Bowers, E. Exploring the effects of similarity on mapping spatial relations. J. Exp. Child Psychol. 2010, 106, 221–239. [Google Scholar] [CrossRef]
  97. Hribar, A.; Haun, D.B.M.; Call, J. Children’s reasoning about spatial relational similarity: The effect of alignment and relational complexity. J. Exp. Child Psychol. 2012, 111, 490–500. [Google Scholar] [CrossRef]
  98. GIANTS. Presentations, Activities, and Other Resources for a Classroom-Mapping Activity with Scaffold Activities that Introduce Key Concepts and Spinoff Activities that Link with Reading and Math, in Units 1 and 2. 2022. Available online: www.misocialstudies.org/k2overview.html (accessed on 16 November 2023).
  99. Nieder, A.; DeHaene, S. Representation of number in the brain. Annu. Rev. Neurosci. 2009, 32, 185–208. [Google Scholar] [CrossRef]
  100. Davis, C.J. The spatial coding model of visual word identification. Psychol. Rev. 2010, 117, 713–758. [Google Scholar] [CrossRef]
  101. Soltész, F.; Szucs, D.; Szucs, L. Relationships between magnitude representation, counting, and memory in 4- to 7-year old children: A developmental study. Behav. Brain Funct. 2010, 6, 13. [Google Scholar] [CrossRef]
  102. Desoete, A.; Ceulemans, A.; De Weerdt, F.; Pieters, S. Can we predict mathematical learning disabilities from symbolic and non-symbolic comparison tasks in kindergarten? Br. J. Educ. Psychol. 2012, 82, 64–81. [Google Scholar] [CrossRef] [PubMed]
  103. Lonnemann, J.; Linkersdorfer, J.; Nagler, T.; Hasselhorn, M.; Lindberg, S. Spatial representations of numbers and letters in children. Front. Psychol. 2013, 4, 544. [Google Scholar] [CrossRef] [PubMed]
  104. Sasanguie, D.; Göbel, S.M.; Moll, K.; Smets, K.; Reynvoet, B. Approximate number sense, symbolic number processing, or number–space mappings: What underlies mathematics achievement? J. Exp. Child Psychol. 2013, 114, 418–431. [Google Scholar] [CrossRef]
  105. Carreiras, M.; Armstrong, B.C.; Perea, M.; Frost, R. The what, when, where, and how of visual word recognition. Trends Cogn. Sci. 2014, 18, 90–98. [Google Scholar] [CrossRef] [PubMed]
  106. Link, T.; Huber, S.; Nuerk, H.-C.; Moeller, K. Unbounding the mental number-line—New evidence on children’s spatial representation of numbers. Front. Psychol. 2014, 4, 1021. [Google Scholar] [CrossRef]
  107. Mix, K.S. Why are spatial skill and mathematics related? Child Dev. Perspect. 2019, 13, 121–126. [Google Scholar] [CrossRef]
  108. Hawes, Z.C.; Gilligan-Lee, K.A.; Mix, K.S. Effects of spatial training on mathematics performance: A meta-analysis. Dev. Psychol. 2022, 58, 112–137. [Google Scholar] [CrossRef]
  109. Vinci-Booher, S.; James, K.H. Visual experiences during letter production contribute to the development of the neural systems supporting letter perception. Dev. Sci. 2020, 23, e12965. [Google Scholar] [CrossRef]
  110. Dehaene, S. Reading in the Brain; Penguin Group: New York, NY, USA, 2009. [Google Scholar]
  111. Bergen, B.K.; Lindsay, S.; Matlock, T.; Narayanan, S. Spatial and linguistic aspects of visual imagery in sentence comprehension. Cogn. Sci. 2007, 31, 733–764. [Google Scholar] [CrossRef]
  112. Barnes, M.A.; Raghubar, K.P.; Faulkner, H.; Denton, C.A. The construction of visual-spatial situation models and their relation to reading comprehension. J. Exp. Child Psychol. 2014, 119, 101–111. [Google Scholar] [CrossRef]
  113. Newcombe, N.S. Picture this: Increasing math and science learning by improving spatial thinking. Am. Educ. 2010, 34, 29–35. [Google Scholar]
  114. Casasola, M.; Wei, W.S.; Suh, D.D.; Donskoy, P.; Ransom, A. Children’s exposure to spatial language promotes their spatial thinking. J. Exp. Psychol. Gen. 2020, 149, 1116–1136. [Google Scholar] [CrossRef] [PubMed]
  115. Lee, J.; Bednarz, R. Components of spatial thinking: Evidence from a spatial thinking ability test. J. Geogr. 2012, 111, 15–26. [Google Scholar] [CrossRef]
  116. Manning, A. Spotlight on Gersmehl and Gersmehl’s ‘Wanted: A concise list of spatial thinking skills’. Geography 2014, 99, 108–110. [Google Scholar] [CrossRef]
  117. Anderson, J.R.; Pyke, A.A.; Fincham, J.M. Hidden stages of cognition revealed in patterns of brain activation. Psychol. Sci. 2016, 27, 1215–1226. [Google Scholar] [CrossRef] [PubMed]
  118. Uttal, D.H.; Meadow, N.G.; Tipton, E.; Hand, L.L.; Alden, A.R.; Warren, C.; Newcombe, N.S. The malleability of spatial skills: A meta-analysis of training studies. Psychol. Bull. 2012, 139, 353–402. [Google Scholar] [CrossRef] [PubMed]
  119. Cheng, Y.-L.; Mix, K.S. Spatial training improves children’s mathematics ability. J. Cogn. Dev. 2014, 15, 2–11. [Google Scholar] [CrossRef]
  120. Gersmehl, P.; Gersmehl, C. Wanted: A concise list of neurologically defensible and assessable spatial-thinking skills. Res. Geogr. Educ. 2006, 8, 5–39. [Google Scholar]
  121. Kanwisher, N.; Dilks, D.D. The functional organization of the ventral visual pathway in humans. In The New Visual Neurosciences; Chalupa, L., Werner, J., Eds.; The MIT Press: Cambridge, MA, USA, 2013; Chapter 52; pp. 733–748. [Google Scholar]
  122. Carroll, J.B. Human Cognitive Abilities: A Survey of Factor Analytic Studies; Cambridge University Press: New York, NY, USA, 1993. [Google Scholar]
  123. Gersmehl, P. Tour of a Map-Reader’s Brain, Part 2: Conditions and Comparisons. Geogr. Teach. 2023, 20, 39–44. [Google Scholar] [CrossRef]
Figure 1. Examples of student answers on a pop quiz.
Education 13 01199 g001
Figure 2. Investigating Spatial Associations: Malaria and Possible Vectors.
Education 13 01199 g002
Figure 3. The Camel Region and Associated Features in Africa.
Education 13 01199 g003
Disclaimer/Publisher’s Note: The statements, opinions and data contained in all publications are solely those of the individual author(s) and contributor(s) and not of MDPI and/or the editor(s). MDPI and/or the editor(s) disclaim responsibility for any injury to people or property resulting from any ideas, methods, instructions or products referred to in the content.

