1. Introduction
Providing high-quality services has become essential to deciding an organization’s success and survival in today’s competitive business environment. Service quality (SQ) is crucial for differentiating businesses from competitors, establishing a competitive advantage, and attracting new clients [
1] Not surprisingly, businesses are urged to prioritize improving SQ to maximize profits, as getting new customers often incurs greater costs than retaining existing ones [
2]. Hence, organizations must provide services and suitable environments to retain existing consumers as a cost-effective measure, while investing efforts to attract new ones. Several studies have highlighted the significance of SQ in fostering productive organization–consumer interactions [
3]. By providing excellent services, businesses can enhance the customer experience, foster customer loyalty, and establish a solid foundation for long-term success. Organizations should, therefore, ensure employees’ satisfaction and loyalty, as they are primarily responsible for providing quality services influenced by the Service Profit chain model [
4]. Higher education institutions (HEIs) use the SQ to define the quality of the institution’s academic and non-academic services [
5]. Thus, any of the services is considered of high quality when they meet or exceed the client’s expectations [
6].
In the context of HEIs, students frequently evaluate the caliber of services their institutions provide in various dimensions. These evaluations include programs offered, tuition fees, educational services, interactions with academic and administrative staff, the institution’s physical infrastructure condition, and the institution’s overall corporate image and reputation [
7,
8,
9].
As the education industry is crucial to the development of society, HEIs oversee educating students about the challenges of the 21st century and future employment markets. However, student satisfaction and loyalty present significant challenges for higher education institutions [
10]. Building student loyalty is challenging, and institutions must focus on increasing retention rates and reducing attrition rates to ultimately increase graduation rates [
11]. To ensure their students’ long-term success and development, institutions must devote significant resources to this vital issue, including well-trained employees in front-line roles.
Undoubtedly, front-line employees (FLEs) play a crucial role in the service delivery system of universities because they interact directly with students. The behavior and attitude of FLEs highly influence students’ perceptions and attitudes toward the university. Specifically, the extra-role behaviors (ERB) of FLEs—voluntary actions that go beyond their formal employment requirements [
12]—have the potential to positively influence student satisfaction (SS), student loyalty (SL), and university image (UI) [
13]. Although previous studies have investigated the impact of FLE ERB on student performance [
14,
15,
16,
17,
18], the relationship between FLE and ERB, along with outcomes for students’ SS, is complex [
19,
20], requiring more contextual research. More importantly, maintaining a positive UI and reducing SC are crucial for HEIs to attract and retain talented students in today’s competitive academic landscape [
1].
However, sustainable efforts and investments in FLEs’ ERB to foster an astounding UI, SS, and SL require more research-informed policies, and attention in the United Arab Emirates (UAE). Therefore, the primary aim of this research is to expand upon the current body of knowledge by investigating how the ERB of FLEs influences various aspects of the student experience in HEI settings. Specifically, the study seeks to explore the effects of FLEs’ ERB on student satisfaction, loyalty, and the perception of the university’s image within the context of a UAE semi-government university. In doing this, the research also intends to analyze how student cynicism might moderate these relationships. The study’s findings hold the potential to offer valuable insights that can assist university administrators and policymakers to enhance the overall university experience for students, boost their loyalty, and subsequently improve their retention rates.
2. Review of Literature
2.1. Service Profit Chain
The Service Profit Chain (SPC) is a framework that establishes the connection between employee satisfaction, consumer satisfaction, and institutional performance [
2]. It emphasizes the importance of delivering high-quality services to promote organizational success and highlights the crucial connections between these elements. The SPC model, developed by Heskett et al. in 1994 [
3], has been extensively adopted and utilized in numerous industries. The SPC model provides an appropriate framework for supporting and justifying the proposed model relationships. The model is validated by empirical research from a variety of industries, such as hospitality [
4], retail [
5], and education [
6]. Higher levels of student engagement positively affect student satisfaction, increasing student retention rates and institutional effectiveness [
2]. In addition, when FLEs demonstrate ERB, their job satisfaction, engagement, and commitment to providing exceptional service experiences are enhanced, positively impacting students’ service experiences and satisfaction [
7]. Organizations seeking to improve their performance by focusing on service quality and employee engagement can gain valuable insights from the SPC model. Moreover, understanding the interdependencies from the SPC model will assist in developing strategies to enhance service delivery and boost customer loyalty and institutional image; consequently, such a move will assist in driving institutional financial success.
2.2. Front Line Employee Extra Role Behavior and Student Satisfaction (SS)
Evaluating SQ and customer satisfaction is a complex task, as both are judged during the process of service delivery [
8]. FLE are crucial in developing customer relationships, and their service performance and behavior toward customers directly impact customer satisfaction and loyalty [
9]. One important dimension of prosocial service behaviors is extra-role service behavior (ERB), which refers to employees’ voluntary citizenship behavior toward customers [
10]. Employee ERB, also known as organizational citizenship behavior (OCB), goes beyond formal job requirements and contributes to the effective functioning of an organization [
11]. Studies have shown that extra-role service behavior can positively impact customer satisfaction, organizational commitment, and performance [
12]. For instance, research by [
13] conducted in a medium-sized, not-for-profit, acute-care teaching hospital in the southeastern part of the U.S. unveiled a positive link between FLEs’ ERB and customer satisfaction. Another notable investigation from a four-star business hotel in Eastern China, employing a two-wave questionnaire survey, determined that customer participation that positively influenced employees coincided with ERBs elevating customer satisfaction [
14].
In higher education institutions, employee ERB or OCB can also be crucial in promoting student satisfaction [
15]. Faculty members who engage in extra help and responsiveness toward students are more likely to be rated highly regarding teaching effectiveness and overall satisfaction [
16,
17]. Conversely, support staff, when they are attuned and responsive to the academic needs of students, can uplift their general satisfaction levels with the institution [
18]. Research suggests a positive relationship between SS and employee OCB [
19], with student satisfaction being a measure of a student’s decision to continue utilizing a university’s services and academic programs [
20]. Student retention is strongly linked to student satisfaction resulting from the quality of services and educational programs provided by HEIs [
21,
22]. Therefore, educational organizations should encourage and recognize employees’ ERBs to enhance SS and retention.
While the link between FLE extra-role behavior and customer satisfaction seems apparent [
23], however, a comprehensive examination of the intricacies of this connection is required. The significant impact of FLEs’ ERB on customer satisfaction is widely recognized, as supported by several research [
24]. Nevertheless, it is crucial to recognize that this relationship is not consistently positive. While a segment of research lauds the unswerving positive impact of ERB on customer satisfaction, certain instances reveal that ERBs, albeit steeped in good intentions, may not necessarily align with the customer’s anticipatory benchmarks, potentially leading to dissatisfaction. Understanding this duality is of utmost importance, particularly when addressing the needs and expectations of a diverse student population [
25]. In certain situations, despite an employee’s sincere efforts, their behaviors may not align with client preferences, especially with customer cynicism behavior, leading to the failure to meet satisfaction goals. Through the adoption and implementation of ERBs, faculty members and support staff have the opportunity to facilitate an improved level of SS. This, in turn, can strengthen students’ confidence and loyalty, fostering their continued engagement and commitment to their academic pursuits within their respective educational institutions. Thus, the following hypothesis is proposed:
H1: Front-line employee extra-role behavior has a positive effect on student satisfaction.
2.3. The Moderating Role of Student Cynicism on the Relationship between Employee Extra-Role Behavior and Student Satisfaction
In addition to the relationship between FLE ERB and SS, it is essential to consider the role of students’ cynicism as a potential moderator. Cynicism can be defined as a negative attitude towards an organization or its members, including faculty and staff [
26]. As a result, cynical students may have lower expectations for SQ and be less likely to view ERB by faculty and staff as genuine.
Research has shown that cynicism can negatively moderate the relationship between SQ and customer satisfaction [
27]. In the context of higher education, a study by [
28,
29] found that cynicism moderated the relationship between SQ and SS, such that the positive effect of SQ on satisfaction was weaker among more cynical students. Therefore, cynicism may also moderate the relationship between FLE ERB and SS, such that the positive effect of ERB on satisfaction is weaker among more cynical students.
Not all instances of cynicism result in adverse consequences. In specific circumstances, a student’s adoption of a cynical perspective can serve as a defensive mechanism, sheltering them from future disappointments and cultivating their ability to bounce back from adversity. This viewpoint is consistent with the findings of [
30], arguing that cynicism, despite common assumptions, does not always result in negative consequences. In certain circumstances, this cynicism may empower students to negotiate the fluctuating dynamics of organizational changes effectively. However, there is a dearth of scholarly research on the potential moderating effect of cynicism on the relationship between employee ERB and SS in higher education institutions [
31,
32]. Therefore, the following hypothesis is proposed:
H2: The relationship between front-line employee extra-role behavior and student satisfaction is moderated negatively by student cynicism.
2.4. Students’ Satisfaction and Students’ Loyalty
Student satisfaction (SS) and loyalty are essential components of the success of higher education institutions. Satisfaction among students is crucial for universities to meet their objectives. Several studies have identified factors that influence SS, including the quality of education, teaching methodologies, accessibility to resources, and support services. For example, Ref. [
33] found that these variables significantly impacted SS. Ref. [
34] highlighted that teaching quality, academic environment, and educational quality were the most critical determinants of SS. Ref. [
35] also found that SQ directly affects SS and the perceived institutional image.
The relationship between SL and institutional performance is crucial, and it has been established that this loyalty is closely linked to SS. For example, Ref. [
36] found that SS is a significant determinant of SL, and students who are content with their university experience are more likely to remain loyal to their institution. This loyalty, in turn, leads to improved retention rates, positive word-of-mouth recommendations, and enhanced institutional image and financial performance [
37]. While a direct positive relationship between SS and SL is well documented, it is also crucial to note that satisfaction doesn’t always guarantee loyalty. A study by [
38] suggests that SS does not directly impact SL. In addition, Ref. [
39] suggests that loyalty is multifaceted, and that factors such as commitment, trust, and situational variables can all play roles. Students can express satisfaction with an institution’s offerings but show short-term loyalty, especially if their trust or commitment wavers. This multifaceted nature of loyalty should be recognized and explored further, as the student might be satisfied but not necessarily loyal in the long term.
Studies have identified several factors that impact SS and SL in higher education, including teaching effectiveness, academic standing, SQ, campus environment, student engagement, technology, and resources. For example, Ref. [
40] found that a Turkish institution’s campus environment, faculty quality, and academic reputation were critical determinants of SS and SL. Similarly, Ref. [
41] found that image, services, financial support, and perceived values significantly influenced SL in the social sciences at Meijo (Private) University, Japan. These findings suggest that universities need to understand their unique student populations’ needs and expectations to improve their satisfaction and loyalty. Thus, the hypothesis below is proposed:
H3: There is a significant positive relationship between student satisfaction and student loyalty.
2.5. Students’ Loyalty and University Image
The success of HEIs is closely tied to the loyalty of their students, which is significantly influenced by the institution’s image and reputation [
15]. A positive institutional image can enhance SL, boosting the institution’s reputation and financial success. Numerous studies have examined the connection between SL and UI, providing compelling evidence to support this proposition. For example, Ref. [
35] found that SS, SL, and perceived UI were directly affected by service quality, which, in turn, could increase student commitment. As reported, UI significantly influenced SL, with students who held a favorable reputation opinion more likely to remain loyal [
42].
Similarly, a study found a positive relationship between SL and an institution’s reputation, highlighting the importance of a strong institutional image in fostering student commitment [
43]. The relationship between SL and UI is commonly perceived favorably; nonetheless, it is crucial to acknowledge the complexity surrounding this relationship. Several research studies have produced divergent results concerning the extent to which there is a reliable relationship between company image and student loyalty [
25]. While some studies have emphasized the significant impact of business image on building customer loyalty [
44], other researchers have also presented contrasting viewpoints. Specifically, the debate on educational marketing in [
45] suggests that additional determinants, such as societal perception, peer influence, and even economic conditions, can significantly shape loyalty. Prominent researchers, such as [
46], argue that establishing a favorable corporate image serves as an initial step in the process of fostering customer loyalty [
46]. However, considering the limited number of studies that examine the possible negative consequences of SL on UI, the following hypothesis is proposed:
H4: There is a significant positive relationship between students’ loyalty and the university’s image.
3. Conceptual Framework
The conceptual framework depicted in
Figure 1 is grounded in a thorough review of relevant literature and scholarly works from international settings (e.g., [
12,
13,
19,
27,
28,
29,
35,
40,
41,
42,
43]), and guided the development of four hypotheses, detailed in
Table 1.
Figure 1 illustrates one exogenous variable (ERB) and three endogenous variables (SS, SL, and UI), and the moderating effect of SC.
4. Methods
4.1. Research Design and Instruments
This study employed a survey research design to examine and statistically analyze the factors influencing student retention concerning FLEs’ ERB, SS, SL, UI, and SC. This approach allowed for a deeper understanding of the issues under exploration by tapping into the shared views of as many students as possible about existing conditions [
47]. A self-designed questionnaire was developed to facilitate data collection, drawing on validated and dependable scales from the extant literature and previous studies [
10,
26,
48,
49,
50]. Using this tool enhances our results’ generalizability and transferability to similar educational institutions in the UAE and the region. The questionnaire consisted of three sections. The first section provided the study’s objectives and instructions for completing the questionnaires. The second section gathered demographic information from the respondents, while the third section elicited responses regarding the variables under investigation on a five-point Likert scale.
Despite adapting the questionnaire items from credible sources, the draft was shared with four scholars with relevant expertise, whose feedback was used to revise and enhance the items’ precision and clarity. The detailed questionnaire items are shown in
Appendix A, with their accompanying references. Afterward, the questionnaire was electronically administered to students while interfacing with FLEs in different units of the study context, including admission, registration, academic departments, and laboratories.
Before data collection, ethical approval was obtained from the Research Ethics Committee (REC-22-10-10-01-PG) of the research context, ensuring voluntary participation and maintaining confidentiality. Importantly, the participants were not financially rewarded, and their identities were not revealed in any part of this research report.
4.2. Participants
As mentioned, students were asked to participate voluntarily in this research by responding to an online questionnaire, which took 7 to 10 min to complete. In the end, 251 students gave their informed permission electronically and completed the surveys.
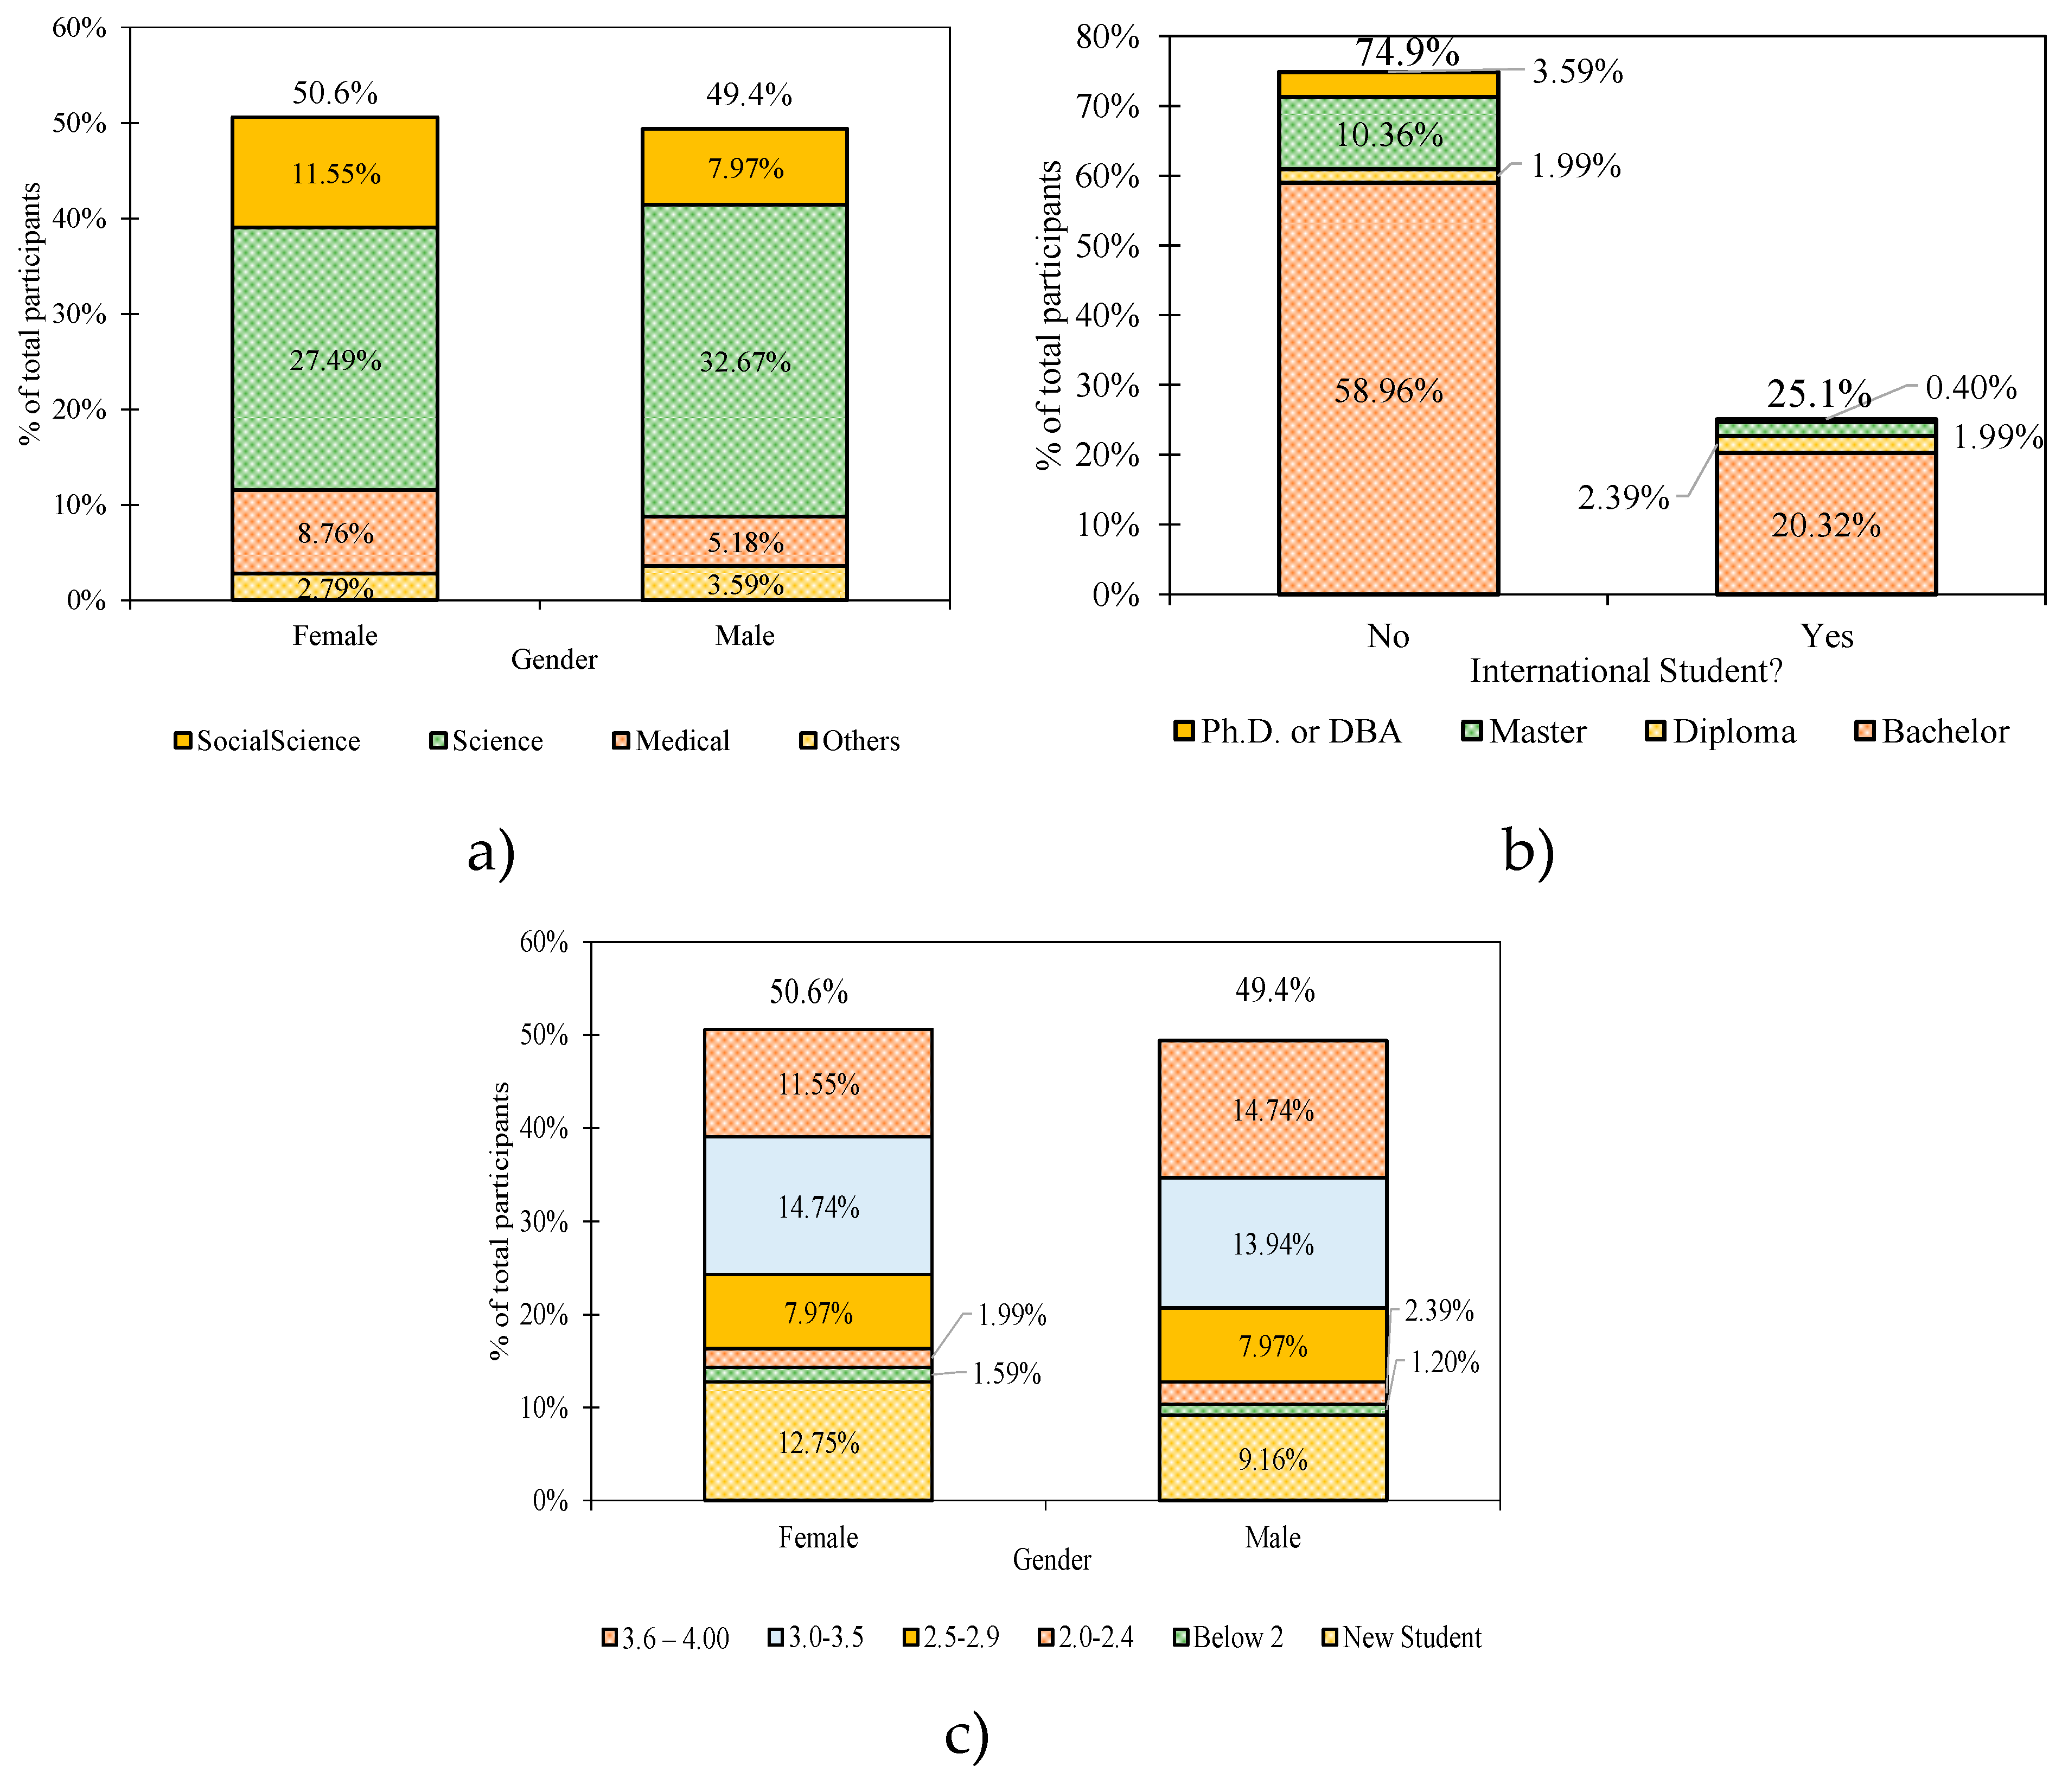
As shown in
Figure 2a, the distribution of male students (50.6%) and (49.4%) female students are practically similar. In addition, their age group ranges from under 20 to over 35. In terms of specialization, they are diverse and include social sciences, the sciences, and medicine. Most of the students who responded to the survey were from science, which accounts for 60.16% (27.49% of females and 32.67% of men), followed by medical (19.52%) and social sciences (13.9%). As shown in
Figure 2b, non-international students dominated 74.9% of all respondents, with the majority (79.28%) enrolled in bachelor programs.
Figure 2c shows the academic standing of these students (measured by GPA out of 4.0) with respect to gender. Almost similar GPA distribution between both genders can be seen from the collected students’ responses, with the majority in the range between 3.6–4.0 in males (14.74%), while the majority of females had a GPA of 3.0–3.5 (14.74%).
4.3. Data Analysis Using Structural Equation Modeling (SEM)
In analyzing the data collected, SEM, a widely employed analytical tool in the social sciences, was employed in this study. It involves testing a theoretical model using data collected through surveys and questionnaires [
51]. To develop the SEM adopted, bootstrapping routines were conducted using SmartPLS version 4.0.9.2 software [
52]. The internal consistency, validity, reliability, and goodness of fit measures were used to statistically analyze the hypothesized model results [
53,
54].
After developing the SEM, several approaches were used to investigate the internal consistency and validity of the data. These included computing Cronbach’s alpha (α), Composite Reliability (CR), Average Variance Extracted (AVE), Discriminant Validity Analysis (DVA) using Fornell Larcker, Heterotrait–Monotrait ratio of relationships (HTMT), and Variance Inflation Factor (VIF) [
55]. Furthermore, the goodness of fit of the model was evaluated by computing the Coefficient of determination (R2), Predictive relevance (Q2), and Effect size (F2) [
48]. These metrics provide a comprehensive assessment of the model’s effectiveness in explaining the data.
Overall, this study utilized SEM and accurate statistical methods to investigate the data’s internal consistency, validity, and goodness of fit. These analyses provide valuable insights into the relationship between the variables under investigation and enhance our understanding of the phenomena of interest.
4.4. Measurement Model Assessment
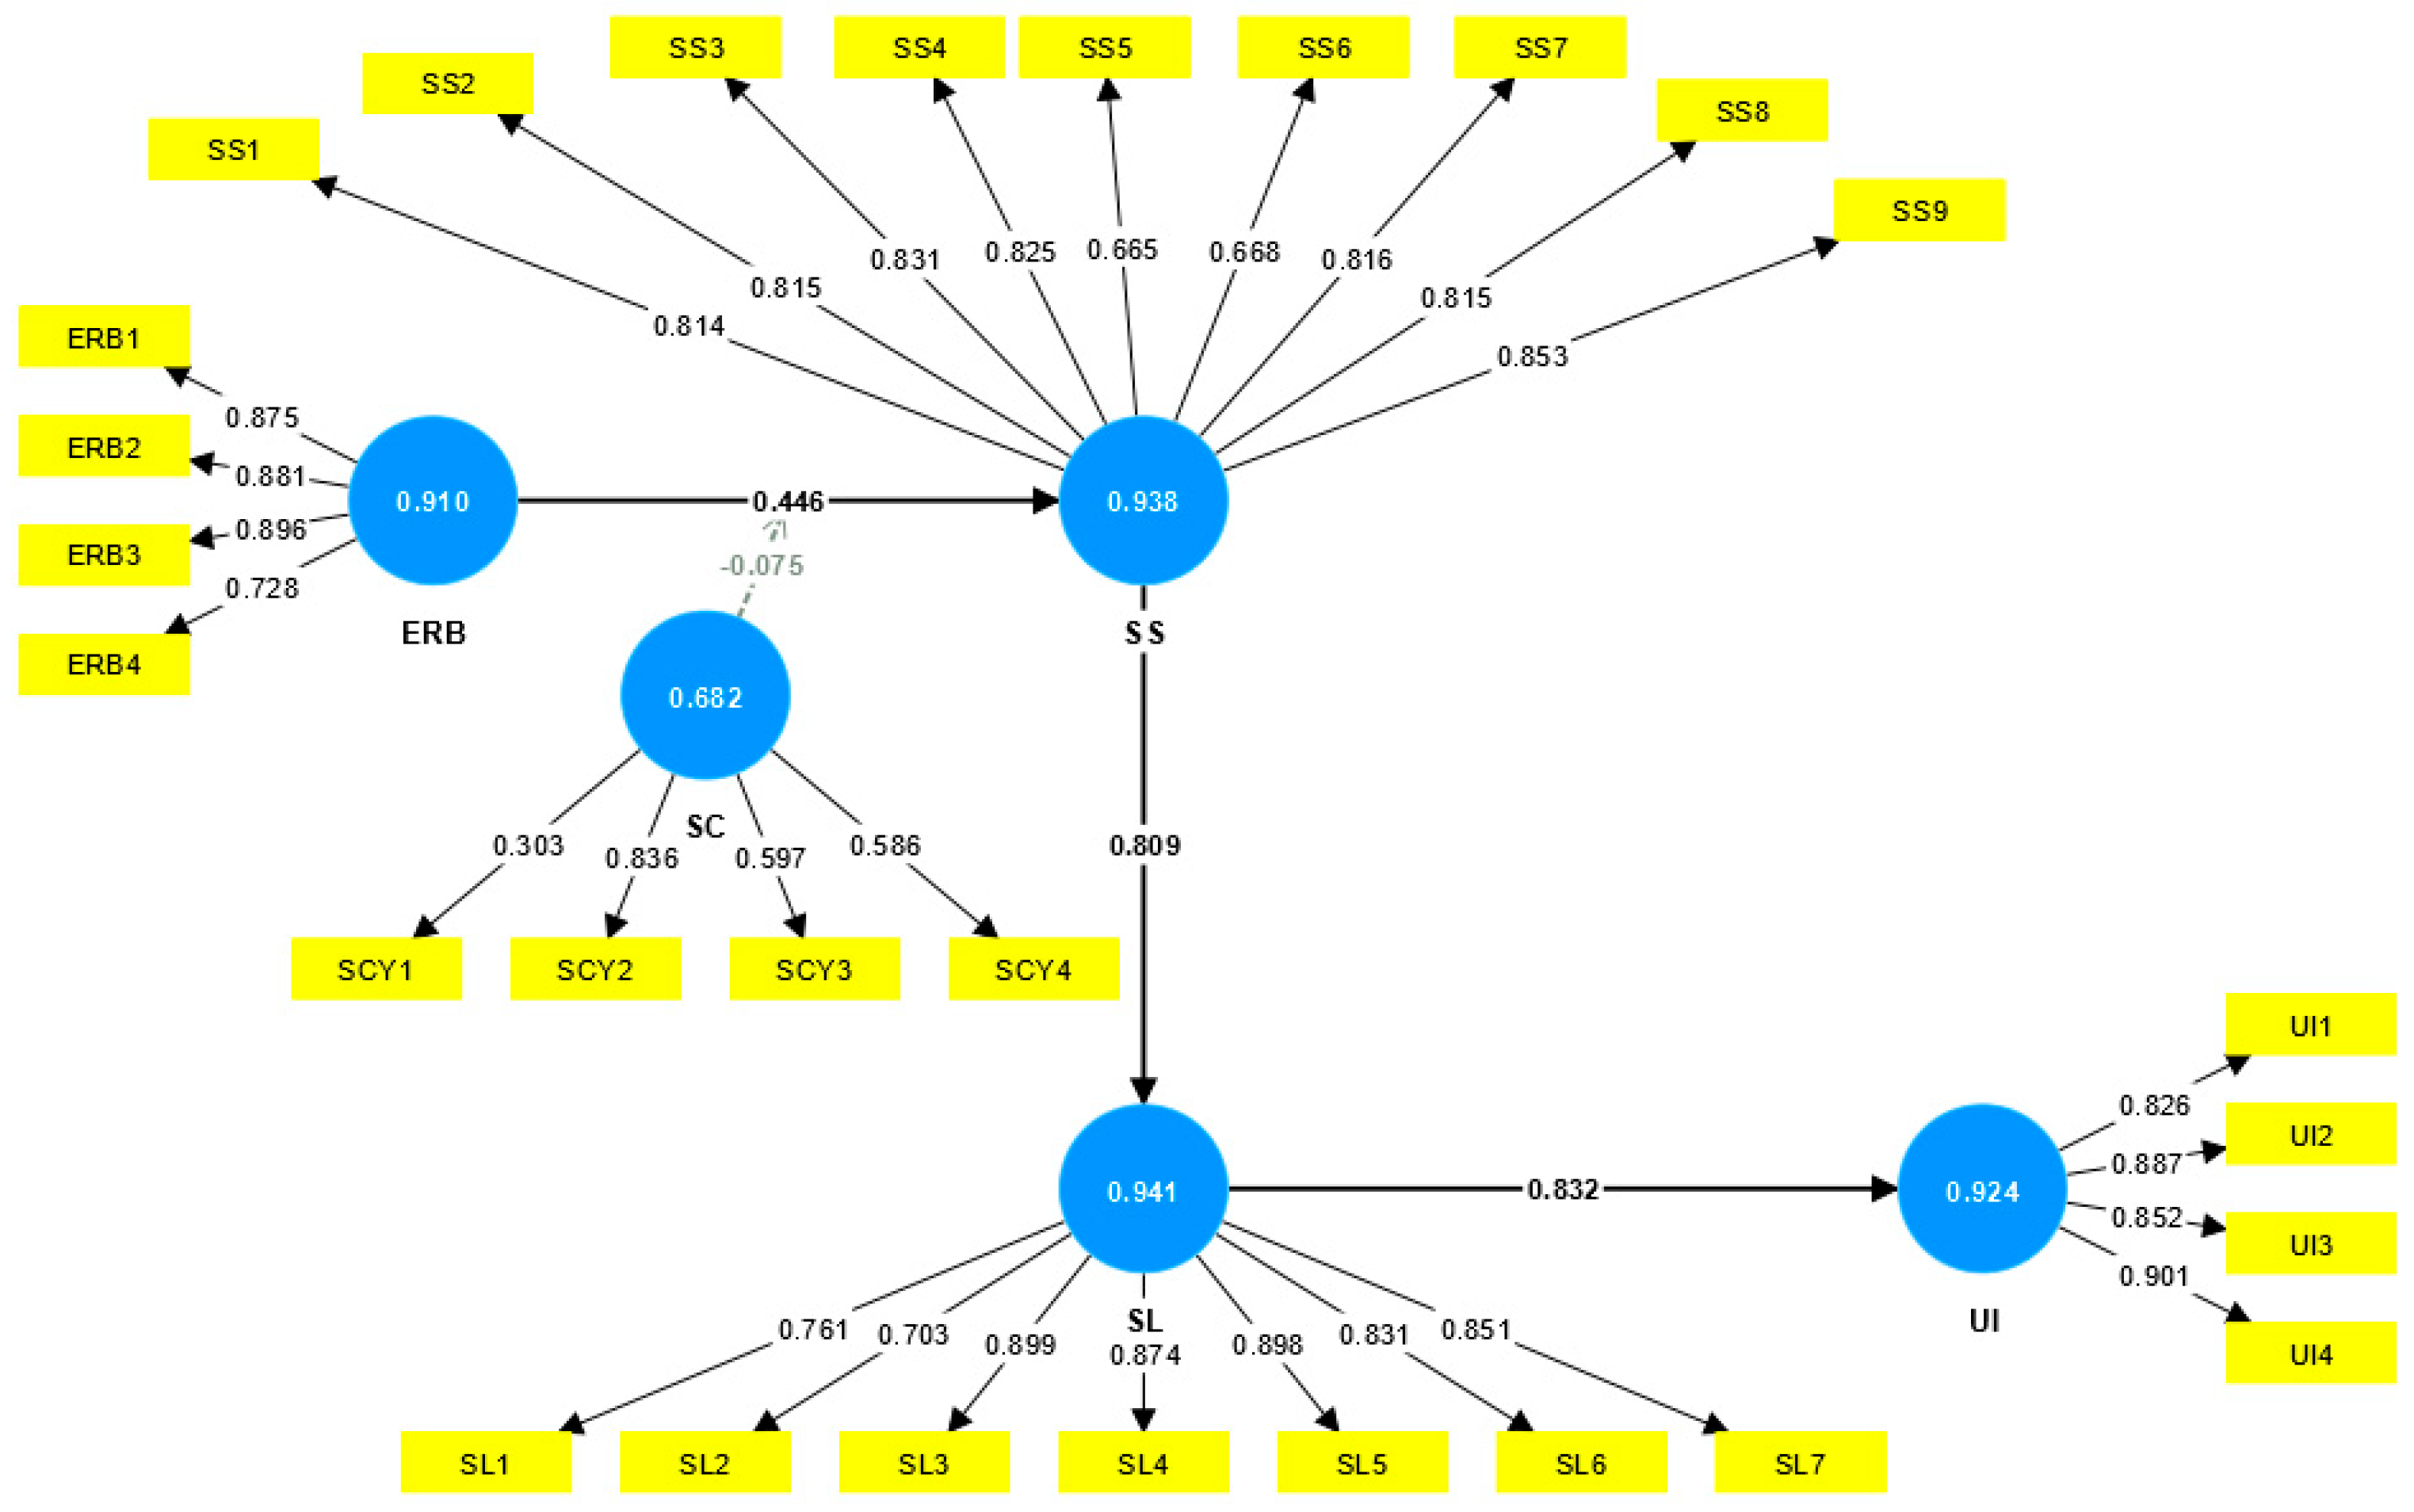
Measurement model assessment typically involves the following criteria to ensure its appropriateness. See
Table 2 and
Figure 3.
4.4.1. Factor Loadings
The measure is reliable when its factor loadings (FL) are above 0.50 [
50]. All of the study scale factor loadings were above 0.5 (see
Table 2), except for the one item for SC-1, indicating the overall reliability of the measure.
4.4.2. Internal Consistency
The threshold for the reliability of the measure is >0.7 scores of the Cronbach’s alpha (CA) for each of the measures [
51], meeting the criteria very well for study constructs, except SC, which had CA = 0.599 (see
Table 2).
4.4.3. Composite Reliability (CR)
Owing to the underestimation problem with Cronbach’s α, there is a need for a greater estimation of true reliability [
54]. As shown in
Table 2, our model adequately met the acceptable values of CR, i.e., >0.7 for confirmatory purposes [
56], except for SC’s CR was 0.637.
4.4.4. Convergent Validity
For convergent validity, the AVE (average variance extracted) should be greater than 0.5 [
56]. The AVE values in
Table 2 are well above the defined criteria to prove the convergent validity of the constructs, except for SCN, whose AVE was 0.373.
4.4.5. Discriminant Validity
It is the degree to which a particular latent construct is dissimilar from other latent variables in any measurement model [
47]. Usually, it is calculated based on HTMT < 0.85 or <0.90 [
47]. As shown in
Table 2, all HTMT values were below 0.85, except for SL and UI, which were marginally above 0.906, indicating sufficient discriminant validity.
4.4.6. Quality of the Measurement Model
The eminence quality of the measurement model is assured through its predictive validity, calculated by utilizing the values of communality (H2). All of these values were positive for all blocks (
Table 2), ensuring the predictive validity/eminence quality of the measurement model.
4.4.7. Structural Model Assessment
A structural model shows the relationship between constructs, and related theories and literature [
54]. Direct effects hypotheses were tested in SmartPLS by utilizing algorithms, bootstrapping, and blindfolding techniques.
4.4.8. Hypothesis Testing
A bias-corrected 95% confidence interval was used to test out direct effect hypotheses. See
Table 3 and
Figure 3 for details.
5. Results
This section presents the study results, showing how the hypotheses generated are addressed.
Table 3 below shows the results of hypotheses 1–4, as tested.
Hypothesis 1 suggested that FLE ERB will have a positive impact on SS. The findings indicated that FLE ERB had a positive and significant impact on SS (β = 0.450, t = 6.679, p < 0.000) with a moderate effect size (F2 = 0.285; Cohen, 1988). Hence, H1 was supported.
Hypothesis 2 proposed that SC would moderate the relationship between ERB, and SS. The results revealed that H2 was also accepted as SC moderates the relationship significantly and reduced the SS (β = −0.075, t = 2.268, p = 0.023), with a small effect (F2 = 0.024).
Hypothesis 3 anticipated that SS would have a significant impact on SL. The analysis showed that H3 was supported, as SS had a significantly positive impact on SL (β = 0.808, t = 18.306, p < 0.000), with a huge effect size (F2 = 1.880).
Hypothesis 4 proposed that SL would have a significant impact on UI. The findings showed that SL had a positive and statistically significant effect on UI (β = 0.832, t = 31.570, p < 0.000), with a considerable effect size (F2 = 2.249). Thus, hypothesis 4 was also supported.
Quality of Structural Model: The predictive relevance of the structural model was measured using Stone–Geisser’s Q2, R2, and VIF. Q2 was used to measure the eminent quality of the structural model. The positive values of Q2 (>0) were acceptable for a good-quality structural model. R2 is the measure of the overall effect size. As indicated in
Table 4, 65.3% of SL, 47.7% of SS, and 69.2% of UI were explained by the relevant prediction model. Moreover, this study’s developed and adopted model was free from the suspects of path contamination and collinearity, as VIF values were <3.3 [
49], suggesting the model’s good quality.
6. Discussion
The service profit chain highlights the importance of satisfied and engaged employees who exhibit positive behaviors beyond their job requirements. These behaviors, known as ERB, create a positive customer experience, leading to higher customer satisfaction. Satisfied customers are more likely to be loyal and to contribute to the organization’s financial success [
57]. Additionally, customer perceptions and attitudes shape an organization’s overall image, influencing customer behavior and recommendations. By focusing on employee satisfaction, customer satisfaction, and managing customer perceptions, organizations can foster loyalty, financial performance, and a positive reputation [
58]. As mentioned earlier, this study was conducted against this backdrop, and its finding demonstrates a statistically significant and positive relationship between the ERB of FLEs and SS. Thus, it substantiates the notion that FLE’s actions directly influence customer satisfaction [
59]. This is consistent with the initial component of the service profit chain model, which suggests a clear relationship between employee actions and organizational outcomes, highlighting the vital role of employees in delivering high-quality service experiences [
3].
Specifically, the hypotheses developed and tested in this study focus on the relationship between FLE ERB and SS, how this relationship affects SL and UI, and the impact of student cynicism and loyalty on this relationship. The debate that follows will examine each hypothesis, in turn, building on previously conducted research and theoretical frameworks to evaluate their viability and the implications for academic institutions and other service providers. For instance, H1 suggested that FLE ERB positively affected SS. This hypothesis agrees with prior studies in service management, which highlighted the crucial role FLE plays in determining how students are treated and how well their experiences are handled [
60,
61]. Since FLEs are the first to interact with students, their roles and attitudes are crucial in determining students’ first impressions of an educational institution. In addition, studies have shown that students are more likely to be pleased with a service when they believe that FLE has gone above and beyond their assigned tasks to provide excellent service [
31]. Therefore, it makes sense to anticipate that FLE ERB would increase SS, as reported in previous studies [
35,
36,
38]. However, institutions need to ensure that FLEs stay motivated to demonstrate ERBs. Doing this will include offering incentives and enabling work environments.
As shown in the results, H2 suggested that SC moderates the relationship between FLE ERB and SS negatively. This is unsurprising, as cynicism has been associated with decreased pleasure and trust in service interactions, and it is defined as the idea that people are more driven by their interests than by others [
62]. It is, therefore, conceivable that student cynicism might tamper with the beneficial impacts of FLE ERB on SS, which is supported in this study and previous studies [
41,
42,
43]. While it is essential for HEIs to reduce SC by investing in resources to enhance their images and reputations, they must understand the contextual factors that could lead to SC. Doing this will ensure that HEIs devise sustainable measures for addressing SC and promoting SS using an evidence-based approach.
H3 proposed a significant positive relationship between SS and SL. According to the service–profit chain model [
3], SS is vital in determining SL and, eventually, institutional profitability, which is consistent with the findings of this study. As argued in research [
63], satisfied students are more likely to stick with the service and refer others to it. Therefore, it is fair to assume that SL is positively linked with SS. Therefore, it makes sense to anticipate that SS will lead to SL, as reported and supported by other previous literature [
36,
46,
47,
48]. That notwithstanding, other factors may play roles in students’ decisions about their perceptions of HEIs’ reputations, the services rendered, and their desire to remain with or leave an institution. Thus, the findings reinforce the need for HEI leadership to regularly engage in conversations and research to better understand how best to support students, leading to SC and a positive UI.
Lastly, H4 suggested a significant relationship between SL and UI, corresponding with the service-profit chain model, which contends that customer loyalty is crucial in determining an organization’s reputation and profitability. According to research [
64], devoted students are more inclined to endorse the institution positively and to stand up for it when it faces criticism. Thus, it seems reasonable to assume that student loyalty would have a favorable impact on the university’s reputation. Therefore, it makes sense to anticipate that SL would positively impact UI, as reported and supported by other previous literature [
48,
54,
55]. That said, HEIs must continue investing in other measures to enhance their profiles and images. For instance, parents and students value employability skills, and institutions must strive to invest in measures to adequately prepare students for future jobs. This endeavor will include well-thought-out internships through which students learn in professional work contexts with the collaborative support of faculty as FLEs and internship sites [
58].
7. Conclusions and Implications for HEIs
This study examined the relationships between FLE ERB, SS, SC, SL, and UI by proposing and testing several hypotheses. Using a survey method, data collection was done involving 251 students, and four hypotheses were tested using an SEM. From the study, it is evident that FLEs’ ERB significantly impacts SS, indicating the need for more interest in strategies for enhancing ERB, including calculated attempts to reduce SC. This is essential, as the results suggest that SC acts as a negative moderator between FLEs’ ERB and SS, demanding HEI leadership’s efforts to reduce its adverse impacts. Additionally reinforcing the importance of SS for HEIs’ positive outlook and student impression, the results reveal that SS positively impacts SL, with SL leading to a favorable UI and reputation.
The findings of this study enrich the prevailing academic discourse by emphasizing the crucial roles of FLE ERB and student perceptions within higher education. The following delineates the study’s contributions and implications:
Significance of ERB: Adopting ERB practices goes beyond strategy; it involves creating an environment where student satisfaction flourishes. Employees taking on roles beyond their primary duties, such as mentoring or community engagement, foster a sense of belonging within the HEI landscape.
Recognizing the Vital Role of FLE: The positive ERBs exhibited by FLEs represent an institution’s core values. Investing in their training and nurturing qualities, such as empathy and proactiveness, is essential. An organizational culture that celebrates and rewards such behaviors creates an environment in which FLEs are motivated to excel consistently.
Harnessing Continuous Feedback: For an institution to remain relevant and adaptive, establishing continuous improvement and feedback mechanisms is crucial. Tools such as periodic surveys and focus groups offer insights into student sentiments. Addressing this feedback reduces cynicism and strengthens trust between students and the institution.
Ensuring Equity and Fairness: Colleges must prioritize implementing consistent, transparent, and fair policies. A clear approach reduces cynicism and creates an environment conducive to academic success in areas ranging from grading to decision making.
By embracing and acting upon these insights, HEIs can enhance FLEs’ motivation to engage in ERB, leading to encouraging and outstanding service deliveries. Essentially, they can elevate student experiences, foster unparalleled loyalty, and cement their reputations as institutions that don’t just impart knowledge but also deeply value their stakeholders.
8. Limitations and Areas for Future Research Considerations
The study drew on one HEI and relied mainly on quantitative data. Future studies could consider broader, multi-institutional contexts and multiple research approaches to enrich the findings’ implications for stakeholders in HEI administration. Collaborative research among researchers from different institutions adopting mixed methods and longitudinal studies will add value to the discourse. In-depth interviews and focus group discussions for tapping the nuanced views of stakeholders in HEIs could assist in further explaining the quantitative data.
Besides, future studies might delve deeper into how FLE ERB, SC, SS, SL, and UI are interconnected, sampling multiple nationwide campuses for more comprehensive insights. Considering these recommendations, future research can build upon this study’s foundation, offering a more nuanced and thorough understanding of the intricate dynamics in the relationships among frontline employee behavior, student satisfaction, cynicism, loyalty, and institutional reputation.
Author Contributions
Conceptualization, A.B.A.; methodology, A.B.A., M.A.A.-H., S.A.A., M.O. and E.A.; validation, A.B.A., M.A.A.-H., S.A.A., M.O. and E.A.; formal analysis, A.B.A.; investigation, A.B.A.; resources, A.B.A., M.A.A.-H., S.A.A. and M.O.; data curation, A.B.A.; writing—original draft preparation, A.B.A.; writing—review and editing, A.B.A., M.A.A.-H., S.A.A. and M.O. All authors have read and agreed to the published version of the manuscript.
Funding
The authors would like to thank the University of Sharjah for the APC support and enabling environment leading to the completion of the research (REC-22-10-10-01-PG).
Institutional Review Board Statement
The study was conducted in accordance with the Declaration of Helsinki and approved by the Institutional Review Board (or Research Ethics Committee) of the University of Sharjah + (protocol code REC- 22–10–10–01-PG and 24 April 2023).
Informed Consent Statement
Informed consent was obtained electronically from all subjects involved in the study.
Data Availability Statement
The data presented in this study are available on request from the corresponding author; moreover, the study was conducted in accordance with the Declaration of Helsinki and approved by the Institutional Review Board (or Research Ethics Committee) of the University of Sharjah + (protocol code REC-22–10–10–01-PG and 24 April 2023).
Acknowledgments
We thank the participants for their time and participation in the study. We are thankful to some colleagues for their feedback during the initial phase of the study. We are also indebted to the University of Sharjah for the support and enabling environment leading to the completion of this research.
Conflicts of Interest
The authors declare no conflict of interest.
Appendix A
Table A1.
Questions utilized in this study and their labels.
Table A1.
Questions utilized in this study and their labels.
| Variables | Label | Question (Answer 1 as Strongly Disagree and 5 Strongly Agree) | References |
|---|
| Front-line employee’s extra role behavior (ERB) | ERB1 | Front-line employees who served me voluntarily assist me even if it means going beyond their job requirements. | [10,57] |
| ERB2 | Front-line employees who served me willingly went out of their way to make me satisfied. |
| ERB3 | Front-line employees who served me often go above and beyond the call of duty when serving me. |
| ERB4 | Front-line employees who served me assisted me in finding solutions for my problems beyond what was expected or required. |
| Students cynicism (SC) | SC1 | College/University are not always sincere in their dealings with their students. | [27] |
| SC2 | College/University will usually do what is best for its students. |
| SC3 | Many Colleges/Universities prioritize their profits to the well-being of their students. |
| SC4 | Many Colleges/Universities give priority to attracting students rather than providing quality services. |
| Student Satisfaction (SS) | SS1 | I am extremely satisfied with the support of the front-line employees at my college\University. | [65,66] |
| SS2 | Front-line employees provide excellent Academic support services. |
| SS3 | I have had a good experience at my college\University. |
| SS4 | I am highly satisfied with the available resources at my college\University. |
| SS5 | I am highly satisfied with the academic advising services. |
| SS6 | I am highly satisfied with the personal counseling services provided. |
| SS7 | I am satisfied and proud of my academic achievement at my college\University. |
| SS8 | I am satisfied with my program and course curriculum at my College/University. |
| SS9 | Overall, I am satisfied with my Institution. |
| Student Loyalty (SL) | SL1 | I consider my College/University to be the best among others. | [65,66] |
| SL2 | I will consider my College/University as the first choice to further my postgraduate education. |
| SL3 | I am happy to be associated with my institution |
| SL4 | I will recommend my Institution to my family members and friends |
| SL5 | I am happy to complete my program of study at my College/University because of its good reputation. |
| SL6 | It is important for me to complete my program of study in my College/University |
| SL7 | Getting a college/university degree in my College/University is important to me. |
| University image (UI) | UI1 | My Institution is known for hiring outstanding employees. | [67,68] |
| UI2 | I have heard positive things about My Institution. |
| UI3 | The image projected by my Institution influences the value of my degree |
| UI4 | In general, I think my Institution is a great educational institution. |
References
- Dominic PD, D.; Goh, K.N.; Wong, D.; Chen, Y.Y. The Importance of Service Quality for Competitive Advantage—with Special Reference to Industrial Product. Int. J. Bus. Inf. Syst. 2010, 6, 378. [Google Scholar] [CrossRef]
- Hong, Y.; Liao, H.; Hu, J.; Jiang, K. Missing Link in the Service Profit Chain: A Meta-Analytic Review of the Antecedents, Consequences, and Moderators of Service Climate. J. Appl. Psychol. 2013, 98, 237–267. [Google Scholar] [CrossRef]
- Heskett, J.L.; Jones, T.O.; Loveman, G.W.; Sasser, W.E.; Schlesinger, L.A. Putting the Service-Profit Chain to Work—ProQuest One Academic—ProQuest. Harvard Business Review. Available online: https://uoseresources.remotexs.xyz/user/login?dest=?url=https://www.proquest.com/magazines/putting-service-profit-chain-work/docview/227819534/se-2 (accessed on 18 October 2022).
- Cain, L.; Tanford, S.; Shulga, L. Customers’ Perceptions of Employee Engagement: Fortifying the Service–Profit Chain. Int. J. Hosp. Tour. Adm. 2018, 19, 52–77. [Google Scholar] [CrossRef]
- Gelade, G.A.; Young, S. Test of a Service Profit Chain Model in the Retail Banking Sector. J. Occup. Organ. Psychol. 2005, 78, 1–22. [Google Scholar] [CrossRef]
- Kolar, T.; Erčulj, V.; Weis, L. Multigroup Validation of the Service Quality, Customer Satisfaction and Performance Links in Higher Education. Serv. Ind. J. 2019, 39, 1004–1028. [Google Scholar] [CrossRef]
- Schepers, J.J.L.; van der Borgh, M. A Meta-Analysis of Frontline Employees’ Role Behavior and the Moderating Effects of National Culture. J. Serv. Res. 2020, 23, 255–280. [Google Scholar] [CrossRef]
- Ali, S.S.; Basu, A.; Ware, N. Quality Measurement of Indian Commercial Hospitals—Using a SERVQUAL Framework. Benchmarking 2018, 25, 815–837. [Google Scholar] [CrossRef]
- Liao, H.; Chuang, A. A Multilevel Investigation of Factors Influencing Employee Service Performance and Customer Outcomes. Acad. Manag. J. 2004, 47, 41–58. [Google Scholar] [CrossRef]
- Bettencourt, L.A.; Brown, S.W. Contact Employees: Relationships among Workplace Fairness, Job Satisfaction and Prosocial Service Behaviors. J. Retail. 1997, 73, 39–61. [Google Scholar] [CrossRef]
- Organ, D. Organizational Citizenship Behavior: The Good Soldier Syndrome; D. C. Heath and Company: Lexington, MA, USA, 1988. [Google Scholar]
- Organ, D.W.; Ryan, K. A Meta-Analytic Review of Attitudinal and Dispositional Predictors of Organizational Citizenship Behavior. Pers. Psychol. 1995, 48, 775–802. [Google Scholar] [CrossRef]
- Arthur, J.B. Public Announcements of Employee Recognitions from Customers and Customer Satisfaction: Longitudinal Effects in the Healthcare Context. J. Bus. Res. 2023, 157, 113568. [Google Scholar] [CrossRef]
- Xu, S.; Wang, Y.-C.; Ma, E. A Workplace-Driven Model on the Formation of OCB-C: Perspectives of Social Exchange Theory and Agency Theory. Int. J. Contemp. Hosp. Manag. 2022, 34, 2684–2703. [Google Scholar] [CrossRef]
- Rojas-Méndez, J.; Vasquez-Parraga, A.Z.; Kara, A.; Cerda-Urrutia, A. Determinants of Student Loyalty in Higher Education: A Tested Relationship Approach in Latin America. Lat. Am. Bus. Rev. 2009, 10, 21–39. [Google Scholar] [CrossRef]
- Somech, A.; Drach-Zahavy, A. Understanding Extra-Role Behavior in Schools: The Relationships between Job Satisfaction, Sense of Efficacy, and Teachers’ Extra-Role Behavior. Teach. Teach. Educ. 2000, 16, 649–659. [Google Scholar] [CrossRef]
- Gavino, M.C.; Akinlade, E. Diversity Climate of Respect and the Impact on Faculty Extra Role Behaviors. J. Bus. Divers. 2021, 21, 97–114. [Google Scholar] [CrossRef]
- Ahmed, I.; Ismail, W.K.W.; Amin, S.M.; Islam, T. Role of Perceived Organizational Support in Teachers’ Responsiveness and Students’ Outcomes: Evidence from a Public Sector University of Pakistan. Int. J. Educ. Manag. 2014, 28, 246–256. [Google Scholar] [CrossRef]
- Kang, S.P.; Byun, J.; Law, V.; Seo, Y.K.; Ferris, K. Adaptation and Validation of the Measure of Organizational Citizenship Behavior in Collaborative Learning. Knowl. Manag. E-Learn. 2020, 12, 280–297. [Google Scholar] [CrossRef]
- Alshurideh, M.; Masa’deh, R.M.d.T.; Alkurdi, B. The Effect of Customer Satisfaction upon Customer Retention in the Jordanian Mobile Market: An Empirical Investigation. Eur. J. Econ. Financ. Adm. Sci. 2012, 47, 69–78. [Google Scholar]
- Ponnam, A.; Paul, R. Relative Importance of Service Value by Customer Relationship Stages: Evidence from the Indian Retail Banking. Int. J. Bank Mark. 2017, 35, 319–334. [Google Scholar] [CrossRef]
- Yin, S.-Y.; Huang, K.-K.; Shieh, J.-I.; Liu, Y.-H.; Wu, H.-H.; Yin, S.-Y.; Huang, K.-K.; Liu, Y.-H.; Wu, H.-H. Telehealth Services Evaluation: A Combination of SERVQUAL Model and Importance-Performance Analysis. Qual. Quant. 2016, 50, 751–766. [Google Scholar] [CrossRef]
- Bukhatir, A.; Al-Hawari, M.A.; Aderibigbe, S.; Omar, M.; Alotaibi, E. Improving Student Retention in Higher Education Institutions—Exploring the Factors Influencing Employees Extra-Role Behavior. J. Open Innov. Technol. Mark. Complex. 2023, 9, 100128. [Google Scholar] [CrossRef]
- Netemeyer, R.G.; Maxham, J.G. Employee versus Supervisor Ratings of Performance in the Retail Customer Service Sector: Differences in Predictive Validity for Customer Outcomes. J. Retail. 2007, 83, 131–145. [Google Scholar] [CrossRef]
- Castro, C.B.; Armario, E.M.; Ruiz, D.M. The Influence of Employee Organizational Citizenship Behavior on Customer Loyalty. Int. J. Serv. Ind. Manag. 2004, 15, 27–53. [Google Scholar] [CrossRef]
- Andersson, L.; Organizational, T.B. Cynicism in the Workplace: Some Causes and Effects. J. Organ. Behav. 1997, 18, 449–469. [Google Scholar] [CrossRef]
- Balaji, M.S.; Jha, S.; Sengupta, A.S.; Krishnan, B.C. Are Cynical Customers Satisfied Differently? Role of Negative Inferred Motive and Customer Participation in Service Recovery. J. Bus. Res. 2018, 86, 109–118. [Google Scholar] [CrossRef]
- Tajeri Moghadam, M.; Abbasi, E.; Khoshnodifar, Z. Students’ Academic Burnout in Iranian Agricultural Higher Education System: The Mediating Role of Achievement Motivation. Heliyon 2020, 6, e04960. [Google Scholar] [CrossRef] [PubMed]
- Mostert, K.; Pienaar, J. The Moderating Effect of Social Support on the Relationship between Burnout, Intention to Drop out, and Satisfaction with Studies of First-Year University Students. J. Psychol. Afr. 2020, 30, 197–202. [Google Scholar] [CrossRef]
- Reichers, A.E.; Wanous, J.P.; Austin, J.T. Understanding and Managing Cynicism about Organizational Change. Acad. Manag. Exec. 1997, 11, 48–57. [Google Scholar] [CrossRef]
- Erkutlu, H.; Chafra, J. Leaders’ Narcissism and Organizational Cynicism in Healthcare Organizations. Int. J. Workplace Health Manag. 2017, 10, 346–363. [Google Scholar] [CrossRef]
- Bohorquez, N. Perception of Leadership Styles, Organizational Commitment and Burnout in Faculty of Colombian Universities; Northcentral University: Scottsdale, AZ, USA, 2016. [Google Scholar]
- Eresia-Eke, C.; Ngcongo, N.; Ntsoane, T. The Nexus of Service Quality, Student Satisfaction and Student Retention in Small Private Colleges in South Africa. Educ. Sci. 2020, 10, 179. [Google Scholar] [CrossRef]
- Nikou, S.; Maslov, I. Finnish University Students’ Satisfaction with e-Learning Outcomes during the COVID-19 Pandemic. Int. J. Educ. Manag. 2023, 37, 1–21. [Google Scholar] [CrossRef]
- Hwang, Y.-S.; Choi, Y.K. Higher Education Service Quality and Student Satisfaction, Institutional Image, and Behavioral Intention. Soc. Behav. Personal. Int. J. 2019, 47, 1–12. [Google Scholar] [CrossRef]
- Cahyono, Y.; Purwanto, A.; Nurul Azizah, F.; Wijoyo, H.; Sihotang, M.; Sugianto, A. Impact of Service Quality, University Image and Students Satisfaction towards Student Loyalty: Evidence from Indonesian Private Universities. J. Crit. Rev. 2020, 7, 19. [Google Scholar]
- Pham, L.; Limbu, Y.B.; Bui, T.K.; Nguyen, H.T.; Pham, H.T. Does E-Learning Service Quality Influence e-Learning Student Satisfaction and Loyalty? Evidence from Vietnam. Int. J. Educ. Technol. High. Educ. 2019, 16, 7. [Google Scholar] [CrossRef]
- Ismanova, D. Students’ Loyalty in Higher Education: The Mediating Effect of Satisfaction, Trust, Commitment on Student Loyalty to Alma Mater. Manag. Sci. Lett. 2019, 9, 1161–1168. [Google Scholar] [CrossRef]
- Oliver, R.L. Whence Consumer Loyalty? J. Mark. 1999, 63, 33–44. [Google Scholar] [CrossRef]
- Akçapınar, G.; Altun, A.; Aşkar, P. Using Learning Analytics to Develop Early-Warning System for at-Risk Students. Int. J. Educ. Technol. High. Educ. 2019, 16, 40. [Google Scholar] [CrossRef]
- Mallika Appuhamilage, K.S.; Torii, H. The Impact of Loyalty on the Student Satisfaction in Higher Education. High. Educ. Eval. Dev. 2019, 13, 82–96. [Google Scholar] [CrossRef]
- El-Kassar, A.N.; Makki, D.; Gonzalez-Perez, M.A. Student–University Identification and Loyalty through Social Responsibility: A Cross-Cultural Analysis. Int. J. Educ. Manag. 2019, 33, 45–65. [Google Scholar] [CrossRef]
- Chandra, T.; Hafni, L.; Chandra, S.; Purwati, A.A.; Chandra, J. The Influence of Service Quality, University Image on Student Satisfaction and Student Loyalty. Benchmarking 2019, 26, 1533–1549. [Google Scholar] [CrossRef]
- Bloemer, J.; De Ruyter, K.; Peeters, P. Investigating Drivers of Bank Loyalty: The Complex Relationship between Image, Service Quality and Satisfaction. Int. J. Bank Mark. 1998, 16, 276–286. [Google Scholar] [CrossRef]
- Kotler, P.; Fox, K.F.A. Strategic Marketing for Educational Institutions; Prentice Hall: Hoboken, NJ, USA, 1995. [Google Scholar]
- Arrivabene, L.S.; Vieira, P.R.D.C.; Mattoso, C.L.D.Q. Impact of Service Quality, Satisfaction and Corporate Image on Loyalty: A Study of a Publicly Traded for-Profit University. Serv. Mark. Q. 2019, 40, 189–205. [Google Scholar] [CrossRef]
- Aderibigbe, S.A.; Hamdi, W.B.; Alzouebi, K.; Frick, W.; Companioni, A.A. Understanding Student Perceptions of Social Computing and Online Tools to Enhance Learning. PLoS ONE 2022, 17, e0276490. [Google Scholar] [CrossRef]
- Gumasing, M.J.J.; Prasetyo, Y.T.; Persada, S.F.; Ong, A.K.S.; Young, M.N.; Nadlifatin, R.; Redi, A.A.N.P. Using Online Grocery Applications during the COVID-19 Pandemic: Their Relationship with Open Innovation. J. Open Innov. Technol. Mark. Complex. 2022, 8, 93. [Google Scholar] [CrossRef]
- Dash, G.; Paul, J. CB-SEM vs PLS-SEM Methods for Research in Social Sciences and Technology Forecasting. Technol. Forecast. Soc. Chang. 2021, 173, 121092. [Google Scholar] [CrossRef]
- Orlowski, M.; Bufquin, D.; Nalley, M.E. The Influence of Social Perceptions on Restaurant Employee Work Engagement and Extra-Role Customer Service Behavior: A Moderated Mediation Model. Cornell Hosp. Q. 2021, 62, 261–275. [Google Scholar] [CrossRef]
- Alamer, A.; Marsh, H. Exploratory Structural Equation Modeling in Second Language Research: An Applied Example Using the Dualistic Model of Passion. Stud. Second Lang. Acquis. 2022, 44, 1477–1500. [Google Scholar] [CrossRef]
- Corrêa Ferraz, R.; Maydeu-Olivares, A.; Shi, D. Asymptotic Is Better than Bollen-Stine Bootstrapping to Assess Model Fit: The Effect of Model Size on the Chi-Square Statistic. Struct. Equ. Model. Multidiscip. J. 2022, 29, 731–743. [Google Scholar] [CrossRef]
- Whittaker, T.; Schumacker, R. A Beginner’s Guide to Structural Equation Modeling; Routledge: Oxfordshire, UK, 2022. [Google Scholar]
- Hair Jr, J.F.; Hult, G.T.M.; Ringle, C.M.; Sarstedt, M.; Danks, N.P.; Ray, S. Partial Least Squares Structural Equation Modeling (PLS-SEM) Using R: A Workbook; Springer Nature: Berlin/Heidelberg, Germany, 2021. [Google Scholar]
- Tavakol, M.; Dennick, R. Making Sense of Cronbach’s Alpha. Int. J. Med. Educ. 2011, 2, 53–55. [Google Scholar] [CrossRef]
- Sarstedt, M.; Hair, J.F.; Pick, M.; Liengaard, B.D.; Radomir, L.; Ringle, C.M. Progress in Partial Least Squares Structural Equation Modeling Use in Marketing Research in the Last Decade. Psychol. Mark. 2022, 39, 1035–1064. [Google Scholar] [CrossRef]
- Wisner, P.S.; Stringfellow, A.; Youngdahl, W.E.; Parker, L. The Service Volunteer—Loyalty Chain: An Exploratory Study of Charitable Not-for-Profit Service Organizations. J. Oper. Manag. 2005, 23, 143–161. [Google Scholar] [CrossRef]
- Sarwar, S.; Abugre, J. The Influence of Rewards and Job Satisfaction on Employees in the Service Industry. In The Business & Management Review; Centre for Business & Economic Research PP—London: London, UK, 2013; pp. 22–32. Available online: https://www.proquest.com/openview/6f886524a32daec0c201fb59baff64eb/1 (accessed on 25 June 2023).
- Wikhamn, W. Innovation, Sustainable HRM and Customer Satisfaction. Int. J. Hosp. Manag. 2019, 76, 102–110. [Google Scholar] [CrossRef]
- Pascual Nebreda, L.; Díez Martín, F.; Blanco González, A. Changes and Evolution in the Intellectual Structure of Consumer Dissatisfaction. J. Consum. Behav. 2021, 20, 160–172. [Google Scholar] [CrossRef]
- Shepherd, W.J.; Ployhart, R.E.; Kautz, J. The Neglected Role of Collective Customer Perceptions in Shaping Collective Employee Satisfaction, Service Climate, Voluntary Turnover, and Involuntary Turnover: A Cautionary Note. J. Appl. Psychol. 2020, 105, 1327–1337. [Google Scholar] [CrossRef] [PubMed]
- Mäkelä, L.; Tanskanen, J.; De Cieri, H. Do Relationships Matter? Investigating the Link Between Supervisor and Subordinate Dedication and Cynicism via the Quality of Leader–Member Exchange. J. Leadersh. Organ. Stud. 2021, 28, 76–90. [Google Scholar] [CrossRef]
- Reichheld, F.F.; Sasser, W.E. Zero Defections: Quality Comes to Services. Harv. Bus. Rev. 1990, 68, 105–111. [Google Scholar] [PubMed]
- Krishnan, J.J. A Study on Loyalty Dimension and Measurement. Mater. Today Proc. 2021, 37, 890–893. [Google Scholar] [CrossRef]
- Borishade, T.T.; Ogunnaike, O.O.; Salau, O.; Motilewa, B.D.; Dirisu, J.I. Assessing the Relationship among Service Quality, Student Satisfaction and Loyalty: The NIGERIAN Higher Education Experience. Heliyon 2021, 7, e07590. [Google Scholar] [CrossRef]
- Archambault, L. Measuring Service Performance, Student Satisfaction and Its Impact on Student Retention in Private, Post-Secondary Institutions. In Proceedings of the EDU-COM 2008 International Conference, Perth, WA, Australia, 19–21 November 2008. [Google Scholar]
- Gatfield, R.E.; Turrisi, R.; Harless, C. University Image: The Benefits of Assessment and Modeling. J. Mark. High. Educ. 1999, 9, 53–68. [Google Scholar] [CrossRef]
- Moslehpour, M.; Chau, K.Y.; Zheng, J.J.; Hanjani, A.N.; Hoang, M. The Mediating Role of International Student Satisfaction in the Influence of Higher Education Service Quality on Institutional Reputation in Taiwan. Int. J. Eng. Bus. Manag. 2020, 12, 1847979020971955. [Google Scholar] [CrossRef]
| Disclaimer/Publisher’s Note: The statements, opinions and data contained in all publications are solely those of the individual author(s) and contributor(s) and not of MDPI and/or the editor(s). MDPI and/or the editor(s) disclaim responsibility for any injury to people or property resulting from any ideas, methods, instructions or products referred to in the content. |
© 2023 by the authors. Licensee MDPI, Basel, Switzerland. This article is an open access article distributed under the terms and conditions of the Creative Commons Attribution (CC BY) license (https://creativecommons.org/licenses/by/4.0/).


 ,
, 
