Article

Leveraging H3Africa Scholarly Publications for Technology-Enhanced Personalized Bioinformatics Education

by
Angela U. Makolo
1,*,
Olubukola Smile
1,
Kehinde B. Ezekiel
2,
Antoinette M. Destefano
2,
Junell L. McCall
2 and
Raphael D. Isokpehi
2,†
1
University of Ibadan Bioinformatics Group, Department of Computer Science, University of Ibadan, Ibadan 200132, Nigeria
2
Center for Trans-Disciplinary Data Analytics, Bethune-Cookman University, Daytona Beach, FL 32114, USA
*
Author to whom correspondence should be addressed.
Current affiliation: Office of Data Science Strategy, National Institutes of Health, Bethesda, MD 20892, USA
Educ. Sci. 2022, 12(12), 859; https://doi.org/10.3390/educsci12120859
Submission received: 22 August 2022 / Revised: 16 November 2022 / Accepted: 21 November 2022 / Published: 24 November 2022

Abstract

:
The Coronavirus Disease 2019 (COVID-19) pandemic has catalyzed the expectations for technology-enhanced interactions with personalized educational materials. Adjusting the content of educational materials to the geographical location of a learner is a customization feature of personalized education and is used to develop the interest of a learner in the content. The educational content of interest in this report is bioinformatics, in which the knowledge spans biological science and applied mathematics disciplines. The Human Heredity and Health in Africa (H3Africa) Initiative is a resource suitable for use when obtaining data and peer-reviewed scholarly articles, which are geographically relevant and focus on authentic problem solving in the human health domain. We developed a computerized platform of interactive visual representations of curated bioinformatics datasets from H3Africa projects, which also supports customization, individualization and adaptation features of personalized education. We obtained evidence for the positive effect size and acceptable usability of a visual analytics resource designed for the retrieval-based learning of facts on functional impacts of genomic sequence variants. We conclude that technology-enhanced personalized bioinformatics educational interventions have implications in (1) the meaningful learning of bioinformatics; (2) stimulating additional student interest in bioinformatics; and (2) improving the accessibility of bioinformatics education to non-bioinformaticians.

1. Introduction

The Coronavirus Disease 2019 (COVID-19) pandemic has challenged traditional methods of design, delivery and assessment aspects of education globally [1,2,3,4]. Additionally, the COVID-19 pandemic has catalyzed the expectations for technology-enhanced interactions with personalized educational materials [5,6,7]. Adjusting the content of educational materials to the geographical location of a learner is a customization feature of personalized education [8] and is used to develop the interest of a learner in the content [9,10]. The educational content knowledge of interest in this report is bioinformatics, the application of tools of computation and analysis to the capture and interpretation of biological data [11]. Bioinformatics education has been broadly defined as “the teaching and learning of the use of computer and information technology, along with mathematical and statistical analysis for gathering, storing, analyzing, interpreting, and integrating data to solve biological problems”. Thus, bioinformatics knowledge spans biological and applied mathematics disciplines [12]. Globally, bioinformatics education exists at multiple academic levels and is an indispensable part of life science education [13,14,15,16]. Genomic sequence data from different parts of the world are also available as curriculum resources for bioinformatics education [13]. The global aspects of bioinformatics present opportunities for customizing bioinformatics educational resources through the geographic context of the bioinformatics data. For example, databases on human genomic variants include data on geographic regions to facilitate interpretation [17,18].
Advances in multiple research fields, including instructional design and visual analytics, have high potential to influence educational practices in the field of bioinformatics. The instructional design features of personalized education include customization (the system supports an individual’s choice), individualization (the individual makes the choice) and adaptation (the system makes the choice) [8]. Personalized education promotes creativity and innovation, which are needed in a modern society [19]. Visual analytics software, which belongs to the software component of applied mathematics [12], enables the design of visualizations for the representation, interaction and analysis of data [20]. The purpose of this report is to describe a computerized platform of interactive visual representations of curated bioinformatics datasets to support features of personalized education, namely customization, individualization and adaptation. Our perspective is that digital software technology platforms can especially enable students and non-specialists to visually analyze and interpret bioinformatics data.
The Human Heredity and Health in Africa (H3Africa) Initiative was established in 2012 with a vision that the data generated from a pan-continental network of laboratories will inform strategies to ultimately lead to health benefits in Africa [21,22]. H3Africa is a resource suitable for obtaining data and peer-reviewed scholarly articles that are geographically relevant and focuses on authentic problem solving in the human health domain [21,22]. In 2022, after 10 years of the establishment and development of H3Africa, several bioinformatics advances have helped to accomplish the H3Africa vision [23,24,25]. As of June 2022, advances in the generation and investigation of data from genome and genome-enabled resources have been documented in at least 615 scholarly publications [26]. Peer-reviewed scholarly publications contain textual content, images, data tables and supplementary materials that are suitable for use in technology-enhanced educational resources to acquire knowledge for performing bioinformatics tasks. Additionally, since genomic data generation is a major component of H3Africa projects [27], we expect that H3Africa publications will include bioinformatics knowledge categories that are described in bioinformatics journals.
Bioinformatics problems can be complex and ill-structured, requiring the application of multiple bioinformatics knowledge categories [28,29,30]. The network of bioinformatics knowledge includes bioimage informatics; data and text mining; databases and ontologies; gene expression; genetics and population analysis; genome analysis; phylogenetics; sequence analysis; structural bioinformatics; and systems biology [31,32]. The complexity of bioinformatics knowledge brings to relevance the need for meaningful learning, in which the learner builds mental models (representations) by combining new knowledge and any relevant prior knowledge with opportunities to test mental models through problems, refined by experience and the appropriate feedback [33,34,35,36]. The five dimensions of meaningful learning are active, authentic, constructive, and cooperative and personalized [36]. Meaningful learning can help accomplish the educational goals of the long-term retention of knowledge and the transfer of knowledge to new problems [35,37]. In technology-enhanced learning environments, interaction facilitates meaningful learning [38], and the design of interfaces for effortful interaction can support the retrieval of relevant knowledge from multiple options. In the learning strategy of retrieval practice, knowledge is retrieved from memory to answer questions such as short answer and multiple-choice formats [39]. We envision that in a visual analytics software, the retrieval of knowledge can be achieved by interaction and responses provided to a quizzing software. We therefore used this approach to determine the effectiveness of one of the visual analytics resources designed to support the learning of facts about genomic sequence variations. The design of interfaces for learning facts needed in bioinformatics problem solving can therefore benefit from incorporating mental modeling stages, retrieval practice and the dimensions of meaningful learning.
A collection of peer-reviewed H3Africa scholarly publications from 2012 provides both historical and emerging knowledge useful in bioinformatics educational activities including technology-enhanced design, delivery and assessment. In summary, the growing number of H3Africa publications can be a suitable resource for designing personalized bioinformatics education that includes customization (e.g., by geographic location), individualization (e.g., choice of population groups) and/or adaptation (e.g., collecting data on visual analytics actions). In this article, we present how we reused the content of an open access research article entitled “High-depth African genomes inform human migration and health” [40]. The major results include recoded and reshaped datasets as well as designs of visual analytics resources that can support the personalized education of genome-level population variation in Africa. A pilot evaluation study for effectiveness and perceived usability resulted in a positive effect and acceptable usability.

2. Materials and Methods

From September 2017 to June 2022, the development of visual analytics resources to support bioinformatics learning was an activity in the Train-the-Trainer Project of the H3Africa Bioinformatics Network (H3ABioNet). We designed and implemented the visual analytics resources with Tableau, and they were categorized as worksheet (a template for designing representations, interactions and analyses), dashboard (combining worksheets and other objects) and story (combining worksheets and dashboards). Several visual analytics resources are available at https://public.tableau.com/app/profile/uibgnode (accessed on 12 August 2022). We used the visual analytics resources in educational sessions including a 2021 virtual conference workshop of the African Society for Bioinformatics and Computational Biology (ASBCB) entitled “Learning Adventures on Bioinformatics Data Investigations”. During the 2021 Annual General Meeting of the H3ABioNet, members of the H3ABioNet Training and Education Work Package suggested that the H3Africa article “High-depth African genomes inform human migration and health” (PubMed Central ID: PMC7759466) is a suitable data source for visual-analytics-supported educational interventions. The open access scholarly article presents diverse datasets including genomic and geographic datasets on 426 individuals comprising 50 ethnolinguistic groups. The article content includes eight figures, five supplementary notes, twenty supplementary figures, three supplementary methods, three supplementary methods tables and twenty-three supplementary tables.
Similar to our previous publication on sickle cell disease [41], we reused the textual content of the article and associated supplementary resources as the data sources for the design of visual analytics resources. In this report, we recorded or reshaped datasets from an H3Africa scholarly article to render it machine-readable and facilitate the design of the personalized education of genome-level variation in Africa. The method sub-sections below describe approaches that we used to leverage the H3Africa open access publications to design a computerized platform to support personalized bioinformatics education.

2.1. Recoding and Reshaping Datasets from an H3Africa Scholarly Article

The text of the scholarly article and the supplementary spreadsheet file of the PubMed Central (PMC) article PMC7759466 were the data sources for the construction of value-added, visual-analytics-ready datasets. For a dataset in a worksheet of a supplementary spreadsheet file, we recoded and or reshaped the dataset to be machine-readable, in this case for use in visual analytics software. The recoding included adding annotations (or labels) and unique identifier column for each record (row) in the dataset. We may have also added a column that provides notes about entries in the record. For example, the Supplementary Table 6 of PMC7759466 is a color-coded dataset for the detection of genes showing outlier Composite Likelihood Ratio (CLR) scores (p < 0.001) in six populations. We recoded the dataset that encoded the detection of a gene in a population as “1” when detected and “0” when not detected (Figure 1). In the visual analytics software (Tableau Desktop or Tableau Public) [42], we implemented visual analytics actions such as search and filter as well as a constructed a six-digit binary pattern from the six populations for each gene entry.
We also recoded a dataset of textual statements by copying sentences from the PMC article to a worksheet of spreadsheet software (e.g., Microsoft Excel and Google Sheets). Since sentences may express a complete thought [43], we extracted sentences to support reading strategies (such as skimming and scanning) in visual analytics software. Each of the statement column entries had associated data columns with the section (e.g., abstract and methods) and subsection source of the statement. An additional approach was to obtain the visual-analytic-ready json format of PubMed Central article using the uniform resource locator script: https://www.ncbi.nlm.nih.gov/research/bionlp/RESTful/pmcoa.cgi/BioC_json/PMC7759466/unicode (accessed on 12 August 2022).

2.2. Design of Visual Analytics Resources for Personalized Learning of Bioinformatics Knowledge

We accomplished the design of the visual analytics resources in the following two main stages. In the first stage, we imported relevant dataset(s) into Tableau [42]. In the second stage, we arranged the data fields from the datasets in worksheets or dashboards to accomplish the desired personalization. The arrangement of the data fields followed guidelines for using interactive visual representations to support learning and other complex activities [20,44,45]. The designs included features such as filters and connections to websites of bioinformatics resources and scholarly publications. These design features are intended to support the effortful and intentional interaction with datasets to achieve personalization, namely, customization, individualization and adaptation [8].

2.3. Evaluation of Visual Analytics Resources

We used a pre-test and post-test quasi-experimental design to determine the effect size of using the interaction with a visual analytics resource to obtain answers to questions. This method enables effortful interaction that leads to the retrieval of the answers in the visual analytics resource. This form of retrieval practice of facts knowledge promotes meaningful learning [35,37], where the accumulation of facts leads to learning with understanding [33]. The visual analytics resource that we evaluated was designed to support learning of the impact (low, moderate, modifier or high) of genomic sequence variants on transcript structure or protein function [46,47]. We informed the participants about the study procedures, which consisted of responding to four identical multiple-choice questions before and after interacting with a visual analytics resource for 10 to 15 min. We present the four questions used in the study in Table A1 of Appendix A. The consenting respondents were participants in a bioinformatics or bioinformatics-related educational activity in a higher education setting. We obtained the mean difference effect size of the unpaired groups (pre and post test scores) using estimation statistics and visualized the comparison using a Gardner–Altman estimation plot [48].
We also used the Systems Usability Scale (SUS) questionnaire to measure the perceived usability of the selected visual analytics resource [49,50]. Respondents completed the SUS questionnaire after interacting with the visual analytics resource. The SUS questionnaire consists of 10 questions, and the scoring system ranges from 0 to 100. The SUS can provide the reliable measurement of the perceived usability of a system using data from 8 to 12 respondents [50]. We used the web-based System Usability Scale Analysis Toolkit to analyze and generate visualizations of the SUS data [51]. The SUS questions adapted to use for the visual analytics resource are shown in Table A2 in Appendix A.

3. Results

3.1. Curated Datasets and Visual Analytics Resources

  • Datasets and visual analytics resources were produced from the content of the H3Africa PubMed Central (PMC) article PMC7759466. A Microsoft Excel file contained 25 datasets that were curated (recoded or reshaped) from the supplementary file of the H3Africa publication. We disseminated the three Tableau packaged workbook files via the Tableau Public website and the GitHub website. The supplementary materials section of this article contains details of the datasets and visual analytics resources. The first visual analytics file (pmc7759466_analytics.tbwx) contained a worksheet, dashboard and story designed for interacting with (1) statements from the PubMed Central article PMC7759466; (2) captions of figures in PMC7759466; (3) PMC7759466 Supplementary Tables 6–8, 19, 20 and 23; and (4) learning principles, namely five content types, adventure learning, data investigation cycle and knowledge visualization. The second visual analytics file (pmc7759466_data_investigations.tbwx) contained the designs for interacting with a list of datasets as well as the contents of (1) two supplementary methods; (2) Supplementary Tables 1–8; and (3) Supplementary Table 19. In some designs, additional fields were added from the content of a data field. In the third visual analytics file (pmc7759466_suppT19_variants.tbwx), the focus was on designs to facilitate the personalized learning of the concept of consequence of sequence variants (e.g., Single-Nucleotide Polymorphisms). Prior to the design in Tableau Desktop, a Tableau Prep flow file (pmc7759466_suppT19_variants.tlfx) was set up to construct a dataset from the Annotation data field in Supplementary Table 19 of PMC7759466. The values in the Ensembl database variables provided in the Annotation field included allele letter, gene identifier, transcript identifier, gene symbol, variant consequences and variant impacts.
In the sections below, we describe use cases of the visual analytics designs that support customization, individualization and adaptation in technology-enhanced personalized education. In each use case, we provide the following descriptions: (1) principle(s) of the personalization design(s); and (2) design objective and results.

3.2. Use Cases of Customization of Instruction and Individualization of Learning of Bioinformatics Content Using H3Africa Datasets

  • Principles of Customization Design and Individualization Design in Personalized Educational Technology. The principles of customization and individualization design are based on the framework of personalized education by Kucirkova et al. [8]. In customization design, the system supports the individual’s choices of the content to be learned, while in the individualization design, the individual makes the choice. Within the visual analytics resource, the customization design is performed first by the instructor, and subsequently, the learner performs the individualization design.
  • Customization Design Objective and Results. The objective of the customization design of the visual analytics resource was to present the learner with options to identify key genes contributing to the adaptive evolution of functions in populations as detected in the Composite Likelihood Ratio (CLR) statistic score [40,52]. The data sources were the recoded datasets from Supplementary Tables 6 and 8 of publication PMC7759466. The dashboard design (Figure 2) provides the learner with choices of population and Gene Ontology (GO) function terms as well as connection to the National Center for Biotechnology Information (NCBI) database search. The population groups provide geographic relevance for learning about the key genes. The customization design contains filters that support the choice of six population groups (Zambia, West, Nigeria, Cameroon, Botswana and Benin) and five gene ontology function terms (Immunity, Reproduction, Metabolism, DNA repair and Other).
  • Individualization Design Objective and Results. The top image of Figure 2 is an example of individualization, when the learner enters the gene symbol RNF135 in the NCBI search feature and returns 21 databases. The bottom image in Figure 2 is the result when the learner interacts with the visual analytics resource in the top image of Figure 2 and makes the choice to display key genes relevant to a population (BRN) in Nigeria. The result of the interaction includes two GO terms. The learner is interested in the pancreatic lipase gene (PNLIP) based on the NCBI search.

3.3. A Use Case of Adaptation in Personalized Learning by Collecting Performance Metrics during Actions in Visual Analytics Software

  • Principle of Adaptation Design in Personalized Educational Technology. In adaptation design in personalized education technology, the system makes the choice based on data patterns such as repeated behaviors and performance measures [8]. The adaptation design can have a diagnostic function to optimize the learning transaction strategies of the learner. The adaptation design requires the completion of both customization and individualization activities.
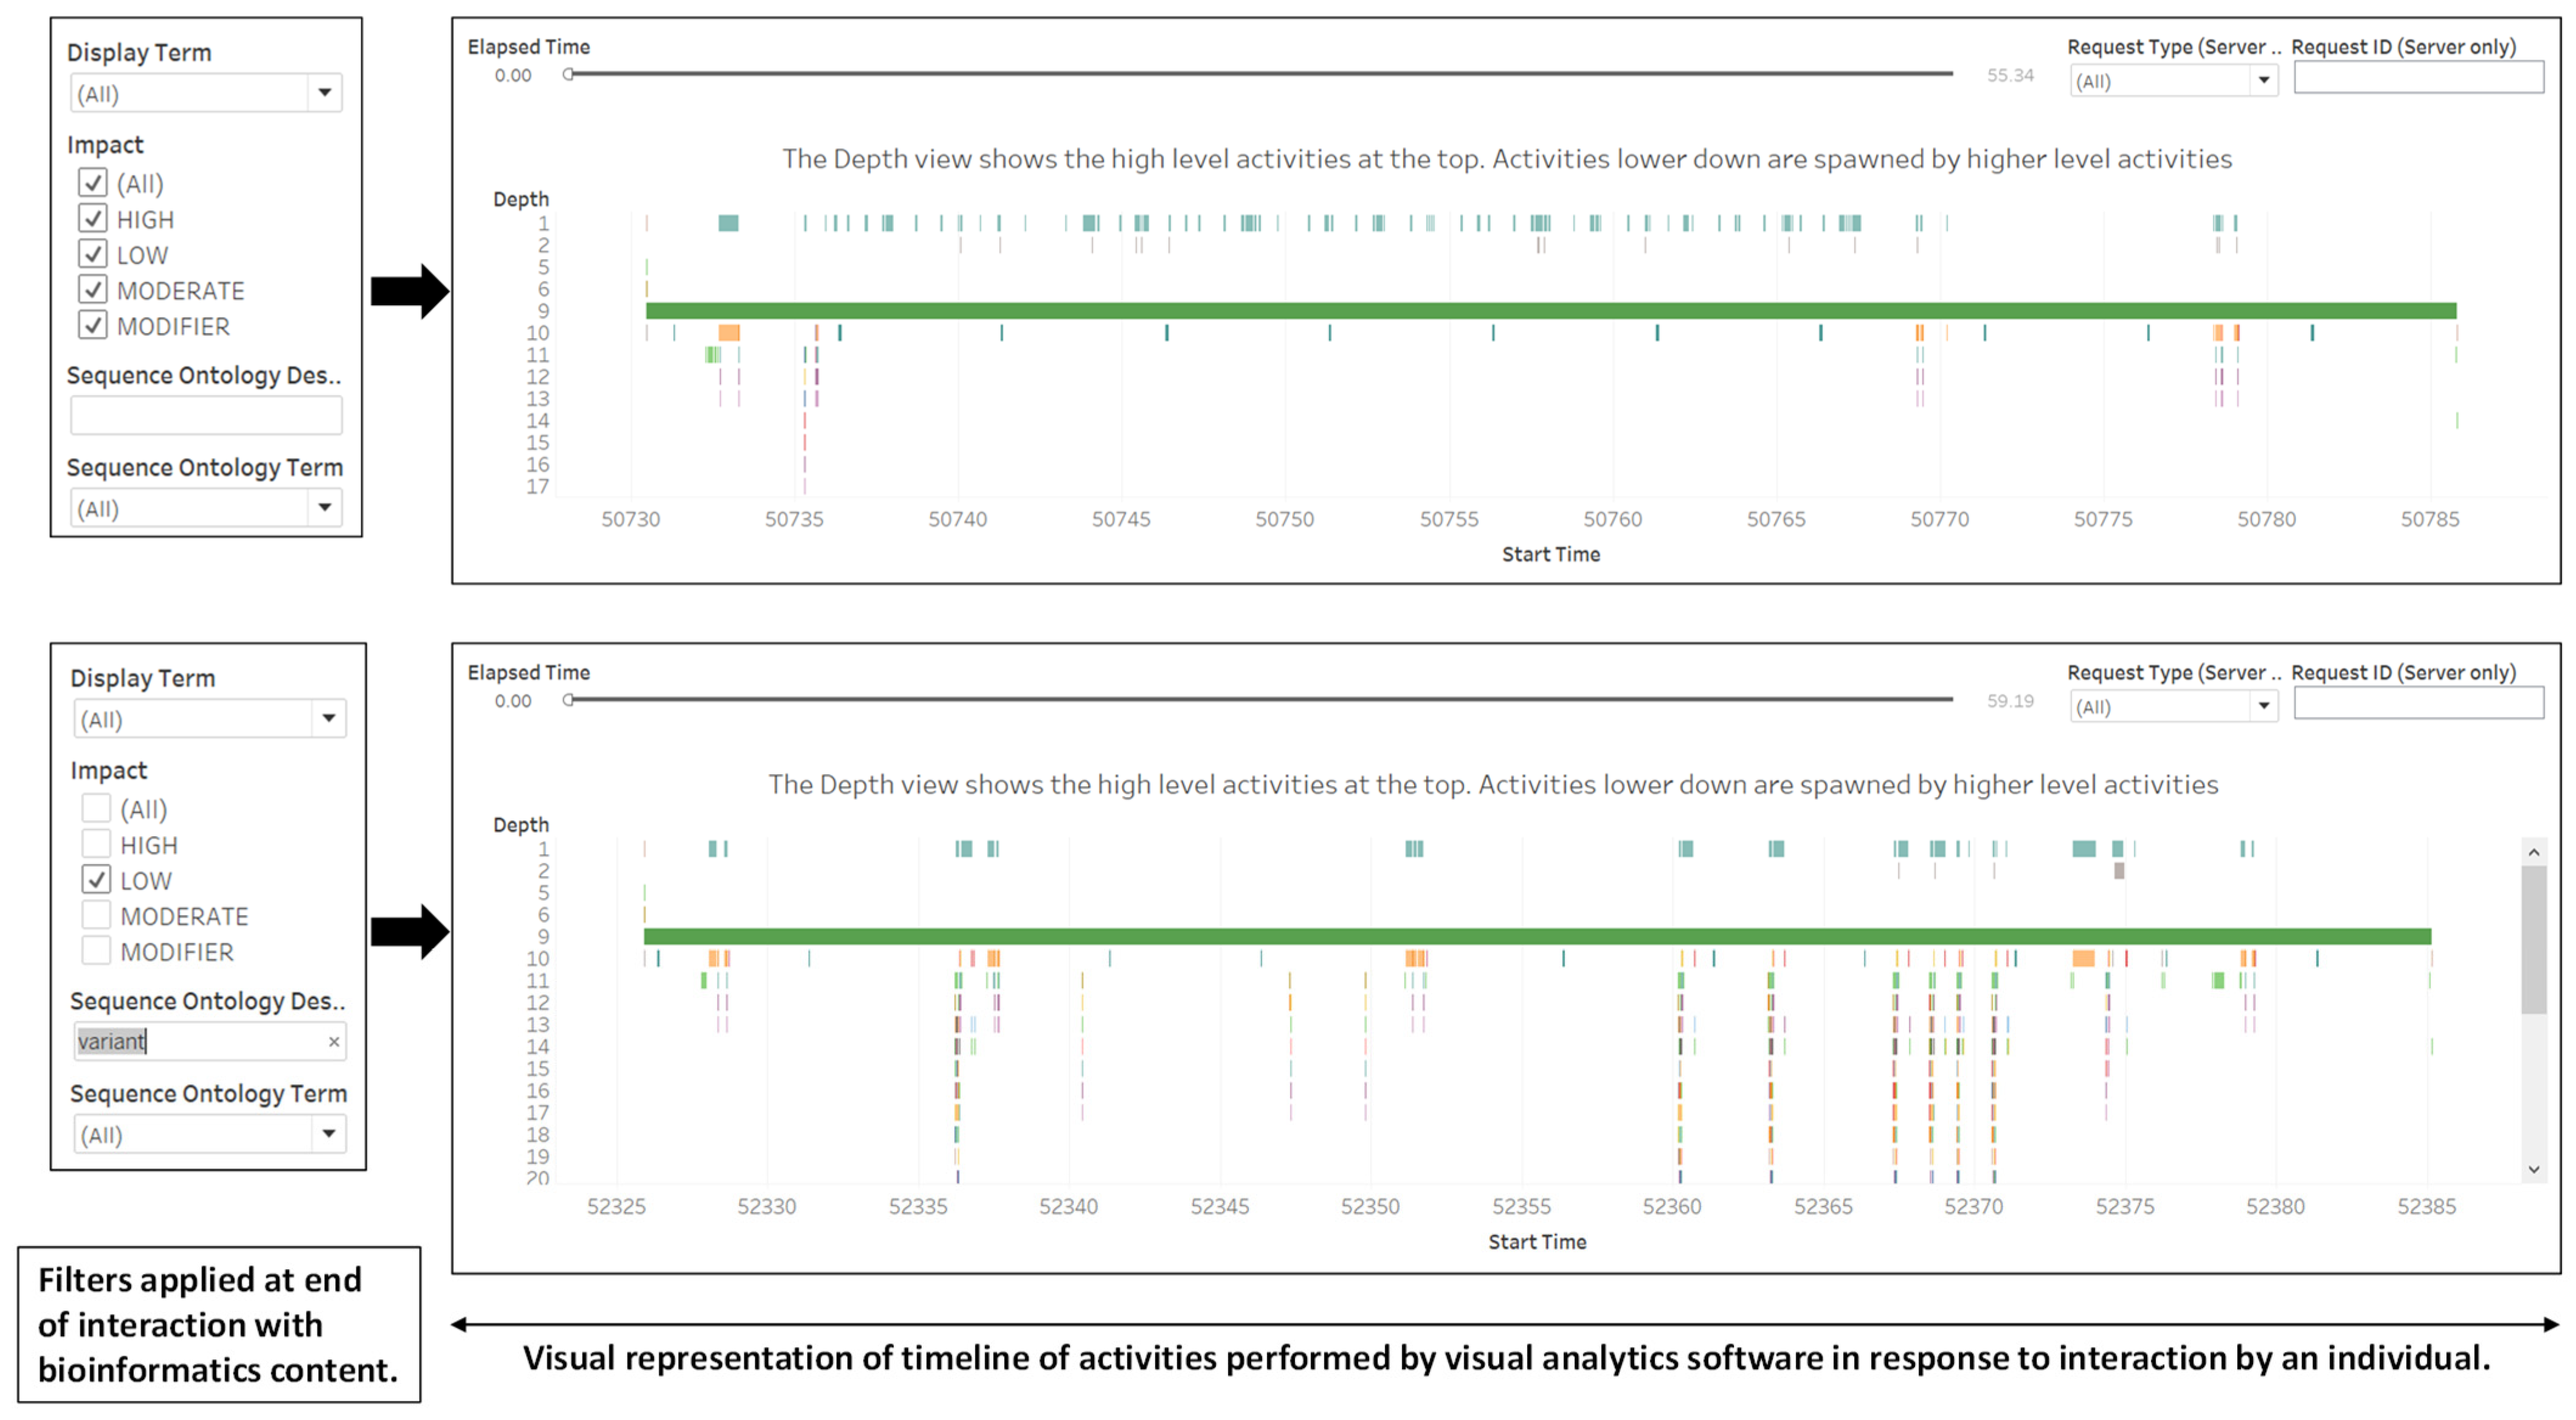
  • Adaptation Objective, Procedure and Results. The bioinformatics content for this use case is genomic variants, which are changes (insertions, deletions or replacements) in one allele of a gene of an individual compared with a reference genome [53,54]. There are at least 39 calculated consequences of genomic variations on transcripts or proteins that are located on the transcript structure [55]. The customization design in Figure 3 is a dashboard that consists of (1) a sequence ontology description and other descriptive features for sequence variants; (2) an image from the Ensembl website illustrating the location of sequence variants in the gene structure; (3) filters for specifying the sequence ontology descriptors. We applied the performance-recording function of Tableau Desktop (accessed via Help menu) to acquire data patterns of events performed by software in response to an individual’s requests (Figure 4). Patterns reported include the blending of data, computing layout, compile query, executing query, rendering, computing layout and sorting data. In Figure 4, the differences in the amount of interaction are displayed using performance metrics available in Tableau Desktop Professional [42]. The top image shows activities by the visual analytics resource that reflects that the learner did not make changes to the filters during the period of the interaction. In the bottom image, the performance metrics reflect that the learner changed the value of the impact and included text in the sequence ontology description.

3.4. Visual Analytics Support for Reading Strategies of Scholarly Articles in Personalized Bioinformatics Education

  • Principles of Reading Strategies. The reading strategies of skimming (seeking main ideas) and scanning (keyword search) can support the efficient and effective comprehension of online scholarly publications [56]. The growing number and expanding bioinformatics content of H3Africa scholarly publications [27] presents opportunities in personalized bioinformatics education to support readers of H3Africa publications to use reading strategies such as the skimming and scanning of knowledge (content) types [57]. When skimming, the reader seeks the main idea using the outline or table of contents in the text.
  • Reading Strategies Objective and Results. The objective of this use case on reading strategies is to demonstrate skimming and scanning reading strategies with a textual dataset. We used the recoded dataset of 381 statements from the H3Africa publication PMC7759466 [40], which included section headings, statement text and statement identifiers. We designed visual analytics worksheets to support skimming and scanning (Figure 5). When skimming, the reader can display the list of section headings to obtain the main ideas described in the article. The support for scanning allows the reader to search by keywords and retrieve statements that contain keywords as well as details on the context of use in one or more instances. The statement(s) retrieved can be the basis for an intensive reading strategy where the purpose is to obtain the exact understanding of the text [58].
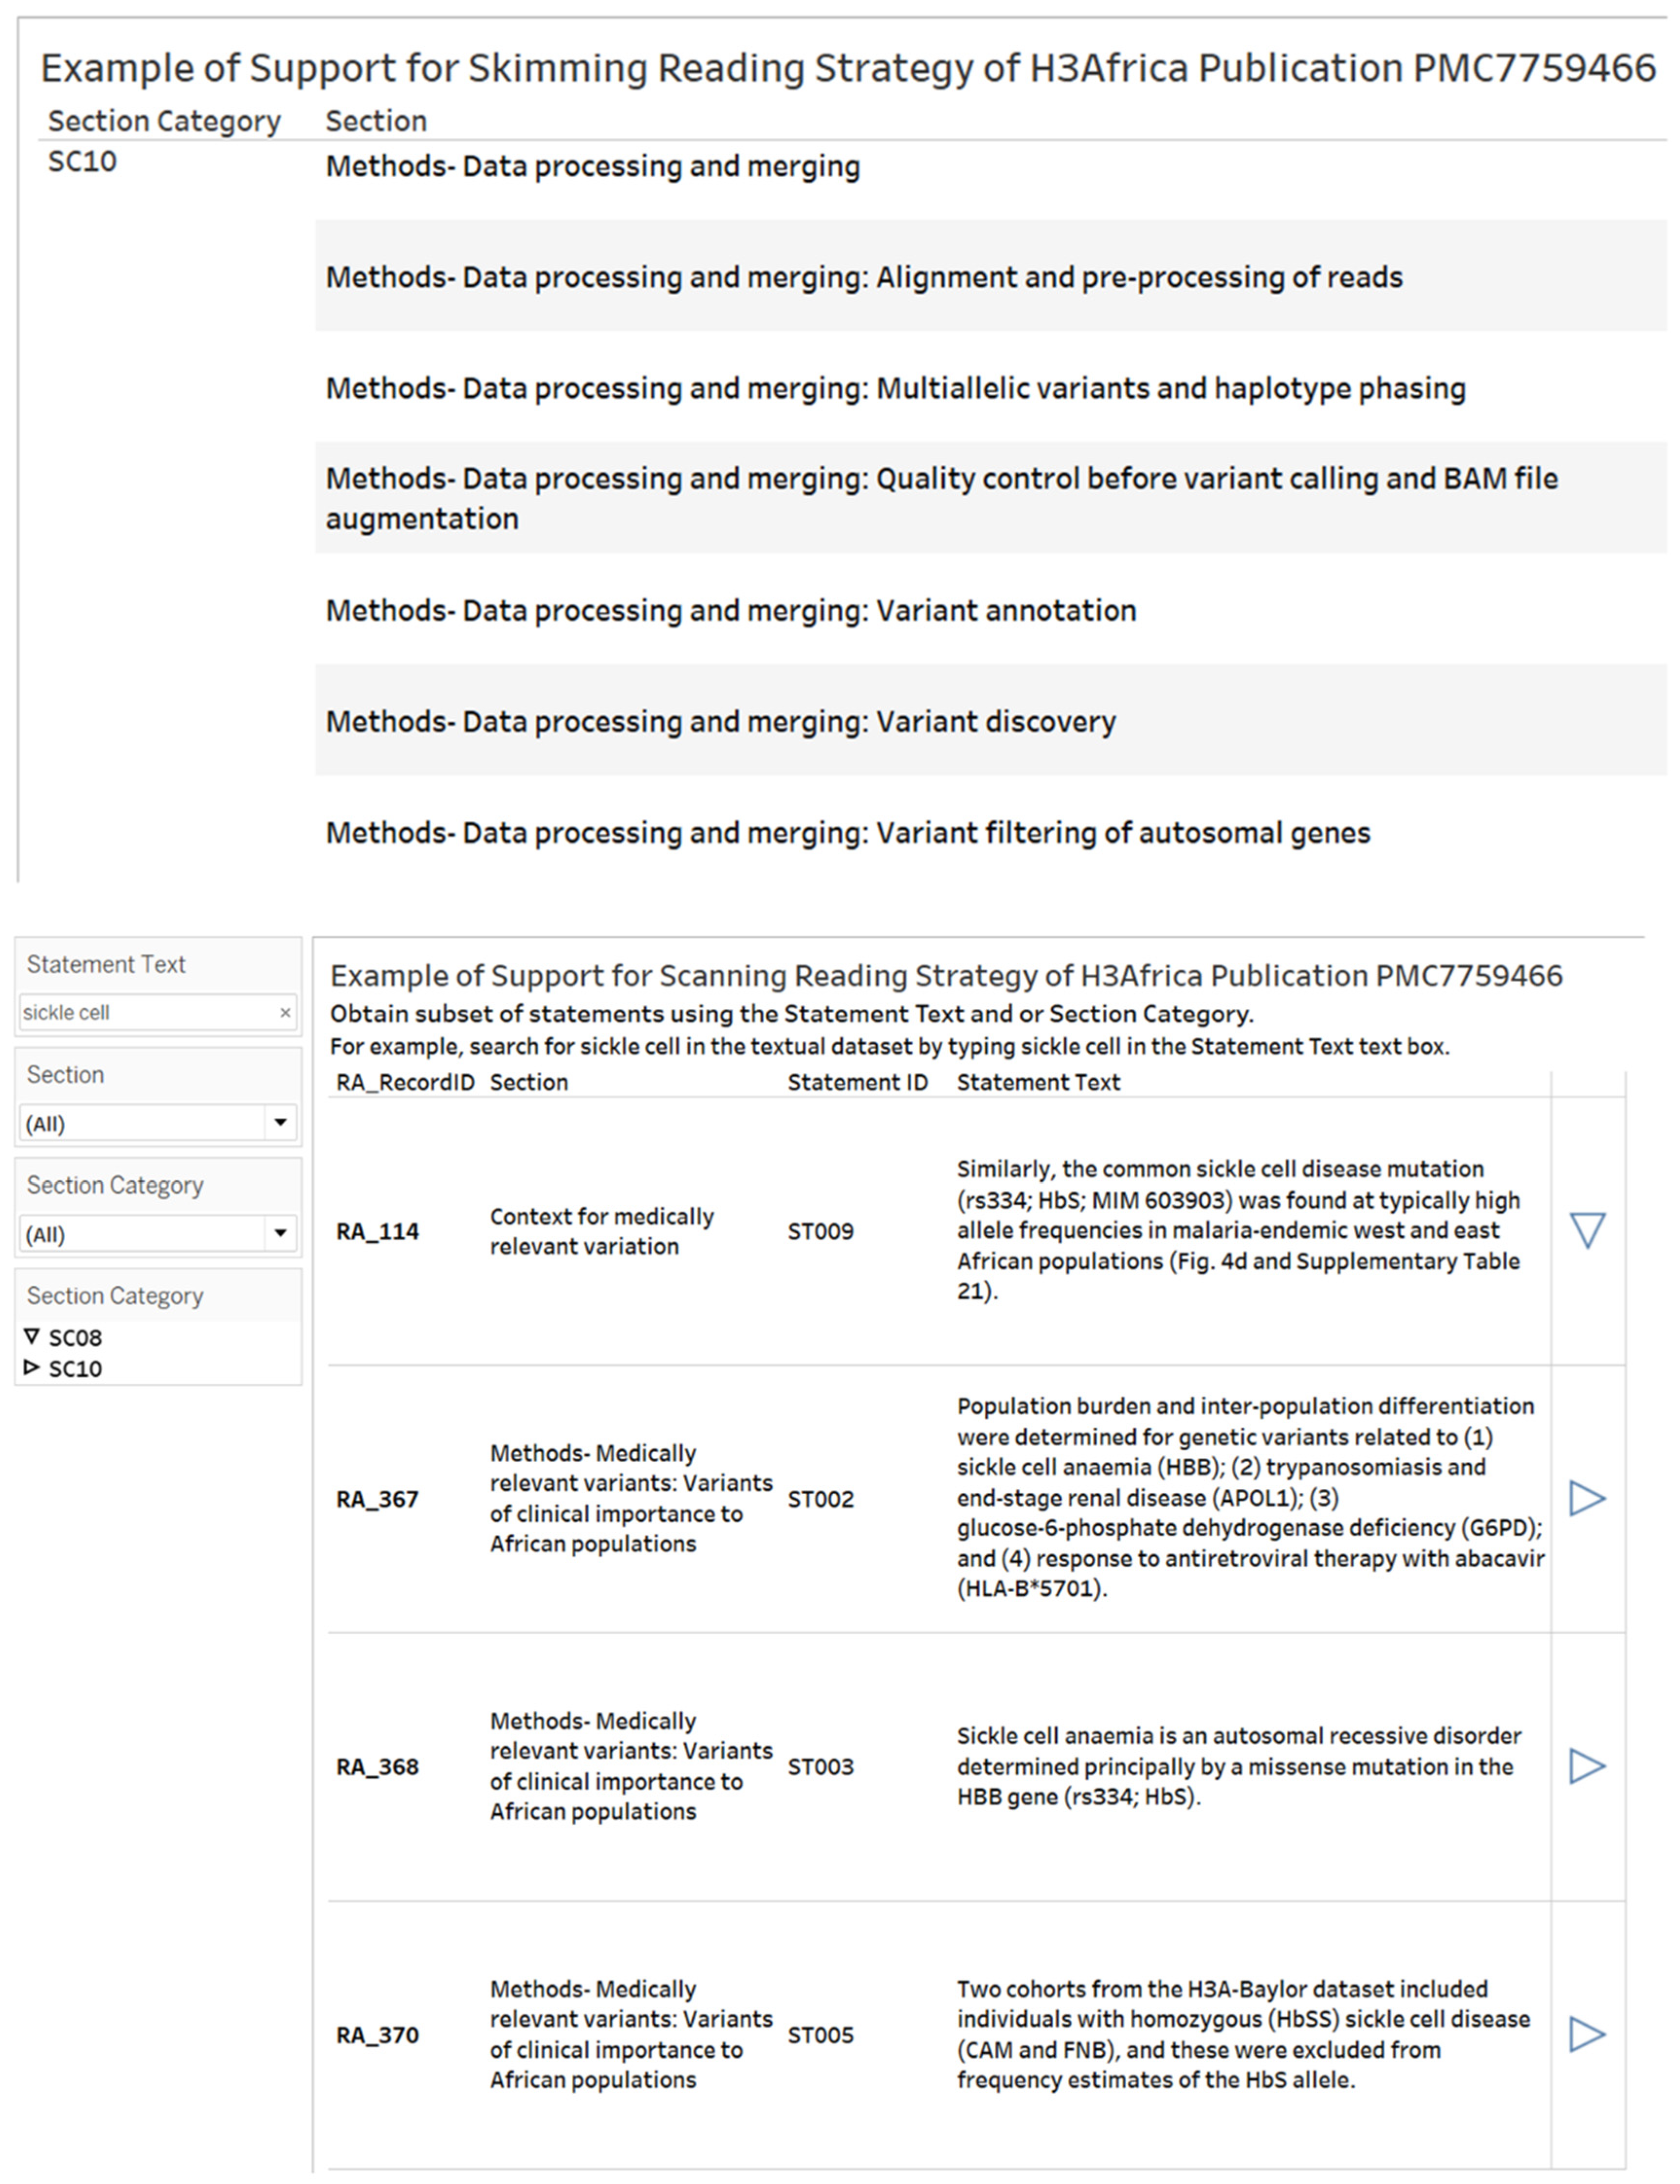
Figure 5. Examples of support for reading strategies of skimming and scanning for efficient and effective reading of H3Africa publication on genome-level variation in African populations. The top image shows visual analytics support for skimming the outline of the article. A subset of the bioinformatics methods is shown. The bottom image shows visual analytics support for scanning. The four statements that contain “sickle cell” are shown. The retrieved statements on sickle cell can be read to understand the use of diverse frameworks including the five content types, namely, fact, concept, process, procedure, and principle [59]. For example, statement RA_368 in the figure describes the concept of sickle cell anemia by the associated genome-level variation in missense mutation in the HBB (hemoglobin subunit beta) gene.
Education 12 00859 g005

3.5. Evaluation of Visual Analytics Resources

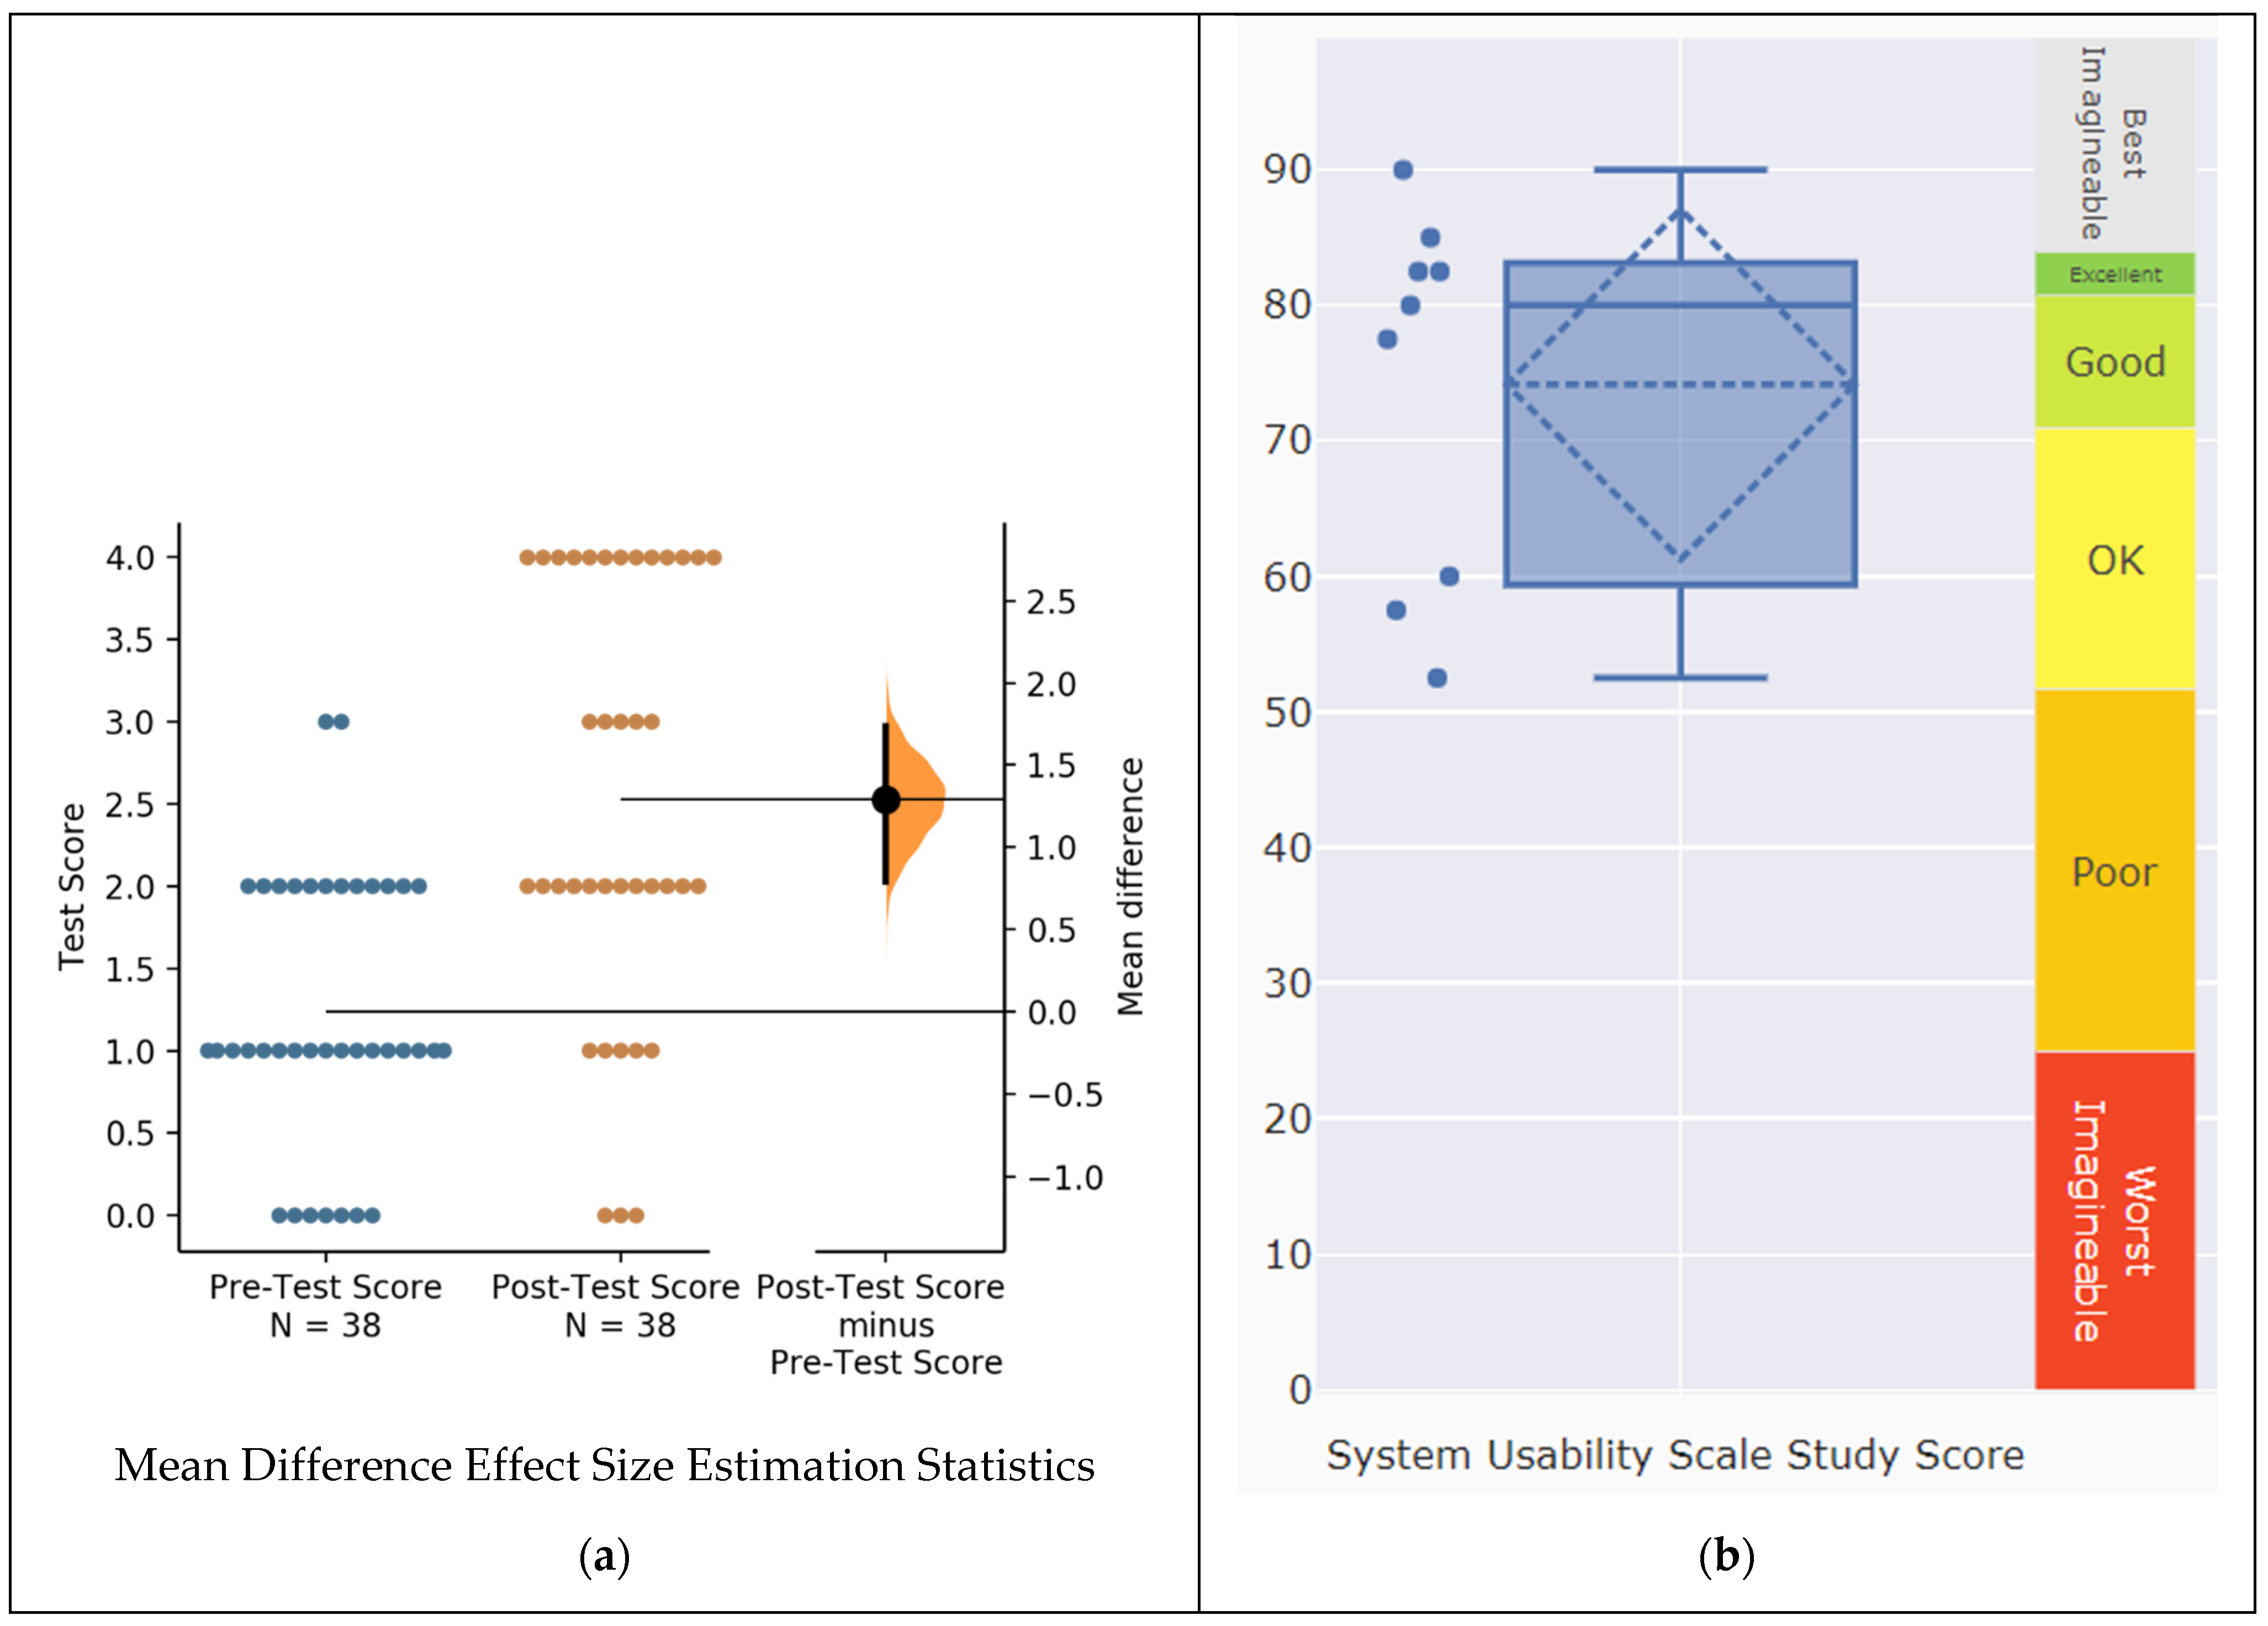
Our initial evaluation of visual analytics resources focused on a visual analytics resource designed to support the personalized learning of genomic sequence variants (Figure 3). The four questions for pre-test and post-test required the selection of the correct example of sequence variant impact in categories of low, moderate, modifier and high. Thirty-eight respondents completed the pre and post surveys. We determined the effect size measured by the mean difference of the two categories of scores (pre-test and post-test) for the 38 respondents (Figure 6a). We calculated the unpaired mean difference between pre-test scores and post-test scores as 1.29 [95.0%CI 0.789, 1.74] using the web-based estimation statistics software [48]. The p value of the two-sided permutation t-test was 0.0.
The analysis of the responses of nine respondents to the 10 questions from the System Usability Scale questionnaire generated a SUS Study Score of 74.17, a median of 80 and standard deviation of 12.91. The perceived usability was acceptable according to the web-based SUS Analysis Toolkit (Figure 6b) [51].

4. Discussion

Findings from systematic reviews have concluded that “personalized education is an attempt to improve the diagnosis, prediction, and treatment of learning outcomes alongside the prevention of learning losses” [60]. Learning outcomes in educational settings include long-term retention, the transfer of learning and desire/motivation for future learning or enrollment [37,61,62,63]. These learning outcomes are also relevant in bioinformatics education [30]. We implemented a research and design framework for personalized bioinformatics education that integrates features of customization, individualization and adaptation within a visual analytics software platform [8]. We selected visual analytics software as the digital platform technology for implementing personalized education because of the enormous and fast pattern perception capability of the human visual system [64]. Additionally, visual analytics software enables interaction designs (e.g., arranging, filtering, scrolling, selecting and sorting) [45], which support learner transactions with bioinformatics facts, concepts, process, procedures and principles. Visual analytics software supports speed-of-thought interaction and a sense of immediacy that reduces the time needed for knowledge generation [65,66]. We applied the instructional principles of five content types to support meaningful or robust learning outcomes such as long-term retention and learning transfer [59,61,62]. We identified the collection of H3Africa scholarly bioinformatics articles as a source of geographically relevant bioinformatics knowledge. There is an opportunity to incorporate and integrate cultural knowledge, technology and locational context to bioinformatics education in Africa, as recently demonstrated in the meaningful learning of chemistry in Africa [67].
Approaches to learner interest development in bioinformatics content are a priority to address the needs of the bioinformatics workforce [30]. Interest is “a person’s psychological state during engagement with some content, as well as the motivation to seek information and reengage with that content over time [68].” Personalized educational interventions have helped to increase the interest of learners [9]. We propose that incorporating the four stages of interest development (triggered situational interest, maintained situational interest, emerging individual interest and well-developed individual interest) [68] to bioinformatics education could help learners make meaningful connections to the bioinformatics content. H3Africa publications are authentic (real-world) Africa-centric educational resources, which can elicit situational interest, a heightened state of attention and increased engagement that could lead to the emergence of enduring individual interest [9]. Bioinformatics educators could use the curated datasets and visual analytics resources for students to seek bioinformatics information and engage with the bioinformatics content over time. Areas of future research could be how sustained engagement with authentic bioinformatics content help students to develop (1) confidence to investigate bioinformatics datasets; (2) bioinformatics disciplinary identity; and (3) bioinformatics careers intentions.
We have produced a unique set of twenty-five curated bioinformatics datasets from a major publication of the H3Africa consortium [40]. In reading processes, the human visual system detects and recognizes representations or patterns in image and grammatical units such as words, sentences and paragraphs. We designed the four visual analytics workbooks to include sheets with interactive tabular formats for the customization and individualization of personalized education. Learner performance is enhanced when interactions occur with appropriate representations [69]. Therefore, the data resources produced combined with the H3Africa article can be curriculum materials for diverse content, including human migration and genomics in populations in Africa. Engaging with the primary scientific literature through appropriate reading strategies and domain knowledge is an essential skill for successful careers in scientific fields, including bioinformatics [70,71]. The H3Africa publications include scholarly articles that are dense with bioinformatics content types and could be challenging for emerging researchers. A potential solution to alleviate the demands (such as high cognitive load and time) during the reading of bioinformatics is the visual-analytics-based presentation of journal article text combined with interpretation frameworks of the five content types [59]; the biological and applied mathematics landscapes [12] and the data–information–evidence–knowledge sequence [72]. We obtained evidence of the positive effect size and acceptable usability (Figure 6) of a visual analytics resource designed to support the personalized learning of the concept of functional consequences of sequence variants. The system usability scale [50,51] can be a rapid evaluation strategy of the visual analytics resources and the datasets that we developed. We propose that this set of questions can be used to evaluate the usability of the visual analytics resources reported in this article. The availability of web-based toolkits (such as https://mixality.de/sus-analysis-toolkit/ (accessed on 12 August 2022) [51] can help provide educators with feedback on the usability of the visual analytics resources and inform improvements.
Regarding the adaptation feature of personalized education, in Figure 4, the potential use of the performance recording option in Tableau software is illustrated [73]. We envision a potential use in personalized education, where the learner or learning facilitator can determine, from the timeline of events, the level of complexity of interactions and potential complex cognitive activities [45]. These computational measurements could be further investigated as a proxy for measuring the complexity of activities employed when interacting, representing or analyzing bioinformatics content in visual analytics software. We encourage additional research on how to interpret these performance measures. Sharing the learning performance can be helpful to learners and help learning facilitators to provide feedback on visual analytics solutions to data investigation problems.
The visual analytics resources produced by our research efforts have been disseminated via the Tableau Public website (https://public.tableau.com/app/profile/uibgnode (accessed on 12 August 2022). This dissemination allows individuals to acquire competencies for working with software that is general purpose and utilized in the workplace [74]. A potential limitation to the use of the visual analytics sheets is software costs. There are several approaches to overcome these concerns in educational settings, including free license keys for students and instructors. The free online Tableau Public website has online authoring. The views in the Tableau workbooks can be interacted with offline using the free Tableau Reader (https://www.tableau.com/products/reader (accessed on 12 August 2022)). Individuals or research teams with licenses for the Tableau Desktop Professional can modify the visual analytics design, work offline and incorporate their datasets of interest to the visual analytics workbooks. This approach could also be applied using other visual analytics or business intelligence tools [75].

5. Conclusions

We recoded, reshaped and visually represented textual and numerical datasets from a high-impact publication (PubMed Central Identifier: PMC7759466) on genomics in Africa. The designs of the visual analytics resources described supports features of personalized education including customization, individualization and adaptation. We conclude that technology-enhanced personalized bioinformatics educational interventions has implications in (1) the meaningful learning of bioinformatics; (2) stimulating additional student interest in bioinformatics; and (3) improving the accessibility of bioinformatics education to non-bioinformaticians.

Supplementary Materials

The following supporting information can be downloaded at: https://public.tableau.com/app/profile/uibgnode and https://github.com/uibgnode/pmc7759466_analytics.

Author Contributions

Conceptualization, A.U.M., O.S. and R.D.I.; methodology, A.U.M., O.S., K.B.E., A.M.D., J.L.M. and R.D.I.; software, A.U.M., O.S., K.B.E., A.M.D. and R.D.I.; validation, A.U.M., A.M.D. and R.D.I.; investigation, A.U.M., O.S., K.B.E., A.M.D., J.L.M. and R.D.I.; data curation, A.U.M., O.S., K.B.E., A.M.D., J.L.M. and R.D.I.; writing—original draft preparation, A.U.M., O.S. and R.D.I.; writing—review and editing, A.U.M., O.S., K.B.E., A.M.D., J.L.M. and R.D.I.; supervision, A.U.M., O.S. and R.D.I.; project administration, A.U.M., O.S. and R.D.I.; funding acquisition, A.U.M. and R.D.I.; All authors have read and agreed to the published version of the manuscript.

Funding

This research was funded by (1) National Institutes of Health, grant number U41HG006941; (2) National Science Foundation, grant number EHR-1435186, EHR-1623371, EHR-1626602, EHR-2029363 and CSE-1829717; (3) United States Department of Education, grant number P031B170091.

Institutional Review Board Statement

The study of the effectiveness and perceived usability of the visual analytics resources was conducted in accordance with the Declaration of Helsinki, and approved by the Bethune-Cookman University Institutional Review Board (B-CU IRB) (protocol code 876 and date of approval: 6 October 2022).

Informed Consent Statement

Informed consent was obtained from all subjects involved in the study.

Data Availability Statement

Spreadsheet and visual analytics files can be downloaded at: https://github.com/uibgnode/pmc7759466_analytics (accessed on 12 August 2022).

Acknowledgments

The authors acknowledge the suggestions of the leadership of the H3Africa Bioinformatics Network (H3ABioNet); the members of the H3ABioNet Training and Education Work Package; and the participants during events that helped inform the activities of the H3ABioNet Train-the-Trainer project.

Conflicts of Interest

The authors declare no conflict of interest. The funders or the H3Africa Initiative had no role in the design of the study; in the collection, analyses, or interpretation of data; in the writing of the manuscript; or in the decision to publish the results.

Appendix A

The evaluation of the visual analytics resource followed a pre-test and post-test design. In Table A1, we provide the four questions in the tests and the associated multiple-choice options and correct answer. We provided the multiple-choice questions to learners as an online form constructed with Google Forms. The visual analytics resource (Figure 3) supports the retrieval of the answers to the questions on the consequences of genomic sequence variants on transcript structure and protein. There are 36 genomic variant terms and four impacts (low, moderate, modifier and high). Additionally, the quiz resource would provide immediate feedback on responses as well as shuffle or randomize questions so that no two learners would receive the same questions in same order.
Table A1. The questions, multiple-choice answers and correct answers for pre-test and post-test used to evaluate the effectiveness of the visual analytics resource *.
QuestionMultiple-Choice AnswersCorrect Answer
An example of low impact sequence variant is:A. Frameshift variants
B. Start lost
C. Protein altering variant
D. Stop retained variant
An example of moderate impact sequence variant is:A. Protein altering variant
B. Regulatory region amplification
C. Splice region variant
D. 3 prime UTR variant
A. Protein altering variant
An example of modifier impact sequence variant is:A. Missense variant
B. Coding sequence variant
C. Synonymous variant
D. Start lost
B. Coding sequence variant
An example of high impact sequence variant is:A. Synonymous variant
B. Transcript ablation
C. Regulatory region ablation
D. Feature elongation
B. Transcript ablation
* The visual analytics resource (available at https://tabsoft.co/3SCIIaZ (accessed on 12 August 2022)) was designed to support learning of the impacts of genomic sequence variants on transcript structure and protein function.
The 10 questions from the System Usability Scale [50,51] were adapted by changing the word system to the visual analytics resource (Table A2).
Table A2. The adapted questions for evaluating the usability of a visual analytics learning resource.
Adapted Questions from the System Usability Scale
1. I think that I would like to use this visual analytics resource frequently.
2. I found the visual analytics resource unnecessarily complex.
3. I thought the visual analytics resource was easy to use.
4. I think that I would need the support of a technical person to be able to use this visual analytics resource.
5. I found the various functions in this visual analytics resource were well integrated.
6. I thought there was too much inconsistency in this visual analytics resource.
7. I would imagine that most people would learn to use this visual analytics resource very quickly.
8. I found the visual analytics resource very cumbersome to use.
9. I felt very confident using the visual analytics resource.
10. I needed to learn a lot of things before I could get going with this visual analytics resource.

References

  1. Gamage, K.A.; Silva, E.K.D.; Gunawardhana, N. Online delivery and assessment during COVID-19: Safeguarding academic integrity. Educ. Sci. 2020, 10, 301. [Google Scholar] [CrossRef]
  2. Aristovnik, A.; Keržič, D.; Ravšelj, D.; Tomaževič, N.; Umek, L. Impacts of the COVID-19 pandemic on life of higher education students: A global perspective. Sustainability 2020, 12, 8438. [Google Scholar] [CrossRef]
  3. Ceesay, E.K. Potential impact of COVID-19 outbreak on education, staff development and training in Africa. Res. Glob. 2021, 3, 100049. [Google Scholar] [CrossRef]
  4. Zancajo, A.; Verger, A.; Bolea, P. Digitalization and beyond: The effects of COVID-19 on post-pandemic educational policy and delivery in Europe. Policy Soc. 2022, 41, 111–128. [Google Scholar] [CrossRef]
  5. Gera, R.; Tick, S.; Saxena, A. CHUNK Learning: A Tool that Supports Personalized Education. In Proceedings of the 15th International Conference on Educational Data Mining, Durham, UK, 24–27 July 2022. [Google Scholar]
  6. Zhao, Y.; Watterston, J. The changes we need: Education post COVID-19. J. Educ. Chang. 2021, 22, 3–12. [Google Scholar] [CrossRef]
  7. Polikoff, M.S. Lessons for Improving Curriculum from the COVID–19 Pandemic. Center on Reinventing Public Education. 2022. Available online: https://crpe.org/lessons-for-improving-curriculum-from-the-covid-19-pandemic (accessed on 12 August 2022).
  8. Kucirkova, N.; Gerard, L.; Linn, M.C. Designing personalised instruction: A research and design framework. Br. J. Educ. Technol. 2021, 52, 1839–1861. [Google Scholar] [CrossRef]
  9. Reber, R.; Canning, E.A.; Harackiewicz, J.M. Personalized education to increase interest. Curr. Dir. Psychol. Sci. 2018, 27, 449–454. [Google Scholar] [CrossRef]
  10. Bernacki, M.L.; Walkington, C. The role of situational interest in personalized learning. J. Educ. Psychol. 2018, 110, 864. [Google Scholar] [CrossRef]
  11. Bayat, A. Science, medicine, and the future: Bioinformatics. Br. Med. J. 2002, 324, 1018–1023. [Google Scholar] [CrossRef]
  12. Cohen, J.E. Mathematics is biology’s next microscope, only better; biology is mathematics’ next physics, only better. PLoS Biol. 2004, 2, e439. [Google Scholar] [CrossRef]
  13. Santos, R.A.C.D.; Verli, H.; Minardi, R.C.d.M. Editorial: Original strategies for training and educational initiatives in bioinformatics. Front. Educ. 2022, 7, 1003098. [Google Scholar] [CrossRef]
  14. Mulder, N.; Schwartz, R.; Brazas, M.D.; Brooksbank, C.; Gaeta, B.; Morgan, S.L.; Pauley, M.A.; Rosenwald, A.; Rustici, G.; Sierk, M. The development and application of bioinformatics core competencies to improve bioinformatics training and education. PLoS Comput. Biol. 2018, 14, e1005772. [Google Scholar] [CrossRef] [PubMed] [Green Version]
  15. Zhan, Y.A.; Wray, C.G.; Namburi, S.; Glantz, S.T.; Laubenbacher, R.; Chuang, J.H. Fostering bioinformatics education through skill development of professors: Big Genomic Data Skills Training for Professors. PLoS Comput. Biol. 2019, 15, e1007026. [Google Scholar] [CrossRef] [Green Version]
  16. Ali, M.M.; Hamid, M.; Saleem, M.; Malik, S.; Mian, N.A.; Ihsan, M.A.; Tabassum, N.; Mehmood, K.; Awan, F. Status of bioinformatics education in South Asia: Past and present. BioMed Res. Int. 2021, 2021, 5568262. [Google Scholar] [CrossRef]
  17. 1000 Genomes Project Consortium. A map of human genome variation from population scale sequencing. Nature 2010, 467, 1061. [Google Scholar] [CrossRef] [PubMed] [Green Version]
  18. Gudmundsson, S.; Singer-Berk, M.; Watts, N.A.; Phu, W.; Goodrich, J.K.; Solomonson, M.; Consortium, G.A.D.; Rehm, H.L.; MacArthur, D.G.; O’Donnell-Luria, A. Variant interpretation using population databases: Lessons from gnomAD. Hum. Mutat. 2022, 43, 1012–1030. [Google Scholar] [CrossRef] [PubMed]
  19. Gao, P. Using personalized education to take the place of standardized education. J. Educ. Train. Stud. 2014, 2, 44–47. [Google Scholar] [CrossRef]
  20. Kehrer, J.; Hauser, H. Visualization and visual analysis of multifaceted scientific data: A survey. IEEE Trans. Vis. Comput. Graph. 2012, 19, 495–513. [Google Scholar] [CrossRef]
  21. H3Africa Consortium. Enabling the genomic revolution in Africa: H3Africa is developing capacity for health-related genomics research in Africa. Sci. (N. Y. NY) 2014, 344, 1346. [Google Scholar] [CrossRef] [Green Version]
  22. Rotimi, C.N. Enabling Genomic Revolution in Africa. In The Genetics of African Populations in Health and Disease; Ibrahim, M.E., Rotimi, C.N., Eds.; Cambridge University Press: Cambridge, UK, 2019; pp. 320–330. [Google Scholar]
  23. Fatumo, S.; Yakubu, A.; Oyedele, O.; Popoola, J.; Attipoe, D.A.; Eze-Echesi, G.; Modibbo, F.Z.; Ado-Wanka, N.; Salako, O.; Nashiru, O. Promoting the genomic revolution in Africa through the Nigerian 100K Genome Project. Nat. Genet. 2022, 54, 531–536. [Google Scholar] [CrossRef]
  24. Mulder, N.; Abimiku, A.l.; Adebamowo, S.N.; de Vries, J.; Matimba, A.; Olowoyo, P.; Ramsay, M.; Skelton, M.; Stein, D.J. H3Africa: Current perspectives. Pharm. Pers. Med. 2018, 11, 59. [Google Scholar] [CrossRef] [PubMed] [Green Version]
  25. Ramsay, M. African genomic data sharing and the struggle for equitable benefit. Patterns 2022, 3, 100412. [Google Scholar] [CrossRef] [PubMed]
  26. H3Africa Consortium. H3Africa Publications. Available online: https://h3africa.org/index.php/resource/publication-2/ (accessed on 30 June 2022).
  27. Choudhury, A.; Sengupta, D.; Aron, S.; Ramsay, M. The H3Africa Consortium: Publication Outputs of a Pan-African Genomics Collaboration (2013 to 2020). In Africa, the Cradle of Human Diversity; Fortes-Lima, C., Mtetwa, E., Schlebusch, C., Eds.; Brill: Leiden, The Netherlands, 2021; pp. 257–304. [Google Scholar]
  28. Mariano, D.; Martins, P.; Helene Santos, L.; de Melo-Minardi, R.C. Introducing programming skills for life science students. Biochem. Mol. Biol. Educ. 2019, 47, 288–295. [Google Scholar] [CrossRef]
  29. Nunes, R.; Barbosa de Almeida Júnior, E.; Pessoa Pinto de Menezes, I.; Malafaia, G. Learning nucleic acids solving by bioinformatics problems. Biochem. Mol. Biol. Educ. 2015, 43, 377–383. [Google Scholar] [CrossRef] [PubMed]
  30. Magana, A.J.; Taleyarkhan, M.; Alvarado, D.R.; Kane, M.; Springer, J.; Clase, K. A survey of scholarly literature describing the field of bioinformatics education and bioinformatics educational research. CBE—Life Sci. Educ. 2014, 13, 607–623. [Google Scholar] [CrossRef] [Green Version]
  31. Bateman, A.; Lengauer, T. Editorial. Bioinform. Adv. 2021, 1, vbab001. [Google Scholar] [CrossRef]
  32. Peng, H.; Bateman, A.; Valencia, A.; Wren, J.D. Bioimage informatics: A new category in Bioinformatics. Bioinformatics 2012, 28, 1057. [Google Scholar] [CrossRef] [Green Version]
  33. Michael, J.A. Mental models and meaningful learning. J. Vet. Med. Educ. 2004, 31, 1–5. [Google Scholar] [CrossRef]
  34. Mayer, R.E. Rote versus meaningful learning. Theory Into Pract. 2002, 41, 226–232. [Google Scholar] [CrossRef]
  35. Karpicke, J.D.; Grimaldi, P.J. Retrieval-based learning: A perspective for enhancing meaningful learning. Educ. Psychol. Rev. 2012, 24, 401–418. [Google Scholar] [CrossRef]
  36. Fan, K.-K.; Xiao, P.-w.; Su, C. The effects of learning styles and meaningful learning on the learning achievement of gamification health education curriculum. Eurasia J. Math. Sci. Technol. Educ. 2015, 11, 1211–1229. [Google Scholar]
  37. Carvalho, P.; Rachatasumrit, N.; Koedinger, K.R. Learning depends on knowledge: The benefits of retrieval practice vary for facts and skills. In Proceedings of the 44th Annual Meeting of the Cognitive Science Society, Toronto, ON, Canada, 27–30 July 2022; pp. 170–175. [Google Scholar]
  38. Tawfik, A.A.; Gatewood, J.; Gish-Lieberman, J.J.; Hampton, A.J. Toward a definition of learning experience design. Technol. Knowl. Learn. 2022, 27, 309–334. [Google Scholar] [CrossRef]
  39. Smith, M.A.; Karpicke, J.D. Retrieval practice with short-answer, multiple-choice, and hybrid tests. Memory 2014, 22, 784–802. [Google Scholar] [CrossRef] [PubMed]
  40. Choudhury, A.; Aron, S.; Botigué, L.R.; Sengupta, D.; Botha, G.; Bensellak, T.; Wells, G.; Kumuthini, J.; Shriner, D.; Fakim, Y.J. High-depth African genomes inform human migration and health. Nature 2020, 586, 741–748. [Google Scholar] [CrossRef] [PubMed]
  41. Isokpehi, R.D.; Johnson, C.P.; Tucker, A.N.; Gautam, A.; Brooks, T.J.; Johnson, M.O.; Cozart, T.; Wathington, D.J. Integrating datasets on public health and clinical aspects of sickle cell disease for effective community-based research and practice. Diseases 2020, 8, 39. [Google Scholar] [CrossRef] [PubMed]
  42. Beard, L.; Aghassibake, N. Tableau (version 2020.3). J. Med. Libr. Assoc. JMLA 2021, 109, 159. [Google Scholar] [CrossRef]
  43. Saragih, W.; Natalia, C.H. Types of sentences used by male and female writers in journal article abstracts. J. BAHAS. 2020, 31, 227–244. [Google Scholar] [CrossRef]
  44. Isokpehi, R.; Johnson, M.O.; Campos, B.; Sanders, A.; Cozart, T.; Harvey, I.S. Knowledge visualizations to inform decision making for improving food accessibility and reducing obesity rates in the United States. Int. J. Environ. Res. Public Health 2020, 17, 1263. [Google Scholar] [CrossRef] [Green Version]
  45. Sedig, K.; Parsons, P. Interaction design for complex cognitive activities with visual representations: A pattern-based approach. AIS Trans. Hum.-Comput. Interact. 2013, 5, 84–133. [Google Scholar] [CrossRef] [Green Version]
  46. Cunningham, F.; Moore, B.; Ruiz-Schultz, N.; Ritchie, G.R.; Eilbeck, K. Improving the sequence ontology terminology for genomic variant annotation. J. Biomed. Semant. 2015, 6, 1–5. [Google Scholar] [CrossRef] [Green Version]
  47. Hunt, S.E.; Moore, B.; Amode, R.M.; Armean, I.M.; Lemos, D.; Mushtaq, A.; Parton, A.; Schuilenburg, H.; Szpak, M.; Thormann, A. Annotating and prioritizing genomic variants using the Ensembl Variant Effect Predictor—A tutorial. Hum. Mutat. 2022, 43, 986–997. [Google Scholar] [CrossRef] [PubMed]
  48. Ho, J.; Tumkaya, T.; Aryal, S.; Choi, H.; Claridge-Chang, A. Moving beyond p values: Data analysis with estimation graphics. Nat. Methods 2019, 16, 565–566. [Google Scholar] [CrossRef] [PubMed]
  49. Vlachogianni, P.; Tselios, N. Perceived usability evaluation of educational technology using the System Usability Scale (SUS): A systematic review. J. Res. Technol. Educ. 2022, 54, 392–409. [Google Scholar] [CrossRef]
  50. Brooke, J. SUS: A retrospective. J. Usability Stud. 2013, 8, 29–40. [Google Scholar]
  51. Blattgerste, J.; Behrends, J.; Pfeiffer, T. A Web-Based Analysis Toolkit for the System Usability Scale. In Proceedings of the 15th International Conference on PErvasive Technologies Related to Assistive Environments, Corfu, Greece, 29 June–1 July 2022; pp. 237–246. [Google Scholar]
  52. Vy, H.M.T.; Kim, Y. A composite-likelihood method for detecting incomplete selective sweep from population genomic data. Genetics 2015, 200, 633–649. [Google Scholar] [CrossRef] [PubMed] [Green Version]
  53. Jamuar, S.S.; Walsh, C.A. Genomic variants and variations in malformations of cortical development. Pediatr. Clin. 2015, 62, 571–585. [Google Scholar] [CrossRef] [PubMed] [Green Version]
  54. Geraci, F.; Massidda, R.; Pisanti, N. Technology and species independent simulation of sequencing data and genomic variants. In Proceedings of the 2019 IEEE 19th International Conference on Bioinformatics and Bioengineering (BIBE), Athens, Greece, 28–30 October 2022; pp. 138–145. [Google Scholar]
  55. McLaren, W.; Gil, L.; Hunt, S.E.; Riat, H.S.; Ritchie, G.R.; Thormann, A.; Flicek, P.; Cunningham, F. The ensembl variant effect predictor. Genome Biol. 2016, 17, 122. [Google Scholar] [CrossRef] [Green Version]
  56. Nguyen, T.M.N. The Essential Roles of Skimming and Scanning Techniques in Teaching Reading Comprehension. Available online: http://nnkt.ueh.edu.vn/wp-content/uploads/2015/07/20.pdf (accessed on 12 August 2022).
  57. Maxwell, M.J. Skimming and scanning improvement: The needs, assumptions and knowledge base. J. Read. Behav. 1972, 5, 47–59. [Google Scholar] [CrossRef] [Green Version]
  58. Berardo, S.A. The use of authentic materials in the teaching of reading. Read. Matrix 2006, 6, 60–69. [Google Scholar]
  59. Clark, R.; Harrelson, G.L. Designing instruction that supports cognitive learning processes. J. Athl. Train. 2002, 37, S-152–S-159. [Google Scholar]
  60. Bhutoria, A. Personalized education and artificial intelligence in United States, China, and India: A systematic review using a Human-In-The-Loop model. Comput. Educ. Artif. Intell. 2022, 3, 100068. [Google Scholar] [CrossRef]
  61. Koedinger, K.R.; Corbett, A.T.; Perfetti, C. The Knowledge-Learning-Instruction framework: Bridging the science-practice chasm to enhance robust student learning. Cogn. Sci. 2012, 36, 757–798. [Google Scholar] [CrossRef]
  62. Koedinger, K.R.; Booth, J.L.; Klahr, D. Instructional complexity and the science to constrain it. Science 2013, 342, 935–937. [Google Scholar] [CrossRef] [PubMed]
  63. Karpicke, J.D.; Butler, A.C.; Roediger, H.L., III. Metacognitive strategies in student learning: Do students practise retrieval when they study on their own? Memory 2009, 17, 471–479. [Google Scholar] [CrossRef] [PubMed]
  64. Ware, C. Perception & Data Visualization: The Foundations of Experimental Semiotics. In Proceedings of the Graphics Interface ’98, Vancouver, BC, Canada, 18–20 June 1998; pp. 92–98. [Google Scholar]
  65. Sacha, D.; Stoffel, A.; Stoffel, F.; Kwon, B.C.; Ellis, G.; Keim, D.A. Knowledge generation model for visual analytics. IEEE Trans. Vis. Comput. Graph. 2014, 20, 1604–1613. [Google Scholar] [CrossRef] [PubMed]
  66. Jern, M.; Franzen, J. “GeoAnalytics”—Exploring spatio-temporal and multivariate data. In Proceedings of the Tenth International Conference on Information Visualisation (IV’06), London, UK, 5–7 July 2006; pp. 25–31. [Google Scholar]
  67. Oladejo, A.I.; Okebukola, P.A.; Olateju, T.T.; Akinola, V.O.; Ebisin, A.; Dansu, T.V. In search of culturally responsive tools for meaningful learning of chemistry in Africa: We stumbled on the culturo-techno-contextual approach. J. Chem. Educ. 2022, 99, 2919–2931. [Google Scholar] [CrossRef]
  68. Renninger, K.A.; Hidi, S.E. To level the playing field, develop interest. Policy Insights Behav. Brain Sci. 2020, 7, 10–18. [Google Scholar] [CrossRef]
  69. Ainsworth, S. DeFT: A conceptual framework for considering learning with multiple representations. Learn. Instr. 2006, 16, 183–198. [Google Scholar] [CrossRef]
  70. Nelms, A.A.; Segura-Totten, M. Expert–novice comparison reveals pedagogical implications for students’ analysis of primary literature. CBE—Life Sci. Educ. 2019, 18, ar56. [Google Scholar] [CrossRef] [PubMed]
  71. Stengel, A.; Stanke, K.M.; McPherson, M.R.; Drijber, R.A. Virtually engaging students through collaborative investigation of scientific literature, a case study. Nat. Sci. Educ. 2021, 50, e20051. [Google Scholar] [CrossRef]
  72. Dammann, O. Data, information, evidence, and knowledge: A proposal for health informatics and data science. Online J. Public Health Inform. 2018, 10, e224. [Google Scholar] [CrossRef] [PubMed]
  73. Eldridge, A. Best Practices for Designing Efficient Tableau Workbooks. Available online: https://www.tableau.com/learn/whitepapers/designing-efficient-workbooks (accessed on 12 August 2022).
  74. Dent, H.L.; Jo White, B.; Kapakos, W.A.; Fulk, H.K. Widen the big tent for big data: Understanding business student perceptions of Tableau. Issues Inf. Syst. 2021, 22, 49–58. [Google Scholar]
  75. Richardson, J.; Sallam, R.; Schlegel, K.; Kronz, A.; Sun, J. Magic Quadrant for Analytics and Business Intelligence Platforms; Gartner: Stamford, CT, USA, 2020; Available online: https://b2bsalescafe.files.wordpress.com/2020/04/gartner-magic-quadrant-for-analytics-and-business-intelligence-platforms-feb-2020.pdf (accessed on 12 August 2022).
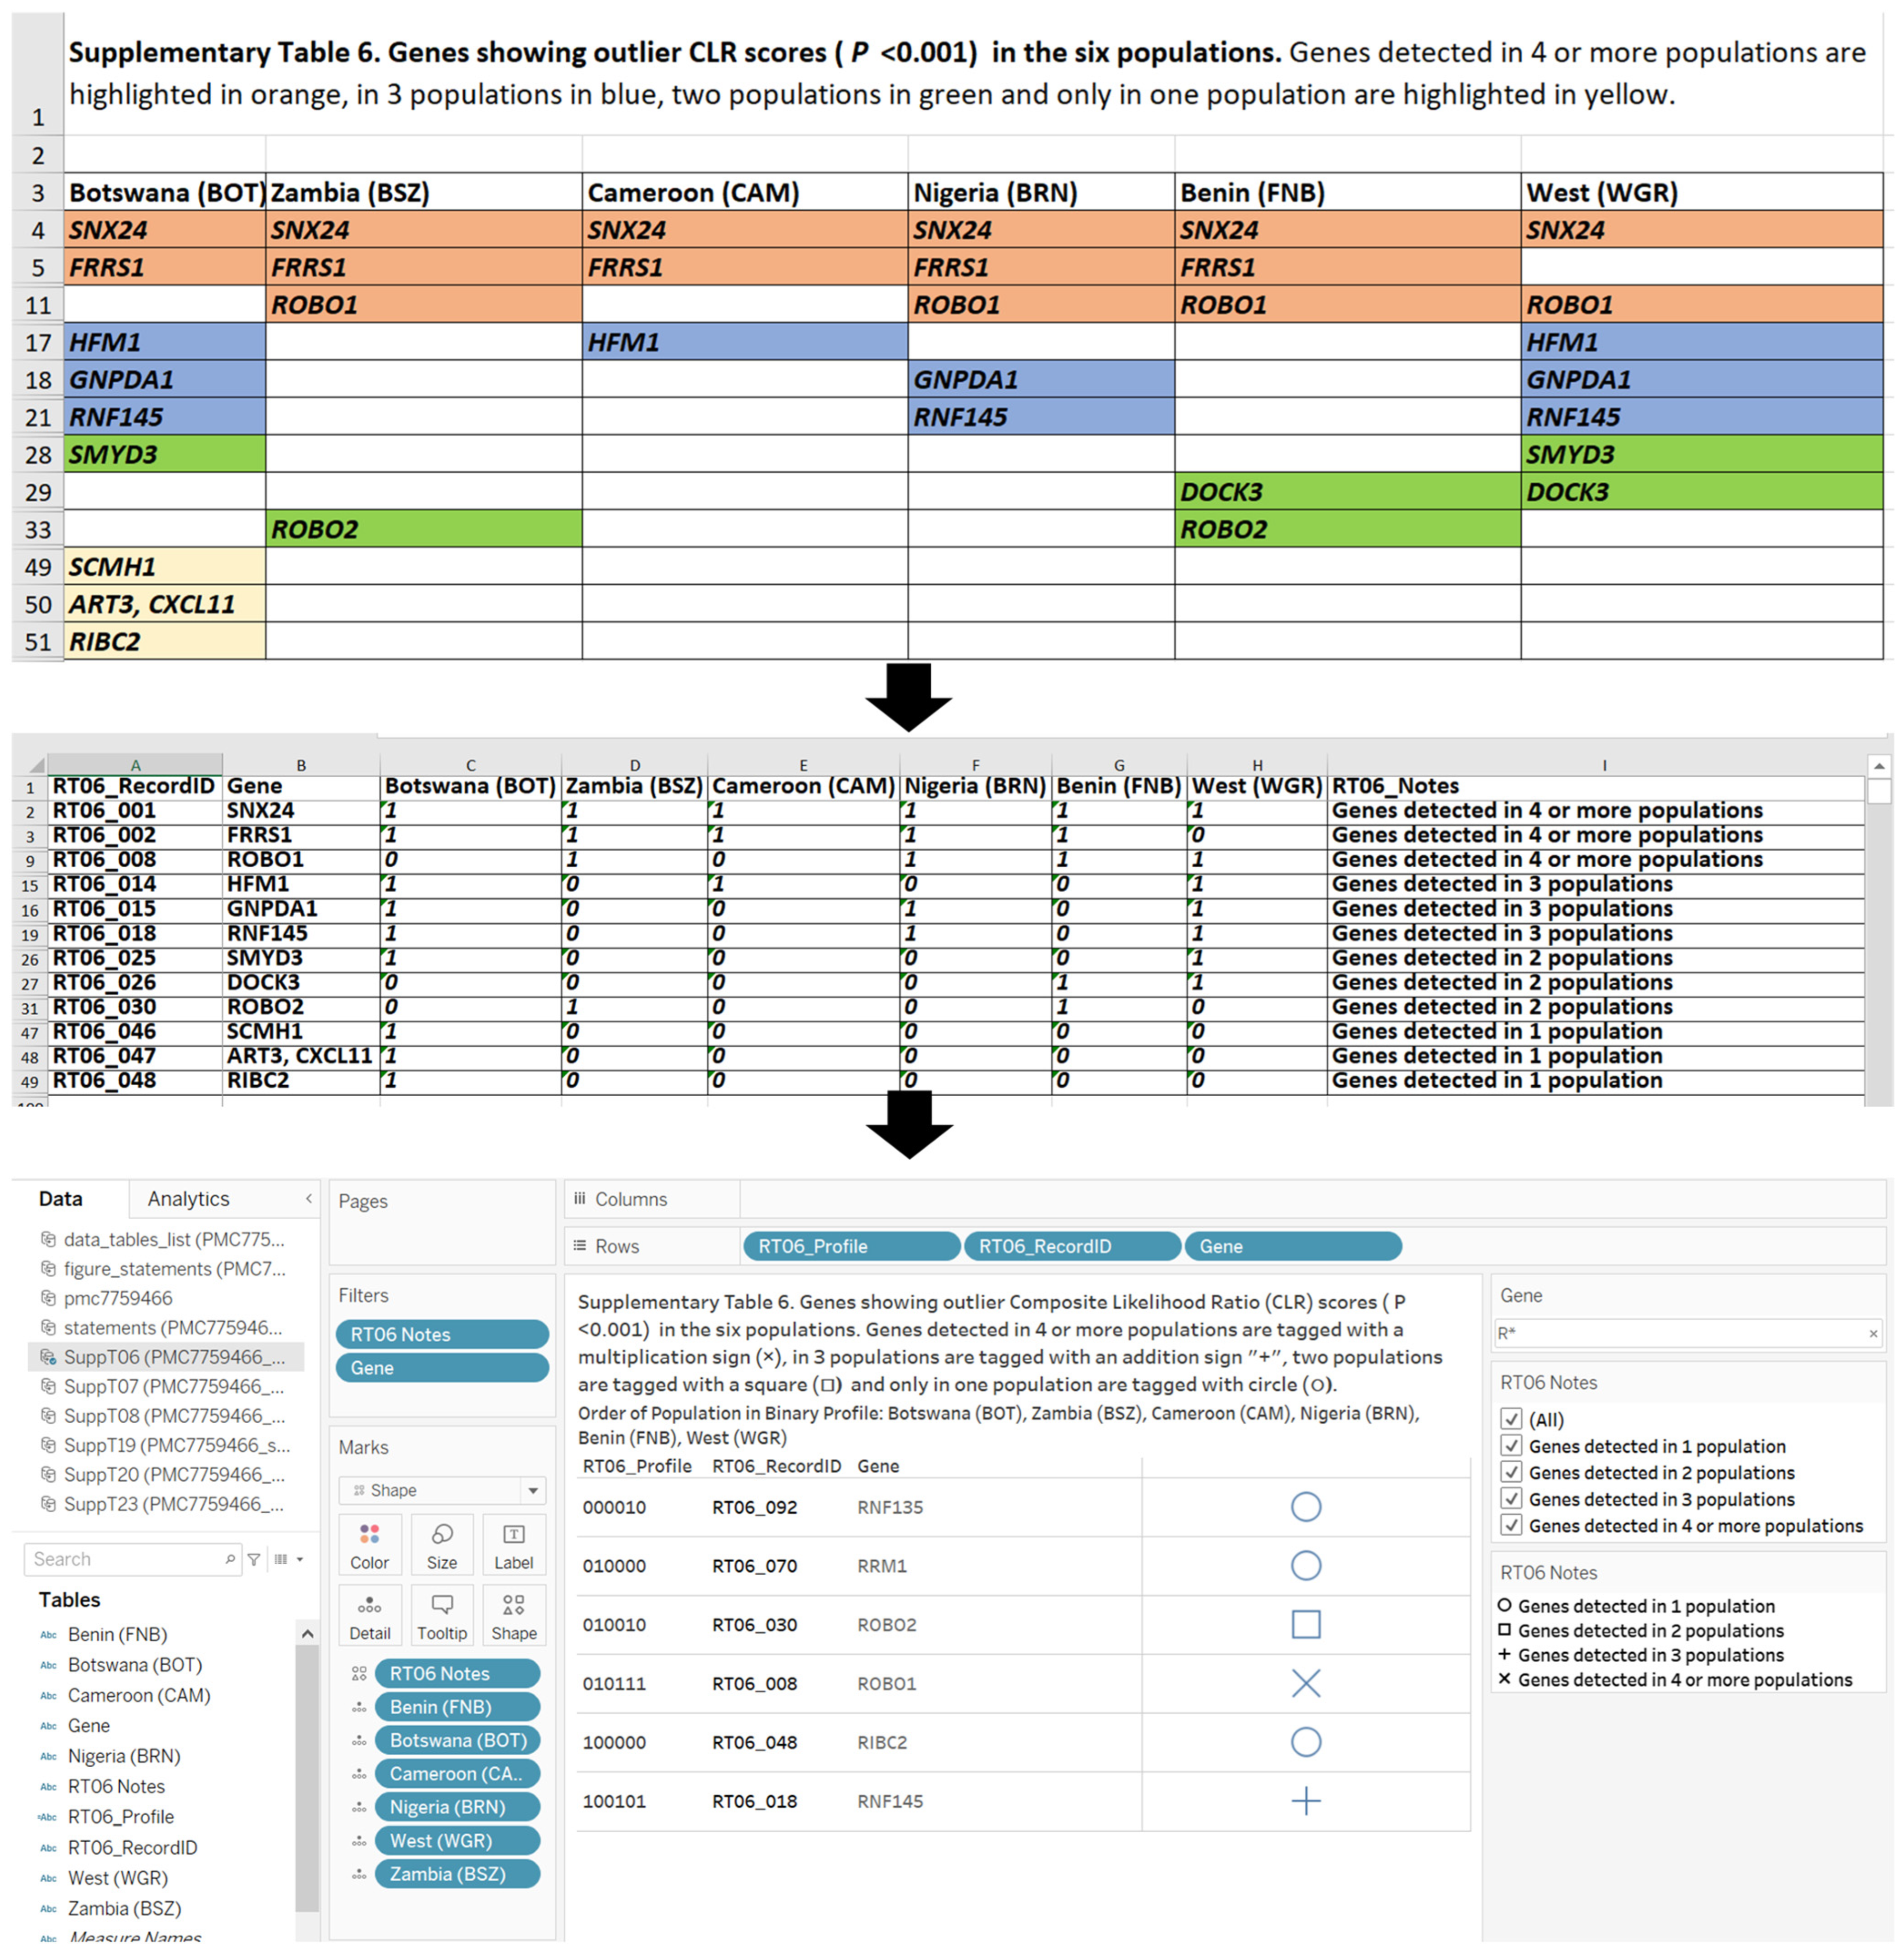
Figure 1. Stages of recoding datasets and design of visual analytics from a dataset in a worksheet of the supplementary file of H3Africa journal article PMC7759466. The top image is a subset of records from the original Supplementary Table 6 in PMC7759466. In the middle image, a section of the value-added and visual-analytics-ready dataset is shown. The first column provides the value of unique identifier for each record in the constructed dataset. The binary digit entries of “0” and “1” provide value to encode the detection of the gene (second data column) in six populations: multiethnic from Botswana (BOT), Bantu Speakers from Zambia (BSZ), Bantu and Bantoid Speakers from Cameroon (CAM), Berom from Nigeria (BRN), Fon in Benin (FNB) and Gur speakers from West Africa (WGR). The last data column encodes the number of populations in which the gene was detected. In the bottom image, the binary digits are combined in visual analytics software to accomplish visual analytics actions such as filtering and connection to an external website. The visual analytics workbooks are available for download at https://public.tableau.com/app/profile/uibgnode/viz/pmc7759466_analytics/overview (accessed on 12 August 2022).
Education 12 00859 g001
Figure 2. A use case of individualization by designing a visual analytics dashboard that allows an individual to make a choice. The top image (above the black line) is the customization design provided by the instructor. The bottom image is the individualization, where the learner makes the choice of key genes detected in the Composite Likelihood Ratio (CLR) scans that are unique to a population in Nigeria. The choice is made by setting the option of all other populations to 0. The gene selected for further learning or investigation via the NCBI databases is the pancreatic lipase (PNLIP) with Gene Ontology biological process terms of lipid digestion, lipid metabolic process and intestinal cholesterol absorption. The visual analytics workbook is available for download at https://public.tableau.com/app/profile/uibgnode/viz/pmc7759466_data_investigations/overview (accessed on 12 August 2022).
Education 12 00859 g002
Figure 3. A visual analytics dashboard designed for personalized learning of the concept of functional consequences of sequence variants. The design provides opportunities to read text and view images on the descriptions of sequence variants. In addition, the individual is able to compare the definitions of the sequence variants. Personalized learning on sequence variants could start with this dashboard to learn concepts (content types that can be defined) and then other visual analytics sheets on sequence variants for data investigations. The image was obtained from Ensembl Variation—Calculated variant consequences (https://www.ensembl.org/info/genome/variation/prediction/predicted_data.html) (accessed on 12 August 2022) [55]. The visual analytics workbook is available for download at https://public.tableau.com/app/profile/uibgnode/viz/pmc7759466_suppT19_variants/overview (accessed on 12 August 2022).
Education 12 00859 g003
Figure 4. An illustration of performance measures from visual analytics performance metrics for gaining insights into timeline of actions performed by an individual. In the top image, the individual performed scrolling and did not change the options in filters. In the bottom image, the individual performed actions including changes to the options and included a search term “variant”. Compared with the top image, there is evidence in the bottom image for increased performance by the greater number of activities below the Depth 9 mark.
Education 12 00859 g004
Figure 6. Evidence for positive effect size and acceptable usability of a visual analytics resource designed to support personalized education of the concept of functional consequences of sequence variants. In the effect size image, (a) the mean difference between Pre-Test Score and Post-Test Score is shown in the above Gardner–Altman estimation plot. Both groups are plotted on the left axes; the mean difference is plotted on a floating axis on the right as a bootstrap sampling distribution. The mean difference is depicted as a dot; the 95% confidence interval is indicated by the ends of the vertical error bar. In the System Usability Score image (b), the dots are the scores provided the respondents, and the distribution of the scores is illustrated as a box plot. The mean SUS score of 74.1 is within the acceptable range of usability.
Education 12 00859 g006
Publisher’s Note: MDPI stays neutral with regard to jurisdictional claims in published maps and institutional affiliations.