1. Introduction
The new coronavirus was first identified in December 2019 in Wuhan, China. However, the disease quickly crossed the country’s borders and became a global problem. In January 2020, the World Health Organization declared a global state of health emergency, and in March 2020, the situation was declared a pandemic by the World Health Organization. Within more than one year since the outbreak of the pandemic, the disease has been reported in 192 countries and has claimed more than 3 million lives. Even at the beginning of the pandemic, many countries began to take measures to prevent the spreading of the disease, mainly by reducing personal contact and the level of its riskiness. From the very start, these measures included the restriction or complete closing of face-to-face schooling. The first country to close its schools was China, but by February 2020 other 12 countries closed their schools nationwide, and 9 others took action at regional levels. These measures affected 290 million pupils and students [
1]. Shortly, in consequence to the worsening pandemic situation, other countries including the Czech Republic also closed their schools. In total, in the first 13 months of the pandemic, schools were closed in more than 190 countries, with more than 1.725 billion learners and over 100 million teachers and school staff affected [
2]. Even at the time of writing this paper, schools remain fully closed in 29 countries. The problem of emergency remote teaching and learning (ERLT) has become a worldwide problem. Governments in many countries have been looking for ways of providing education to pupils and students who cannot attend school. It is to be appreciated that many companies focusing on distance education before the pandemic offered their products to schools, pupils, and parents completely free of charge. However, this valuable help posed significant challenges to teachers, because, in addition to problems, with the transition from face-to-face to distance education (compare [
3]), they also had to look for new ways of not only operating and controlling new products but also using them with respect to the didactics of their subject.
1.1. Factors Influencing the Use of Technology
Several articles mention factors that influence the use technology in education. As a factor they give “references to contextual constraints, such as curricular requirements or social pressure exerted by parents, peers, or administrators” [
4], teachers’ age (e.g., [
5]), gender (e.g., [
6]), teachers´ original social class, ethnic background, experience from living in other cultures, and prior teaching experience [
7,
8]. A comparison of 30 individual factors is represented in Liu’s work [
9]. Although the list of factors is rich, it is not complete. For example, this article does not mention other factors that could also have an influence, such as age, risk-aversion, technical knowledge, etc. The aim of this paper is to present one of the factors that is very specific to the COVID-19 pandemic period—free-of-charge access to software for teaching, i.e., the personal experience of teachers with the new software.
1.2. Emergency Remote Teaching and Learning
The closure of schools has brought new challenges and problems. The transition from full-time to distance or online teaching was unplanned and forced. The new situation in which teachers and pupils found themselves differed in many parameters from standard on-line or distance learning. Therefore, the situation began to be called emergency remote learning and teaching [
10] or emergency remote education [
11]. The completely new situation required adaptation on the part of teachers [
12,
13,
14] and students [
15,
16]. Along with the problems, it also brought opportunities and challenges [
17]. Teachers and students gradually learned to adapt to the situation. This led to changes in their behavior, which is also mapped by the presented research.
1.3. Situation in the Czech Republic
In the Czech Republic, schools were first closed in spring 2020 and again in autumn 2020 after a partial summer loosening. The measures affected approximately 1.7 million pupils and students, out of which more than 950,000 were primary school pupils [
18].
The National Security Council decided on the first closure of schools at its meeting on 10 March 2020, and it was in force from the following day, i.e., 11 March 2020. This meant schools had no chance to prepare for the situation. In making its decision, the government relied primarily on a study by Ferguson at al. [
19] and assumed a slowdown in the rate of spread of the disease. The legislative form of the measure and its duration changed repeatedly over time. Finally, the first loosening took place after more than a month, when, from 20 April, schools were first opened for university students and final-grade pupils and then for other school pupils. The attendance at face-to-face lessons was voluntary, and some pupils did not take part.
The second closure of schools in the Czech Republic was decided upon after the dramatic worsening of the epidemic situation in autumn 2020. First, secondary schools in districts with a higher incidence of infection were closed for 14 days from 5 October. However, the planned opening did not take place; on the contrary, all primary and secondary schools were closed on 14 October. Despite several planned reopening dates, schools in the Czech Republic remained closed virtually continuously until April 2021, when teaching for some grades gradually began to open in a rotational form, meaning a week of face-to-face teaching followed by another week of distance education. Pupils from different grades took turns in face-to-face education on a weekly basis.
Immediately after the closure of schools, a number of measures were taken to reduce its impact on pupils’ education. State television began broadcasting lessons, and individuals, companies, and foundations provided computer technology for teachers and pupils from socially disadvantaged backgrounds. A number of software companies offered their educational products to schools and teachers for free. Thanks to this help, the vast majority of schools managed to provide emergency remote education for the majority of pupils. While, in spring 2020, the number of pupils who did not participate in remote education for various reasons was estimated at 250,000, this number was reduced to around 50,000 pupils during the year. One of the reasons for the significant improvement in this area may be the fact that while school closures were unexpected in spring 2020, the step was anticipated in autumn 2020 due to the gradually worsening epidemic situation. Many schools took advantage of the short time of being open in September 2020 for the preparation of emergency remote teaching and learning.
However, in addition to pupils who are unable to attend emergency remote education for technical reasons, there is still a group of pupils who attend online distance learning irregularly or do not work well enough, namely due to family problems usually associated with low motivation in education or low support from the family [
20].
1.4. The Techambition System
One of the companies that offered its products to teachers for free during the pandemic was Techambition, Ltd. The Techambition system developed by this company was designed for blended learning and not for emergency remote education. The aim of the system is to support the face-to-face form of teaching through the use of artificial intelligence for the organization of classroom activities [
21]. The system is designed for teaching mathematics at secondary schools, and the educational content (in the development of which the Faculty of Education, Charles University, also participated) covers the curriculum of secondary schools. When used in distance education, the system offers teachers the opportunity to give pupils tasks to solve in four different modes—individual work, test, group work, and test with online discussion. Above that, pupils and students have the opportunity to choose from the educational content on their own and solve tasks independently.
2. Materials and Methods
Research Methodology
The research used data from the Techambition Ltd. system. These data wre structured according to individual tasks. For each task, basic information about the teacher, school, and the task was registered. As far as the task is concerned, information about the type of task, the time of setting the task to the pupils, and time of submitting it was monitored. Furthermore, for each task, the number of pupils to whom the task was set, the number of pupils who solved the task in the given deadline and after the deadline, and data on their average success rate were given. These data were then recalculated, and two data files were created, one for each of the relevant periods. In the new data sets, one data record was created for each teacher containing 19 monitored data on their activities. These data were further processed by statistical methods.
To begin with, descriptive statistics analysis for numerical quantities was conducted. This was followed by factor analysis on normalized data, for which two factors were selected and, for each numerical quantity, the extent of intervening in the individual factors was stated. The data seemed to be suitable for this kind of analysis with Kaiser–Meyer–Olkin criterion overall value 0.762, and the correlation matrix was significantly different from the identity matrix according to Bartlett’s test with test statistic, χ2 = 2370.51, and p-value, p < 0.001. The thus collected data were then used to identify the factors.
In the following stage, cluster analysis was conducted. We tried to divide the normalized data into three groups using Ward’s hierarchical clustering. The three groups were selected according to the dendrogram. In the three clusters, we measured the average ranks of all numerical variables and then used these values to interpret the individual clusters.
In the last stage of the research, we focused on the transition of teachers between individual clusters. The data obtained in this way were subsequently interpreted as changes in teachers’ behavior over time.
3. Results
3.1. Basic Data Characteristics
Within the research, two sets of data were processed. These described the behavior of teachers, namely tasks set in the period from 1 March 2020 until 18 March 2021. In total (
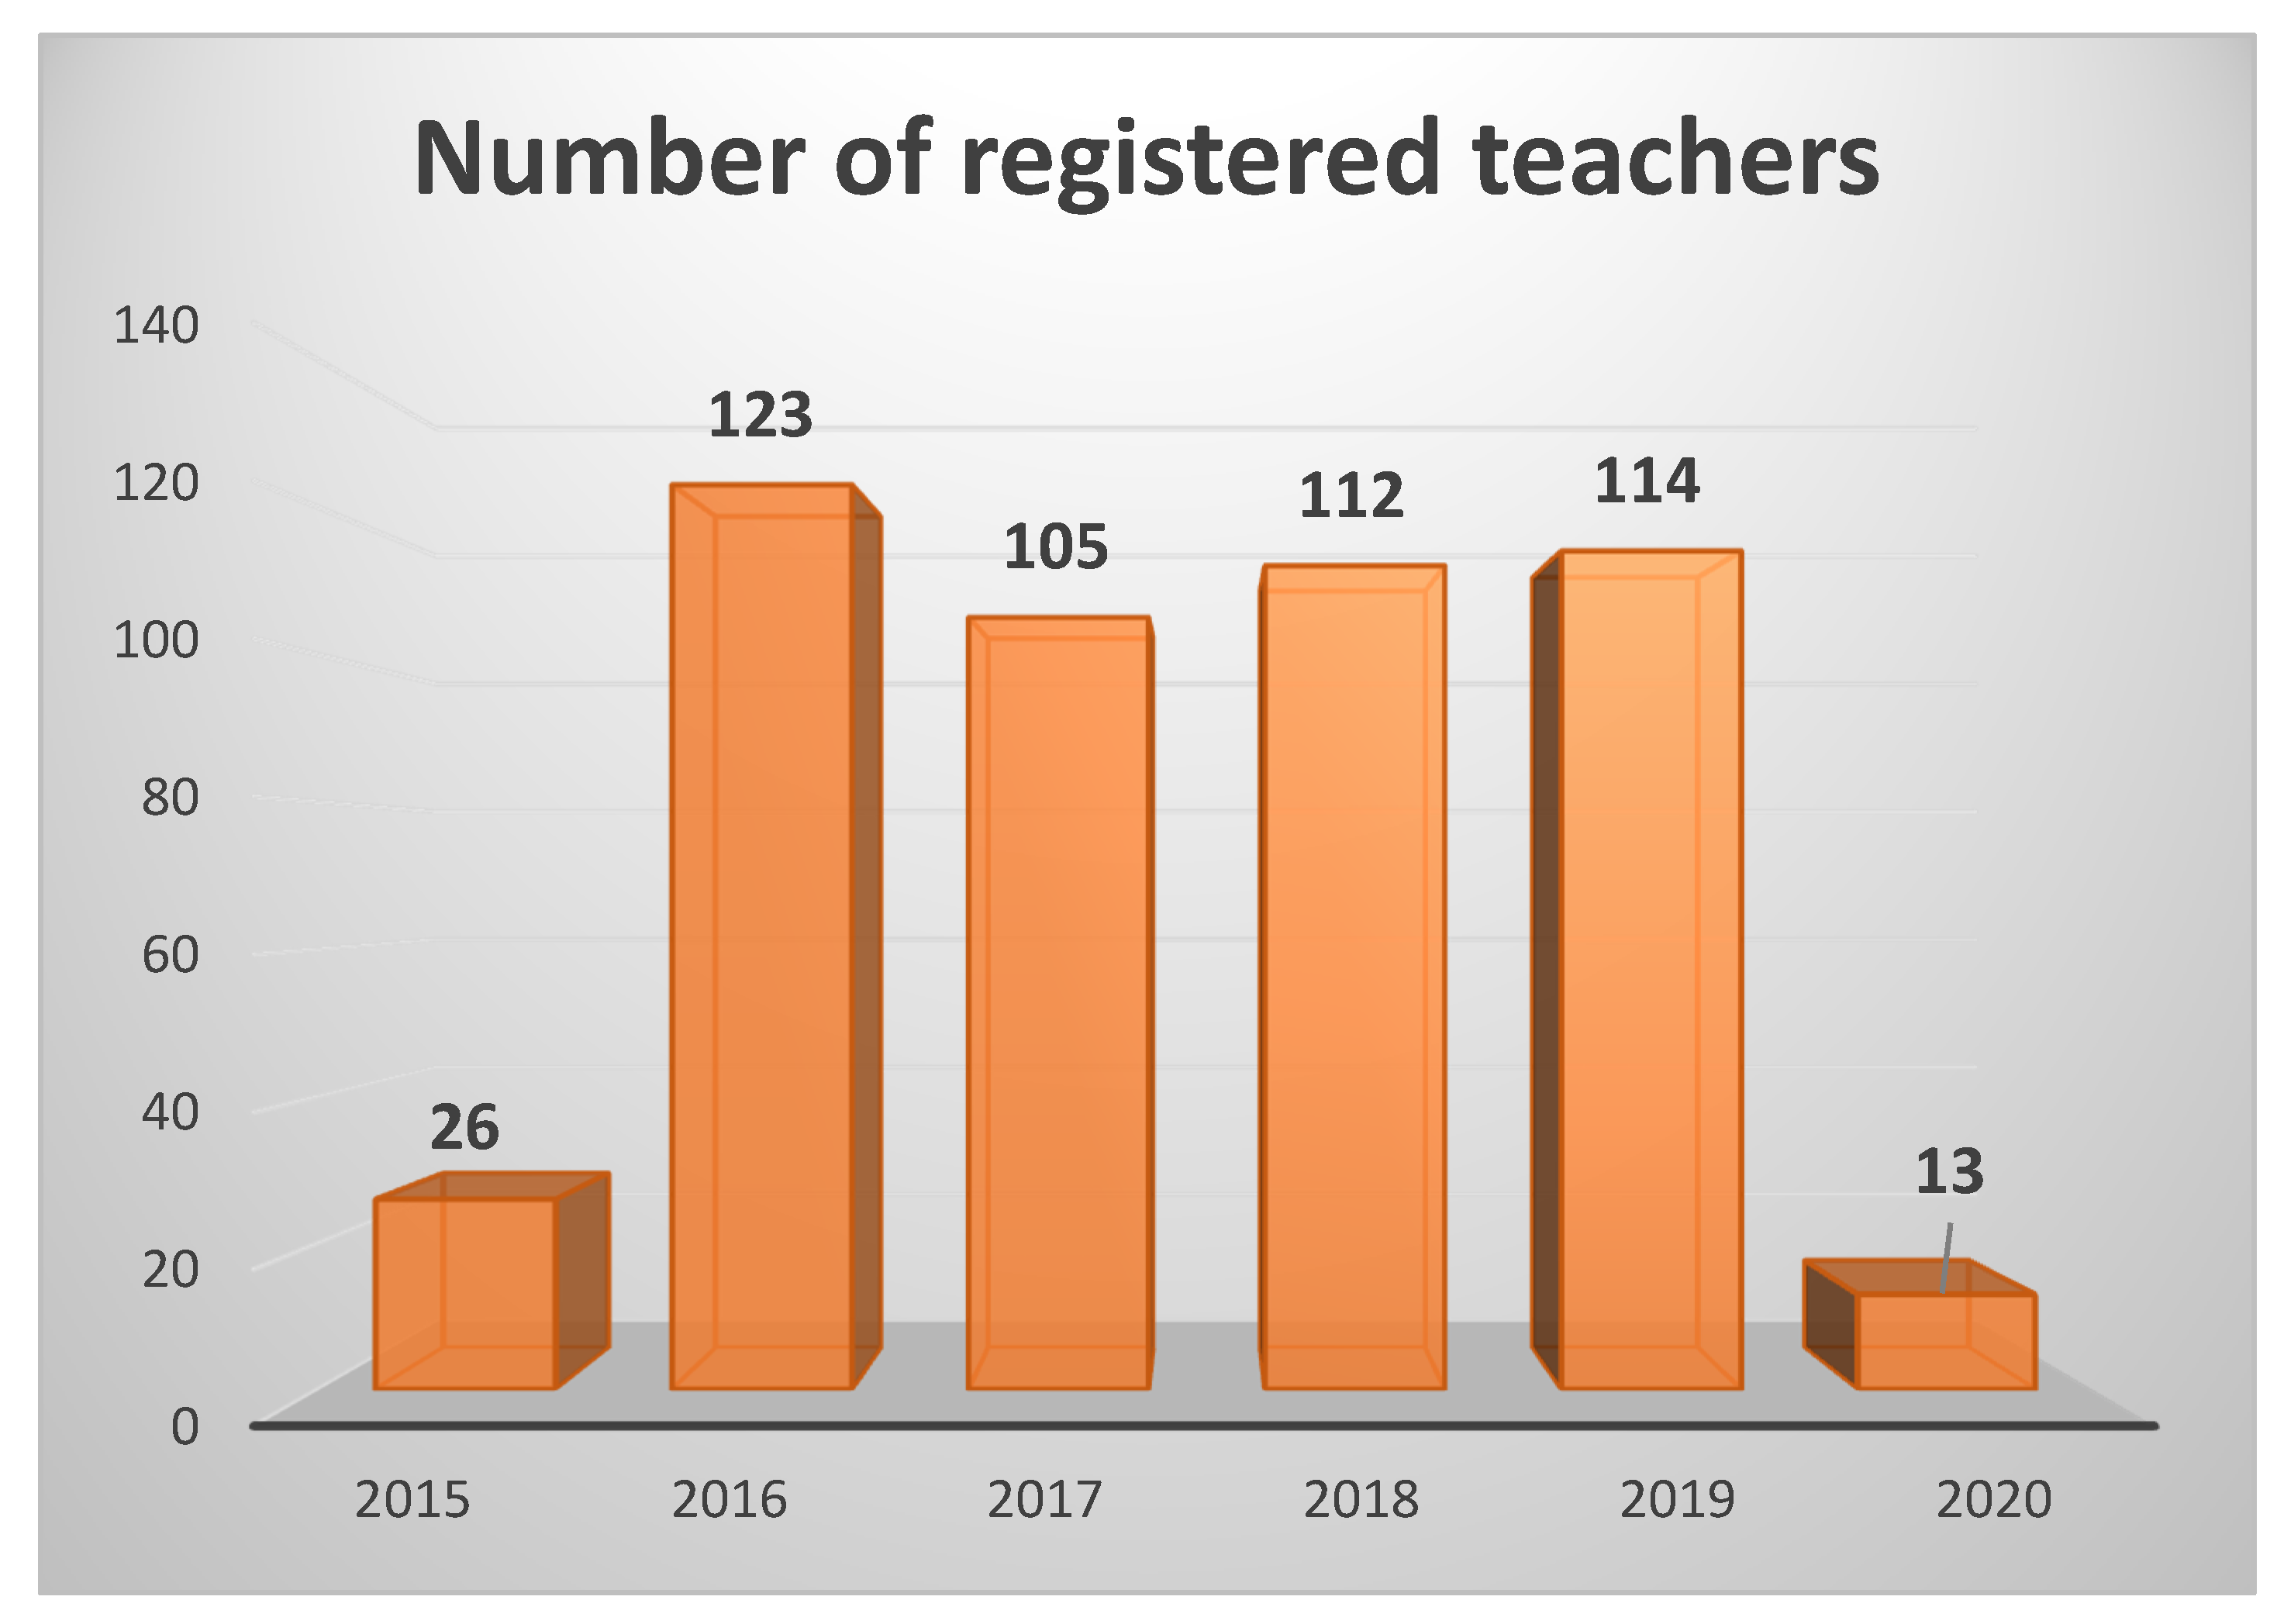
Table 1), 52,765 tasks were set by 1170 teachers from 605 schools over this period. Each of the teachers set at least one task for their pupils. By task, we mean an activity given to the whole class. Only 492 teachers were registered in the system before the closure of schools on 10 March 2020.
Figure 1 shows in which years these teachers had registered in the system.
These teachers gave a total of 29,088 tasks, out of which, 16,910 were set in the relevant period of the school year 2019/20 and 12,178 in the school year 2020/21. Out of the 492 teachers registered before the pandemic, 216 used the system in both school years, 231 only in the school year 2019/20, and on the contrary 45 only in the school year 2020/21.
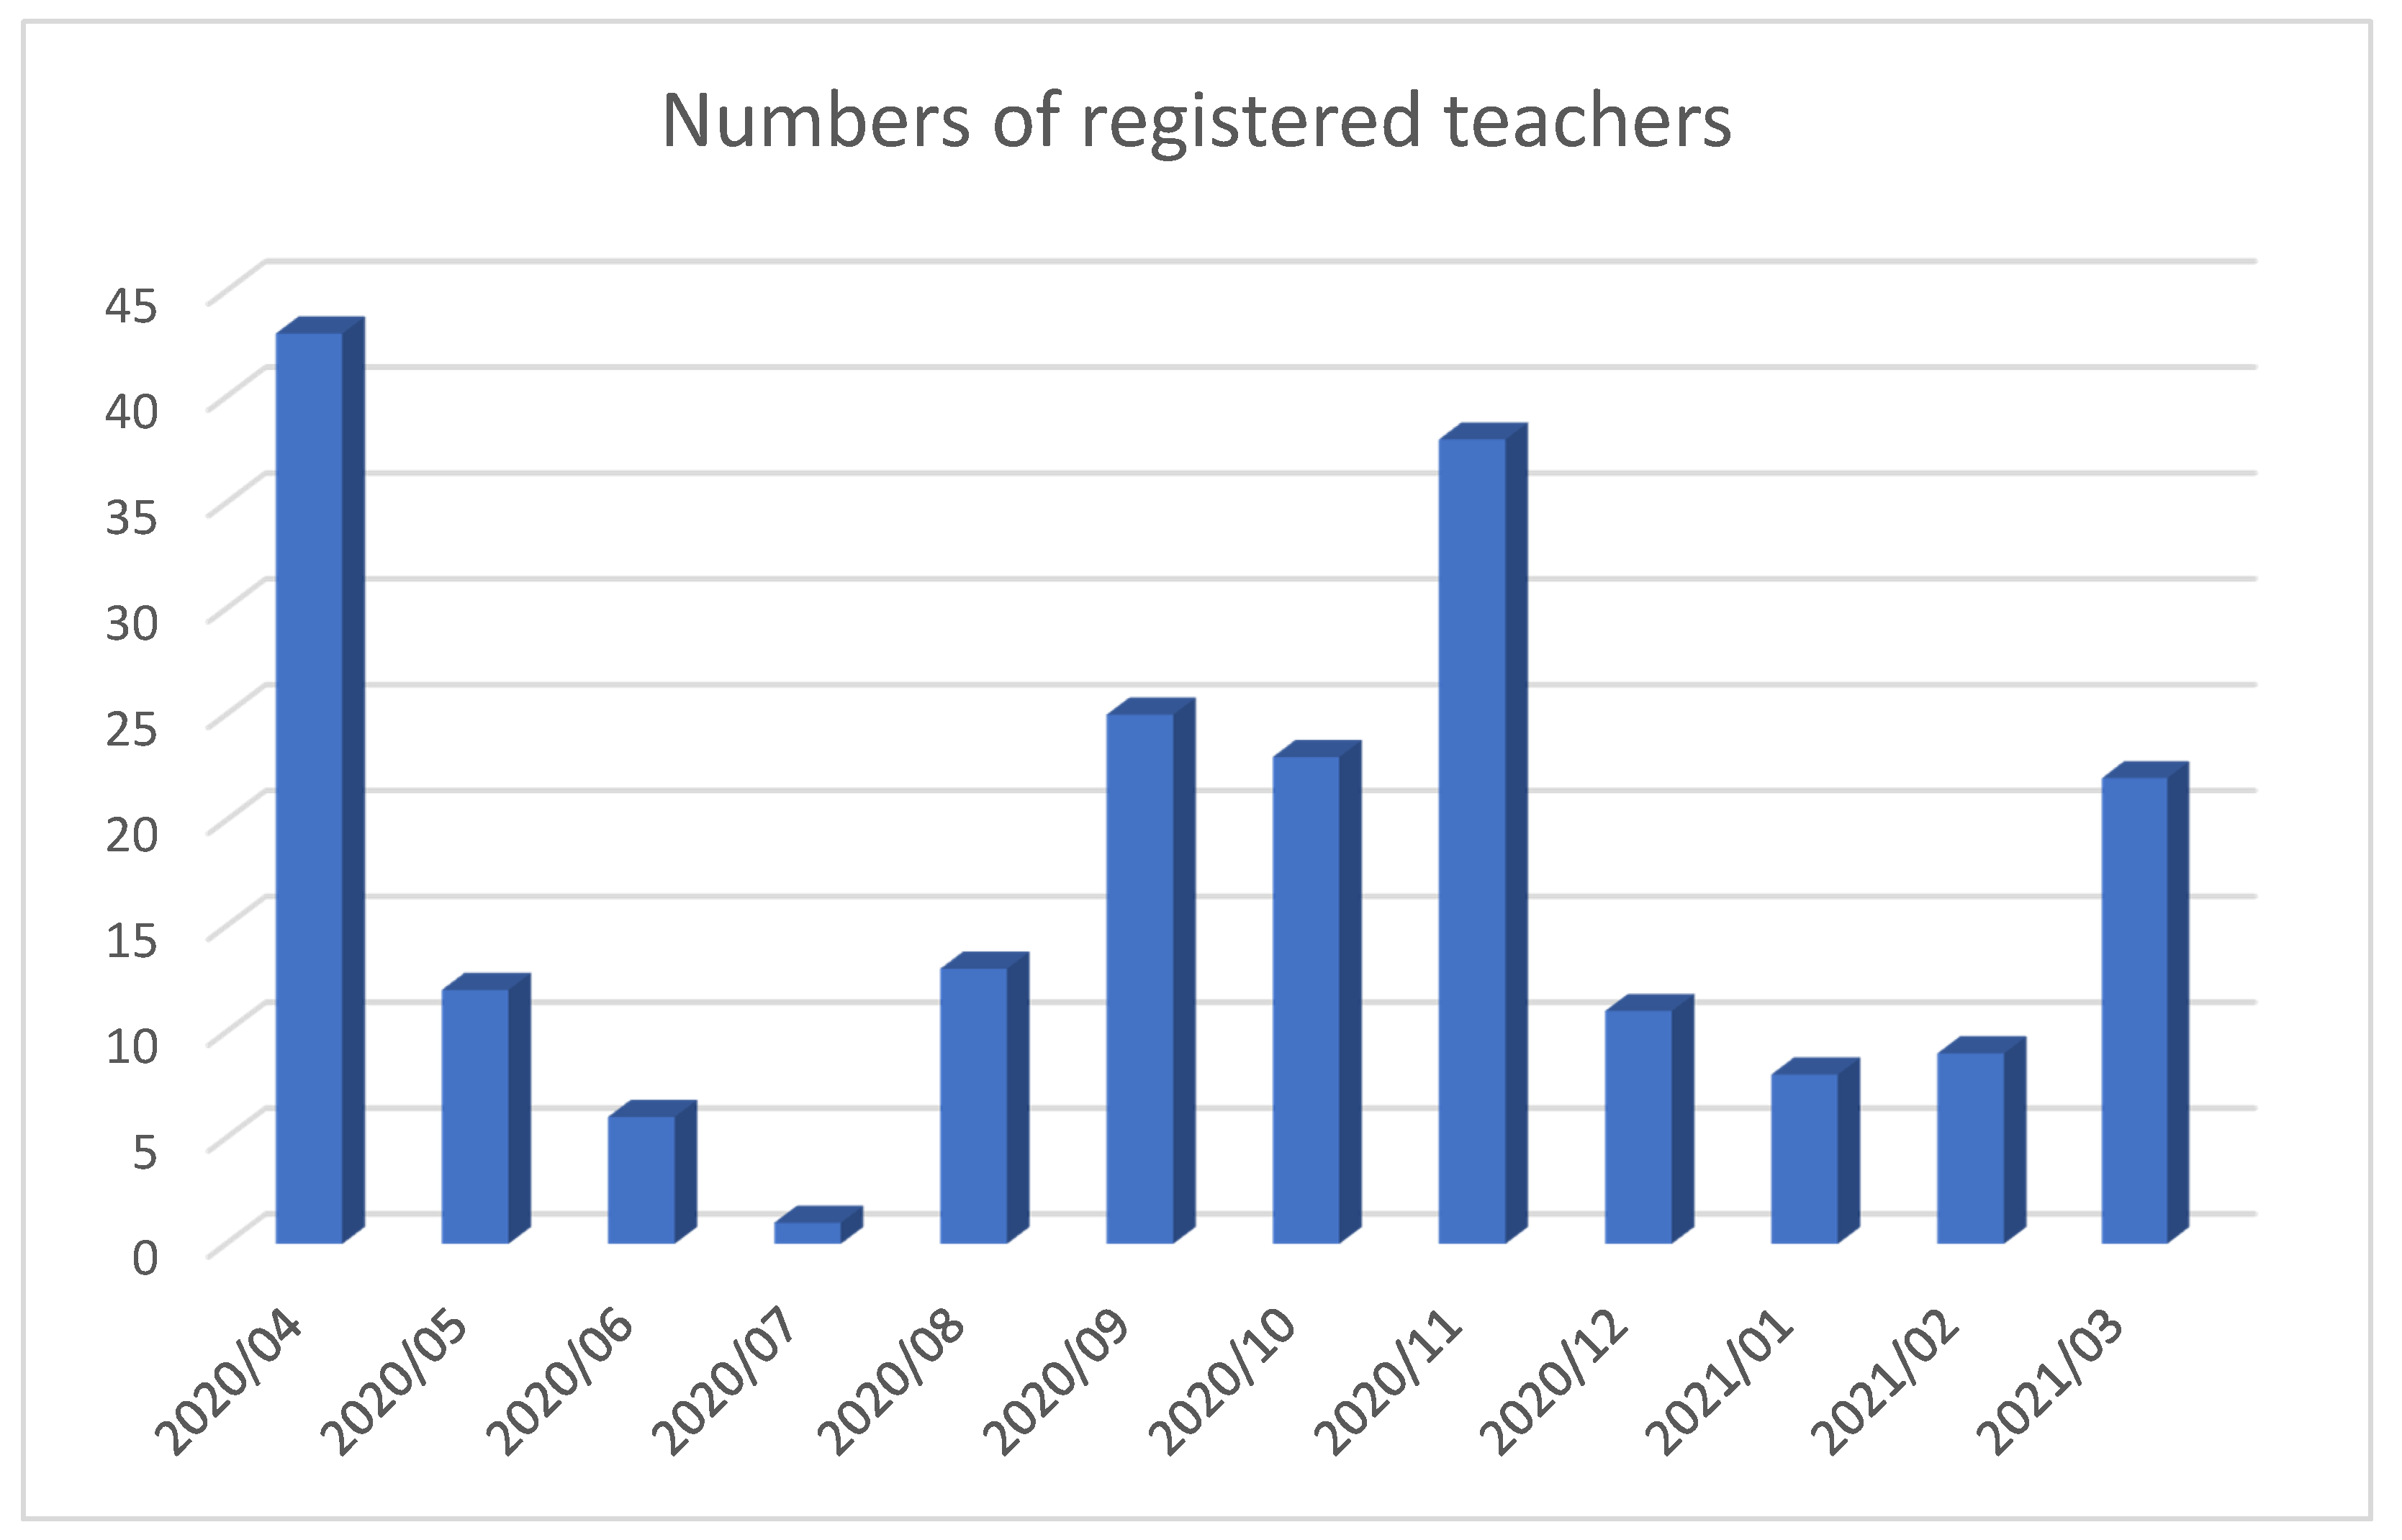
Out of the 678 teachers who registered in the system after the closure of schools, the largest proportion—467 teachers, i.e., more than two-thirds—registered in the first month after the closure of schools, i.e., in the last three weeks of March. They immediately responded to the offer of free access to the Techambition system. Another 211 teachers gradually registered in the following months.
Figure 2 shows the gradual registration of teachers in the system in the months of the relevant period.
The data show that, during March 2020, the actual number of users of the system almost doubled (see
Figure 3). Analysis of data from the second period showed that 297 teachers who started working with the system in the first period of closure used the system in the second period as well.
3.2. Analysis of the Data from the First Period
In the first period, work of 955 teachers from 506 schools was analyzed. The maximum number of teachers registered from one school was 9 (see
Table 2).
The data set consists of 955 observations because each observation corresponds to one teacher. These teachers registered 48,091 pupils in 2669 classrooms. The low average number of pupils per classroom is, among other things, due to the fact that a large proportion of the teachers registered classes with a very small number of pupils with which they wanted to test the behavior of the system. The teachers set a total of 33,556 tasks to the registered pupils.
The obtained data show that teachers set an average of 12.5 tasks to one class, while the average time to complete one task was less than a week. The average success rate of pupils was just below 80%. The teachers used types of tasks other than “individual work” minimally. The second most commonly used type of task was a test. However, in the case of this type of task, teachers did not set one test per class. Teachers set tasks in the system once every 5 days on average.
3.2.1. Factor Analysis
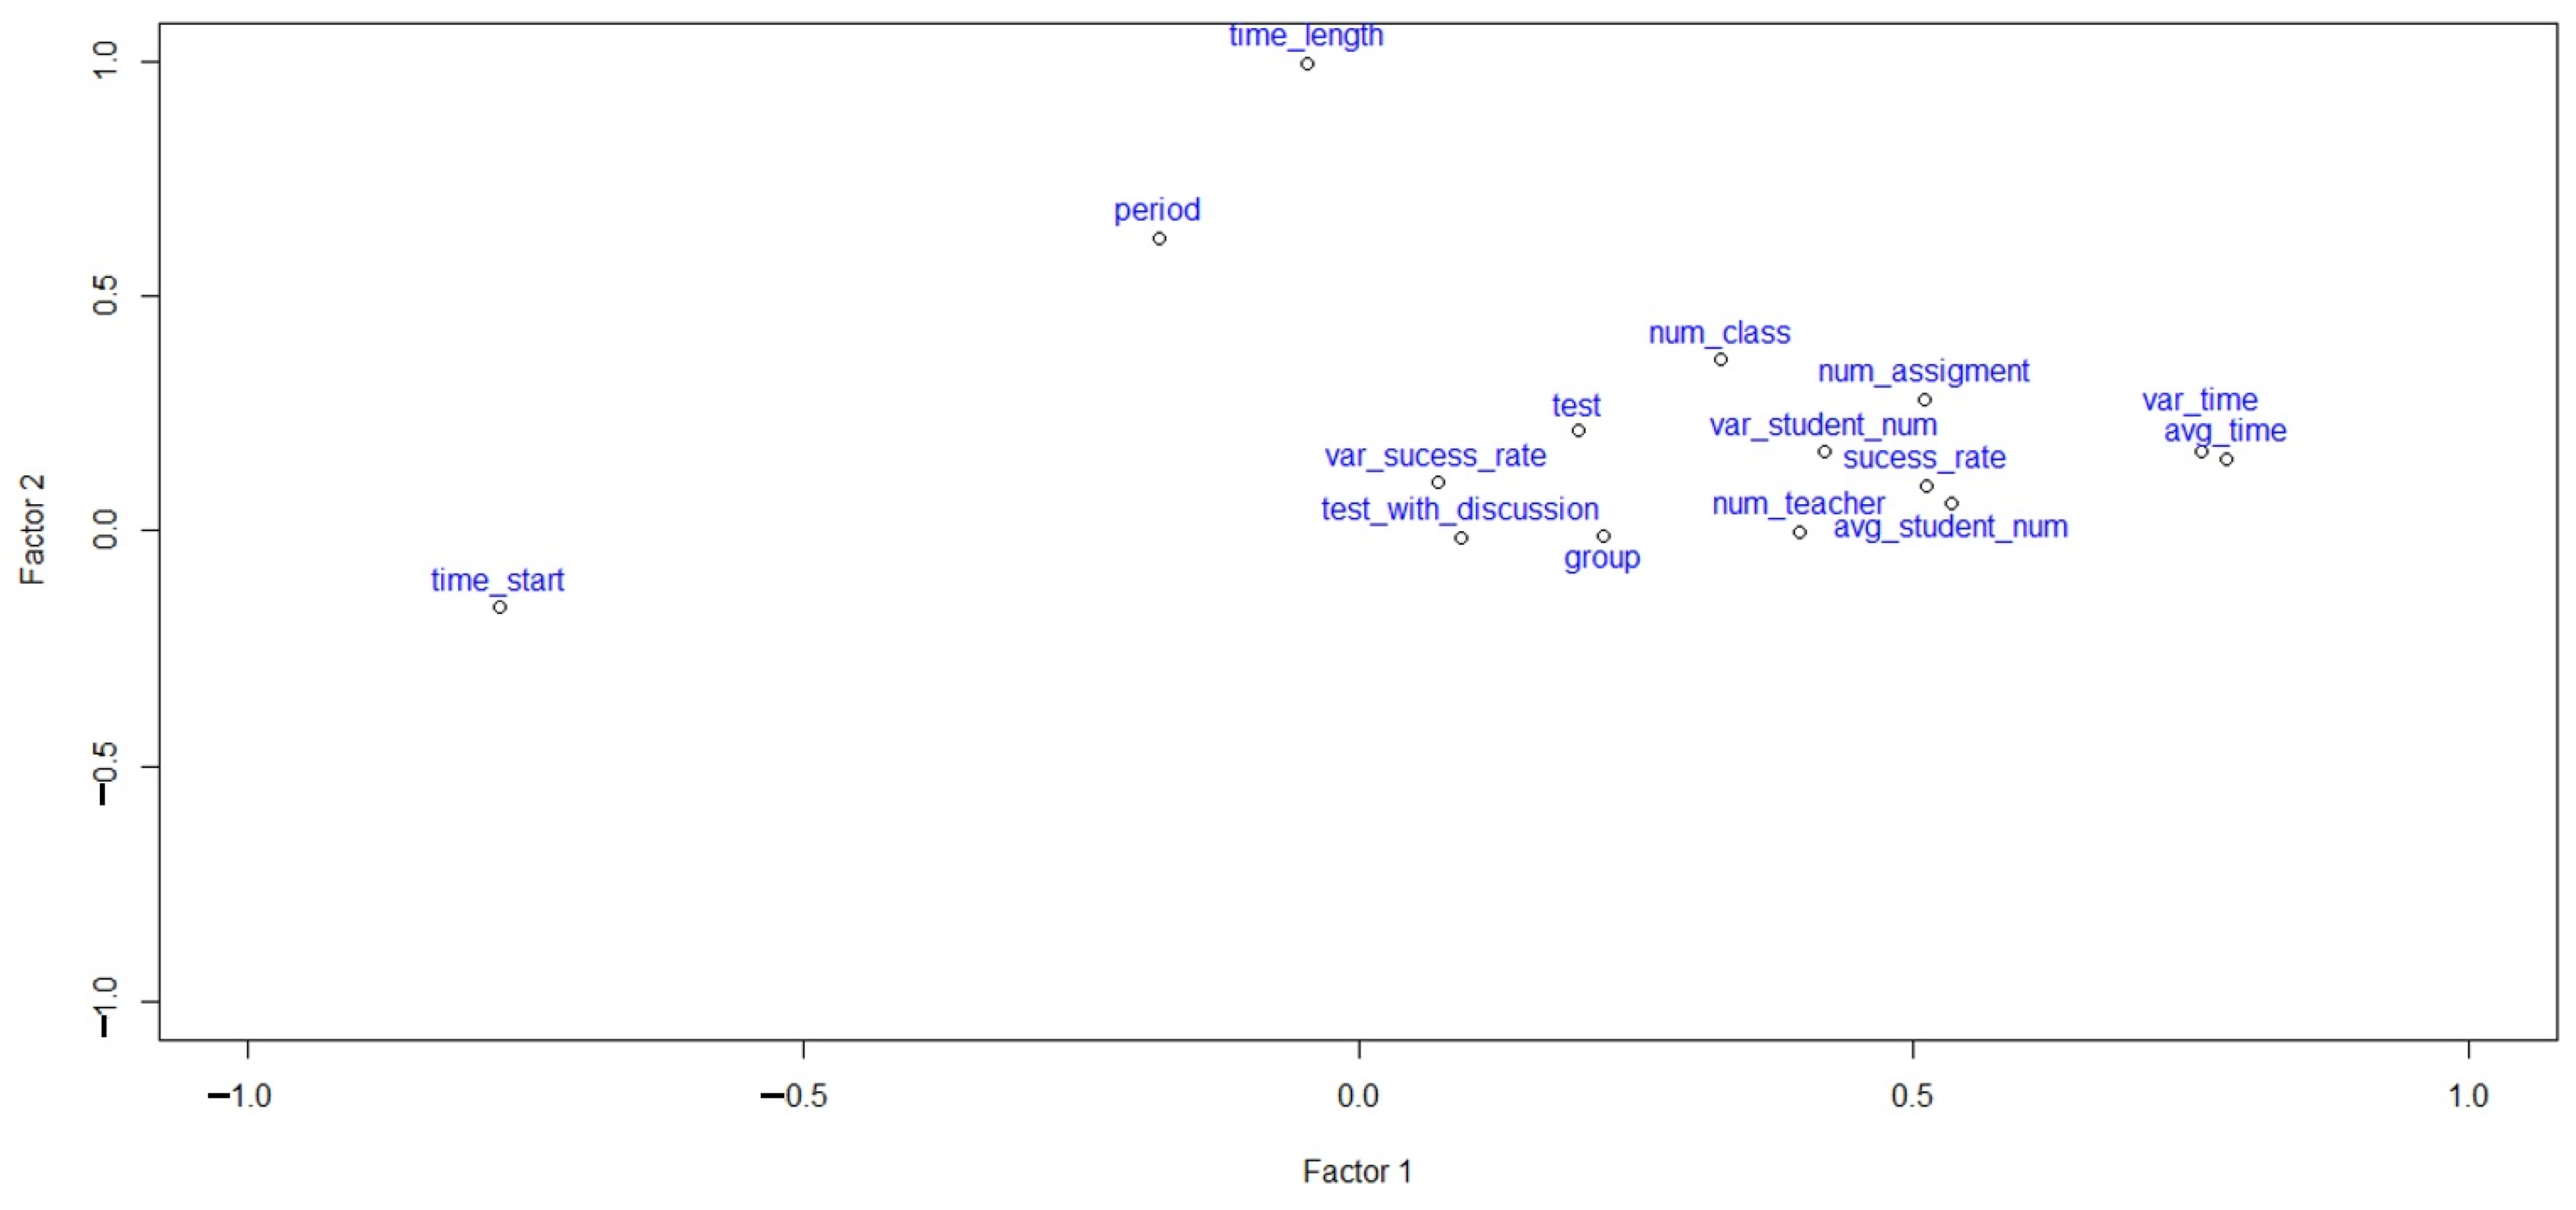
The data from the first data set were analyzed using factor analysis with a pair of factors on normalized data. For each numerical quantity, the extent of how much it intervened with the given factor was studied. The results of the factor analysis are presented in
Figure 4.
Factor 1 in the chart above has on the x-axis start time as the lowest value and, conversely, the total time, number of tasks and number of classes as the highest values. This factor could, therefore, be interpreted as the number of tasks the teacher set through the system.
Factor 2 in the chart above has on the y-axis high values of success rate and average number of pupils. Thus, it could be interpreted as the difficulty of the set tasks.
3.2.2. Cluster Analysis
In the following stage, cluster analysis was conducted. We tried to divide the normalized data from the first data set into three groups using Ward’s hierarchical clustering. The three groups were selected according to the dendrogram. In the three clusters, we measured the average values of all numerical variables (
Table 3), which helped us with the interpretation of individual clusters.
Classification of the obtained data resulted in the following characteristics of the individual clusters.
Cluster 1—Organized
These are teachers who work with large numbers of pupils. Pupils of these teachers perform better on the tests. The teachers are very often teachers from schools where a higher number of teachers use the Techambition system. Thus, these are very likely teachers from schools where the use of the system is organized at the school level. Within the first data set, there were 294 teachers (31%) with these characteristics.
Cluster 2—Hardworking
This group of teachers is characterized by setting a large number of tasks, and they work with a large number of classes. Very often, these are teachers who started working with the Techambition system before the transition to emergency remote teaching and learning. Unlike the majority, they also use the advanced system functionality, such as test-with-online-discussions or group tasks. Within the first data set, there were 458 teachers (48%) with these characteristics.
Cluster 3—Seekers
The last group of teachers we named “seekers”. The basic characteristics of this group is that they registered for work in the Techambition system later, had not used it for very long, worked with only a small group of pupils, and set a small number of tasks. These are very likely teachers who decided only to test the system and did not continue using it. Within the first data set, there were 203 teachers (21%) identified with these characteristics.
3.3. Analysis of Data from the Second Period
In the second studied period, the application was no longer offered to schools for free. That is why we can see a radical decrease of the number of teachers using the application. The work of 530 teachers from 127 schools was analyzed in this period (see
Table 4). This means we could observe a significant increase of the average number of teachers using the application in the same school from two to four.
The second data set included 530 observations. The teachers registered a total of 24,231 pupils in 1356 classes. A total of 19,210 tasks was set in the classes.
Table 4 presents descriptive statistics for numerical quantities.
The obtained data show that teachers set an average of 14.2 tasks to one class, while the average time to complete one task was almost two months. The significant increase of average time was due to the fact that some teachers entered all tasks at the beginning of the school year. The average success rate of pupils was just below 70%. The teachers used types of tasks other than “individual work” minimally. The second most commonly used type of task was a test.
3.3.1. Factor Analysis
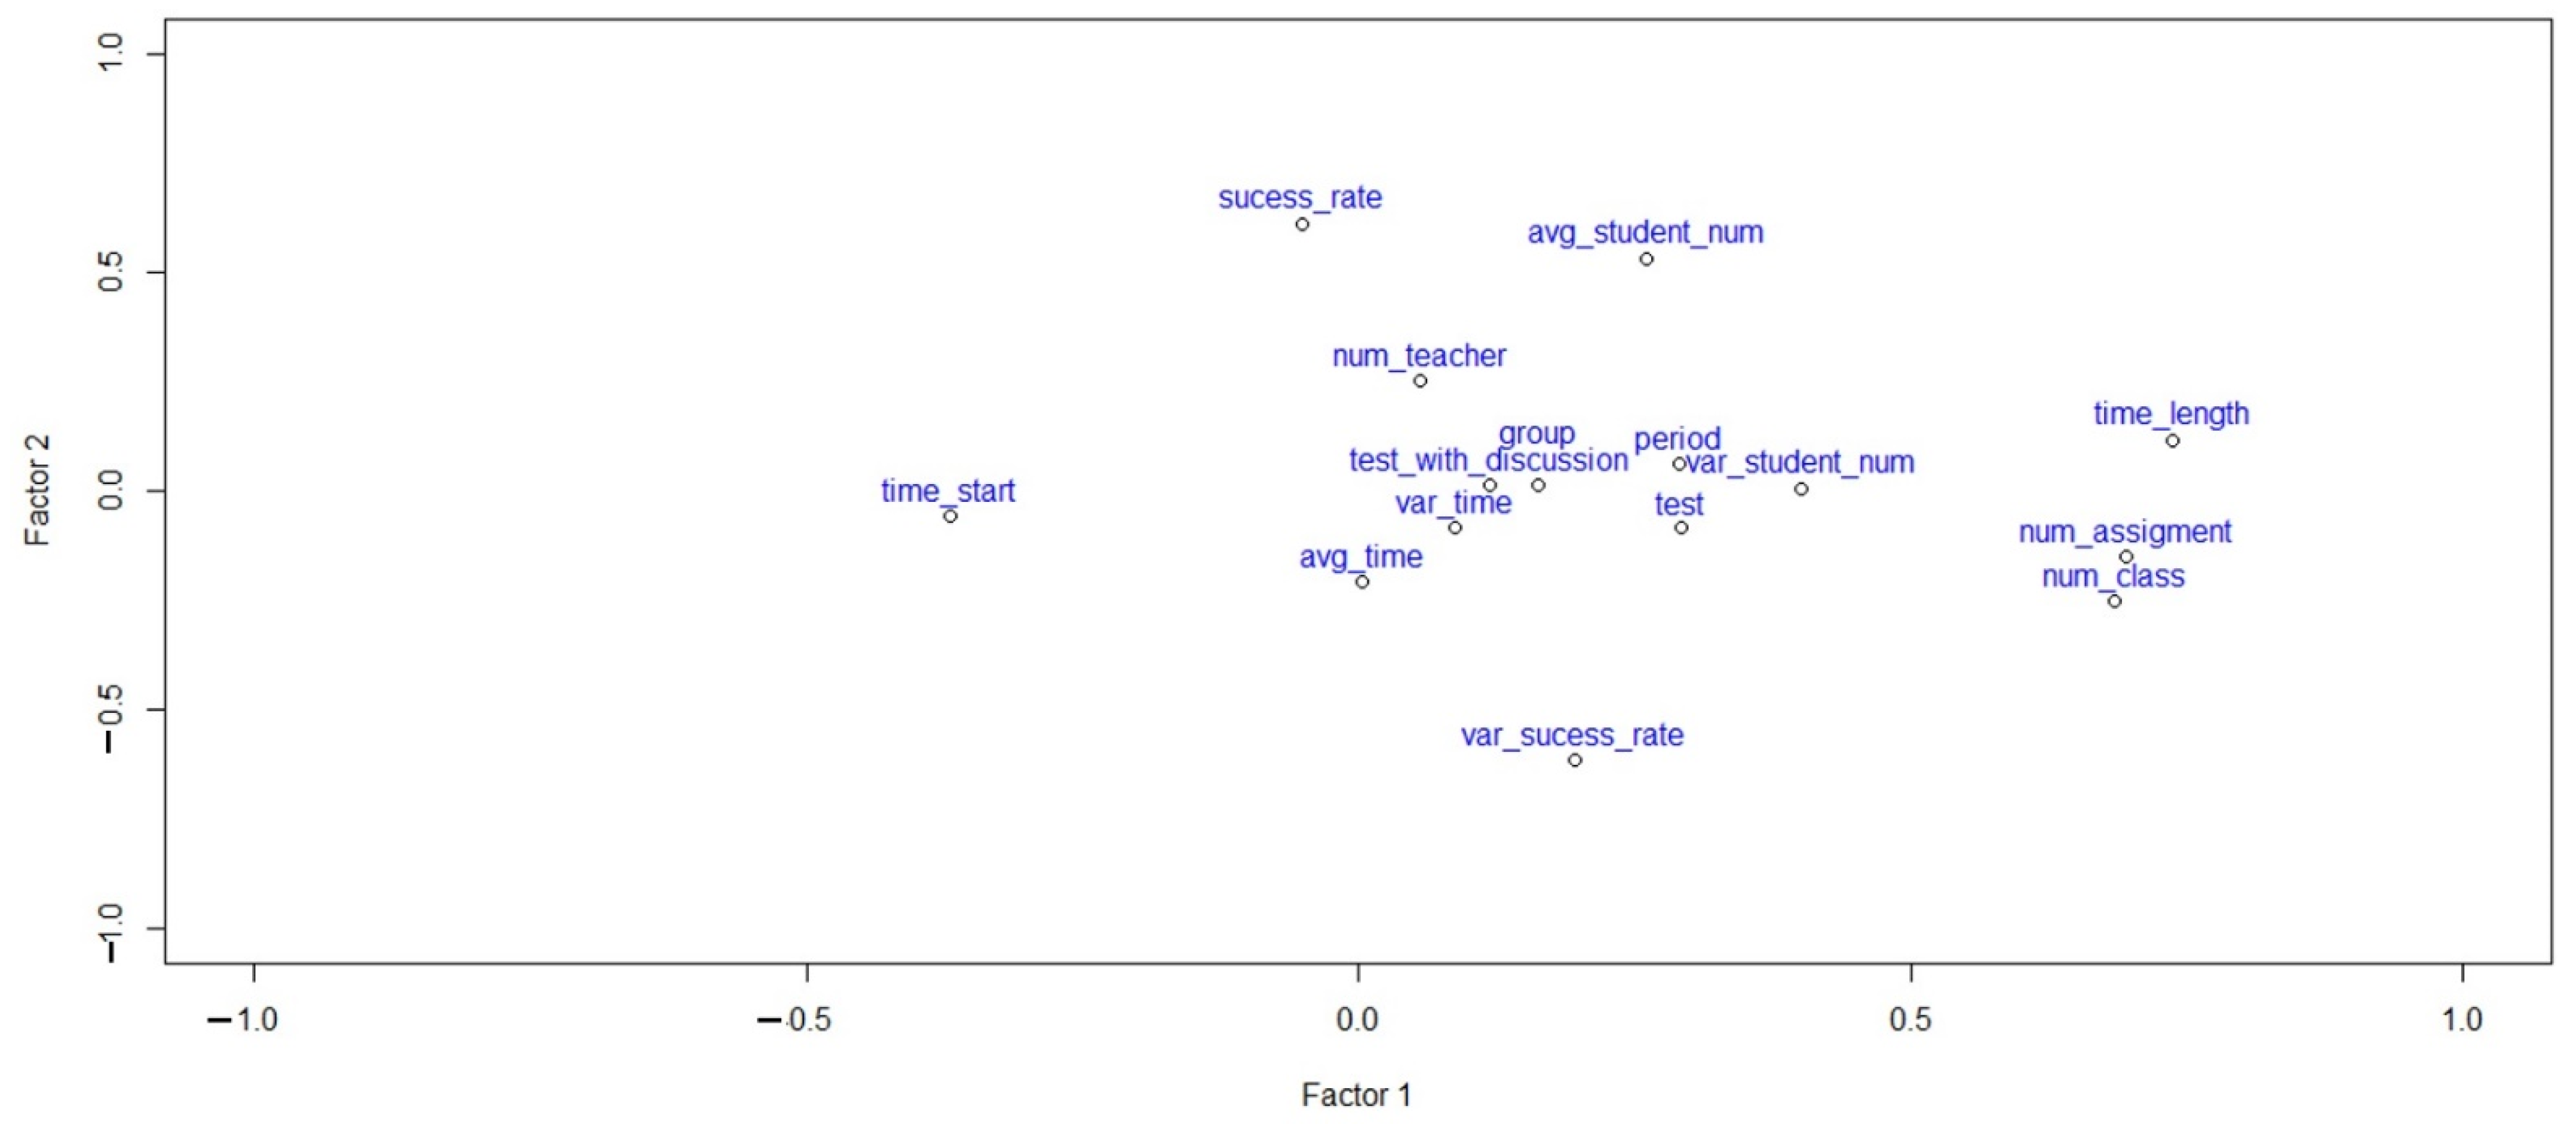
The data from the second data set were also analyzed using factor analysis with a pair of factors on normalized data. For each numerical quantity, the extent of how much it intervened with the given factor was studied. The results of the factor analysis are presented in
Figure 5.
Factor 1 in the chart above has on the x-axis start time as the lowest value and, conversely, the variance of time per task, the average time, and number of tasks as the highest values. This factor could, therefore, be interpreted primarily as the start time of the teacher in the system.
Factor 2 in the chart above has on the y-axis high values for the total time of registration of teachers in the system and distinguishes mainly those teachers who have used the system for a long time from those who have used it for a shorter time.
3.3.2. Cluster Analysis
We again tried to divide the normalized data from the first data set into three groups using Ward’s hierarchical clustering. The three groups were selected according to the dendrogram. In the three clusters, we measured the average values of all numerical variables, which helped us with interpretation of individual clusters (
Table 5).
Classification of the obtained data resulted in the following characteristics of the individual clusters.
Cluster 1—Organized
For this cluster, we found a resemblance to the organized cluster from the first dataset. That is why we chose the same name. The cluster is characterized as follows: the largest numbers of teachers per school and big number of classes—quite probably organized by the school, very early start time and a large number of tasks and the longest time per task, typical behavior was to schedule most tasks at the beginning of the school year. They also had the lowest input period and used group tasks. In the second data set, it was 368 teachers, i.e., almost 70% of the teachers.
Cluster 2—Seekers
For the second group of teachers, we used the same designation as the third group from the first dataset. The basic characteristics of this group are that they started late and their average work time was less than three days. This corresponds to the low number of tasks and students. Within the second data set, the number of teachers with this characteristic decreased and corresponded to only 54, i.e., about 10% of the teachers.
Cluster 3—Experimenters
This group is similar to the first – “organized”. It differs mainly by a higher period of assignment and lower use of group tasks and tests. It also has a lower number of teachers at the school and a slightly lower number of classes. Within the second data set, the number of teachers with these characteristics decreased and corresponded to only 108, i.e., about 20% of the teachers.
4. Summary
The cluster analysis conducted on the data sets showed that, while in the period of free use of the system, teachers who belonged to the hardworking category dominated, i.e., teachers who were working with a large number of different tasks and were ready to experiment with their pupils; in the second period, when the schools had to purchase a school license, the dominant group were the organized teachers. Given the results of the data analysis, it can be expected that when purchasing a school license, the use of the Techambition system becomes part of everyday life of the school. There are more teachers involved in work with the system, in many cases probably all mathematics teachers at the school. They can then share their experience. At the same time, work in the system becomes part of the common duties to be carried out by the pupils, which is reflected, among others, in the fact that there is a much greater return of the set tasks and greater success rate of pupils in solving them.
4.1. Transition between Clusters
The transitions of teachers between individual clusters deserve a separate analysis. Out of the 955 teachers surveyed in the first data set, 640 (67%) no longer joined work in Techambition in the following school year.
4.1.1. Organized
Out of the 294 teachers who were classified in the group in the first data set, 122 were included in the second dataset. Of these, 107 had the same characteristics (88%) while 14 were reassigned to the seekers group and only one to the experimenter group. The organized group thus represents a very stable group in terms of development over time. The support of the school ensures continuity and leads to a stable behavior of the vast majority of pupils and teachers.
Out of the 172 teachers who were assigned to the organized group in the first data set and no longer continued to work in the system in the second period, 126 teachers (73%) were in the situation when the entire school stopped using the system in the second period.
4.1.2. Hardworking
The hardworking group was the group with the largest changes in its characteristics. A cluster with the same characteristics was no longer recognized in the second dataset. Out of the 163 teachers who were included in this group in the first data set and participated in the work in the Techambition system in the second period as well, the vast majority (137, 84%) were assigned to the organized group in the second data set. Moreover, 21 teachers (13%) were newly characterized as seekers, and only 5 teachers (3%) were newly characterized as experimenters.
This is a relatively logical development. At the time of the first school closures in the Czech Republic, the system was open free of charge to all teachers, so the most active teachers at the school with an interest in computer technology joined the system. At the moment when the system was no longer free in the second period, these teachers either persuaded the school to use the system—the system got support, their colleagues joined, and the initiators moved into the organized group—or the system did not gain school support and the teachers were forced to stop using it. Almost two-thirds of the teachers who were characterized as the hardworking group stopped working in the system when it was no longer free. In 72% of the cases, this was the situation when the whole school stopped using the system.
4.1.3. Seekers
The last group was seekers. The vast majority of them (85%) no longer joined the Techambition system in the second period. Out of the 30 teachers who were evaluated as seekers in the first period, 18 were evaluated as organized and 11 was evaluated as seekers within both data sets. Only one teacher was evaluated as an experimenter.
This can be interpreted to mean that teachers with the characteristics of seekers had no reason to try to persuade the school to buy the system and, therefore, most of them left the system. This assumption is confirmed by the fact that 82% of these were teachers from schools that no longer used the system in the second period. However, if the school started using the license, half of this group changed their behavior and fell into one of the hardworking or organized groups. We cannot say what happened to the 32 teachers who were characterized as seekers in the first dataset and did not participate in the work in the second period in case the school continued using the system. One of the reasons could be that they did not work at the school in the second period or that the school did not switch to global use and even though their colleagues from the school used the Techambition system, the use of the system at the school was not mandatory.
4.2. New Users of the System
In the group of teachers who were first characterized in the second data set, 49% were characterized as organized, 29% as seekers, and 22% as experimenters.
5. Conclusions
Although emergency remote teaching has been the subject of research in a number of countries, the presented research is unique because it describes teachers’ behavior by analyzing data obtained in collaboration with a commercial company that offered its teaching software to teachers during a pandemic for free. The presented data have some limitations, which stem from the fact that it was primarily intended for a different purpose. Thus, we cannot monitor some important factors, such as gender, age, or the length of practice of the involved teachers. Despite this limitation, they provide an important insight into the situation and allow us to describe the basic patterns of behavior by which software providers can predict subsequent user behavior.
Statistical data on the behavior of secondary school mathematics teachers in the Techambition system provide very interesting information on how the behavior of the users (i.e., teachers) changed in the situation when an application was offered free of charge and then again in the licensed version. The analysis of the data shows that when the application is made available for free, three basic groups of users can be expected to appear:
Users with institutional support from the school where they teach. The work of these users is systematic and involves a large number of pupils. The users use the main functions of the system.
Users who use ICT actively. These are open to experimenting and are willing to learn and use even the less usual functions of the application. Typically, they spend more time working with the system.
Users who only want to test the system, often with a small group of pupils. If they do not find the system interesting, they cease using it.
The study also shows that within the sample, schools with more involved teachers exhibit greater involvement of pupils. The set tasks are submitted in time by a larger proportion of pupils with greater success in solving them. We interpret this to mean that the use of ICT becomes an integral part of school duties and is accepted by both teachers and pupils.
Although the presented study focuses on the very specific situation of using one of the systems to support the teaching of mathematics in the Czech Republic, we believe that the behavior of teachers (i.e., ICT users) can be generalized and transferred to a broader level. That is, when familiarizing themselves with other software, users will be divided into similar groups according to their behavior.
We also expect that institutional support and unification of the use of specific tools in teaching leads to the situation in which they are accepted by both pupils and teachers, which will ultimately affect the effectiveness of their use. Based on the obtained data, we set a hypothesis that when implementing a new software, it is a much better strategy to work with all teachers from the beginning than to give programs to just one of them.
In both cases, these are hypotheses that deserve to be paid attention to in further research.
Author Contributions
Conceptualization, A.J. and V.H.; methodology, V.H.; validation, A.J.; formal analysis, V.H. and A.J.; investigation, A.J.; data curation, A.J.; writing and visualization A.J. All authors have read and agreed to the published version of the manuscript.
Funding
This research was funded by Progress grant number Q16.
Institutional Review Board Statement
Ethical review and approval were waived for this study, due to work with anonymized data provided by a third party.
Data Availability Statement
Conflicts of Interest
The authors declare no conflict of interest.
References
- 290 Million Students Out of School Due to COVID-19: UNESCO Releases First Global Numbers and Mobilizes Response. Available online: https://t.co/4dHXxPUlfc?amp=1 (accessed on 15 November 2021).
- Education: From Disruption to Recovery. Available online: https://en.unesco.org/covid19/educationresponse (accessed on 15 November 2021).
- Sadeck, O.; Cronjé, J. A continuum of teachers’ e-learning practices. In International Conference on e-Learning; Academic Conferences International Limited: Oxfordshire, UK, 2016; Volume 15, pp. 395–408. [Google Scholar]
- Ertmer, P.A. Teacher Pedagogical Beliefs and Classroom Technology use: A Critical Link. Available online: https://www.semanticscholar.org/paper/Teacher-Pedagogical-Beliefs-and-Classroom-Use%3A-a-Ertmer/00920dec4a93448bb88f9d546e552f0cf3d208c8 (accessed on 15 November 2021).
- Bradley, G.; Russell, G. Computer experience, school support, and computer anxiety. Educ. Psychol. Int. J. Exp. Educ. Psychol. 1997, 17, 267–284. [Google Scholar] [CrossRef]
- Shapka, J.D.; Ferrari, M. Computer-related attitudes and actions of teacher candidates. Comput. Hum. Behav. 2003, 19, 319–334. [Google Scholar] [CrossRef]
- Butt, R.L.; Raymond, D. Studying the nature and development of teachers’ knowledge using collaborative autobiography. Int. J. Educ. Res. 1989, 13, 403–419. [Google Scholar] [CrossRef]
- Raymond, D.; Butt, R.; Towsend, D. Contexts for teacher development: Insights from teachers’ stories. In Understanding Teacher Development; Hargreaves, A., Fullan, M., Eds.; Cassells: London, UK, 1991; pp. 196–221. [Google Scholar]
- Liu, S.-H. Factors related to pedagogical beliefs of teachers and technology integration. Comput. Educ. 2011, 56, 1012–1022. [Google Scholar] [CrossRef]
- Hodges, C.; Moore, S.; Lockee, B.; Trust, T.; Bond, A. The Difference between Emergency Remote Teaching and Online Learning. Available online: https://bit.ly/3hx5amz (accessed on 12 December 2021).
- Bozkurt, A.; Sharma, R.C. Emergency remote teaching in a time of global crisis due to CoronaVirus pandemic. Asian J. Distance Educ. 2020, 15, i–vi. [Google Scholar]
- Zamora-Antuñano, M.A.; Rodríguez-Reséndiz, J.; Rodriguez Segura, L.; Cruz Pérez, M.Á.; Altamirano Corro, J.A.; Paredes-Garcia, W.J.; Rodríguez-Reséndiz, H. Analysis of Emergency Remote Education in COVID-19 Crisis Focused on the Perception of the Teachers. Sustainability 2021, 13, 3820. [Google Scholar] [CrossRef]
- Kohnke, L.; Zou, D.; Zhang, R. Pre-Service Teachers’ Perceptions of Emotions and self-regulatory learning in emergency remote learning. Sustainability 2021, 13, 7111. [Google Scholar] [CrossRef]
- Seabra, F.; Teixeira, A.; Abelha, M.; Aires, L. Emergency remote teaching and learning in Portugal: Teachers’ perceptions. Educ. Sci. 2021, 11, 349. [Google Scholar] [CrossRef]
- Shim, T.E.; Lee, S.Y. College students’ experience of emergency remote teaching due to COVID-19. Child. Youth Serv. Rev. 2020, 119, 105578. [Google Scholar] [CrossRef] [PubMed]
- Manca, S.; Delfino, M. Adapting educational practices in emergency remote education: Continuity and change from a student perspective. Br. J. Educ. Technol. 2021. [Google Scholar] [CrossRef]
- Ferri, F.; Grifoni, P.; Guzzo, T. Online learning and emergency remote teaching: Opportunities and challenges in emergency situations. Societies 2020, 10, 86. [Google Scholar] [CrossRef]
- Brom, C.; Lukavský, J.; Greger, D.; Hannemann, T.; Straková, J.; Švaříček, R. Mandatory home education during the COVID-19 lockdown in the Czech Republic: A rapid survey of 1st-9th graders’ parents. Front. Educ. 2020, 5, 18. [Google Scholar] [CrossRef]
- Ferguson, N.M.; Cummings, D.A.; Fraser, C.; Cajka, J.C.; Cooley, P.C.; Burke, D.S. Strategies for mitigating an influenza pandemic. Nature 2006, 442, 448–452. [Google Scholar] [CrossRef] [PubMed]
- Distanční Vzdělávání v Základních a Středních Školách. Available online: https://www.csicr.cz/Csicr/media/Prilohy/2021_p%C5%99%C3%ADlohy/Dokumenty/TZ_Distancni-vzdelavani-v-ZS-a-SS_brezen-2021.pdf (accessed on 15 November 2021).
- Jančařík, A. e-Learning and Classroom Learning Activities. In Proceedings of the 18th European Conference on e-Learning (ECEL 2019), Copenhagen, Denmark, 7–8 November 2019; Rikke, Ø., Buhl, M., Meyer, B., Eds.; ACPIL, Reading, GB: Oxfordshire, UK, 2019; pp. 239–246. [Google Scholar]
| Publisher’s Note: MDPI stays neutral with regard to jurisdictional claims in published maps and institutional affiliations. |
© 2021 by the authors. Licensee MDPI, Basel, Switzerland. This article is an open access article distributed under the terms and conditions of the Creative Commons Attribution (CC BY) license (https://creativecommons.org/licenses/by/4.0/).


