1. Introduction
As instructors, we are assigned classrooms. We can make requests if we have enough seniority, but even then, there are no guarantees. We all want to get through to our students, and we all want the best environment for doing so. At one time, that environment was the porch of a Greek market where the Stoics met. Later, a one-room schoolhouse gave most students all the education they would receive, while higher education evolved from students gathering in their professor’s office to listen and talk with them. Eventually, when the office could no longer accommodate the increased number of students, classrooms were built, giving students a place to sit, listen, and take notes.
Figure 1 depicts such a traditional classroom.
Before the days of the printing press, books were generally unavailable. Those that possessed them would read them to those that did not have them (or could not read). As these “lecturers” achieved a reputation, it became necessary (and profitable) to extend their reach as far as possible. This was achieved by following the model of the Greek theatron, the stadium-like seating around the stage.
Figure 2 illustrates how this model of conveying a lecture to an audience has persisted over a millennium despite books and a wide range of instructional technology being widely available and affordable.
Stadium-like classrooms are great for lecturing, but lecturing is not necessarily good for learning. An article in BBC NEWS [
1] asked whether lectures should not be obsolete by now, quoting research showing that students remember as little as 10% of their lecture just days afterward and referencing a Harvard study that found, on average, attendance at lectures falls from 79% at the start of the term to 43% at the end.
Prince [
2] found that problem-based learning (PBL) can be superior to traditional lecture-based learning. Bishop and Verleger [
3] report similar results for the flipped classroom, a particular type of PBL, which they define as an educational technique that consists of two parts: interactive group learning activities mediated by the instructor in the classroom and direct computer-based individual instruction outside the classroom.
Selingo [
4] proclaimed flipped learning as the future of higher education. This proclamation appears to have been a prophesy considering the exponential growth of research about the flipped classroom, shown in
Figure 3 from Talbot [
5]. This explosion in knowledge about flipped learning has encouraged its adoption in the classroom. According to the Flipped Learning Global Initiative, by 2017, approximately 16% of U.S. teachers were flipping their classes, 35% wanted training on how to flip their classes, and 46% of principals wanted new teachers who knew how to flip a class [
6]. As can be expected, adoption in the classroom has created a market for flipped products (software, hardware and services) which was valued at
$971 in 2018 and is forecasted to grow to
$1.9 Billion by 2024—a compound annual growth rate of 15.5% [
7].
Based on the theory that a new type of learning will require a new setting, in 2013, the then Dean of our College of Business initiated a remodeling program to convert existing classrooms to specifically support PBL, at a cost of approximately US $190,000 per classroom. The rooms are showpieces, with a very large (120”) screen at the front and from 5 to 8 group stations around the room, each consisting of tables (on wheels) with seating for six, a computer with internet access, and a large (90”) screen, where the students can project their work in process. Simultaneously, to encourage faculty to consider PBL, the Dean solicited proposals from the faculty for implementing it in their classes.
The authors proposal to implement flipped learning in a required undergraduate course in the Bachelor of Science in Business Administration (BSBA) program in the PBL classroom was accepted. With their course scheduled in the new PBL room, when they asked the Dean what he expected to see in the class, the response was “I do not want to see lecturing. I want to see student working in teams collaborating with each other, sweating to solve a complex problem.” His vision aligned directly with the flipped classroom.
Figure 4 shows a flipped class in action in one of the PBL classrooms.
The authors experienced success teaching their course as a flipped class in the PBL classroom. The average final grades increased by approximately 15 points and the range between the highest and lowest average final grade in the class decreased by over 45 points [
8]. Consequently, they adopted flipped learning in all their classes. Due to the limited number of PBL classrooms, however, their classes could not always be scheduled in PBL rooms, so they have taught their classes in the PBL rooms when fortunate enough to have been assigned to one and in flat or stadium classrooms when less fortunate. When not in a PBL room, they improvised to adapt the classroom to help, not interfere, with the collaborative work required of their students. For the flat classroom, this was simply to have the students drag desks together in groups of four to six and to share their work on their laptops. For the stadium classroom, the desktops and chairs are fastened to the floor, so the groups sat together, either strung out along one row or in two rows, with the students in front turning around to talk to the ones behind, again sharing work on the laptops.
Regardless of the classroom type assigned, all classes were flipped in the manner described in Swart [
9]. The school’s Learning Management System contained the lecture material (notes and videos) the students read and watched outside of class. During class, the lecture material is applied to an assigned problem or task, upon completion of which an individual quiz assesses how well the material was mastered. The instructor, instead of lecturing, moves from group to group, answering questions and providing guidance. Swart [
9] has shown that student outcomes and satisfaction are better with the flipped paradigm. We had not observed any change in grades, however, regardless of the type of classroom assigned. This led us to the overarching research question of what benefits in student learning are obtained from the monies that are being spent on creating PBL rooms?
In the next subsections, we will review pertinent literature to our research covering both learning spaces and transactional distances. The latter provides the theoretical foundations for the scale of transactional distance, which will be our measurement tool for the research.
1.1. Learning Spaces
Problem-based, or active learning, classrooms designed to facilitate collaborative work are becoming more common [
10,
11,
12]. Some research [
13,
14] has shown that students do not like collaborative learning, while others [
8,
15] have found no difference or improved student performance in collaborative settings. Student preference for entertaining and interactive learning environments was noted by Leverett et al. [
16]. Enhancements to learning spaces has been a topic for numerous authors [
17,
18,
19,
20]. In [
13], the authors noted the need for inquiry into the relationship between active learning classrooms and student attitudes toward collaborative learning.
Discussion of learning spaces goes back before any talk of collaborative learning. By 1979, Weinstein [
21] found enough research to provide a review concerning the physical environment of schools. The 2006 book
Learning Spaces [
22] provides a series of articles discussing how to “reconceptualize learning spaces to facilitate active, social, and experiential learning.” Clinton and Wilson [
23] note that classrooms were designed to facilitate lectures, but Peberdy [
24] notes many institutions are redesigning classrooms to facilitate active learning, despite the substantial costs. While students indicate that collaborative learning classrooms help their concentration [
25], Cleveland and Fisher [
26] call for better understanding of student opinions of their learning spaces. Clinton and Wilson [
23] provide a small study using their own survey of student perceptions of their course taught in both a traditional setting and a collaborative setting, concluding that “students perceived active-learning classrooms as better suited for collaborative learning than traditional classrooms …”. Swart [
9] found that student performance and satisfaction improved in flipped classes in the PBL classrooms compared to lecture-based classes in traditional classrooms.
1.2. Transactional Distance
The theory of transactional distance was developed by Michael G. Moore [
27] and is one of the seminal theories governing distance education. It constituted a paradigm shift in that it viewed “distance” as a social and communications gap, a space of potential misunderstandings between the instructor and learners. He proposed that transactional distance is a function of two sets of variables, dialogue (interaction) and structure (course design). High structure and low dialogue yield high transactional distance and vice versa.
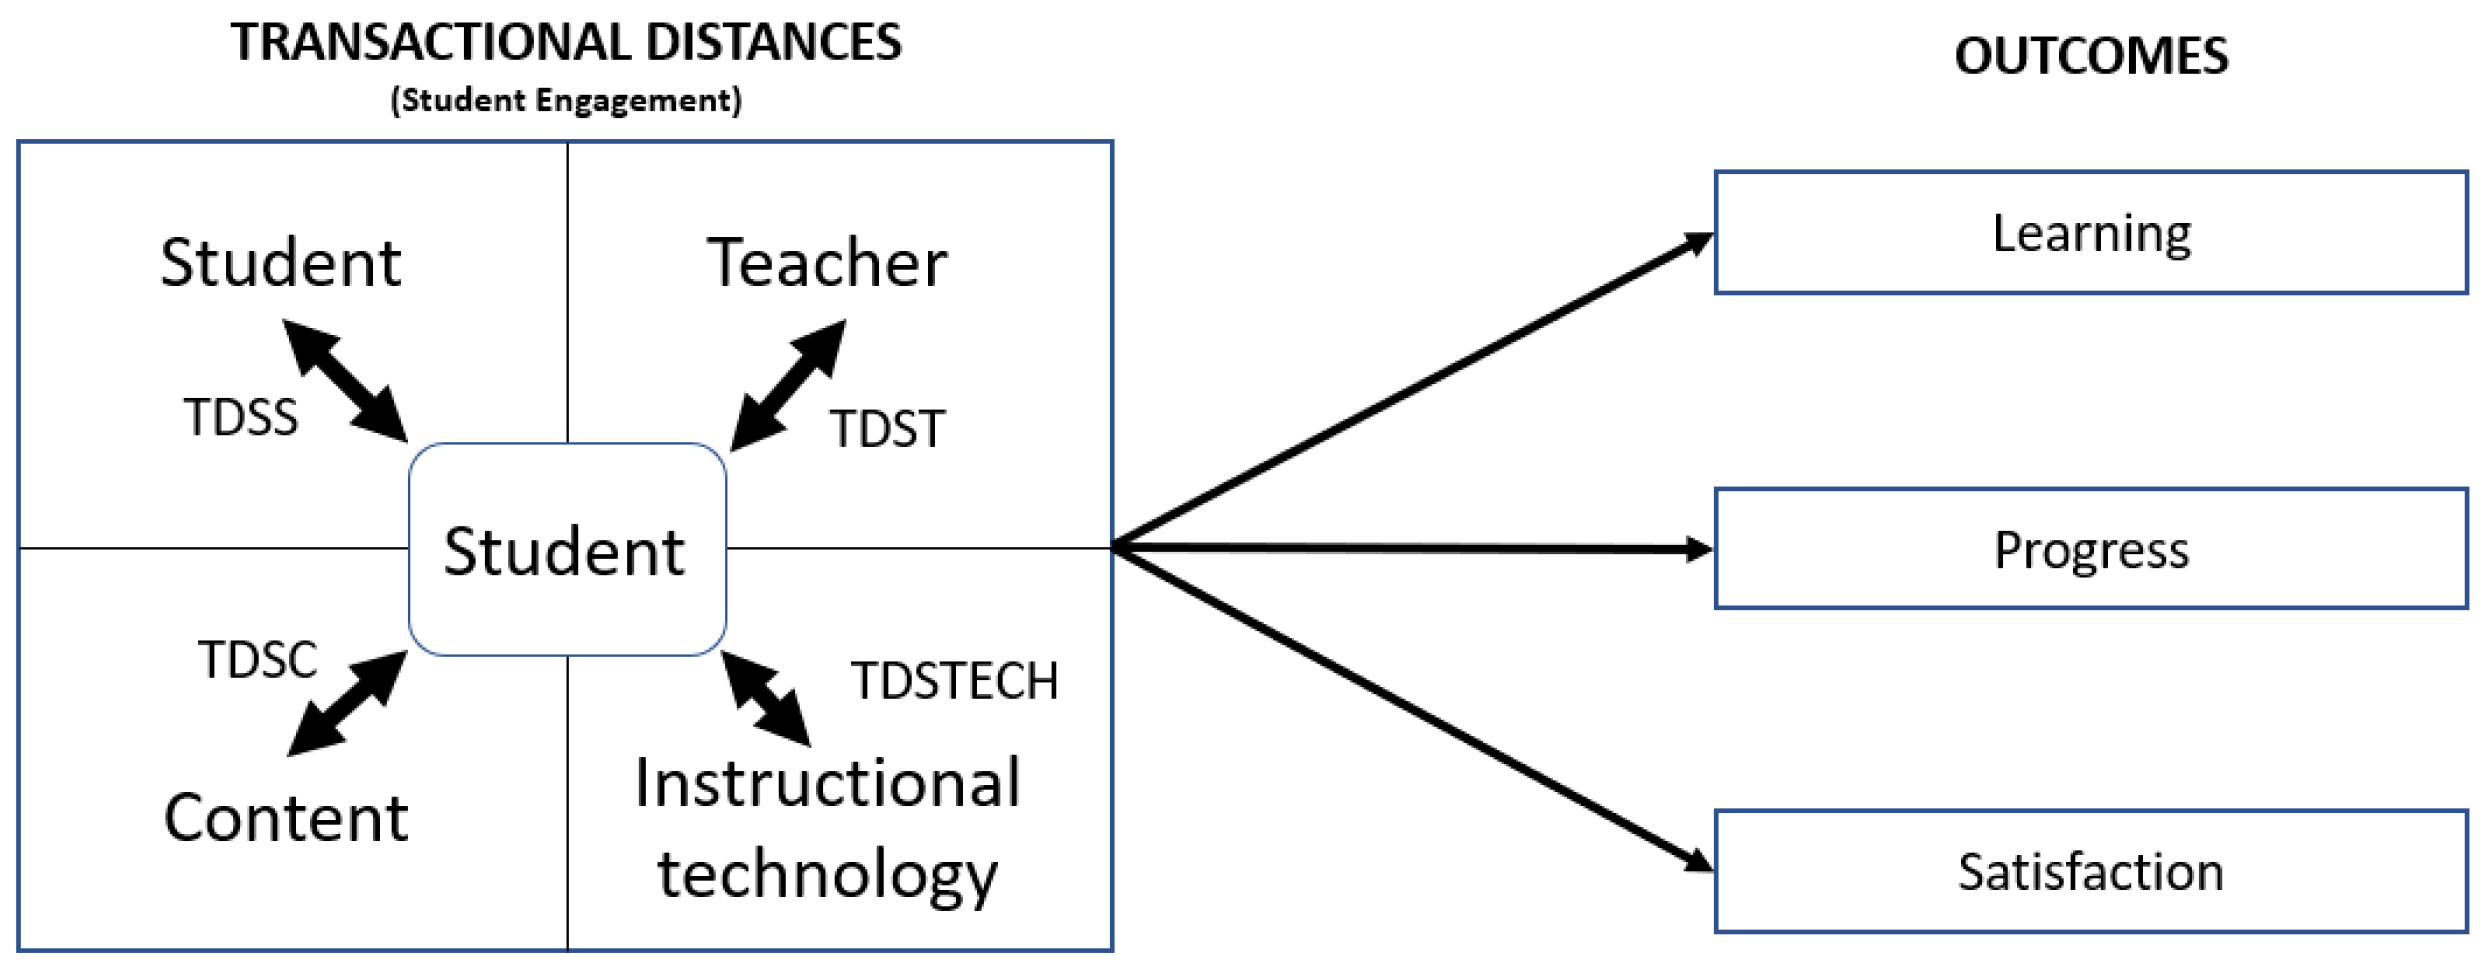
Zhang [
28] updated Moore’s theory to include online learning. She posited that transactional distance (TD) represented the barriers existing between students and their full engagement with the learning environment. She defined it as a multidimensional construct consisting of: transactional distance between student and student (TDSS), transactional distance between student and teacher (TDST), transactional distance between student and content (TDSC), and transactional distance between student and the instructional TECHnology used for teaching/learning (TDSTECH). She then postulated that these constructs resulted in three learning outcomes: student SATISFACTION with learning, PROGRESS toward achieving learning goals, and whether LEARNING has occurred in the class.
Zhang operationalized the above concepts by breaking down each construct into multiple elements, resulting in 31 questions plus the three outcomes, shown in
Appendix A. Each element is associated with a five-point Likert scale (1 = Untrue, 5 = True). The resulting questionnaire, referred to as the scale of transactional distance, was subjected to structural equation modelling techniques including exploratory and confirmatory factor analysis, confirming goodness of fit and validation of the scale [
28].
Figure 5 summarizes the content of the scale of transactional distance, detailed in
Appendix A. Student engagement is obtained from the responses to the element questions under TDSI, TDSC, TDSS, and TDSTECH, while outcomes are measured from the responses for LEARNING, GOALS, and SATISFACTION. All the responses are recorded on the same survey.
1.3. Research Hypotheses
Swart [
9] achieved a 15 point (out of 100) increase in final average grade when changing from a lecture to a flipped format. However, the authors did not find a difference in grades when the flipped course was taught in either a stadium, flat of PBL classroom. Grades are important to students. However, as instructors, Schwab et al. [
29] note that we are more interested in student learning. While we already knew that student grades in our flipped classes were not impacted by classroom type, we did want to find out whether classroom type impacted student engagement, which is “highly correlated with many desirable learning and personal developmental outcomes of college”, according to Axelson and Flick [
30]. Thus, from the data obtained from administering the scale of transactional distance survey, we tested the following four research hypotheses:
Hypothesis H10. Student engagement and outcomes in a flat classroom = student engagement and outcomes in a PBL classroom.
Hypothesis H1a. Student engagement and outcomes in a flat classroom ≠ student engagement and outcomes in a PBL classroom.
Independent-samples t-tests will be used to test these hypotheses. SPSS 27 will provide the results for both engagement and outcome, hence the reason for including both in the hypothesis.
Hypothesis H20. Student engagement and outcomes in a PBL classroom = student engagement and outcomes in a stadium classroom.
Hypothesis H2a. Student engagement and outcomes in a PBL classroom ≠ student engagement and outcomes in a stadium classroom.
Independent-samples t-tests will be used to test these hypotheses. SPSS 27 will provide the results for both engagement and outcome, hence the reason for including both in the hypothesis.
Hypothesis H30. Student engagement and outcomes in a stadium classroom = student engagement and outcomes in a flat classroom.
Hypothesis H3a. Student engagement and outcomes in a stadium classroom ≠ student engagement and outcomes in a flat classroom.
Independent-samples t-tests will be used to test these hypotheses. SPSS 27 will provide the results for both engagement and outcome, hence the reason for including both in the hypothesis.
Hypothesis H40. Student engagement and classroom type are unique significant predictors of outcomes.
Hypothesis H4a. Student engagement and classroom type are NOT unique significant predictors of outcomes.
Stepwise multiple regression will be used to test Research Hypothesis 4.
Hypotheses 1–3 refer to results obtained after the fact, when PBL rooms were already built. We envision the possibility of using the scale of transactional distance to evaluate alternate PBL room design using user focus groups. Focus groups could be presented with renderings of actual design alternatives, including virtual reality representations of the physical PBL room design alternatives. They could then fill out the scale of transactional distance survey indicating how they would respond to the questions for each design alternative. The results could then be entered into a robust regression model to predict student outcomes for each design alternative.
3. Results
Several researchers have shown that the three outcome measures are significantly correlated [
24,
31,
32]. We obtained the bivariate correlations to determine whether this was the case for our data as well. The results are presented in
Table 2.
The bivariate correlations shown in
Table 2 are statistically significant (
p < 0.001) and their Pearson Correlation Coefficients are 0.695 or higher. As done in several other studies [
23,
24,
30], we have elected SATISFACTION as the representative outcome in the rest of our analyses.
Table 3 exhibits the group statistics for the data obtained from the scale of transactional distance surveys.
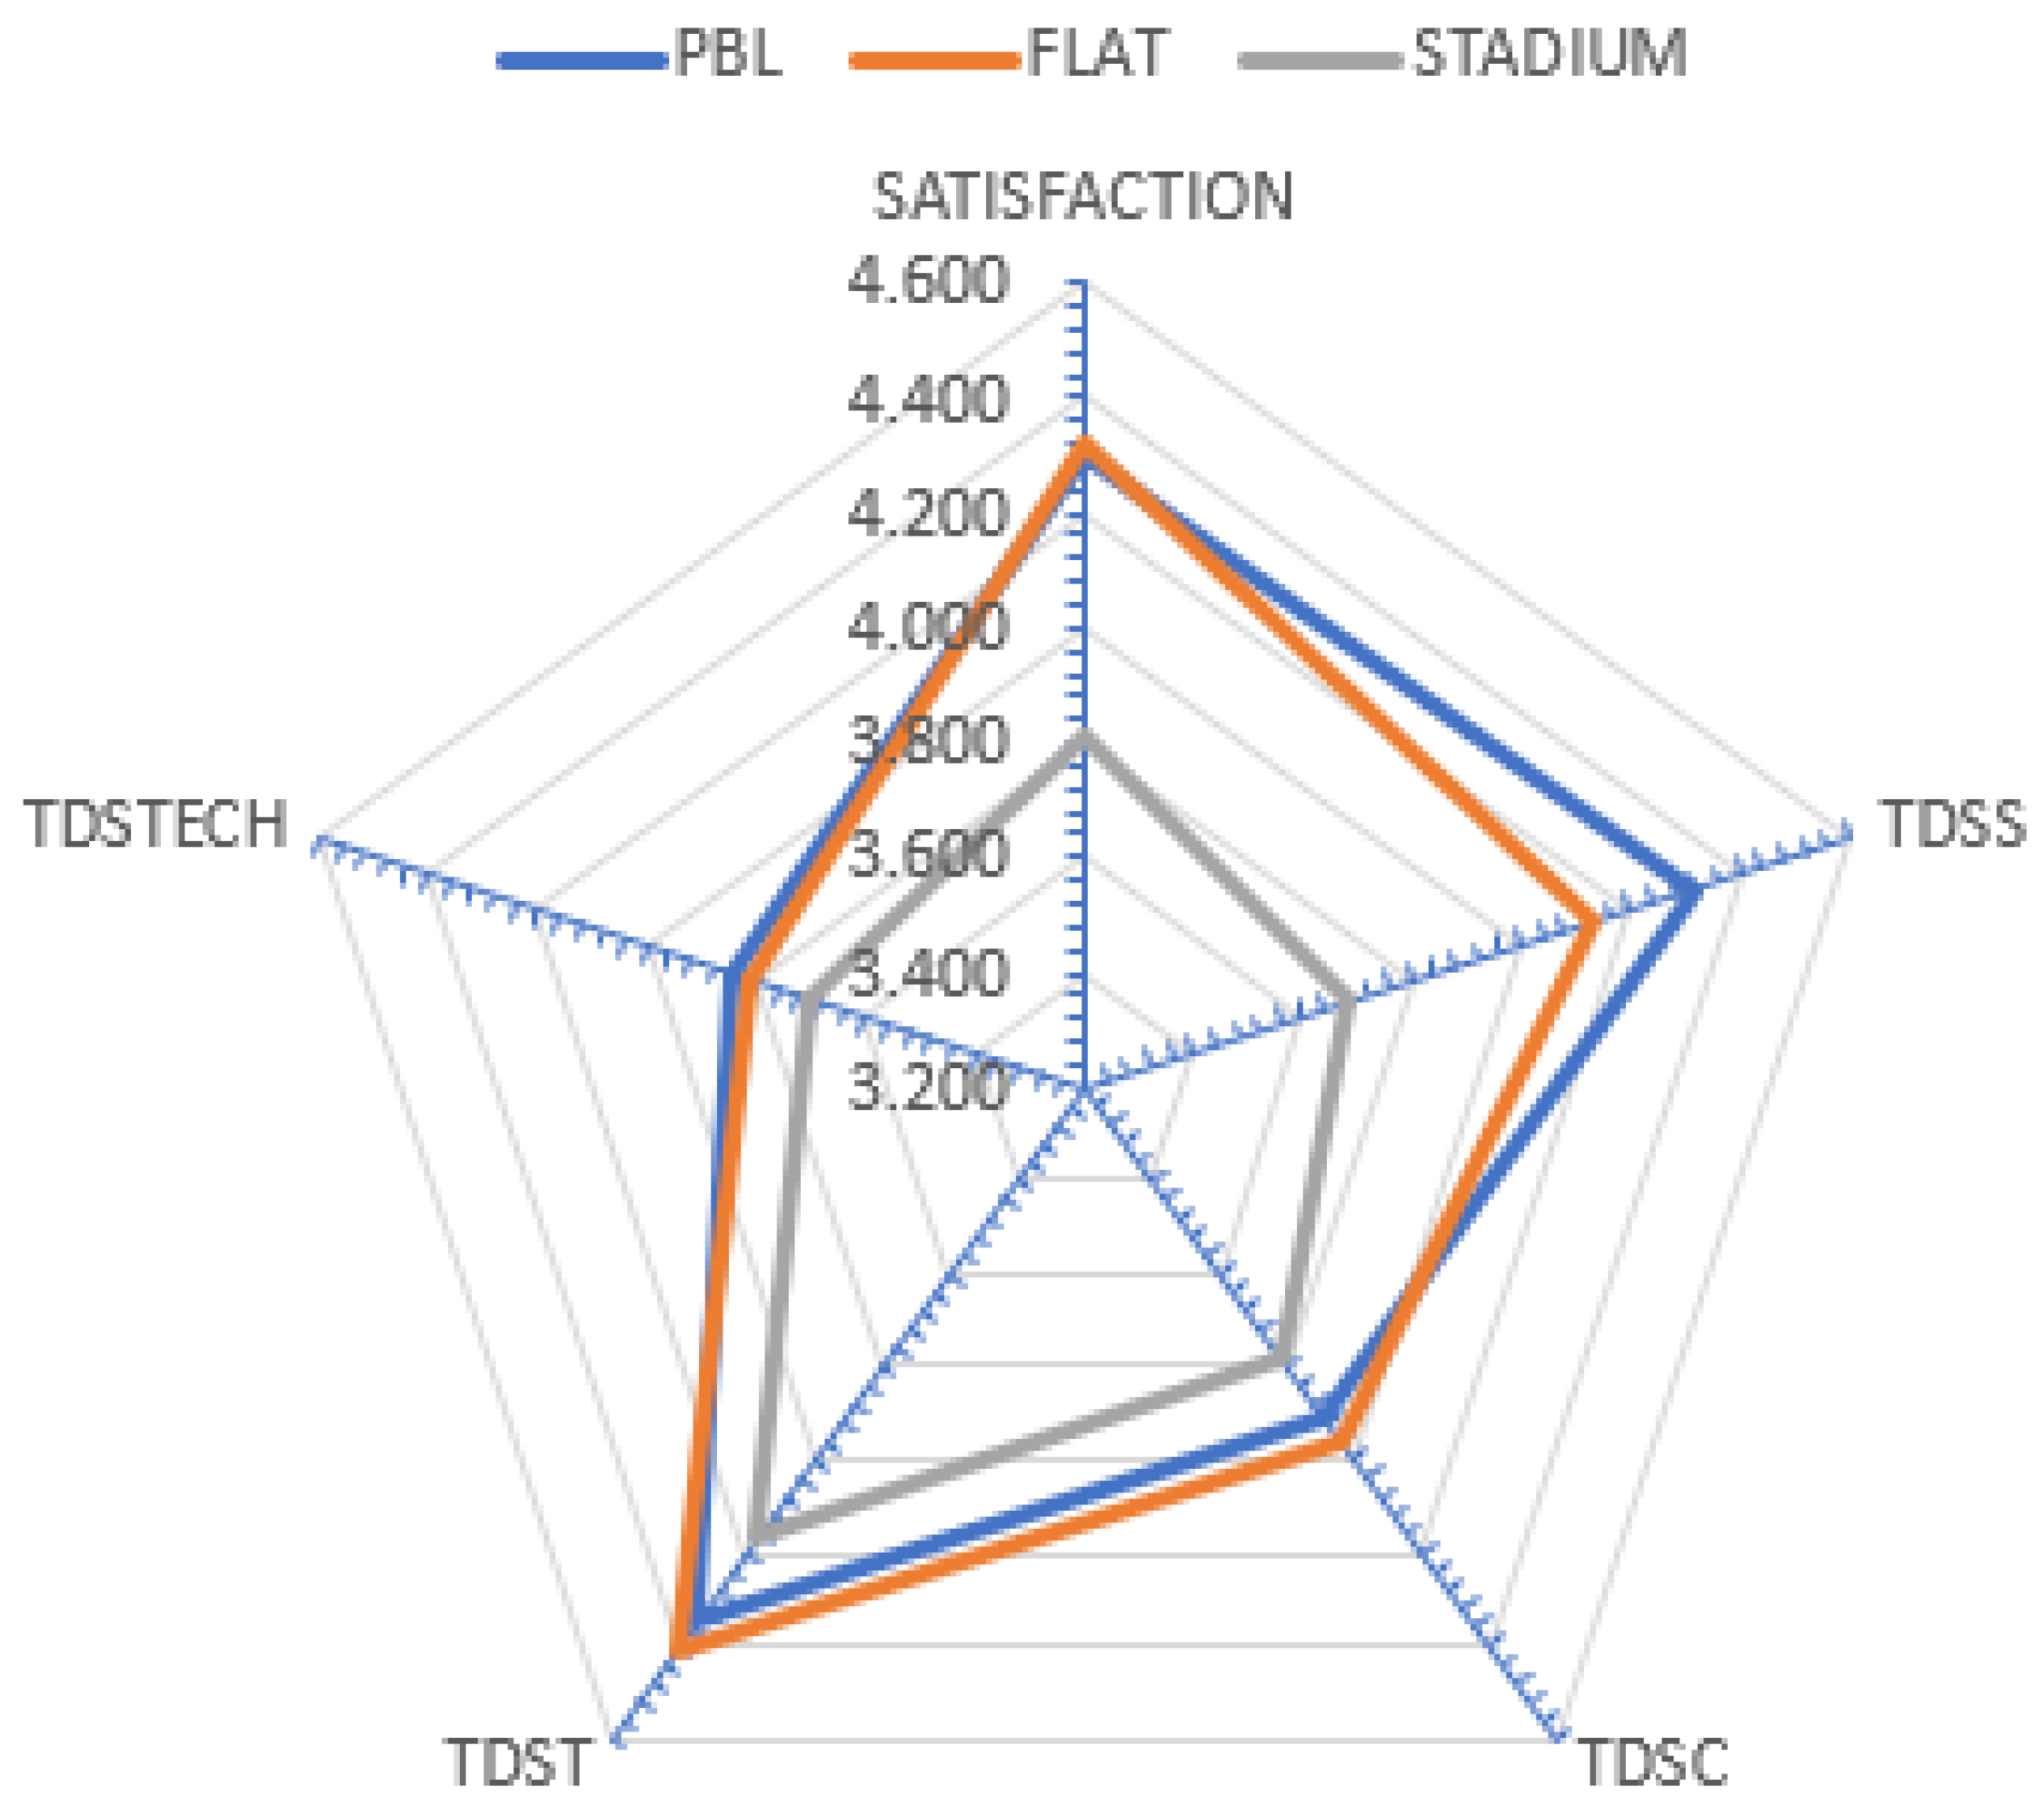
Figure 6 shows a radar graph comparing the means of the engagement factors and the outcome variable SATISFACTION for the three types of classrooms tested. The vertical axis shows the outcome variable SATISFACTION and each of the other four axes represent an engagement factor. The Likert scale in the scale of transactional distance was defined so that the greater the transactional distance, the better the engagement and outcomes. Although opposite to the traditional definition that a “big” distance is bad, we found that respondents were less confused filling out a survey in which big was associated with better. Thus, it appears as though the data indicates that the stadium classroom is not as good as either of the other two on all student engagement factors or outcome. To draw any conclusions from this data, we must test the statistical significance of the differences shown on the radar diagram.
3.1. Testing Research Hypothesis 1
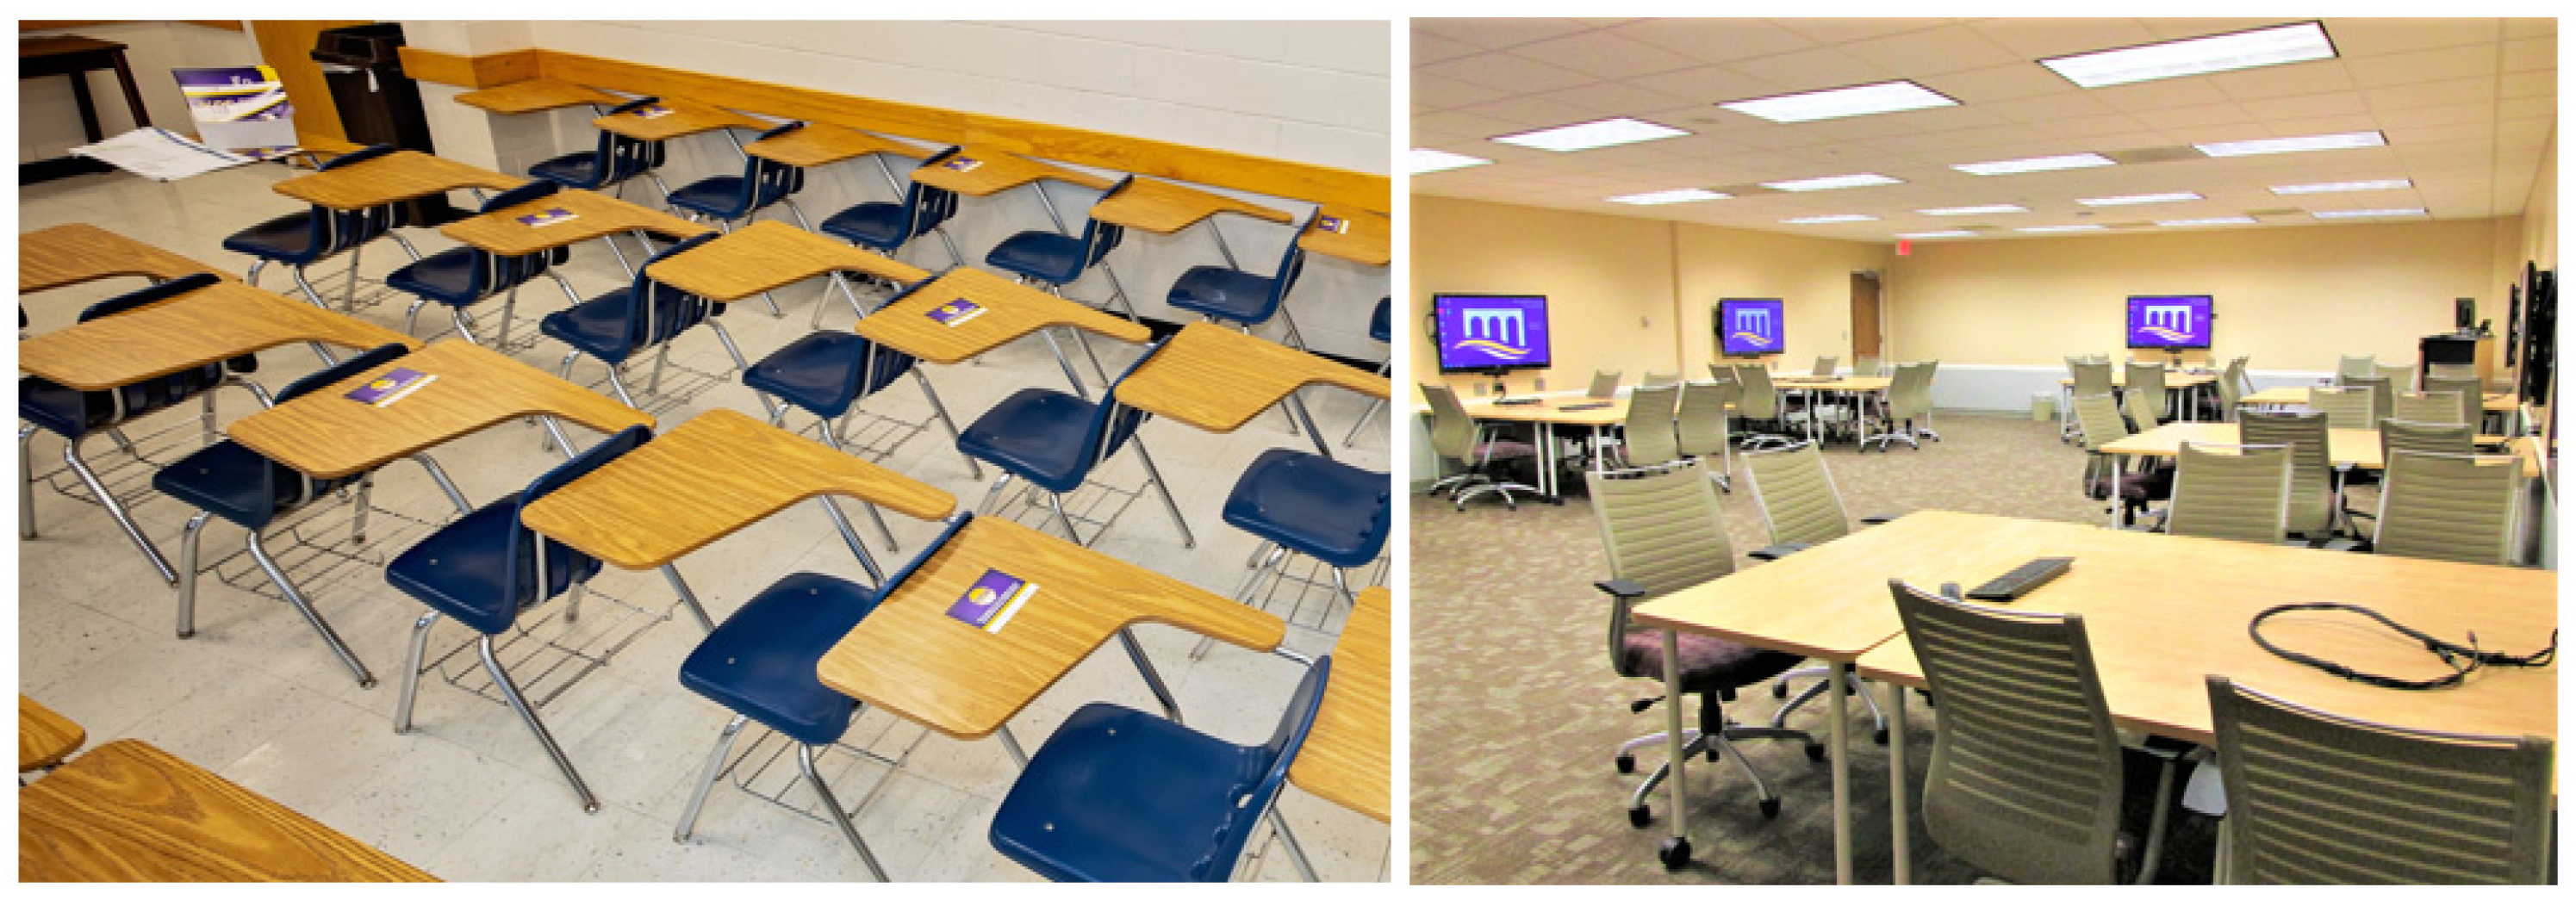
Figure 7 shows pictures of the actual PBL and flat classroom used by our students when they completed the scale of transactional distance survey.
The results of analyzing that data with an independent-samples
t-test are given in
Table 4. Levene’s Test for Equality of Variances was not rejected for any of the engagement factors or SATISFACTION, so the significance levels for the tests are drawn from the “Equal variances assumed” rows of the table. The results of the
t-test for equality of means support H1
0, indicating that there was no reason to believe that there were any statistically significant differences in student engagement (transactional distances) or SATISFACTION between the PBL and the flat classroom.
3.2. Testing Research Hypothesis 2
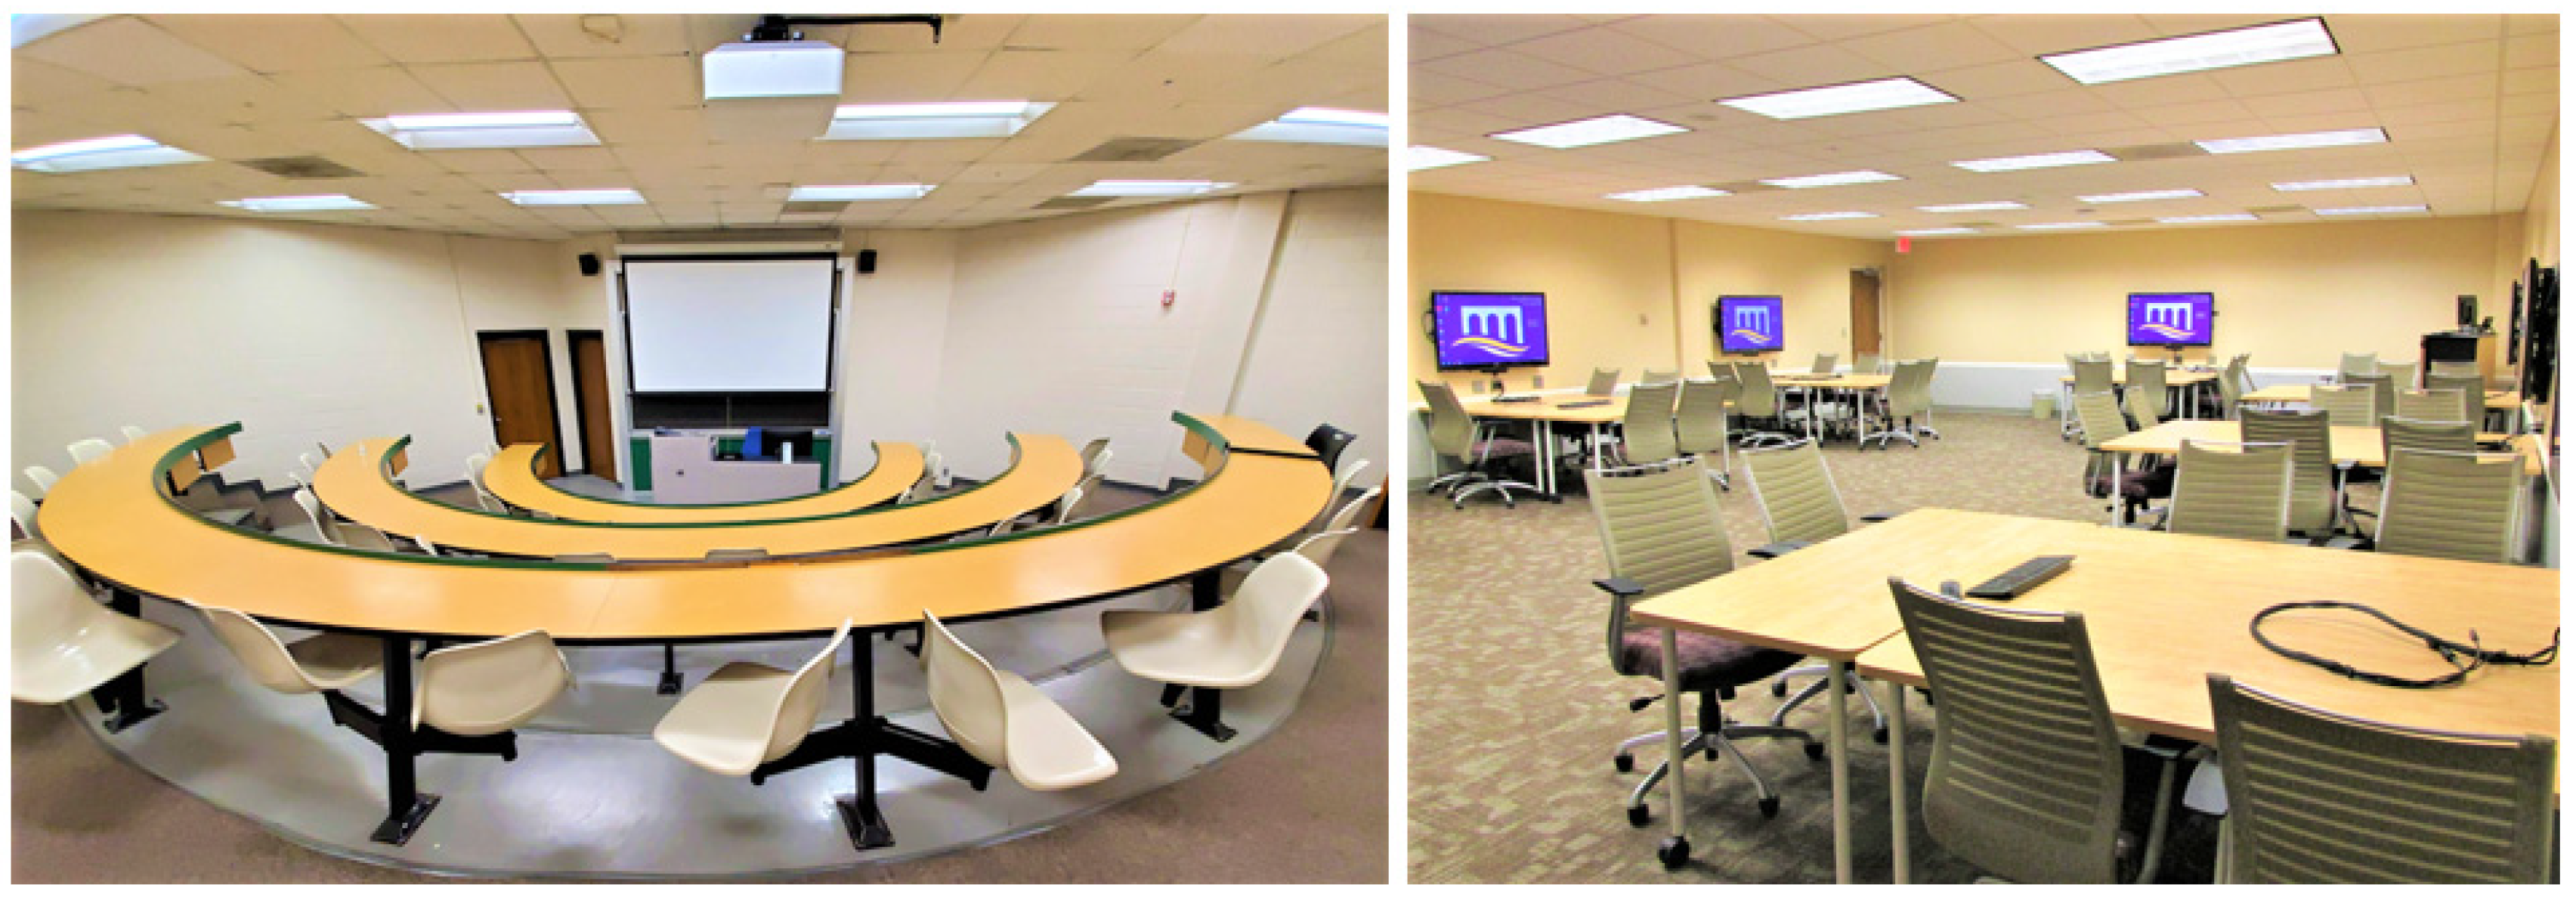
Figure 8 shows pictures of the actual stadium and PBL classrooms used by our students when they completed the scale of transactional distance survey.
The results of analyzing that data with an independent-samples
t-test are given in
Table 5. The result of Levene’s Test for Equality of variances indicated that equality of variances could not be assumed for TDSS, TDSC, and TDSTECH. Thus, the significance levels of the tests for these factors had to be obtained from the “Equal variances not assumed” rows of the table.
The results of the t-tests indicated that there was a significant difference between the transactional distance between student and student in the two rooms (p < 0.002). There was also a marginal statistical difference in SATISFACTION between the two rooms (p < 0.078). Thus, H20 is not supported for TDST or for SATISFACTION at a level of significance of 0.078.
3.3. Testing Research Hypotheses 3
Figure 9 shows pictures of the actual stadium and flat classrooms used by our students when they completed the scale of transactional distance survey.
The results of analyzing that data with an independent-samples
t-test are given in
Table 6. The result of Levene’s Test for Equality of Variances indicated that equality of variances could not be assumed for any of the factors or the outcome data. Thus, the significance levels of the tests for these all these had to be obtained from the “Equal variances not assumed” rows of the table.
The results of the t-tests indicated that there was a significant difference between the transactional distance between student and student in the two rooms (p < 0.017) as well as between SATISFACTION between the two rooms (p < 0.029). There also was a marginal statistical difference in TDST between the two rooms. Thus, H20 is not supported for TDSS and SATISFACTION nor for TDST at a significance level of 0.094.
3.4. Research Hypothesis 4
Stepwise multiple regression was used to test Research Hypothesis 4. The dependent variable was SATISFACTION, and the independent variables were TDSS, TDSC, TDST, TDSTECH, STADIUM and FLAT. The last two are indicator variables to account for classroom type. Note that PBL is the base case so that when the two indicator variables are zero, the data correspond to teaching in a PBL room.
Table 7 exhibits the results of the stepwise multiple regression. The robust regression equation is given by:
The predictor variables are significant as indicated by the note at the bottom of the table. The regression equation accounts for 59.4% of the variance and is significant. The VIF values give no indication of multicollinearity. Classroom type is not a significant predictor of SATISFACTION and, because of their significant bivariate correlations with each other, neither are LEARNING or PROGRESS. Thus, H40 is not supported.
4. Discussion
Table 8 summarizes the significant results from testing research hypotheses 1–3 and indicates how the three classroom types that were used for flipped learning compared in terms of student engagement (measured by the four transactional distance factors) and outcomes.
To make sense of this data, we have copied the measurements on the TDSS, TDST, and satisfaction axes, showing the actual transactional distance scores, from the radar graph (
Figure 5) and shown them in
Figure 10. TDSC (student-to-content) and TDSTECH (student-to-technology) were not included in
Figure 10 since they had no significant differences for any of the comparisons. For TDSC, this was not surprising since the content is delivered identically, via the LMS, to all students who must learn it outside of class, as required for flipped classes. We were surprised that the additional technology (TDSTECH) of the PBL room seems not to have mattered to the students: file-sharing is just easy on their portable computing devices, no matter what the classroom type.
Regarding
Figure 10, beginning with SATISFACTION, both the flat and the PBL rooms were statistically different from the stadium room. On the graph, the PBL and flat bars both extend to the right, which is why they have no significant differences between them, while both show significant differences from the stadium classroom. If this were a lecture-based class, this result would have been surprising, since a stadium (or tiered) classroom is designed for lecturing. As previously noted, a stadium classroom is not likely the best design for a “flipped” class, and this appears to be reflected in the SATIFACTION data. The fixed desktops and chairs were simply awkward for the students working in groups and equally awkward for the instructor when trying to squeeze between the rows to work with the groups, explaining details of the material or helping them get back on track to solve the problem. That kind of interaction is exactly what the PBL classroom was designed to facilitate, so it is rather surprising that the flat classroom garnered just as good SATISFACTION numbers. Provided the students were able to work together effectively, they appear to be equally satisfied whether in the high-tech PBL room or simply rearranging the desks in a flat classroom. As noted earlier, the scale of transactional distance has three auto-correlated outcomes represented by SATISFACTION, so similar result would have been obtained if LEARNING or PROGRESS had been used instead.
Considering student engagement with other students, both PBL and flat classrooms had statistically better (0.002 for PBL and 0.017 for flat) results for student-to-student (TDSS) interactions than the stadium classroom. Again, this can be attributed to the classes being flipped. In flipped classes, class time is devoted to interactive group learning, requiring real time, face-to-face communication. The tiered classroom simply does not meet the needs of the students, presenting a barrier to their ability to interact with one another, as shown in the transactional distance of the PBL and flat TDSS (4.313 and 4.134, respectively) scores from the stadium TDSS score (3.688). More surprising was the lack of significant difference between the PBL and flat classrooms. It would seem that the technology and pod arrangement were not as important as simply the ability to see one another (when the desks were rearranged into groups) and the ability to share files on their laptops. With the focus of the classroom time on solving a problem, the special advantages of the PBL room may have been lost in the student’s concentration on the work to be done.
The final statistically different result was for the engagement of students with the instructor (TDST), where the flat classroom is significantly greater (p < 0.094) than the stadium classroom. Flipped classes require that the instructor be a learning coach and consultant to teams and individuals. This requires the instructor to move from one group to another. Such movement is easier in the flat room because the instructor can walk from one team to another without physical barriers. In a stadium room student teams are at various levels and it is awkward for the instructor to move from one level to the next because it requires exiting one row, moving to a different tier, and then moving across the row where the team requiring attention is located. Further, the instructor is either standing before a group of six students spread out in a row or standing in the middle of the group split between two rows. In either setting, approximately half of the group would have a difficult time seeing what the instructor was demonstrating.
Given that flat classrooms were statistically superior to stadium classrooms on the TDST score, it was almost unbelievable that the PBL classrooms were not. In both cases, the instructor stands at one edge of the group, so it would seem, at first glance, that the two were identical, but the students perceived a difference. Somehow, the physical barriers of the stadium layout equate to other barriers in the PBL layout, perhaps that the students face a wall (screen) in the PBL room rather than the instructor. In the PBL rooms, the groups are located along the walls, with an open area in the center of the room. In a flat classroom, the students invariably grouped the desks toward the center of the room rather than along the walls, so the instructor could literally turn around and be talking to another group. For that matter, it was not unusual for one group to “listen in” while the instructor was talking to a near-by group, thus gaining information before the instructor addressed that group. Perhaps it was simply the informality of the hastily rearranged flat classroom that made the students more comfortable, but clearly the PBL rooms gained no advantage over the flat classrooms in terms of students interacting to solve a problem.
The most unexpected result of our research is that there was no significant difference in student engagement or outcomes between the PBL and flat rooms. An entire book was devoted to reconceptualizing learning spaces to facilitate active, social, and experiential learning [
16] and many institutions are redesigning classrooms to facilitate active learning despite substantial costs [
14]. Yet, we found no evidence beyond this research that anyone has made such a decision based on data that proves that the investment in such classrooms can be justified in terms of improving student engagement or outcomes. Our results indicate that providing students with the ability to rearrange a flat classroom to face each other provided similar engagement and satisfaction as an expensive classroom reconfiguration. In short, while the technology (and luxury) of PBL classrooms is impressive to donors, visitors, and prospective students and their parents, students in this study find that they can do just as well without it.
Another indirect measure of student satisfaction is their willingness to recommend the course to other students. That question was included in the questionnaire and
Table 9 shows both the number of students and percentage for the three classrooms. These results reflected our statistical results. Similar percentage of students would recommend the class taught in the PBL and flat classrooms to their friends while a much lower numerical percentage would recommend the same course taught in the stadium room to their friends.
With the decline in on-campus enrollments [
33], campuses are under pressure to use every possible marketing strategy to attract students [
34]. Undoubtedly, therefore, impressive physical facilities, including classrooms, will continue to be built. Ideally, such classrooms will not only involve form, but also function. Thus, the question becomes one of how to predict student satisfaction for a classroom
before it is built, so that the investment decision can include costs as well as benefits/drawbacks to students. Research Hypothesis 4 was developed to answer this question and provided the robust prediction equation developed earlier:
It indicates that the classroom type is not a predictor of student satisfaction. What determines satisfaction is dictated by how well the classroom facilitates students learning the material (TDSC), by how well students can engage with each other in the classroom (TDSS), and by how well students can engage with the instructor in the classroom (TDSC). The fact that classroom type is not a predictor in the equation indicates that our data shows that neither classroom design has accomplished this any better than the others Thus, for this study, no classroom type is inherently better than another to produce student satisfaction (and the related outcomes).
We propose that the robust prediction model be used to evaluate alternate designs for future PBL room. Alternate PBL classroom design plans can be presented, one at a time, to a focus group consisting of classroom users. These alternate plans can be traditional plans and architectural renderings, but preferably they would consist of virtual reality models [
25,
35] that would allow users to experience the classroom as though it were already built. Based upon their experience and interaction with the PBL classroom design team, the focus groups members would be asked to complete the scale of transactional distance survey for each of the PBL design alternatives from which the TDSC, TDSS, and TDST could be calculated and used as input to the robust prediction model. This would yield a predicted measure of SATISFACTION for each design.
We recognize that many considerations must go into the selection of a best PBL classroom design. We posit that the impact of such a design on student engagement and satisfaction must be a primary consideration. Heretofore, it appears as though PBL rooms have been built on the presumption that they will improve student outcomes. This research presents a methodology that will allow the presumption to be tested before scarce resources are invested.
5. Conclusions
Our university, like several others, has invested hundreds of thousands of dollars in transforming traditional flat classrooms to PBL rooms and is currently gathering inputs on new technology and furniture requirements for consideration in the planning for the next generation of PBL rooms. Our results indicating that these expenditures may not have been necessary to achieve student engagement and outcome improvement are enlightening. However, as often is the case, aesthetics does not guarantee functionality.
We attribute some of our findings to the increased portability and capability of computing devices. Today’s smart phones and tablets make it extremely easy for students to pass around their devices to classmates. When the first generation of PBL rooms were constructed, great attention was given to facilitating the sharing of information within and between groups. At the time, sharing of devices was cumbersome at best, hence relying on projecting information on large screens seemed the best alternative. Our results suggest that it may no longer be necessary to invest in multiple workstations, each having a networked PC and large screen for problem-based learning.
There is no doubt that the PBL rooms are a great marketing and advancement tool. Every open house conducted by our College and University conducts tours of campus and the PBL rooms have a great WOW! factor associated them. They impress students and parents and do influence and steer students to consider our university as their choice. These rooms are also a favorite stopping point for the Dean to extoll our commitment to student learning to potential donors. To that end, every door to the PBL room serves as a window and it is common to see the Dean showing a potential donor a PBL room in action. The challenge is to find problem-based learning rooms that will serve the dual purpose of showing our commitment to student learning while simultaneously delivering on that promise.
6. Further Research
This research was motivated by the growing number of institutions, including ours, that have or are contemplating investing in special purpose classrooms dedicated to collaborative learning. We have dubbed these as problem-based learning (PBL) rooms.
The investments required are substantial—our institution has spent US $190,000 each to convert several traditional classrooms to PBL rooms. While the costs were clear, the benefits of doing so were, to the best of our knowledge, intuitive. It was assumed that outfitting classrooms with tables and chairs on wheels would facilitate collaboration and that networked computers with large display screens would facilitate student interaction with each other as they collaborated on solving problems.
While the above reasoning appealed to almost everyone’s intuition, there was no data to support the intuition. Did PBL rooms do a better job of engaging students and did they lead to better outcomes than other types of classrooms that might already be available?
We measured student engagement and outcomes in three different types of classrooms: stadium, flat and PBL. The same course was taught by the same instructor using flipped learning. Flipped learning required collaboration when the course met in a classroom. We used the scale of transactional distance to measure student engagement and outcomes in each of the classroom. Our results indicated that there was no significant difference in student engagement and outcome between the PBL rooms and the flat classrooms. Hence, from a student perspective, the investment in PBL rooms was not justifiable since students taking the course in traditional flat rooms were just as engaged and had similar outcomes.
Our results were for a specific type of pedagogy (flipped) and a specific business course, Business Analytics, a quantitative course requiring students to use computer models to solve problems. Thus, the results may not be transferrable to other types of collaborative learning or other types of disciplines. Research is required for alternative disciplines and collaboration modes to determine whether our results can be generalized.
However, our methodology is not dependent on subject matter or collaboration mode. It can be used to determine student engagement and outcomes in any subject, collaboration mode and/or classroom type. We tested the methodology on a specific flipped course in existent classrooms. Our results did make sense in identifying the stadium room as yielding the least student satisfaction and outcomes amongst the three types of classroom tested. This result that was confirmed by the much smaller number of students that would recommend the course to their friend when taught in a stadium room than if were taught in a PBL or flat classroom.
The purpose of our research was to provide a quantitative measure of student engagement and outcomes to decision makers before a decision was made to invest in a specific PBL room design. Our research has developed a tool that can compare actual classrooms based on student engagement and outcomes. Research is required on whether stakeholders confronted at the planning stage with several alternate classroom designs can evaluate such designs, preferably as virtual reality models, by completing the scale of transactional distance for each in order to provide decision makers with a measure of how each design would generate student engagement and outcomes and use this as part of their design selection criteria.


