3.1. Research Question 1
To make a statement about the change in intrinsic and extrinsic motivation, the answers to the questions of the questionnaire (Focus group) about intrinsic and extrinsic motivation are combined into one variable. If the new variable is a reliable measure of the form of motivation to be measured, a single variable provides more overview.
All questions about intrinsic motivation can be reliably combined into one variable (α = 0.827). Omitting one of the questions does not increase the reliability of the measurement (maximum α = 0.835). The same does not apply to all questions about extrinsic motivation (α = 0.403). The low value of Cronbach’s alpha makes aggregating all five questions an unreliable measurement. By removing questions, the mean of questions 2 and 5 does produce a reliable measurement (α = 0.723). The questions are also reported separately.
A
t-test is used to test whether the deviation from the mean (3 as neutral) is statistically significant. The findings can be found in
Table 3. The intrinsic and extrinsic motivation show an increase of 0.36 and 0.88, respectively. Both differences are very significant: t(24) = 3.57,
p = 0.002, and t(24) = 8.37,
p = 0.000, respectively. Autonomy also shows a significant increase: a deviation of 0.76 from neutral with t(24) = 8.72,
p = 0.000. Competency shows an increase of 0.60, which is also significant: t(24) = 5.20,
p = 0.000. As a final part of the degree of motivation, connectedness also shows an increase (0.32) that is significant: t(24) = 2.32,
p = 0.029. With an average of 3.72, students also indicate that they are generally satisfied with the ability to prepare. The value is 0.72 above neutral, showing a significant difference: t(24) = 3.85,
p = 0.001.
This section may be divided by subheadings. It should provide a concise and precise description of the experimental results, their interpretation, and the experimental conclusions that can be drawn.
The answers to the open questions are coded according to intrinsic motivation (IM), extrinsic motivation (EM), autonomy (A), competence (C), connectedness (V), and ability to prepare (M). In
Table 4 we present the numbers of remarks made in the open questions.
Most answers relate to autonomy and competence.
Table 4 shows that 18 pupils give a comment that indicates an increased sense of autonomy, while no comments indicate a decrease in this. Furthermore, 11 comments indicate a greater sense of competence, while four indicate a decreased sense of competence. Thus, in general, students seem to cite autonomy as the main advancement that the FtCA offers them.
To support the findings, the involved colleague of the teacher is interviewed.
Table 5 shows the number of comments during the interview related to motivation. From this, it follows that, as far as the interviewee is concerned, an increase in autonomy, competence, and connectedness are the main points of improvement of the FtCA, but that the sense of competence also decreases in a group of students.
The interview also shows that the interviewed colleague is predominantly positive about the use of the FtCA as a teaching method. The colleague in question has recently also switched to this method of teaching and is confident that in the long term it is an approach to teaching that will ensure that students perform better. A greater sense of autonomy, more cooperation, and, for some of the students, a greater sense of competence are also evident and can be cited as reasons for the expected growth in performance.
3.2. Research Question 2
The results of the tests before and after the intervention in the Focus group and the Control group show no significant deviation from a normal distribution according the Shapiro–Wilk test (
Table 6).
Based on the results of the Shapiro–Wilk test, a paired t-test is used to compare the scores. The Focus group appeared to score higher on average on the second test than on the first test (see
Table 7). However, this 0.45 improvement is not significant: t (27) = 1.25,
p = 0.224. The Control group shows a lower average on the second test than on the first. However, this deterioration of 0.36 is not statistically significant: t (28) = −0.92,
p = 0.364.
Furthermore, the difference between boys and girls was examined by splitting the data into a group of boys (13) and a group of girls (15). The results of the tests in the Focus group and the Control group show no significant deviation from a normal distribution according to the Shapiro–Wilk test (See
Table 8). Based on the results of the Shapiro–Wilk test, a paired
t-test is used comparing the scores of the Focus group.
The group of 15 girls scored higher (see also
Table 9) after the intervention than before, but the difference of 0.20 is not statistically significant: t (14) = −0.52,
p = 0.615. The group of 13 boys showed a stronger increase in the mean between before and after the intervention. However, the difference of 0.73 is also not statistically significant: t (12) = −1.15,
p = 0.
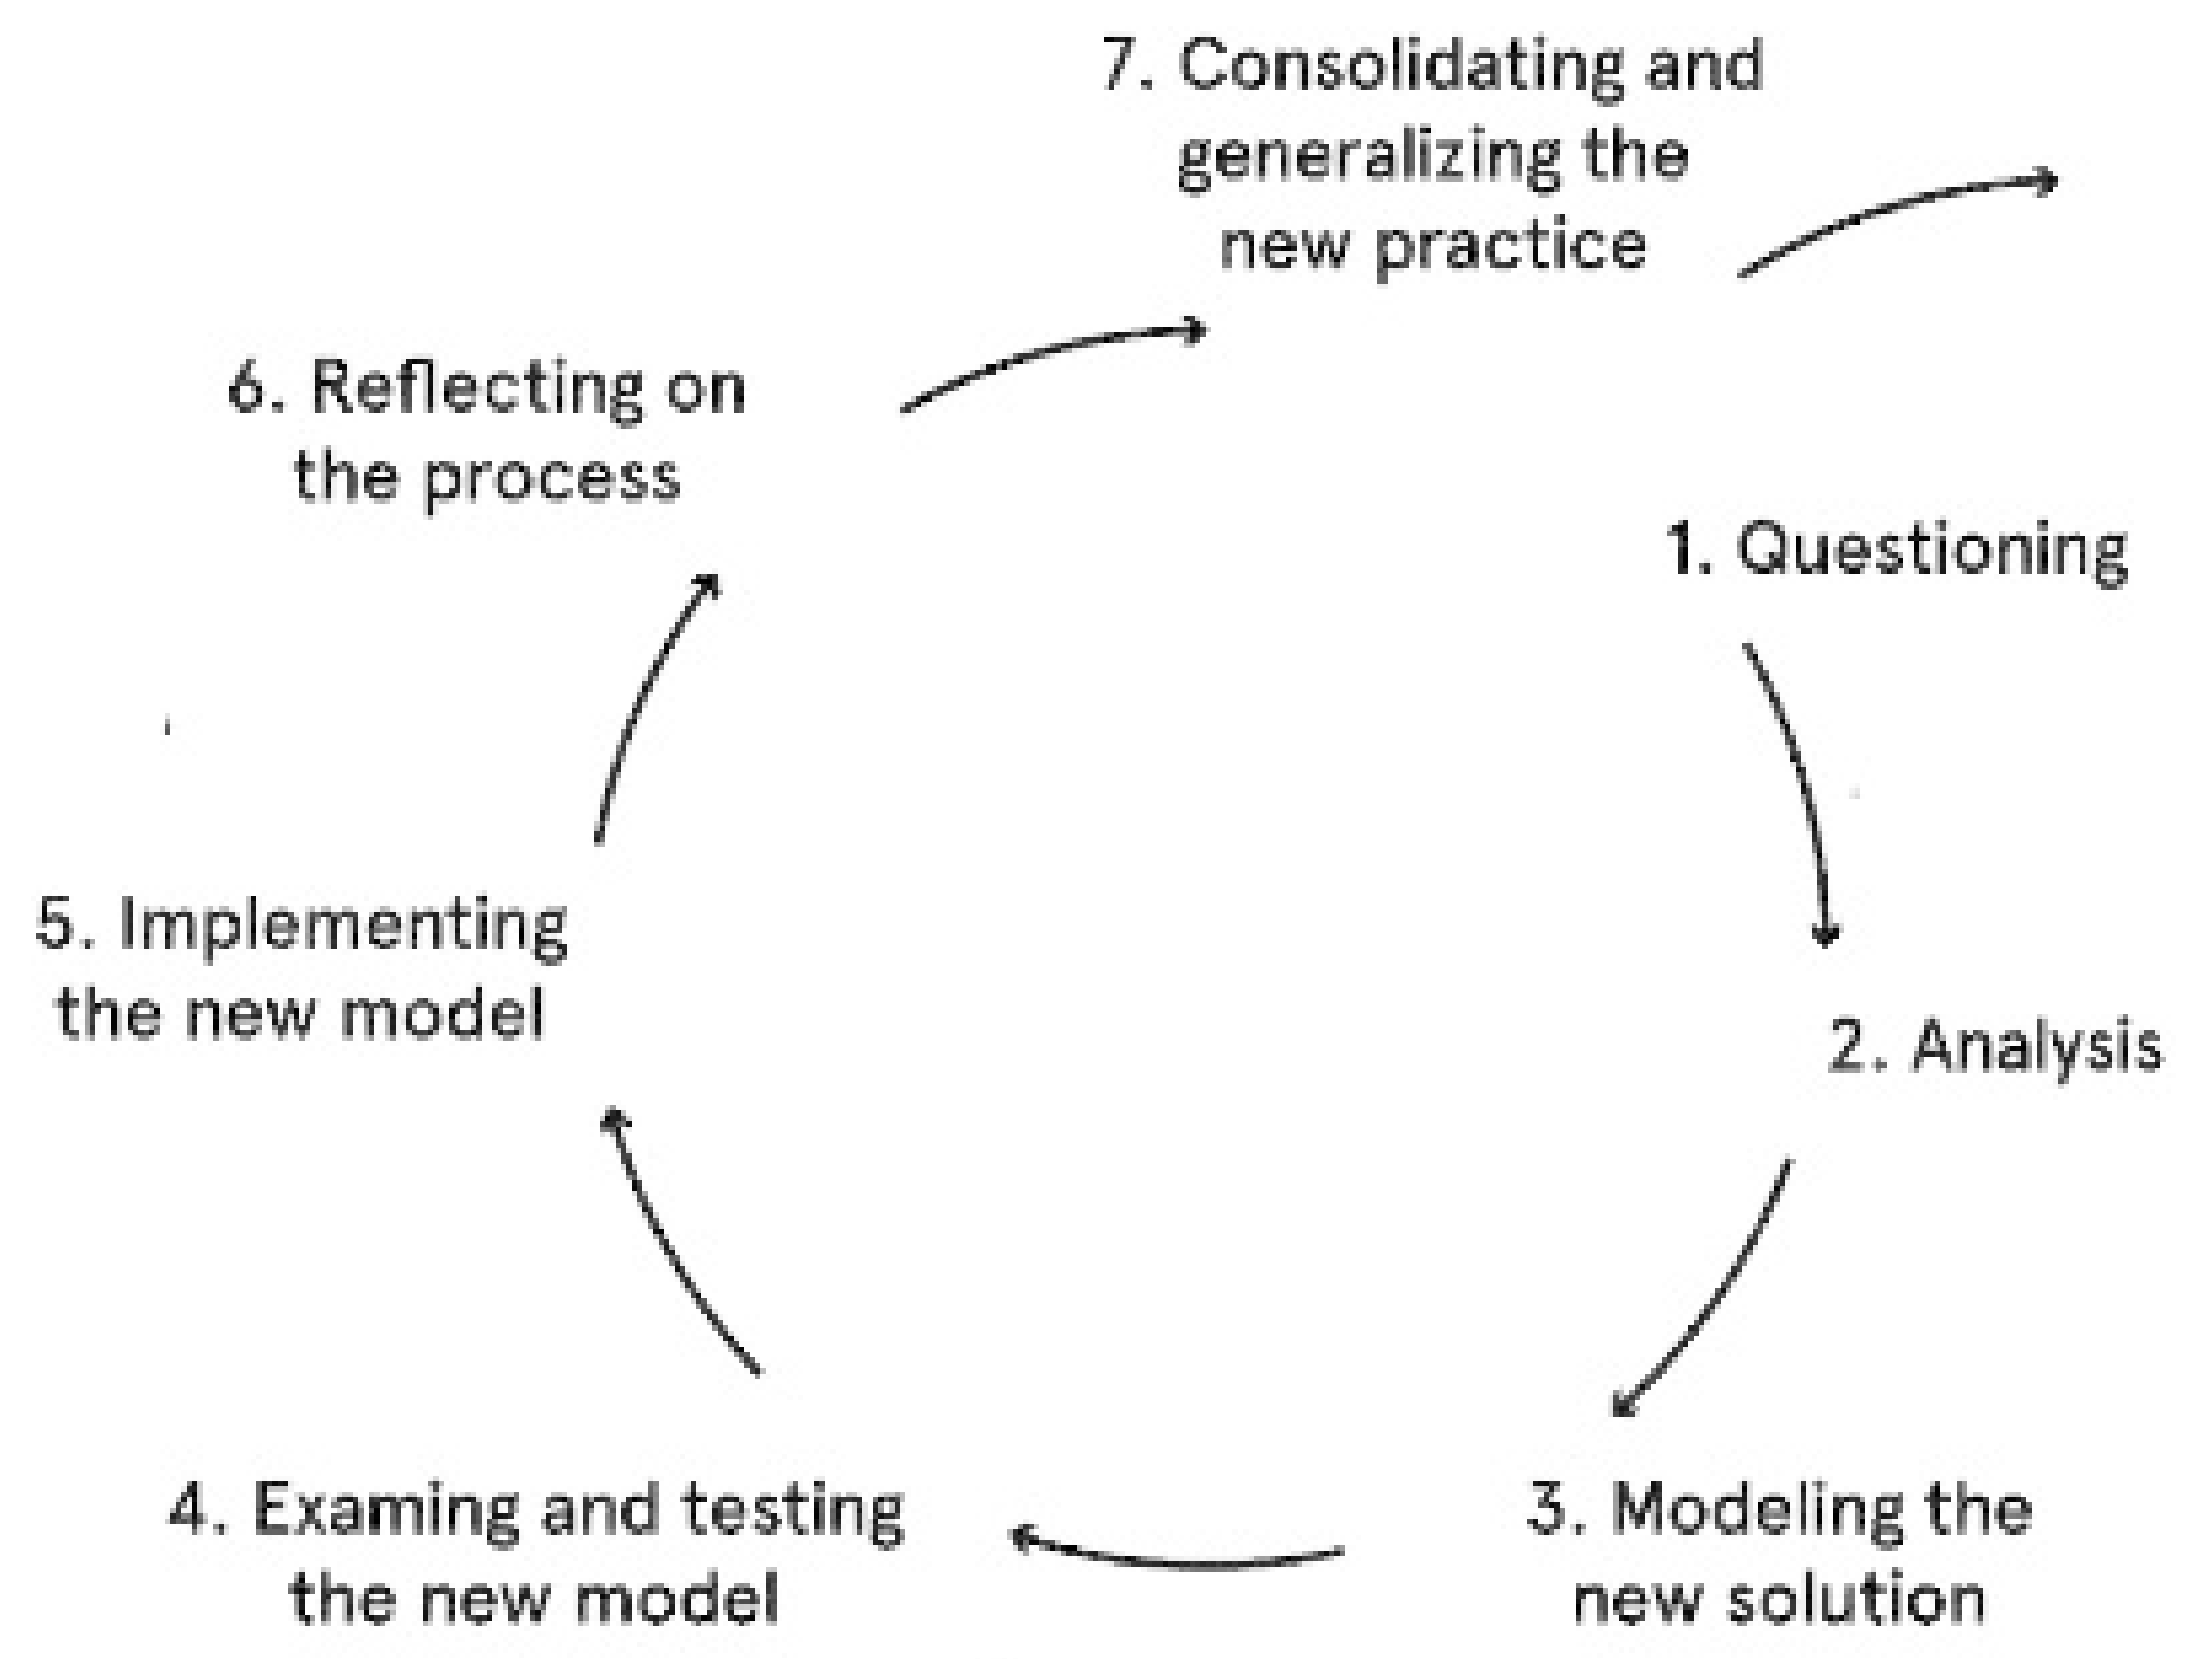
In the last phase (ke7) of Teacher A’s development process, we asked him to reflect on his project by asking five questions:
1. Does scientific literature play a major role in your daily teaching?
Teacher A: “When I did research on the effects of flipping the classroom on the performance and motivation of high school students, scientific research helped me shape my daily practice. The research design was met with great enthusiasm by the students and the initial results gave us the confidence to continue teaching this way. Therefore, even though not every decision I make is driven directly by scientific literature, it has played a major role in the way I teach math.”
2. Why do you think it is important to align your teaching to scientific literature?
Teacher A: “It is the only way to make sure you are reaching the goals you have set for yourself. Creativity and intuition alone may come a long way in creating great lessons, but without proper research there is no way of knowing whether it’s the best practice. Additionally, besides its possibility of making a difference between good teaching and great teaching, scientific literature is there to make it easier for teachers. To inspire you to change your daily teaching, to alter little details of your lessons, and simply copy everything that’s proven to work. When you choose to align your teaching to scientific literature, you create better lessons with, sometimes, less work.”
3. For whom is scientific literature important in school?
Teacher A: “Teachers should be the first to consider incorporating the outcomes of scientific literature in their teaching if we talk about research on specific teaching-related subjects for reasons described above. However, scientific research in general is not a constraint to teaching of course, which means everyone in the organization would be wise to take advantage of the often easily accessible scientific literature.”
4. How well has your training prepared you to deal with evidence in your teaching profession?
Teacher A: “Findings from literature have almost always been provided to help students form opinions on certain subjects or help them complete their assignments. However, searching for the right literature yourself was given little attention, as was designing research yourself. Help was always there if you needed it, but it is not until the final phase of the study that you learn how to properly design a research in a more scientific way. This did help me to understand how to apply research techniques in my daily teaching setting. This way, I can also systematically evaluate interventions when trying out new things. I feel prepared enough to do research in a meaningful way, although I realize that I would need a little more experience and guidance to reach a more academic level.”
5. What do you want to add?
Teacher A: “Research was not the direction I wanted to take after my studies. Additionally, being involved in research full time is still not what I want. However, I have seen that research such as I have now done can easily be combined with my work at school. In fact, it ensures that I look more critically at what I do and whether things could be improved. This openness to try new things is especially nice if you look for collaboration with colleagues. I noticed that I have started to look at lessons differently because we try things out and investigate in a systematic way. This ensures that we rise above the level where we mainly look from our feelings at which things work and which do not. This is not to say that from now on I will test everything scientifically and will never try something out spontaneously again, but a major intervention such as the introduction of FtCA as a teaching method is not only more useful and interesting, but also a lot more fun if you conduct substantiated research. If you know what to pay attention to and why you do everything. In that sense, I think I have gotten and will be better at setting up research and doing larger interventions. Finally, I have found that it is very useful to look at changes from a different perspective. Sometimes a student or colleague immediately provides useful tips, or I can easily see how people really think about my lessons or changes in them. Asking the right questions is very important to find out what the other person’s opinion is.”
In this reflection we see that the teacher is very positive about “evidence-informed” education. He thinks using evidence is important and inspires him to change his everyday teaching. The project helped him to fill the gap of not knowing how to use research in his profession and stimulated him to continue using evidence during preparation for classes.


