Universal Design for Learning: The More, the Better?
Abstract
1. Introduction
2. Theoretical Background
2.1. Epistemic Beliefs in Science
2.2. Universal Design of Learning
2.3. Universal Design of Assessment
3. Research Question
- Does the adaption of UDA on a widely used instrument affect the results of the study?
- To what extent can epistemic beliefs be fostered in inclusive science classes using the concept of UDL?
- How does an extensive or a more focused use of UDL principles impact learning outcomes in the field of epistemic beliefs?
4. Materials and Methods
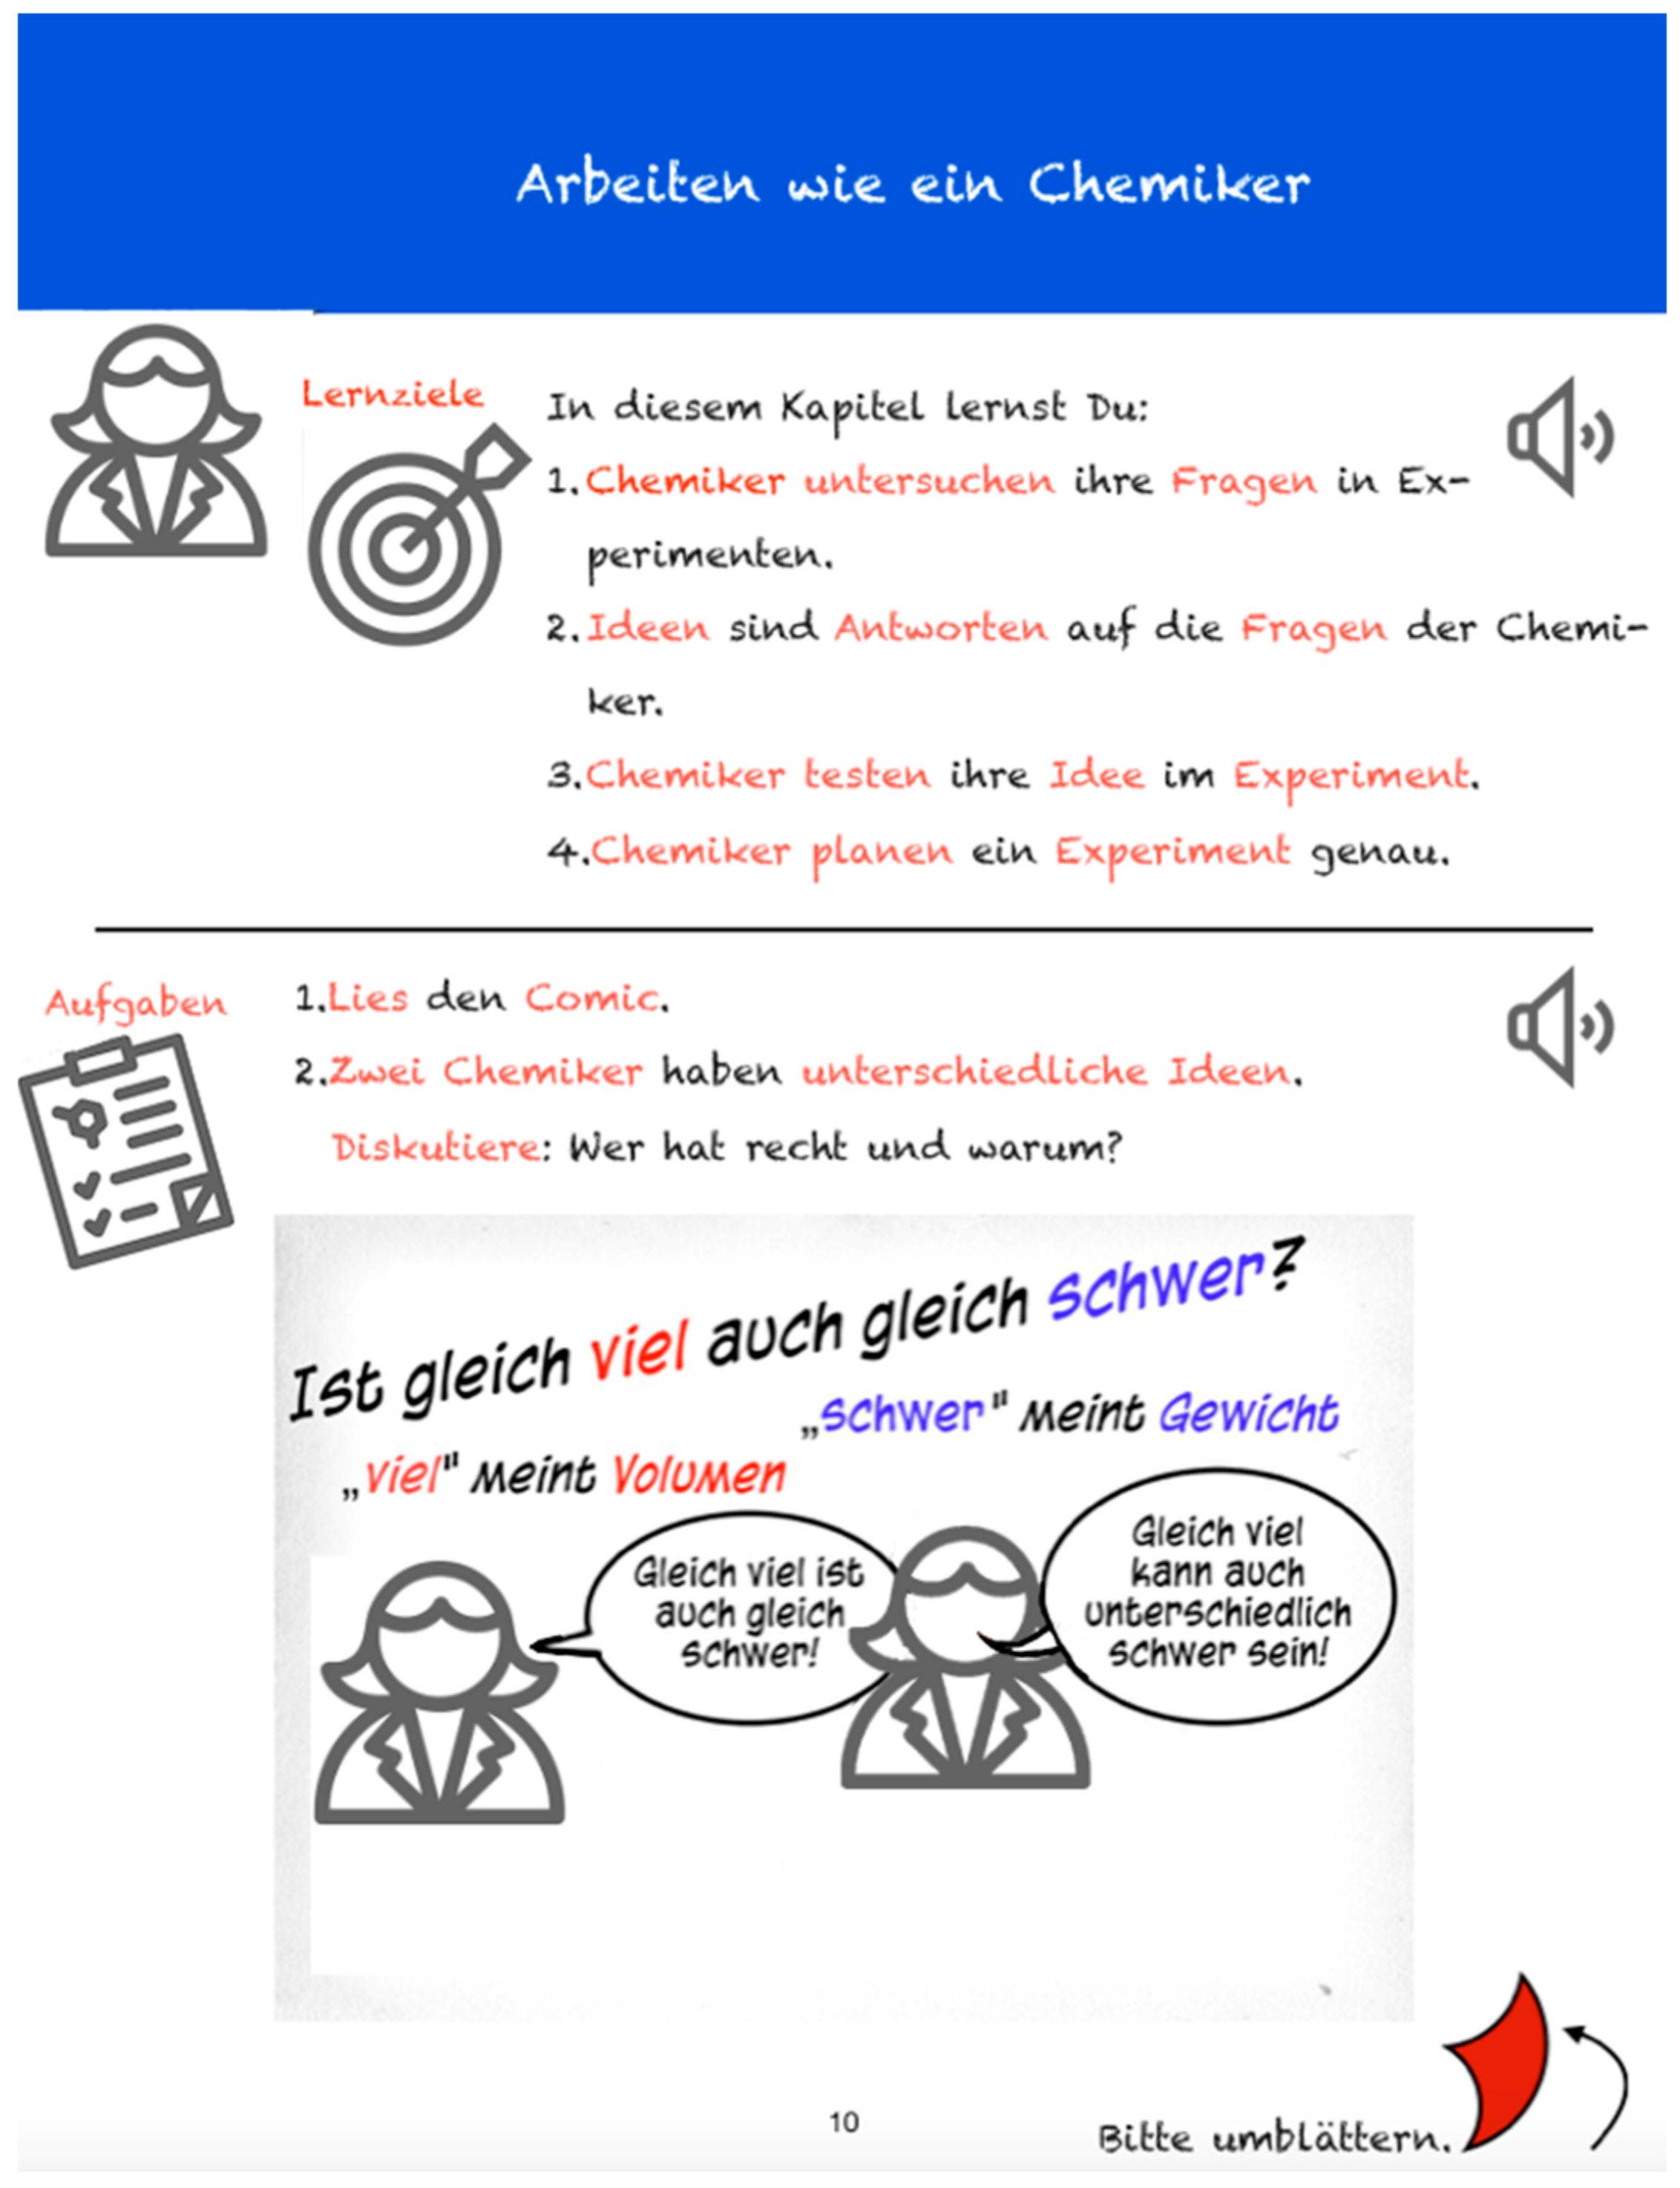
4.1. Description of the Learning Environments
4.2. Preliminary Study
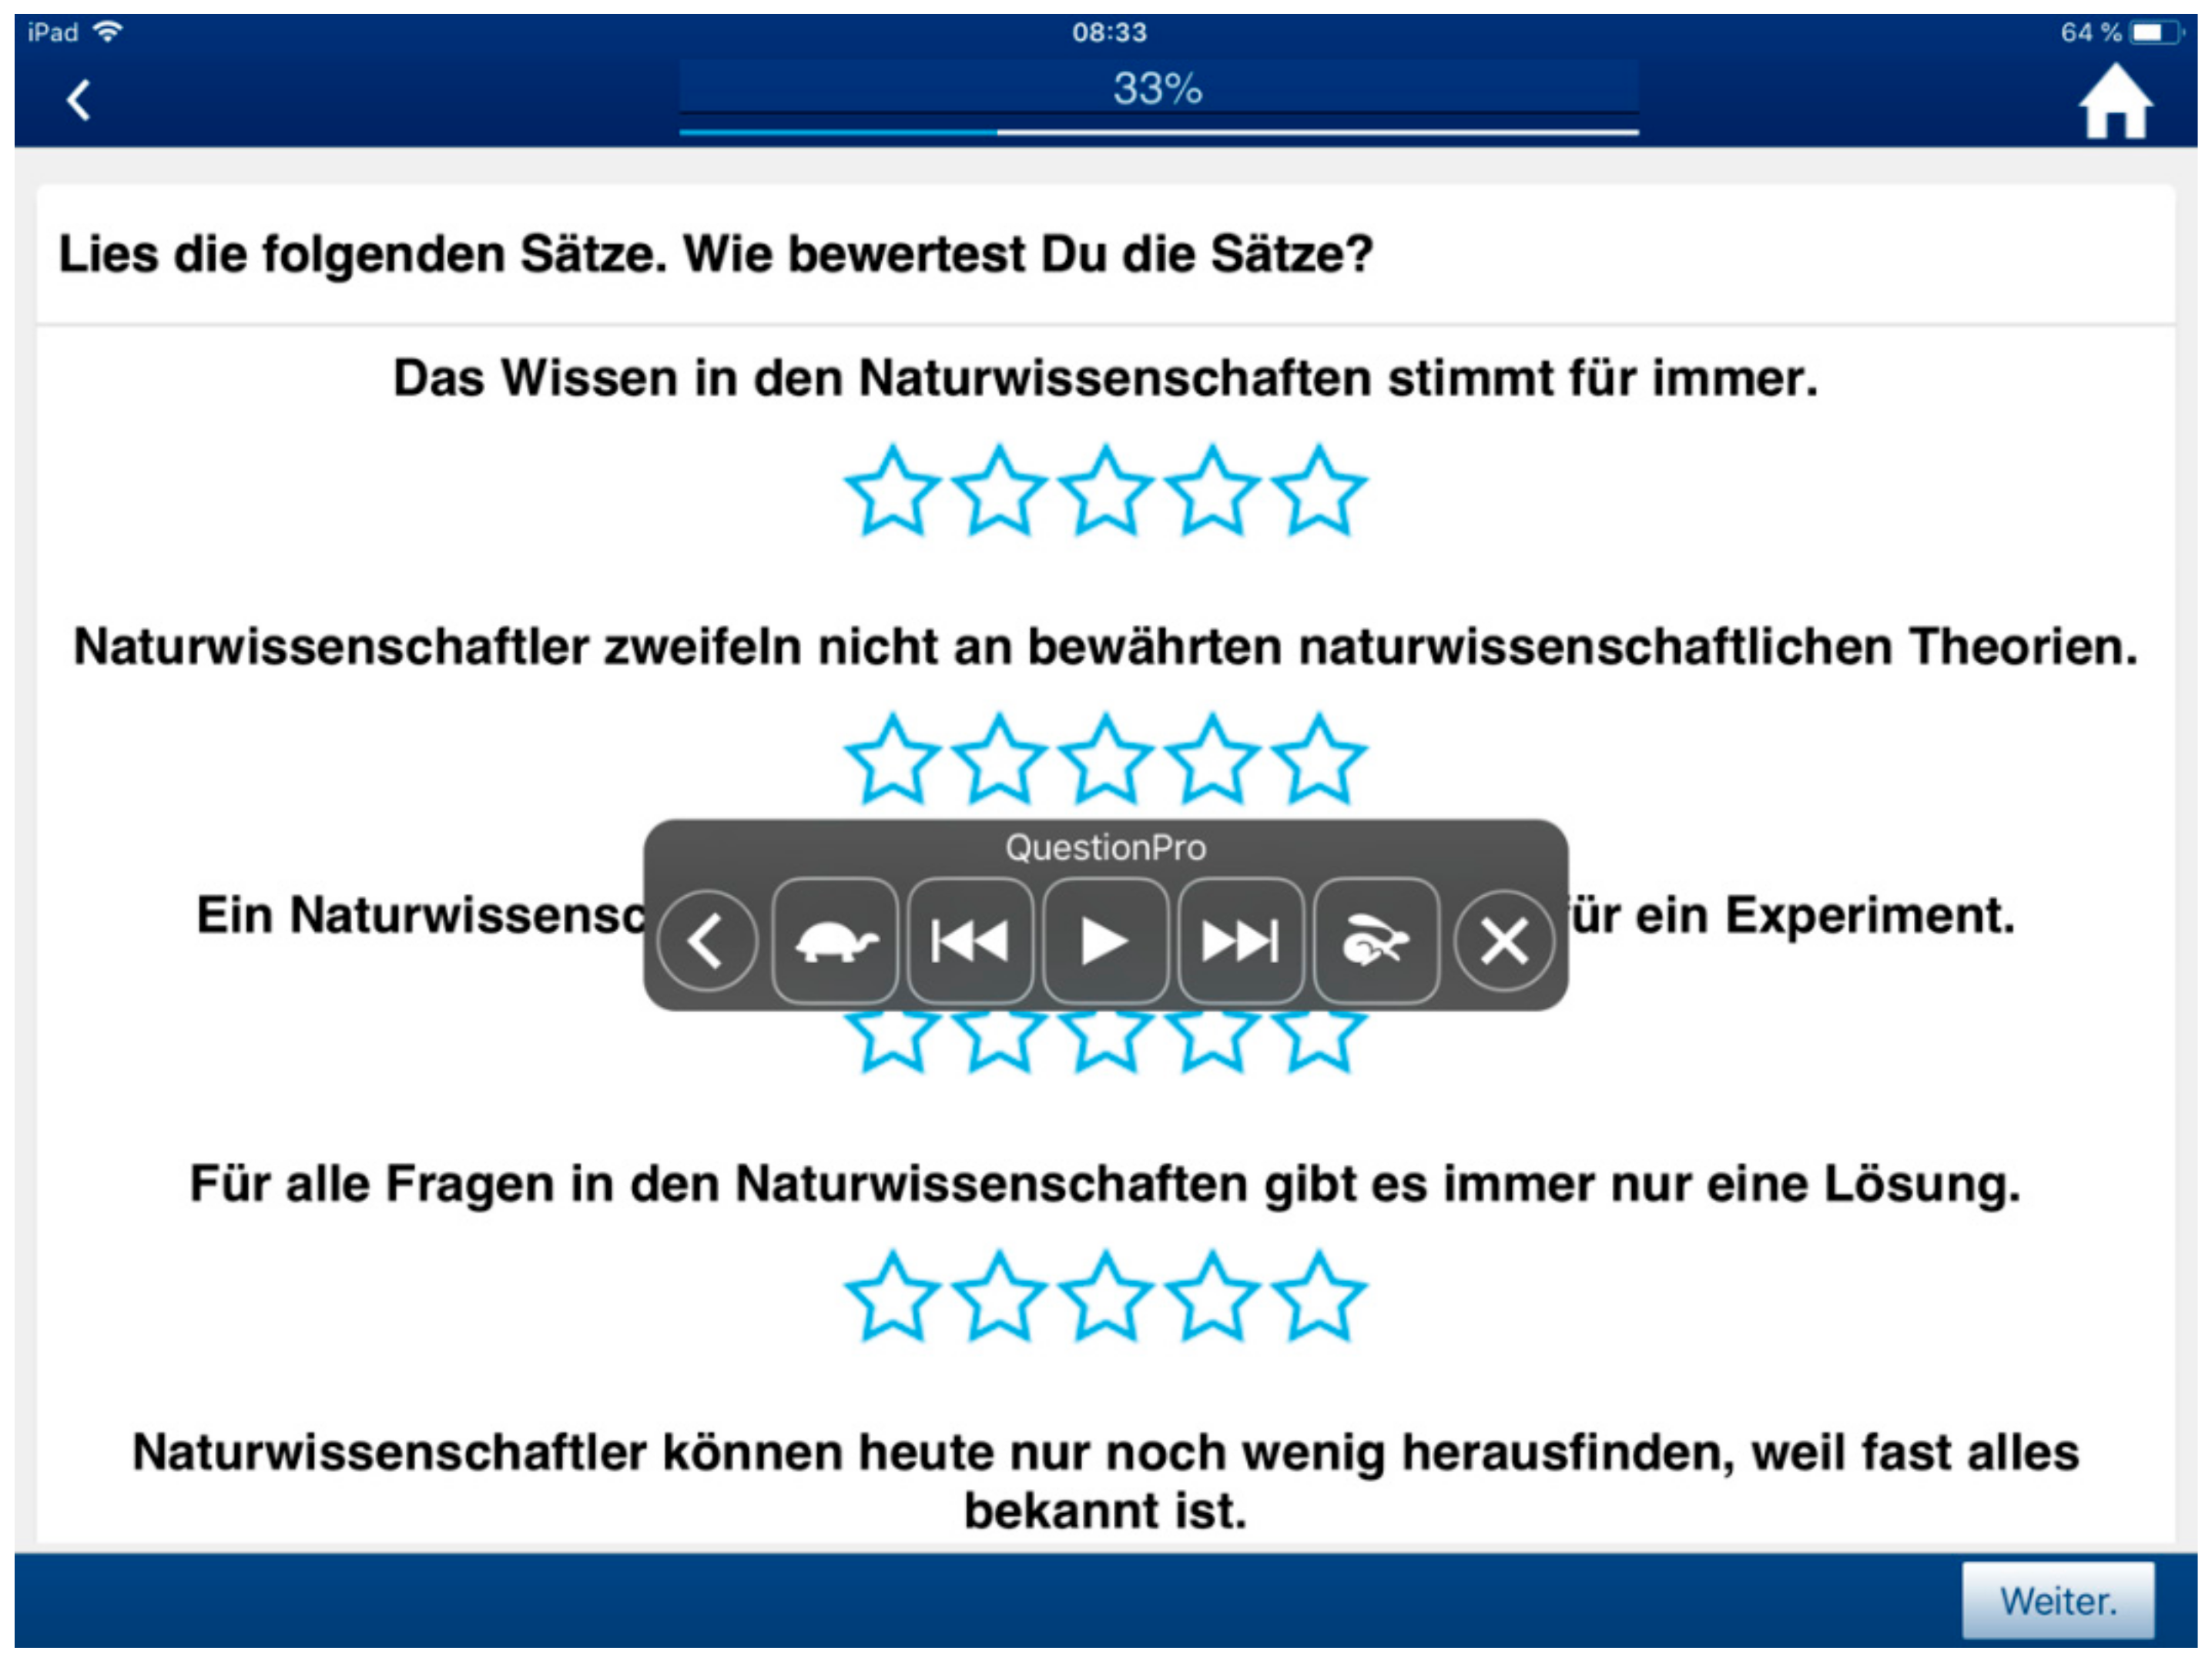
4.3. Design of the Main Study
4.4. Sample
4.5. Procedures of Data Analysis
5. Results
5.1. Step One: Item Selection
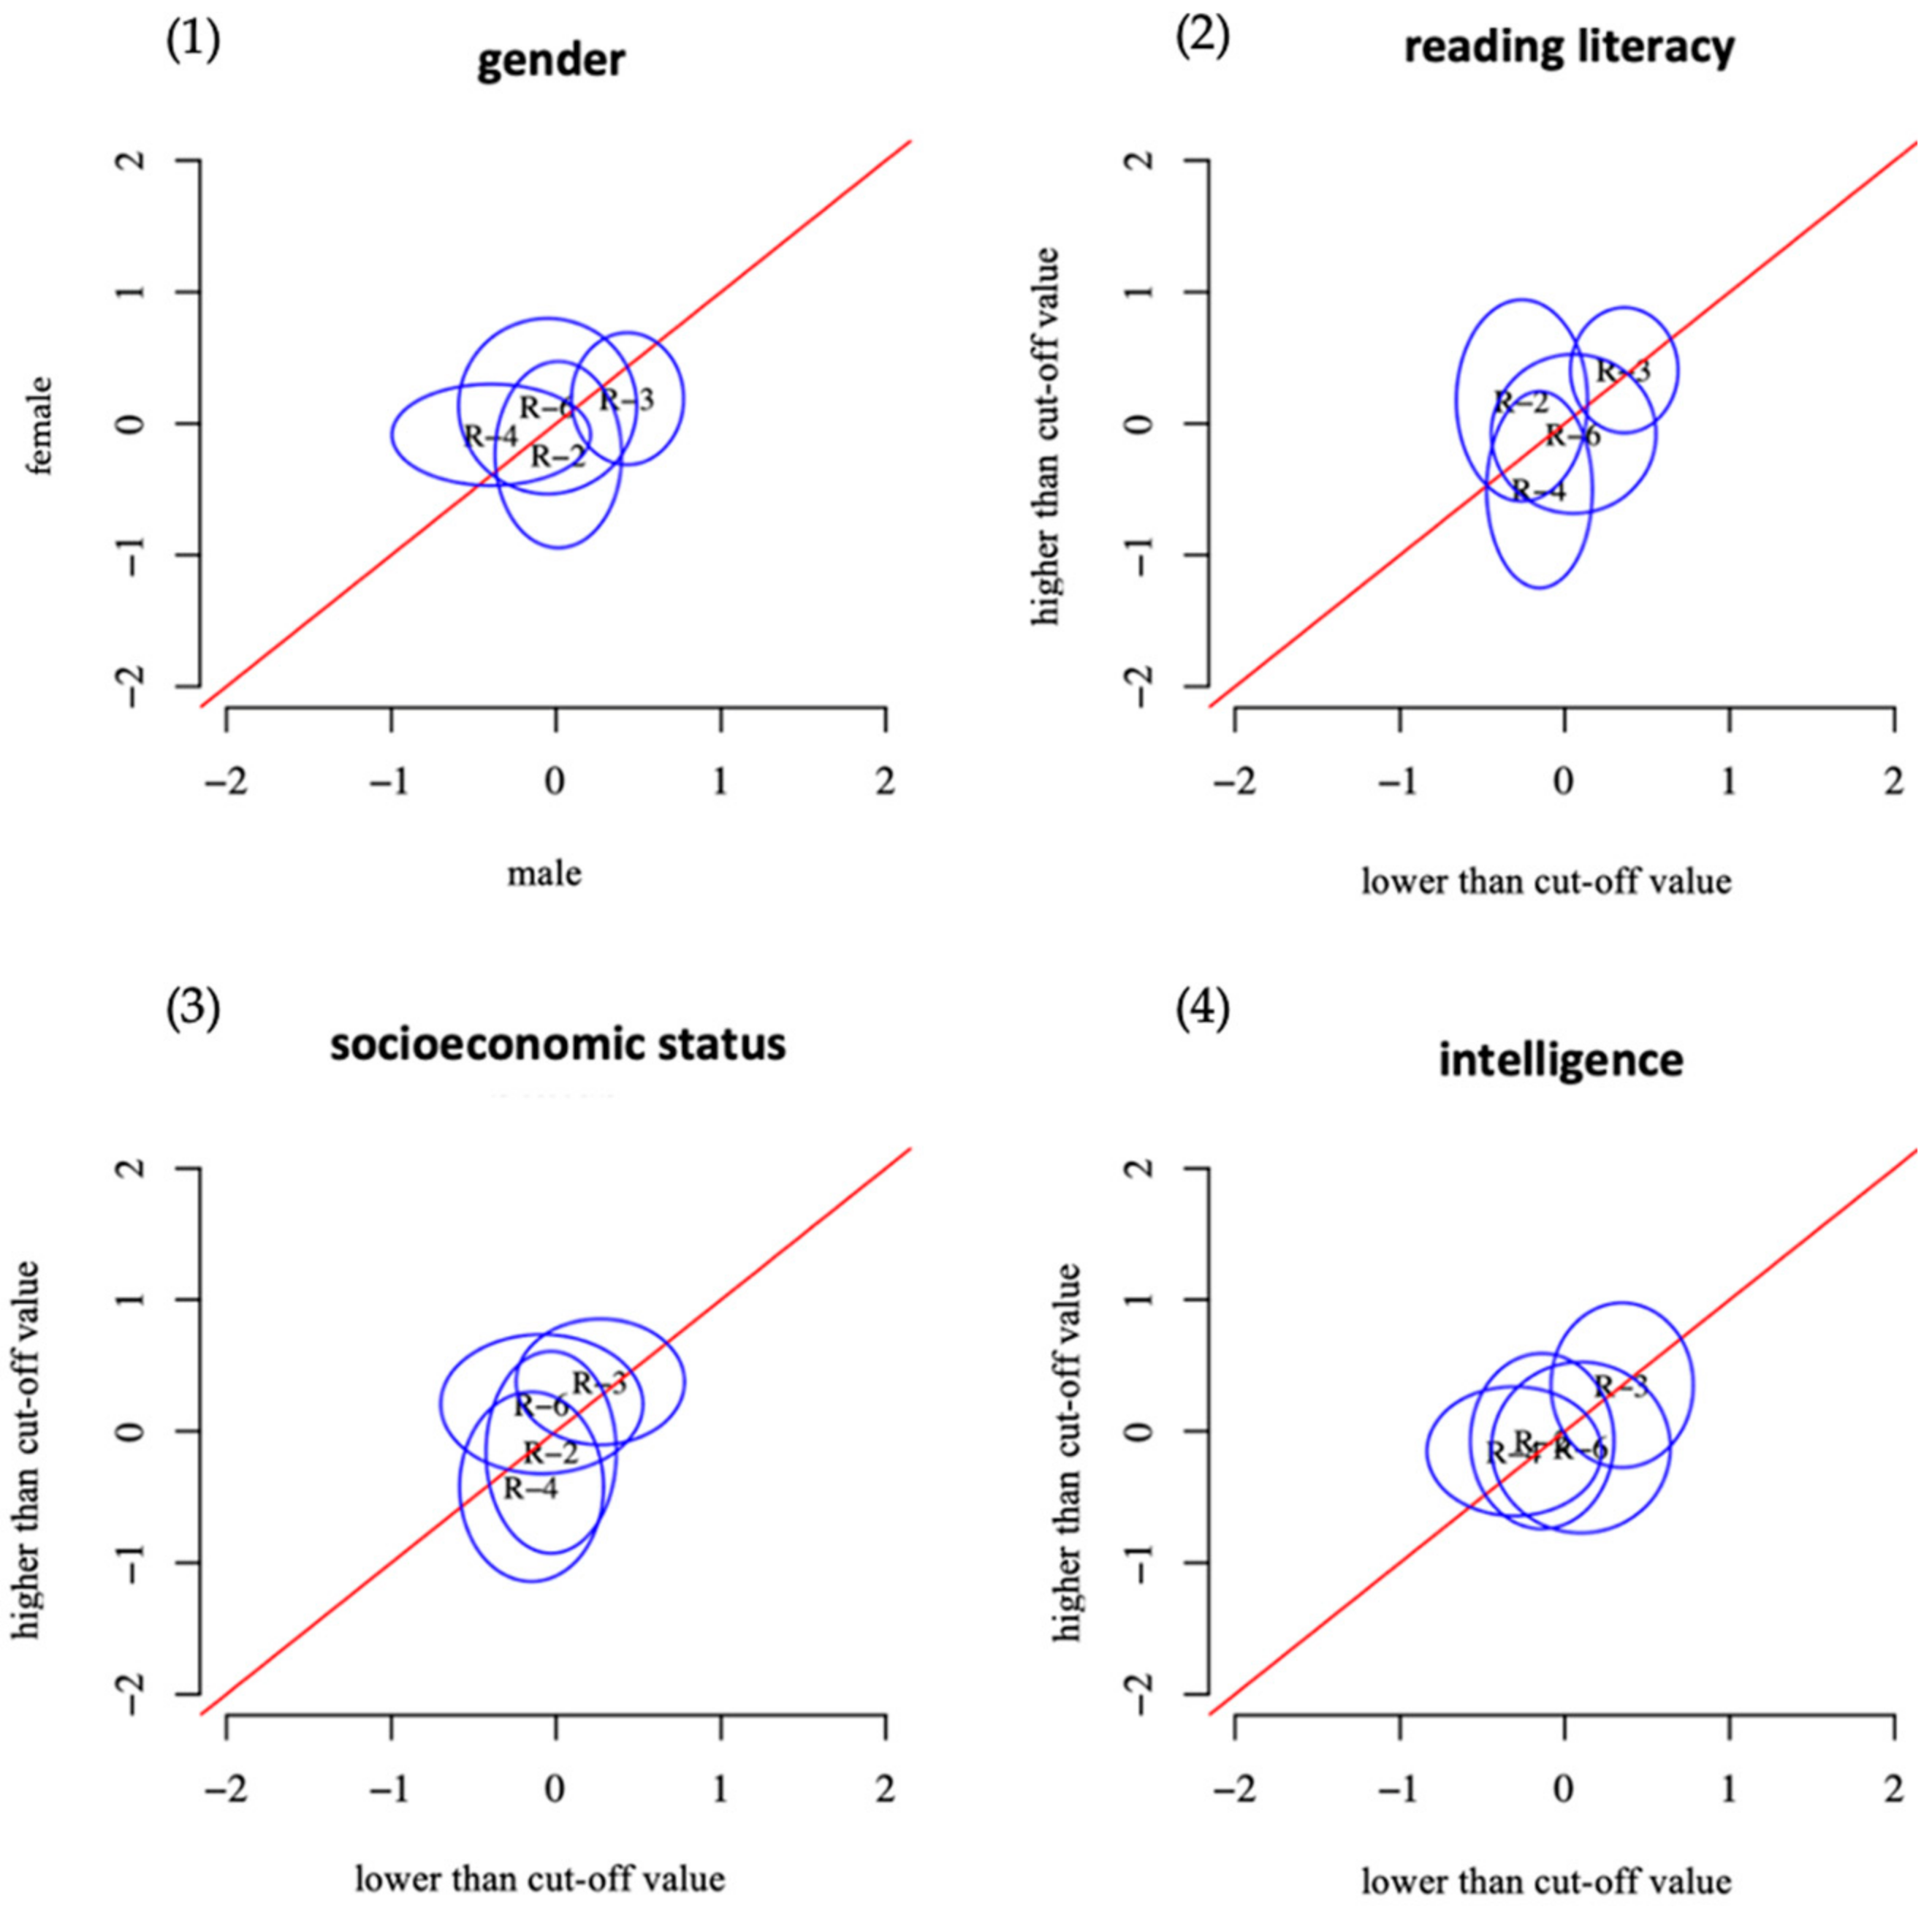
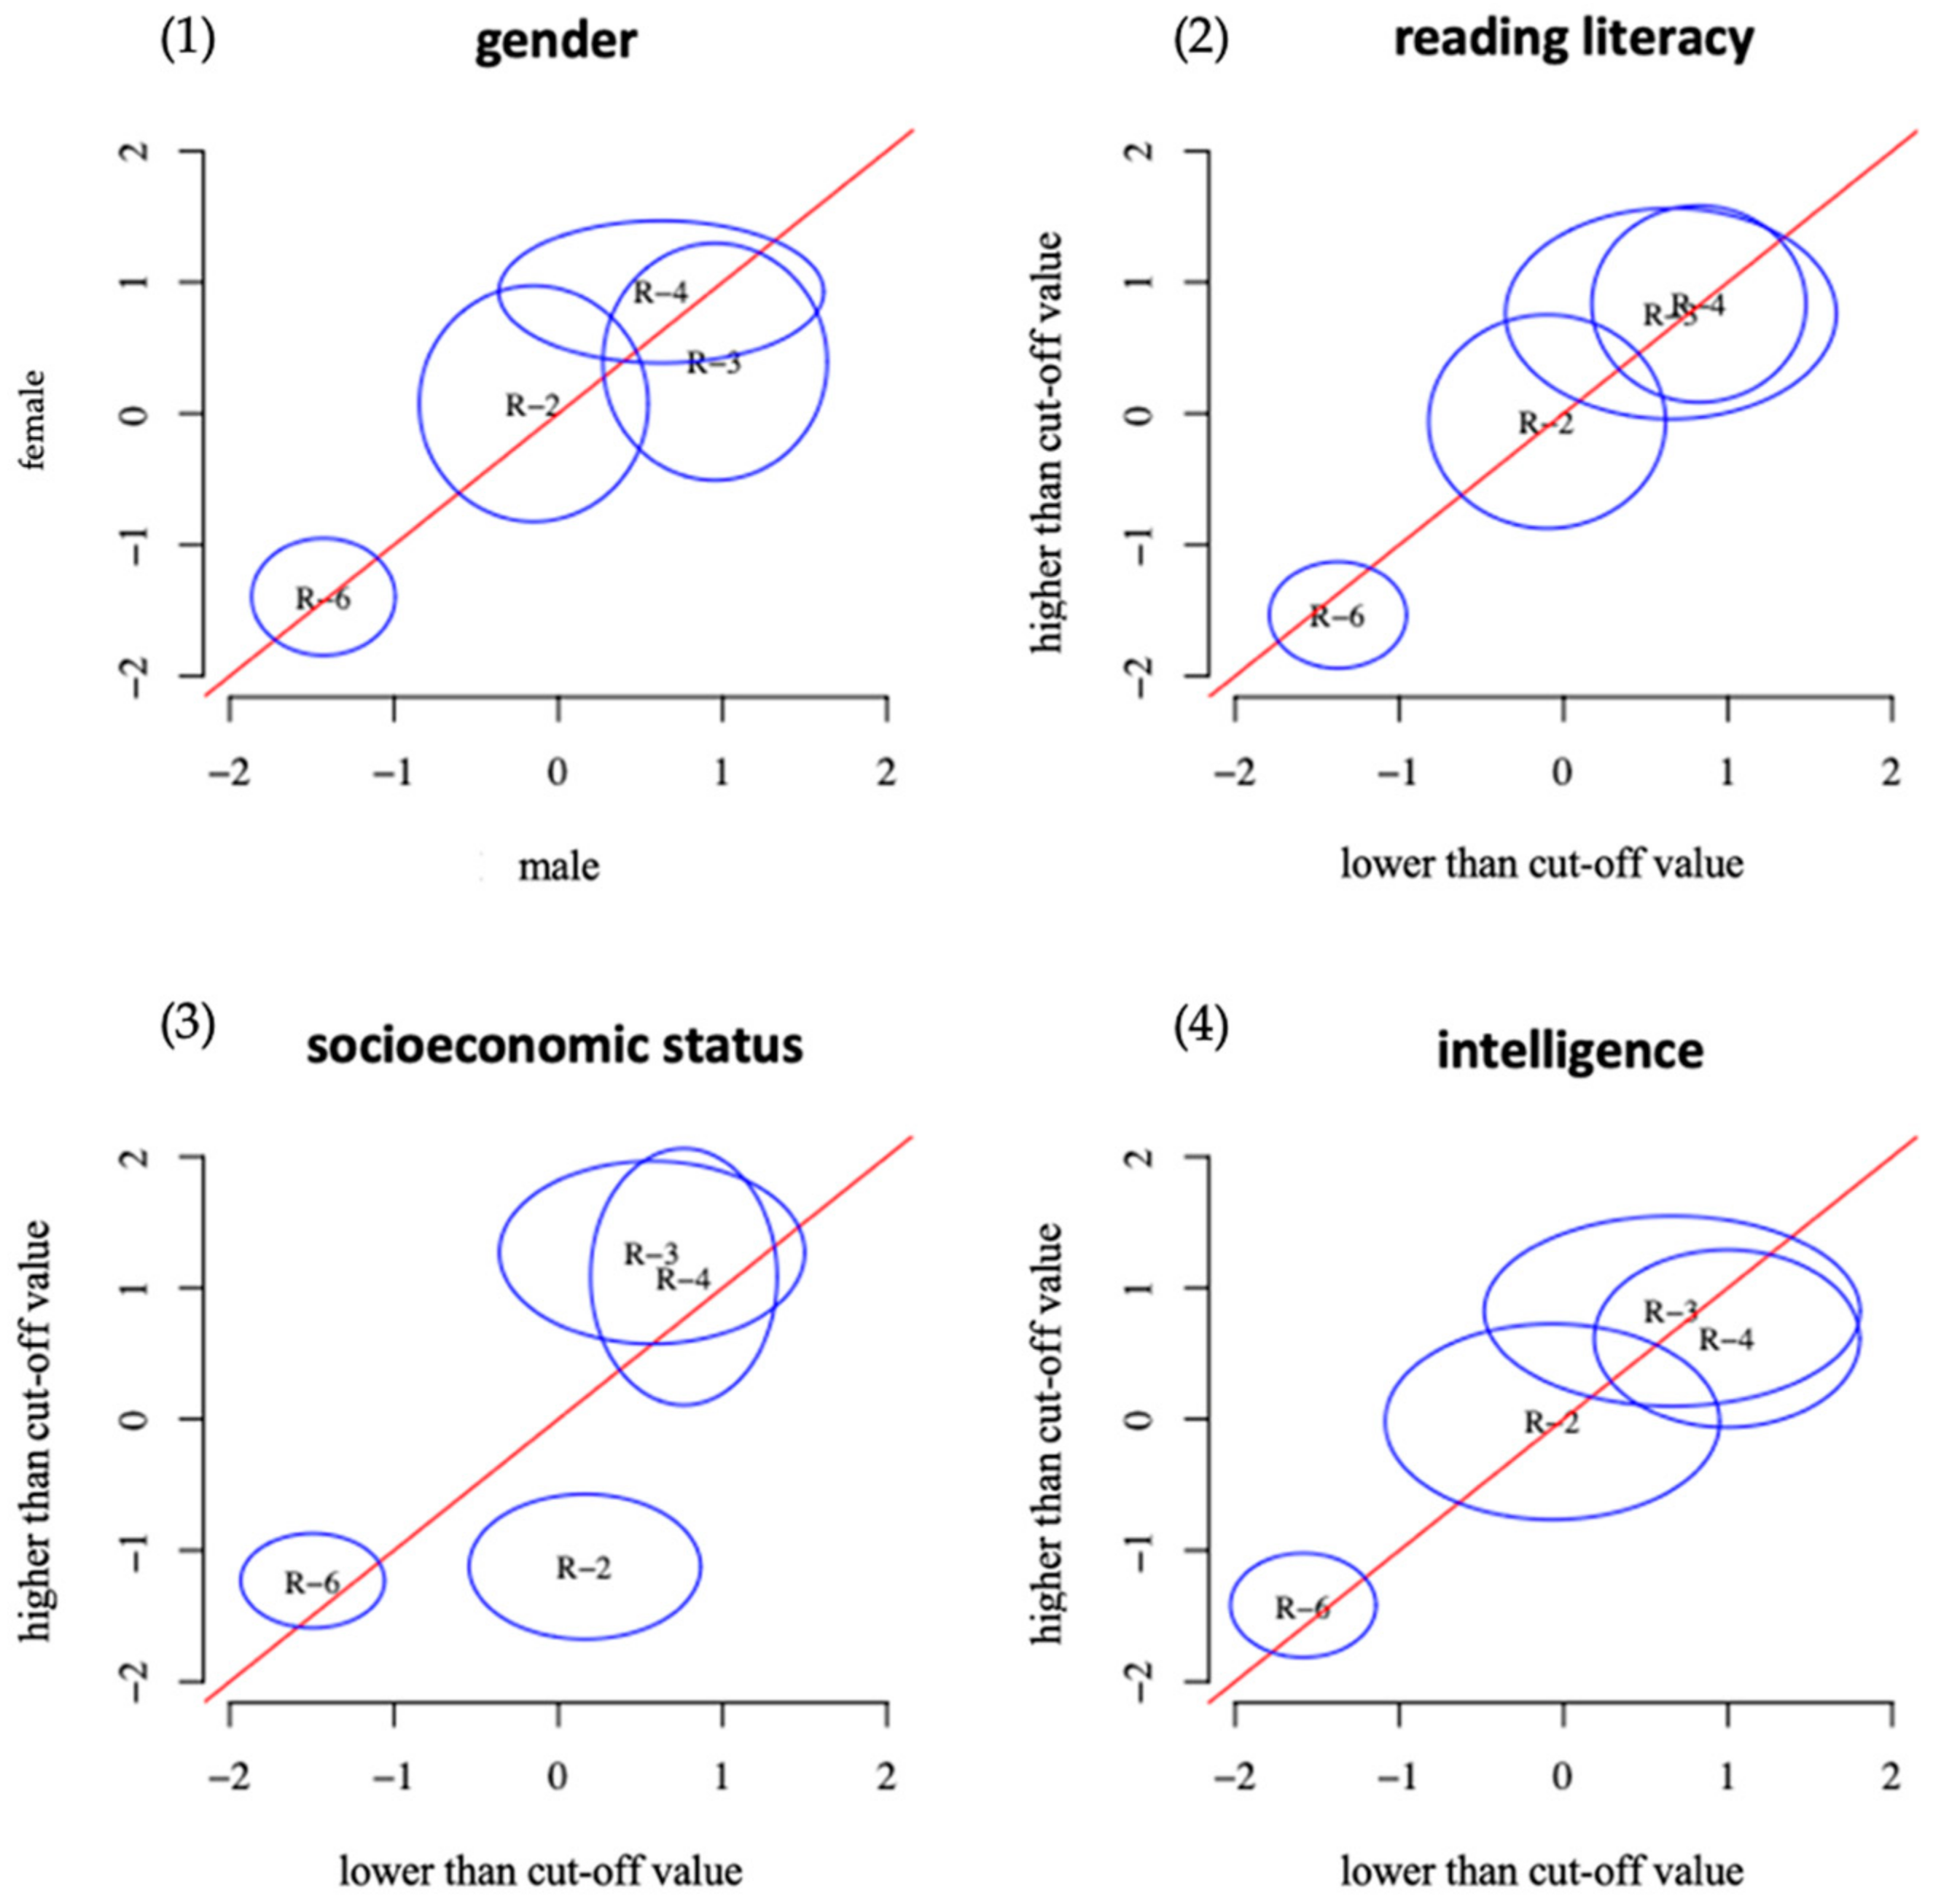
5.2. Step Two: Checking Test Accessibility of Both Versions
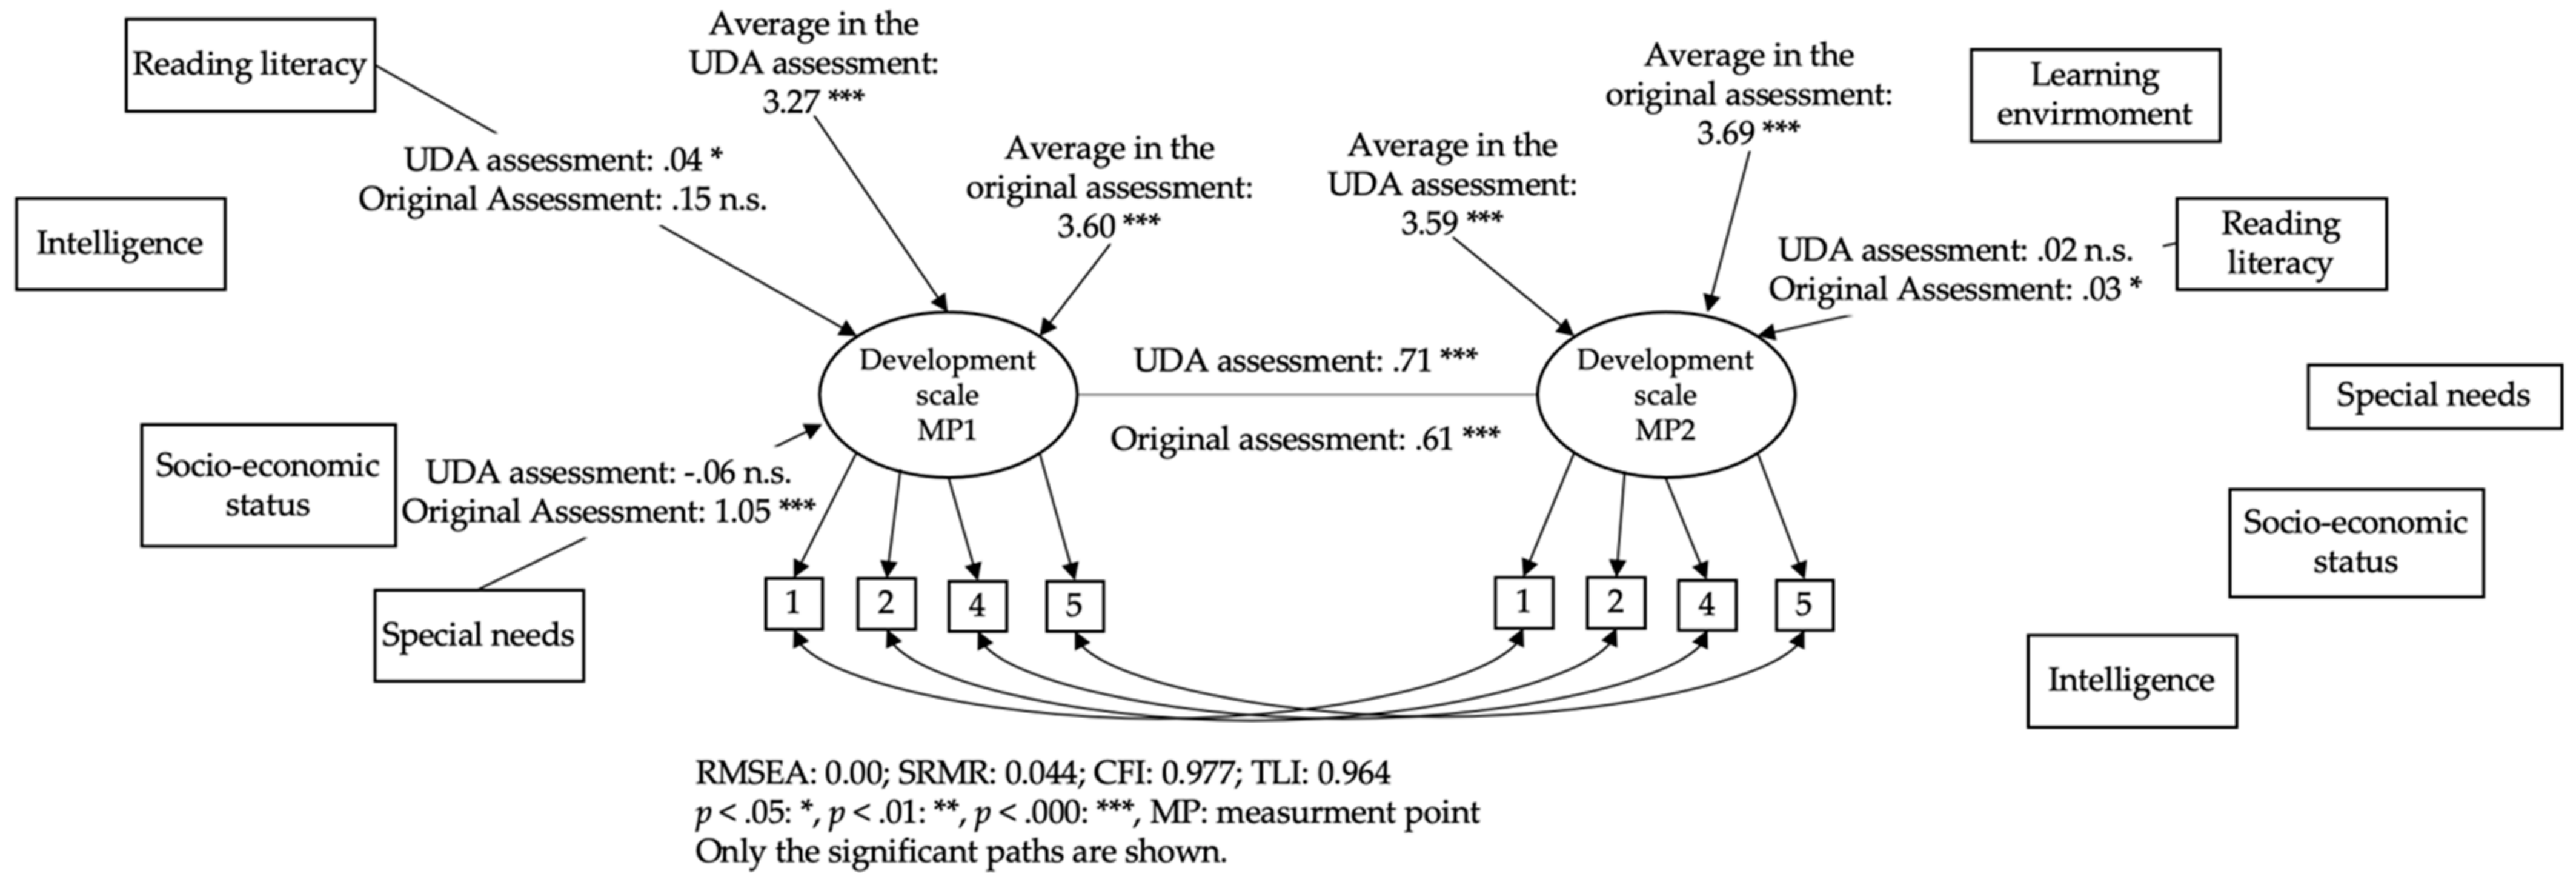
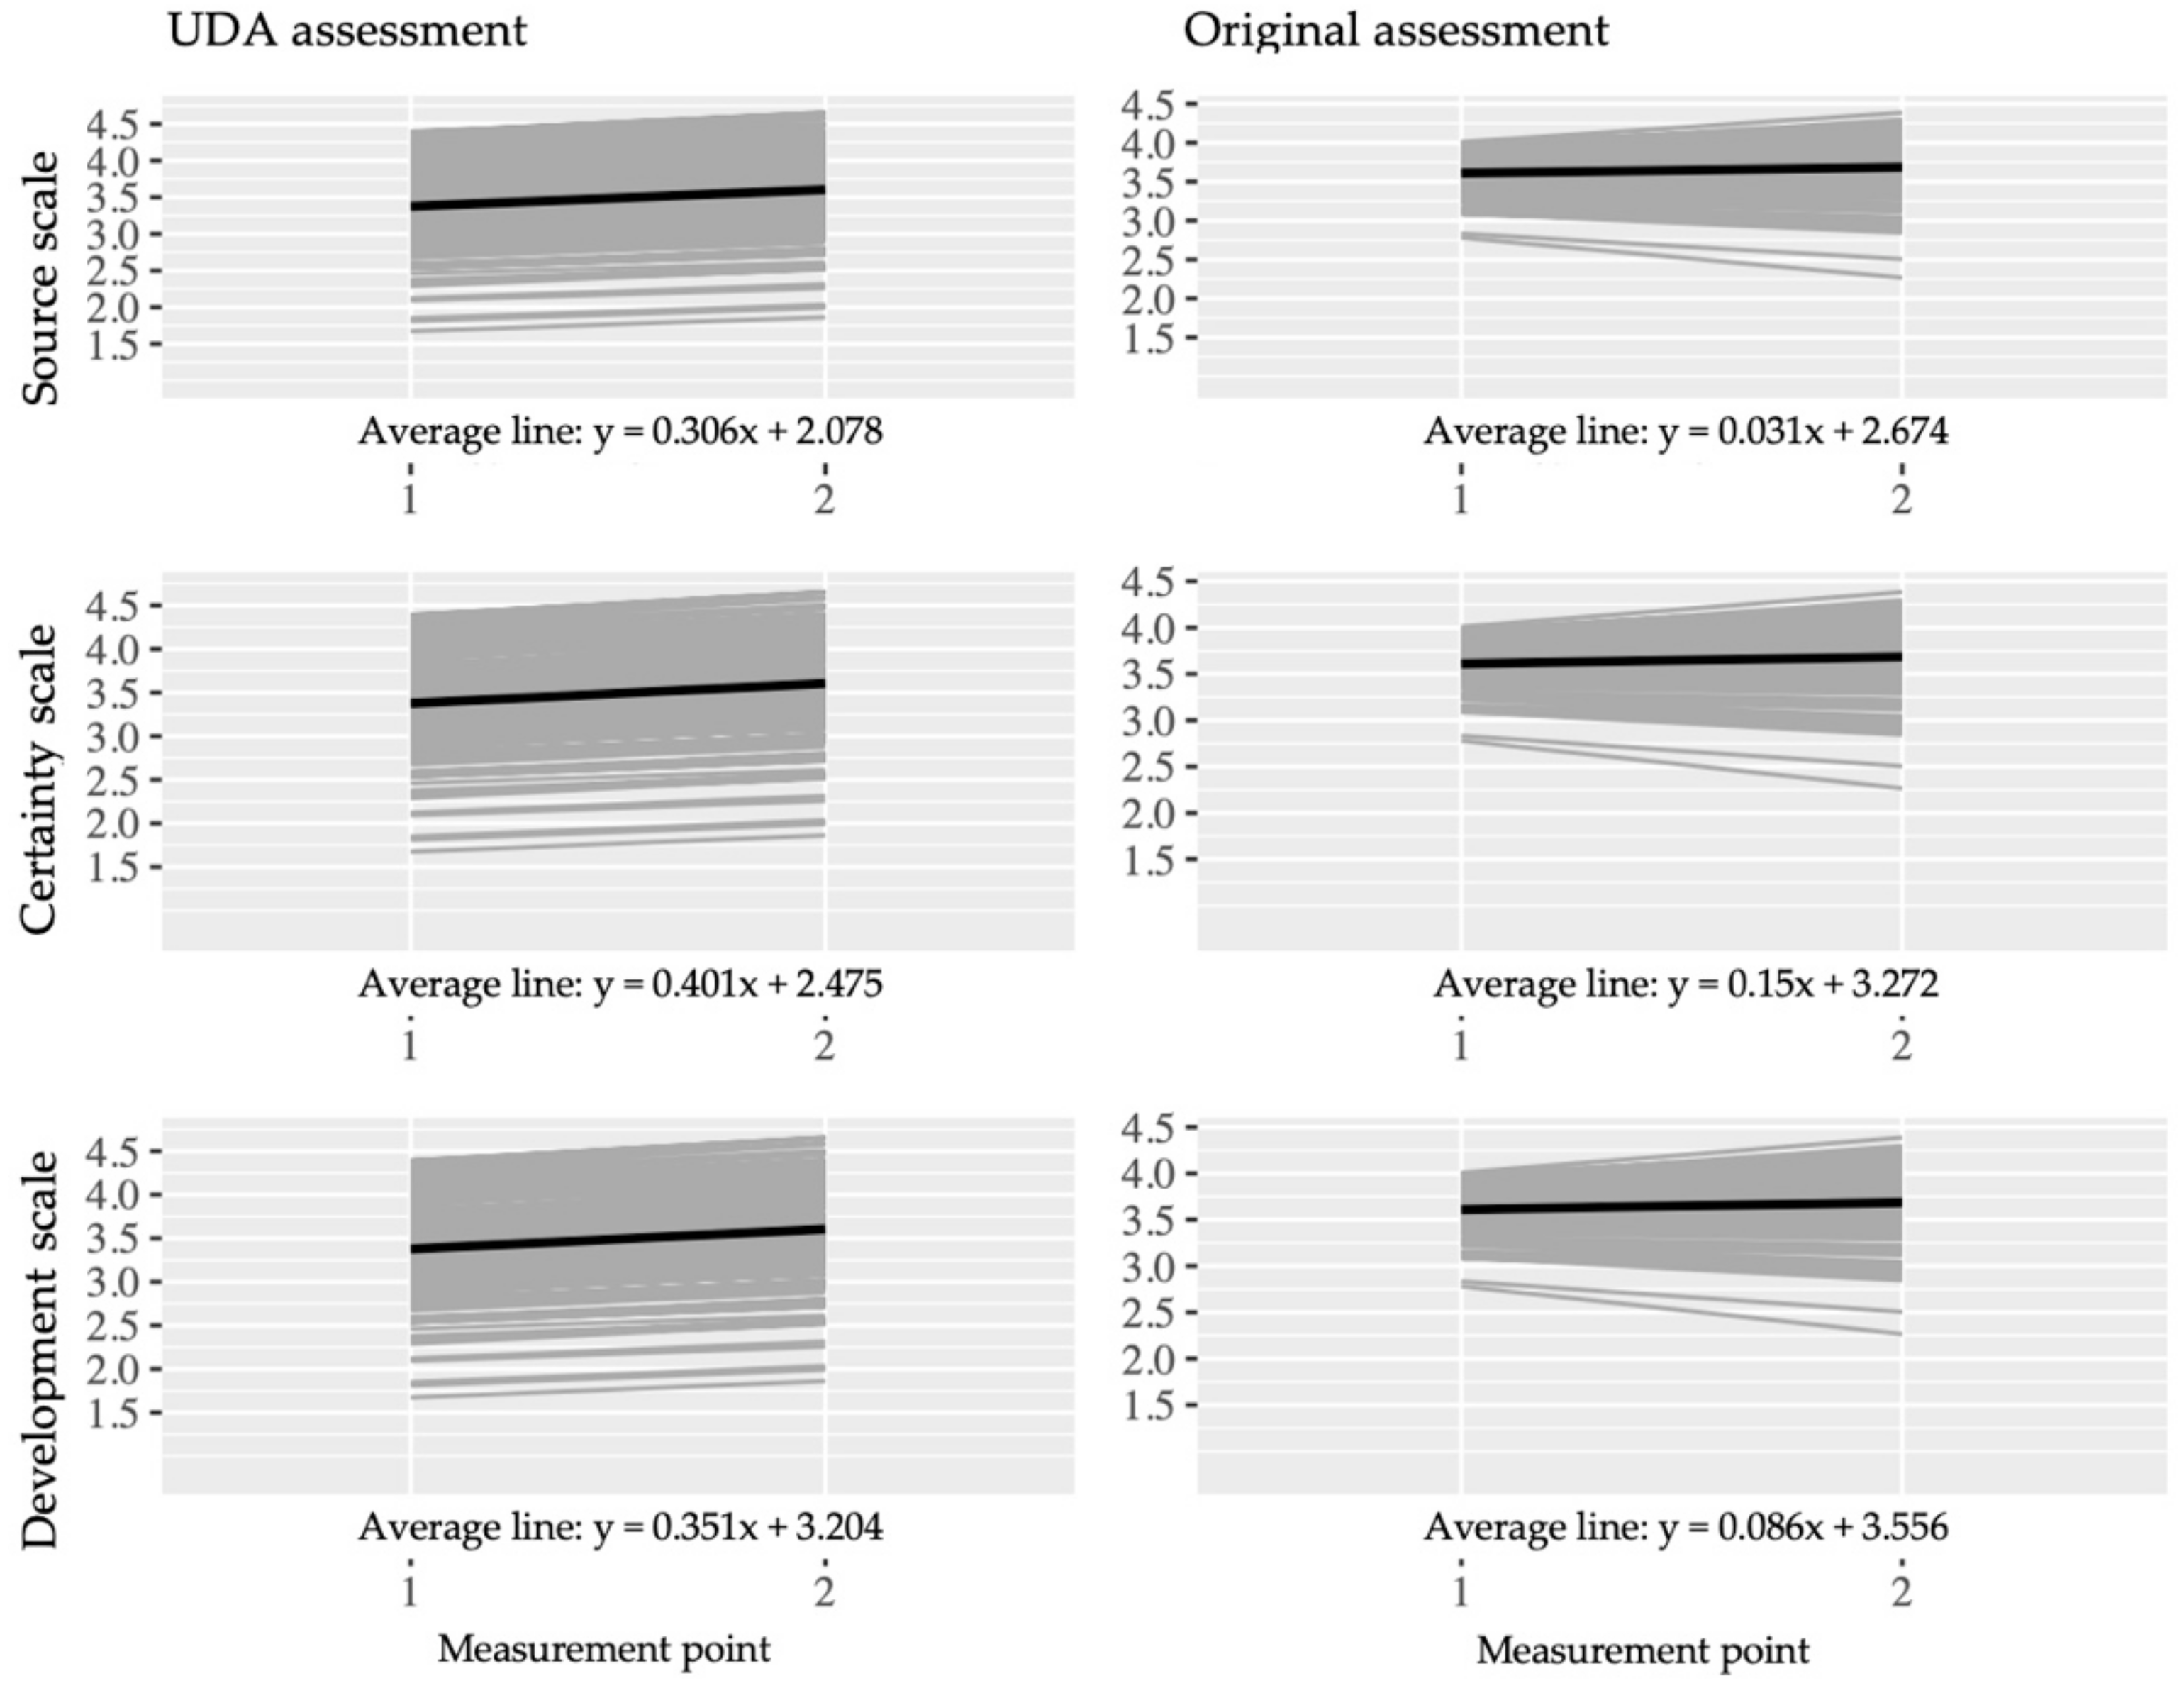
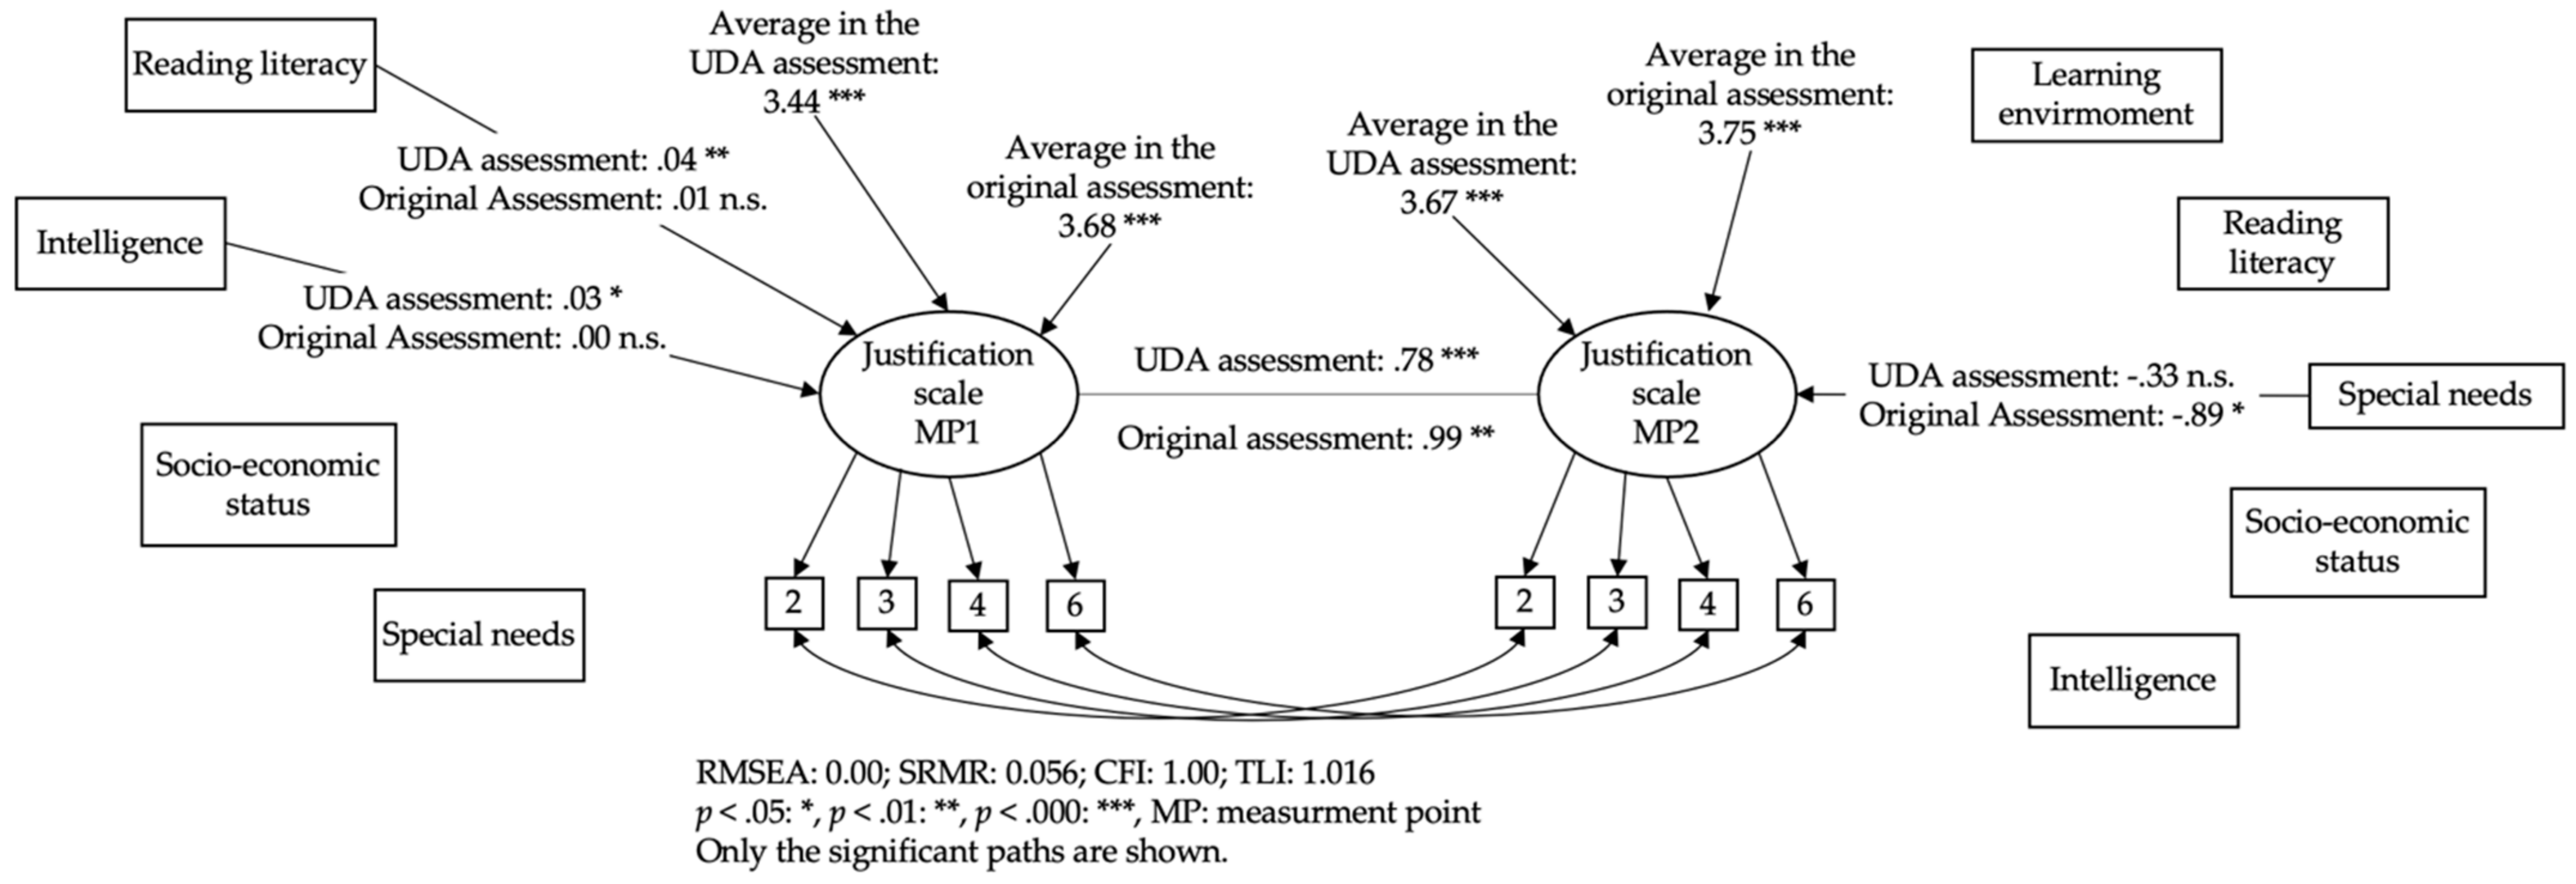
5.3. Step Three: Checking on Learning Gains and Differences between UDL and MR Environment
6. Discussion
Summarizing the Results and Answering the Research
Implication no. 1: In inclusive settings where quantitative research is conducted, test accommodation plays a significant role. Quantitative instruments should be used with care.
Implication no. 2: The UDL principles should be applied with care. “The more, the better” does not seem to be applicable.
Implication no. 3: The UDL principles should be introduced with care. The more, the better might not be applicable in the long run. UDL also means changing a learning culture.
Implication no. 4: An unanswered question is how students’ learning behavior in a UDL learning environment leads to an increased outcome for all students. Learning analytics could fill this gap in research.
Author Contributions
Funding
Data Availability Statement
Acknowledgments
Conflicts of Interest
Appendix A.
Appendix A.1. Process of Item Selection at the Justification Scale
| EBs-Scale | Measurement Point 1 | Measurement Point 2 | Both Measurement Point |
|---|---|---|---|
| UDA Assessment | |||
| Source | 0.59 | 0.83 | 0.76 |
| Certainty | 0.81 | 0.87 | 0.87 |
| Development | 0.86 | 0.89 | 0.9 |
| Justification | 0.83 | 0.84 | 0.87 |
| Original Assessment | |||
| Source | 0.7 | 0.76 | 0.79 |
| Certainty | 0.78 | 0.85 | 0.87 |
| Development | 0.83 | 0.9 | 0.89 |
| Justification | 0.52 | 0.77 | 0.74 |
| Fit Values | ||||||||
|---|---|---|---|---|---|---|---|---|
| Stage | Chi-Square | dF | p | RMSEA | CFI | TLI | SRMR | Accepted? |
| Configural | 206.6 | 138 | <0.05 | 0.065 | 0.929 | 0.906 | 0.061 | Yes |
| Metric | 227.48 | 156 | <0.05 | 0.062 | 0.926 | 0.914 | 0.077 | Yes |
| Scalar | 274.02 | 174 | <0.05 | 0.07 | 0.896 | 0.892 | 0.083 | No |
| Partial scalar | 259.89 | 172 | <0.05 | 0.066 | 0.909 | 0.904 | 0.083 | Yes |
| Strict | 285.33 | 190 | <0.05 | 0.065 | 0.901 | 0.905 | 0.086 | Yes |
| Original Assessment | UDA Assessment | |||
|---|---|---|---|---|
| Items | Estimate | p-Value | Estimate | p-Value |
| Latent factor | −0.05 | 0.56 | −0.16 | 0.09 |
| Item 1 | 0.19 | 0.30 | −0.21 | 0.21 |
| Item 2 | 0.11 | 0.48 | 0.00 | 0.97 |
| Item 3 | 0.07 | 0.63 | 0.00 | 0.97 |
| Item 4 | 0.10 | 0.40 | 0.03 | 0.82 |
| Item 5 | −0.05 | 0.66 | 0.18 | 0.19 |
| Item 6 | −0.20 | 0.07 | 0.04 | 0.77 |
| Item 7 | −0.12 | 0.34 | −0.14 | 0.26 |
| Original Assessment | UDA Assessment | |||
|---|---|---|---|---|
| Items | MP 2-MP 1 | p | MP 2-MP 1 | p |
| Item 1 | 0.45 | <0.05 | −0.02 | 1.000 |
| Item 2 | 0.12 | 1.000 | −0.24 | 0.378 |
| Item 3 | 0.17 | 1.000 | 0.00 | 1.000 |
| Item 4 | 0.44 | <0.05 | 0.18 | 1.000 |
| Item 5 | 0.22 | 0.297 | 0.04 | 1.000 |
| Item 6 | −0.09 | 1.000 | 0.01 | 1.000 |
| Item 7 | 0.17 | 1.000 | 0.10 | 1.000 |
Appendix A.2. Results of the Source, Certainity and Development Scales
| Fit Values | ||||||||
|---|---|---|---|---|---|---|---|---|
| Stage | Chi-Square | dF | p | RMSEA | CFI | TLI | SRMR | Accepted? |
| Configural | 103.43 | 58 | <0.05 | 0.08 | 0.929 | 0.889 | 0.057 | Yes |
| Metric | 119.13 | 70 | <0.05 | 0.076 | 0.923 | 0.901 | 0.07 | Yes |
| Scalar | 180.01 | 82 | <0.05 | 0.099 | 0.846 | 0.831 | 0.089 | No |
| Partial scalar | 131.39 | 79 | <0.05 | 0.074 | 0.918 | 0.906 | 0.072 | Yes |
| Strict | 169.78 | 88 | <0.05 | 0.087 | 0.872 | 0.869 | 0.086 | No |
| Original Assessment | UDA Assessment | |||
|---|---|---|---|---|
| Items | Estimate | p-Value | Estimate | p-Value |
| Latent factor | −0.17 | 0.07 | 0.15 | 0.26 |
| Item 1 | −0.21 | 0.27 | 0.27 | 0.12 |
| Item 2 | −0.03 | 0.85 | 0.09 | 0.49 |
| Item 3 | 0.05 | 0.68 | −0.14 | 0.36 |
| Item 4 | 0.05 | 0.70 | 0.10 | 0.42 |
| Item 5 | 0.19 | 0.15 | −0.12 | 0.44 |
| Fit Values | ||||||||
|---|---|---|---|---|---|---|---|---|
| Stage | Chi-Square | dF | p | RMSEA | CFI | TLI | SRMR | Accepted? |
| Configural | 253.86 | 138 | <0.05 | 0.083 | 0.904 | 0.873 | 0.064 | Yes |
| Metric | 275.62 | 156 | <0.05 | 0.079 | 0.901 | 0.884 | 0.073 | Yes |
| Scalar | 412.36 | 174 | <0.05 | 0.106 | 0.803 | 0.793 | 0.103 | No |
| Partial scalar | 328.45 | 165 | <0.05 | 0.09 | 0.865 | 0.851 | 0.086 | No |
| Strict | 348.82 | 181 | <0.05 | 0.087 | 0.861 | 0.86 | 0.089 | No |
| Original Assessment | UDA Assessment | |||
|---|---|---|---|---|
| Items | Estimate | p-Value | Estimate | p-Value |
| Latent factor | 0.02 | 0.89 | 0.20 | 0.10 |
| Item 1 | −0.01 | 0.96 | 0.20 | 0.21 |
| Item 2 | 0.06 | 0.69 | 0.39 | 0.01 |
| Item 3 | 0.07 | 0.63 | 0.23 | 0.10 |
| Item 4 | 0.04 | 0.79 | −0.21 | 0.18 |
| Item 5 | 0.05 | 0.74 | −0.02 | 0.87 |
| Item 6 | 0.23 | 0.08 | −0.41 | 0.00 |
| Item 7 | −0.16 | 0.28 | 0.18 | 0.23 |
| Fit Values | ||||||||
|---|---|---|---|---|---|---|---|---|
| Stage | Chi-Square | dF | p | RMSEA | CFI | TLI | SRMR | Accepted? |
| Configural | 343.39 | 190 | <0.05 | 0.085 | 0.903 | 0.878 | 0.065 | Yes |
| Metric | 360.14 | 211 | <0.05 | 0.08 | 0.906 | 0.893 | 0.072 | Yes |
| Scalar | 452.79 | 232 | <0.05 | 0.093 | 0.861 | 0.856 | 0.081 | No |
| Partial scalar | 391.18 | 223 | <0.05 | 0.082 | 0.894 | 0.886 | 0.077 | No |
| Strict | 508.56 | 241 | <0.05 | 0.1 | 0.831 | 0.832 | 0.09 | No |
| Original Assessment | UDA Assessment | |||
|---|---|---|---|---|
| Items | Estimate | p-Value | Estimate | p-Value |
| Latent factor | −0.09 | 0.45 | 0.11 | 0.34 |
| Item 1 | −0.19 | 0.86 | −0.03 | 0.86 |
| Item 2 | 0.06 | 0.65 | −0.05 | 0.73 |
| Item 3 | 0.03 | 0.75 | 0.09 | 0.57 |
| Item 4 | 0.06 | 0.59 | -0.08 | 0.55 |
| Item 5 | −0.02 | 0.90 | −0.11 | 0.39 |
| Item 6 | −0.03 | 0.82 | 0.01 | 0.97 |
| Item 7 | 0.01 | 0.91 | 0.22 | 0.17 |
| Item 8 | 0.08 | 0.45 | 0.11 | 0.52 |
| Original Assessment | UDA Assessment | |||
|---|---|---|---|---|
| Items | MP 2-MP 1 | p | MP 2-MP 1 | p |
| Source scale | ||||
| Item 1 | −0.19 | 1.000 | 0.06 | 1.000 |
| Item 2 | −0.35 | 0.108 | −0.04 | 1.000 |
| Item 3 | 0.61 | <0.05 | 0.35 | <0.05 |
| Item 4 | −0.17 | 1.000 | −0.24 | 0.378 |
| Item 5 | −0.54 | <0.05 | −0.03 | 1.000 |
| Certainty scale | ||||
| Item 1 | −0.11 | 1.000 | 0.07 | 1.000 |
| Item 2 | −0.38 | <0.05 | −0.11 | 1.000 |
| Item 3 | −0.11 | 1.000 | −0.01 | 1.000 |
| Item 4 | −0.39 | <0.05 | −0.10 | 1.000 |
| Item 5 | −0.34 | <0.05 | −0.16 | 1.000 |
| Item 6 | −0.75 | <0.05 | −0.06 | 1.000 |
| Item 7 | −0.49 | <0.05 | −0.16 | 1.000 |
| Development scale | ||||
| Item 1 | 0.49 | <0.05 | 0.16 | 1.000 |
| Item 2 | 0.47 | <0.05 | 0.26 | 0.135 |
| Item 3 | 0.46 | <0.05 | −0.11 | 1.000 |
| Item 4 | 0.11 | 1.000 | 0.08 | 1.000 |
| Item 5 | 0.26 | 0.243 | 0.19 | 0.729 |
| Item 6 | 0.27 | 0.189 | 0.07 | 1.000 |
| Item 7 | −0.21 | 1.000 | −0.22 | 0.513 |
| Item 8 | −0.12 | 1.000 | −0.12 | 1.000 |
| Original Assessment | UDA Assessment | |||||||
|---|---|---|---|---|---|---|---|---|
| Standardized Factor Loadings | Mean Values | Standardized Factor Loadings | Mean Values | |||||
| MP 1 | MP 2 | MP 2-MP1 | p | MP 1 | MP 2 | MP 2-MP1 | p | |
| Source scale | ||||||||
| Item 2 | 0.50 | 0.66 | −0.04 | 0.71 | 0.27 | 0.77 | −0.35 | 0.00 |
| Item 3 | 0.37 | 0.71 | 0.35 | 0.00 | 0.54 | 0.65 | 0.61 | 0.00 |
| Item 4 | 0.78 | 0.78 | −0.24 | 0.01 | 0.60 | 0.79 | −0.17 | 0.16 |
| Item 5 | 0.69 | 0.63 | −0.03 | 0.74 | 0.52 | 0.69 | −0.54 | 0.00 |
| Certainty scale | ||||||||
| Item 3 | 0.66 | 0.70 | −0.01 | 0.90 | 0.65 | 0.75 | −0.11 | 0.29 |
| Item 4 | 0.55 | 0.70 | −0.10 | 0.33 | 0.82 | 0.73 | −0.39 | 0.00 |
| Item 6 | 0.63 | 0.63 | −0.06 | 0.50 | 0.64 | 0.71 | −0.75 | 0.00 |
| Item 7 | 0.66 | 0.62 | −0.16 | 0.10 | 0.62 | 0.73 | −0.49 | 0.00 |
| Development scale | ||||||||
| Item 1 | 0.56 | 0.66 | 0.16 | 0.10 | 0.72 | 0.70 | 0.12 | 0.26 |
| Item 2 | 0.64 | 0.71 | 0.26 | 0.00 | 0.52 | 0.60 | 0.17 | 0.08 |
| Item 4 | 0.65 | 0.76 | 0.08 | 0.41 | 0.63 | 0.69 | 0.44 | 0.00 |
| Item 5 | 0.67 | 0.65 | 0.19 | 0.03 | 0.66 | 0.68 | −0.09 | 0.36 |
| Fit Values | ||||||||
|---|---|---|---|---|---|---|---|---|
| Stage | Chi-Square | dF | p | RMSEA | CFI | TLI | SRMR | Accepted? |
| Configural | 37.35 | 30 | 0.167 | 0.045 | 0.985 | 0.972 | 0.041 | Yes |
| Metric | 53.18 | 39 | 0.065 | 0.054 | 0.971 | 0.958 | 0.068 | Yes |
| Scalar | 114.8 | 48 | <0.05 | 0.106 | 0.863 | 0.84 | 0.094 | No |
| Partial scalar | 64.15 | 46 | <0.05 | 0.057 | 0.963 | 0.955 | 0.074 | Yes |
| Strict | 136.96 | 58 | <0.05 | 0.105 | 0.838 | 0.844 | 0.096 | Yes |
| Fit Values | ||||||||
|---|---|---|---|---|---|---|---|---|
| Stage | Chi-Square | dF | p | RMSEA | CFI | TLI | SRMR | Accepted? |
| Configural | 55.46 | 30 | <0.05 | 0.083 | 0.957 | 0.92 | 0.049 | Yes |
| Metric | 71.53 | 39 | <0.05 | 0.082 | 0.945 | 0.921 | 0.068 | Yes |
| Scalar | 119.1 | 48 | <0.05 | 0.109 | 0.88 | 0.86 | 0.098 | No |
| Partial scalar | 76.69 | 44 | <0.05 | 0.077 | 0.945 | 0.93 | 0.071 | Yes |
| Strict | 87.18 | 56 | <0.05 | 0.067 | 0.948 | 0.948 | 0.067 | Yes |
| Fit Values | ||||||||
|---|---|---|---|---|---|---|---|---|
| Stage | Chi-Square | dF | p | RMSEA | CFI | TLI | SRMR | Accepted? |
| Configural | 41.31 | 30 | 0.082 | 0.053 | 0.984 | 0.971 | 0.034 | Yes |
| Metric | 48.93 | 39 | 0.132 | 0.043 | 0.986 | 0.98 | 0.046 | Yes |
| Scalar | 69.95 | 48 | <0.05 | 0.058 | 0.969 | 0.964 | 0.057 | No |
| Partial scalar | 63.19 | 46 | <0.05 | 0.052 | 0.976 | 0.971 | 0.054 | Yes |
| Strict | 87.18 | 56 | <0.05 | 0.067 | 0.948 | 0.948 | 0.067 | No |
References
- Stinken-Rösner, L.; Rott, L.; Hundertmark, S.; Menthe, J.; Hoffmann, T.; Nehring, A.; Abels, S. Thinking Inclusive Science Education from Two Perspectives: Inclusive Pedagogy and Science Education. Res. Subj. Matter Teach. Learn. 2020, 3, 30–45. [Google Scholar]
- Brownell, M.T.; Smith, S.J.; Crockett, J.B.; Griffin, C.C. Inclusive Instruction EvidenceBased Practices for Teaching Students with Disabilities; The Guilford Press: New York, NY, USA, 2012. [Google Scholar]
- Sliwka, A. Diversität als Chance und als Ressource in der Gestaltung wirksamer Lernprozesse. In Das Interkulturelle Lehrerzimmer; VS Verlag für Sozialwissenschaften: Wiesbaden, Germany, 2012. [Google Scholar]
- UNESCO. Education 2030: Incheon Declaration and Framework for Action for the Implementation of Sustainable Development Goal 4: Ensure Inclusive and Equitable Quality Education and Promote Lifelong Learning Opportunities for All; UNESCO: Paris, France, 2016. [Google Scholar]
- CAST. Universal Design for Learning (UDL) Guidelines Version 2.2. 2018. Available online: https://udlguidelines.cast.org/ (accessed on 22 January 2021).
- Al-Azawei, A.; Serenelli, F.; Lundqvist, K. Universal Design for Learning (UDL): A Content Analysis of Peer Reviewed Journals from 2012 to 2015. J. Sch. Teach. Learn. 2016, 16, 39–56. [Google Scholar] [CrossRef]
- Capp, M.J. The effectiveness of universal design for learning: A meta-analysis of literature between 2013 and 2016. Int. J. Incl. Educ. 2017, 21, 791–807. [Google Scholar] [CrossRef]
- García-Campos, M.D.; Canabal, C.; Alba-Pastor, C. Executive functions in universal design for learning: Moving towards inclusive education. Int. J. Incl. Educ. 2018, 24, 660–674. [Google Scholar] [CrossRef]
- Rao, K.; Ok, M.W.; Bryant, B.R. A Review of Research on Universal Design Educational Models. Remedial Spéc. Educ. 2013, 35, 153–166. [Google Scholar] [CrossRef]
- Baumann, T.; Melle, I. Evaluation of a digital UDL-based learning environment in inclusive chemistry education. Chem. Teach. Int. 2019, 1, 1–13. [Google Scholar] [CrossRef]
- Basham, J.D.; Blackorby, J.; Marino, M.T. Opportunity in Crisis: The Role of Universal Design for Learning in Educational Redesign. Learn. Disabil. Contemp. J. 2020, 18, 71–91. [Google Scholar]
- Edyburn, D.L. Would You Recognize Universal Design for Learning if You Saw it? Ten Propositions for New Directions for the Second Decade of UDL. Learn. Disabil. Q. 2010, 33, 33–41. [Google Scholar] [CrossRef]
- Hollingshead, A.; Lowrey, K.A.; Howery, K. Universal Design for Learning: When Policy Changes Before Evidence. Educ. Policy 2020, 1–27. [Google Scholar] [CrossRef]
- Edyburn, D. Ten Years Later: Would You Recognize Universal Design for Learning If You Saw It? Interv. Sch. Clin. 2020, 1–2. [Google Scholar] [CrossRef]
- Murphy, M.P. Belief without evidence? A policy research note on Universal Design for Learning. Policy Futur. Educ. 2021, 19, 7–12. [Google Scholar] [CrossRef]
- Bybee, R.W. Scientific Inquiry and Science Teaching BT: Scientific Inquiry and Nature of Science: Implications for Teaching, Learning, and Teacher Education. In Scientific Inquiry and Nature of Science; Flick, L.B., Lederman, N.G., Eds.; Springer: Dordrecht, The Netherlands, 2006; pp. 1–14. [Google Scholar]
- Hodson, D. Learning Science, learning about Science, Doing Science: Different goals demand different learning methods. Int. J. Sci. Educ. 2014, 36, 2534–2553. [Google Scholar] [CrossRef]
- Hofer, B.K.; Pintrich, P.R. The Development of Epistemological Theories: Beliefs About Knowledge and Knowing and Their Relation to Learning. Rev. Educ. Res. 1997, 67, 88–140. [Google Scholar] [CrossRef]
- Neumann, I.; Kremer, K. Nature of Science Und Epistemologische Überzeugungen: Ähnlichkeiten Und Unterschiede. Ger. J. Sci. Educ. 2013, 19, 209–232. [Google Scholar]
- Sandoval, W.A.; Greene, J.A.; Bråten, I. Understanding and Promoting Thinking About Knowledge. Rev. Res. Educ. 2016, 40, 457–496. [Google Scholar] [CrossRef]
- Hofer, B.K. Personal epistemology as a psychological and educational construct: An introduction. In Personal Epistemology: The Psychology of Beliefs about Knowledge and Knowing; Routledge: New York, NY, USA, 2002; pp. 3–14. [Google Scholar]
- Chinn, C.A.; Buckland, L.A.; Samarapungavan, A. Expanding the Dimensions of Epistemic Cognition: Arguments from Philosophy and Psychology. Educ. Psychol. 2011, 46, 141–167. [Google Scholar] [CrossRef]
- Conley, A.M.; Pintrich, P.R.; Vekiri, I.; Harrison, D. Changes in epistemological beliefs in elementary science students. Contemp. Educ. Psychol. 2004, 29, 186–204. [Google Scholar] [CrossRef]
- Kampa, N.; Neumann, I.; Heitmann, P.; Kremer, K. Epistemological beliefs in science—a person-centered approach to investigate high school students’ profiles. Contemp. Educ. Psychol. 2016, 46, 81–93. [Google Scholar] [CrossRef]
- Mason, L. Psychological perspectives on measuring epistemic cognition. In Handbook of Epistemic Cognition; Routledge: Oxfordshire, UK, 2016. [Google Scholar]
- Elder, A.D. Characterizing fifth grade students’ epistemological beliefs in science. In Personal Epistemology: The Psychology of Beliefs about Knowledge and Knowing; Hofer, B.K., Pintrich, P.R., Eds.; Lawrence Erlbaum Associates Publishers: Mahwah, NJ, USA, 2002; pp. 347–363. [Google Scholar]
- Greene, J.A.; Cartiff, B.M.; Duke, R.F. A meta-analytic review of the relationship between epistemic cognition and academic achievement. J. Educ. Psychol. 2018, 110, 1084–1111. [Google Scholar] [CrossRef]
- Cartiff, B.M.; Duke, R.F.; Greene, J.A. The effect of epistemic cognition interventions on academic achievement: A meta-analysis. J. Educ. Psychol. 2020. [Google Scholar] [CrossRef]
- Bybee, R.W. Achieving Scientific Literacy: From Purposes to Practices; Heinemann: Portsmouth, NH, USA, 1997. [Google Scholar]
- Brass, J. Historicizing the Role of Education Research in Reconstructing English for the Twenty-first Century. Chang. Engl. 2009, 16, 275–286. [Google Scholar] [CrossRef]
- Schlüter, A.K.; Melle, I.; Wember, F. Unterrichtsgestaltung in Klassen Des Gemeinsamen Lernens: Universal Design for Learning. Sonderpädag. Förd. 2016, 3, 270–285. [Google Scholar] [CrossRef]
- Rao, K.; Meo, G. Using Universal Design for Learning to Design Standards-Based Lessons. SAGE Open 2016, 6, 1–12. [Google Scholar] [CrossRef]
- King-Sears, M. Universal Design for Learning: Technology and Pedagogy. Learn. Disabil. Q. 2009, 32, 199–201. [Google Scholar] [CrossRef]
- Gregg, N.; Nelson, J.M. Meta-analysis on the Effectiveness of Extra time as a Test Accommodation for Transitioning Adolescents with Learning Disabilities. J. Learn. Disabil. 2010, 45, 128–138. [Google Scholar] [CrossRef] [PubMed]
- Beddow, P. Beyond Universal Design: Accessibility Theory to Advance Testing for All Students. In Assessing Students in the Margin: Challenges, Strategies and Techniques; Information Age Publishing: Charlotte, NC, USA, 2011. [Google Scholar]
- Lovett, B.J.; Lewandowski, L.J. Testing Accommodations for Students with Disabilities; American Psychological Association: Washington, DC, USA, 2015. [Google Scholar]
- Thompson, S.; Thurlow, M.; Malouf, D.B. Creating Better Tests for Everyone through Universally Designed Assessments. J. Appl. Test. Technol. 2004, 6, 1–15. [Google Scholar]
- Thompson, S.J.; Johnstone, C.J.; Thurlow, M.L. Universal Design Applied to Large Scale Assessments; National Center on Educational Outcomes: Minneapolis, MN, USA, 2002. [Google Scholar]
- Walkowiak, M. Konzeption Und Evaluation von Universell Designten Lernumgebungen Und Assessments Zur Förderung Und Erfassung von Nature of Science Konzepten, Gottfried Wilhelm Leibniz Universität. 2019. Available online: https://www.repo.uni-hannover.de/handle/123456789/5192 (accessed on 22 January 2021).
- Salvia, J.; Ysseldyke, J.; Witmer, S. What Test Scores Mean. In Assessment in Special and Inclusive Education; Cengage Learning, Inc.: Boston, MA, USA, 2016. [Google Scholar]
- Clark, R.C.; Mayer, R.E. Introduction: Getting the Most from this Resource. In e-Learning and the Science of Instruction; John Wiley & Sons, Inc.: Hoboken, NJ, USA, 2012. [Google Scholar]
- Apple Inc. IBooks Author: Per Drag & Drop Ist Das Buch Schnell Erstellt. Available online: https://www.apple.com/de/ibooks-author/ (accessed on 15 November 2017).
- Nehring, A.; Walkowiak, M. Digitale Materialien Nach Dem Universial Design for Learning. Schule Inklusiv 2020, 8, 28–32. [Google Scholar]
- Inclusion Europe. Information for Everyone: European Rules on How to Make Information Easy to Read and Understand; Inclusion Europe: Brussels, Belgium, 2016. [Google Scholar]
- Mayring, P. Einführung in Die Qualitative Sozialforschung; Beltz Verlag: Weinheim, Germany, 2016. [Google Scholar]
- Carey, S.; Evans, R.; Honda, M.; Jay, E.; Unger, C. An experiment is when you try it and see if it works: A study of grade 7 students’ understanding of the construction of scientific knowledge. Int. J. Sci. Educ. 1989, 11, 514–529. [Google Scholar] [CrossRef]
- Labudde, P. Fachdidkatik Naturwissenschaft. 1–9. Schuljahr; UTB: Stuttgart, Germany, 2010. [Google Scholar]
- Mayring, H.; Wimmer, H. Salzburger Lese-Screening Für Die Schulstufen 2–9; Hogrefe: Gottingen, Germany, 2014. [Google Scholar]
- Heller, K.; Perleth, C. Kognitiver Fähigkeitstest Für 4. Bis 12. Klassen, Revision; Beltz & Gelberg: Weinheim, Germany, 2000. [Google Scholar]
- Torsheim, T.; the FAS Development Study Group; Cavallo, F.; Levin, K.A.; Schnohr, C.; Mazur, J.; Niclasen, B.; Currie, C.E. Psychometric Validation of the Revised Family Affluence Scale: A Latent Variable Approach. Child Indic. Res. 2016, 9, 771–784. [Google Scholar] [CrossRef]
- Fauth, B.; Decristan, J.; Rieser, S.; Klieme, E.; Büttner, G. Student ratings of teaching quality in primary school: Dimensions and prediction of student outcomes. Learn. Instr. 2014, 29, 1–9. [Google Scholar] [CrossRef]
- Sprague, E.W.; Dahl, D.W. Learning to Click. J. Mark. Educ. 2009, 32, 93–103. [Google Scholar] [CrossRef]
- Werning, R.; Thoms, S. Anmerkungen Zur Entwicklung Der Schulischen Inklusion in Niedersachsen. Z. Inkl. 2017, 2, 1–4. [Google Scholar]
- Lucke, J.F. The α and the ω of Congeneric Test Theory: An Extension of Reliability and Internal Consistency to Heterogeneous Tests. Appl. Psychol. Meas. 2005, 29, 65–81. [Google Scholar] [CrossRef]
- Naumann, A.; Hartig, J.; Hochweber, J. Absolute and Relative Measures of Instructional Sensitivity. J. Educ. Behav. Stat. 2017, 42, 678–705. [Google Scholar] [CrossRef]
- Sideridis, G.D.; Tsaousis, I.; Al-Harbi, K.A. Multi-Population Invariance with Dichotomous Measures. J. Psychoeduc. Assess. 2015, 33, 568–584. [Google Scholar] [CrossRef]
- Kuusela, H.; Paul, P. A Comparison of Concurrent and Retrospective Verbal Protocol Analysis. Am. J. Psychol. 2000, 113, 387–404. [Google Scholar] [CrossRef]
- Ryan, K.E.; Gannon-Slater, N.; Culbertson, M.J. Improving Survey Methods with Cognitive Interviews in Small and Medium-Scale Evaluations. Am. J. Eval. 2012, 33, 414–430. [Google Scholar] [CrossRef]
- Anderson, D.; Lai, C.F.; Alonzo, J.; Tindal, G. Examining a Grade-Level Math CBM Designed for Persistently Low-Performing Students. Educ. Assess. 2011, 16, 15–34. [Google Scholar] [CrossRef]
- Bridgeman, B.; Trapani, C.; Curley, E. Impact of Fewer Questions per Section on SAT I Scores. J. Educ. Meas. 2004, 41, 291–310. [Google Scholar] [CrossRef]
- Wise, S.L.; Kingsbury, G.G. Modeling Student Test-Taking Motivation in the Context of an Adaptive Achievement Test. J. Educ. Meas. 2016, 53, 86–105. [Google Scholar] [CrossRef]
- Lamprianou, I.; Boyle, B. Accuracy of Measurement in the Context of Mathematics National Curriculum Tests in England for Ethnic Minority Pupils and Pupils Who Speak English as an Additional Language. J. Educ. Meas. 2004, 41, 239–259. [Google Scholar] [CrossRef]
- Zydney, J.; Hord, C.; Koenig, K. Helping Students with Learning Disabilities Through Video-Based, Universally Designed Assessment. eLearn 2020, 2020. [Google Scholar] [CrossRef]
- Johnstone, C.; Higgins, J.; Fedorchak, G. Assessment in an era of accessibility: Evaluating rules for scripting audio representation of test items. Br. J. Educ. Technol. 2018, 50, 806–818. [Google Scholar] [CrossRef]
- Muldner, K.; Burleson, W.; Van De Sande, B.; VanLehn, K. An analysis of students’ gaming behaviors in an intelligent tutoring system: Predictors and impacts. User Model. User Adapt. Interact. 2011, 21, 99–135. [Google Scholar] [CrossRef]
- Quigley, D.; Ostwald, J.L.; Sumner, T. Scientific modeling. In Proceedings of the 7th International Learning Analytics & Knowledge Conference, Vancouver, BA, Canada, 13–17 March 2017; Association for Computing Machinery: New York, NY, USA; pp. 329–338. [Google Scholar]

| Dimensions of EBs | Naïve | Sophisticated |
|---|---|---|
| Nature of knowledge | ||
| Certainty | Scientific knowledge is either right or wrong | Scientific knowledge consists of the reflection of several perspectives |
| Development | Scientific knowledge is a static and unchangeable subject | Scientific ideas and theories change in the light of new evidence |
| Nature of knowing | ||
| Source | Knowledge resides in external authorities such as teachers or scientists | Knowledge is created by the student |
| Justification | Phenomena are discovered through scientific investigation, such as experiment or observation | Knowledge is created through arguments, thinking, multiple experimentation, and observation |
| Provide Multiple Means of Engagement | Provide Multiple Means of Representation | Provide Multiple Means of Action & Expression |
|---|---|---|
| 1. Support possibilities for the perception of the learning content | 4. Various ways to interact with the learning content | 7. Various offers to arouse the interest in learning |
| 2. Support possibilities for the representations of linguistic and symbolic information of the learning content | 5. Various ways to express and communicate about the learning content | 8. Support options to maintain engaged learning |
| 3. Support options for a better understanding of the learning content | 6. Support options for processing the learning content | 9. Support options for self-regulated learning |
| Element | Description |
|---|---|
| 1. Inclusive Assessment Population | Tests designed for state, district, or school accountability must include every student except those in the alternate assessment, and this is reflected in assessment design and field-testing procedures. |
| 2. Precisely Defined Constructs | The specific constructs tested must be clearly defined so that all construct irrelevant cognitive, sensory, emotional, and physical barriers can be removed. |
| 3. Accessible, Non-Biased Items | Accessibility is built into items at the beginning, and bias review procedures ensure that quality is retained in all items. |
| 4. Amenable to Accommodations | The test design facilitates the use of needed accommodations (e.g., all items can be Brailled). |
| 5. Simple, Clear, and Intuitive Instructions and Procedures | All instructions and procedures are simple, clear, and presented in understandable language. |
| 6. Maximum Readability and Comprehensibility | A variety of readability and plain language guidelines are followed (e.g., sentence length and number of difficult words are kept to a minimum) to produce readable and comprehensible text. |
| 7. Maximum Legibility | Characteristics that ensure easy decipherability are applied to text, tables, figures, and illustrations, and to response formats. |
| Operationalization | UDL-Guideline |
|---|---|
| MS Sans Serif 18 | 1. |
| Line spacing 2.0 | 1. |
| Easy language | 1./2. |
| Pictorial support to distinguish text types (learning objectives, tasks, learning information) | 2. |
| Selection of the content representation form (pop-up text, comic, video) | 3./7. |
| Read aloud function | 3. |
| Page organization | 8./9. |
| Working with a checklist | 6. |
| Self-assessment on the learning content | 5./9. |
| Working on real objects | 4. |
| iPad-based | 4. |
| Group work/peer tutoring | 5. |
| Assessment | Learning Environment | |
|---|---|---|
| UDL learning environment | MR learning environment | |
| UDA assessment | Group 1 | Group 2 |
| Standard assessment | Group 3 | Group 4 |
| Items | Wording |
|---|---|
| Item 1 | Scientists carry out experiments several times in order to secure the result. |
| Item 2 | When natural scientists conduct experiments, natural scientists determine important things beforehand. |
| Item 3 | Scientists need clear ideas before researchers start experimenting. |
| Item 4 | Scientists get ideas for science experiments by being curious and thinking about how something works. |
| Item 5 | An experiment is a good way to find out if something is true. |
| Item 6 | Good theories are based on results from many different experiments. |
| Item 7 | Natural scientists can test their ideas in various ways. |
| Test Type | Construct |
|---|---|
| Paper-pencil test | Reading: Salzburger-Lesescreening 2–9 [48] |
| Cognitive skills: KFT 4-12+R-N2 [49] | |
| iPad | Socioeconomic status [50] |
| Cognitive activation [51] | |
| Perception of learning success [52] | |
| Gender | |
| Age | |
| Diagnosed special needs |
| Original Assessment | UDA Assessment | |||||||
|---|---|---|---|---|---|---|---|---|
| Standardized Factor Loadings | Mean Values | Standardized Factor Loadings | Mean Values | |||||
| MP 1 | MP 2 | MP 2-MP 1 | p | MP 1 | MP 2 | MP 2-MP 1 | p | |
| Item 2 | 0.25 | 0.38 | −0.24 | 0.01 | 0.72 | 0.70 | 0.12 | 0.26 |
| Item 3 | 0.21 | 0.46 | 0.00 | 1.00 | 0.52 | 0.60 | 0.17 | 0.08 |
| Item 4 | 0.44 | 0.71 | 0.18 | 0.06 | 0.63 | 0.69 | 0.44 | 0.00 |
| Item 6 | 0.50 | 0.73 | 0.01 | 0.88 | 0.66 | 0.68 | −0.09 | 0.36 |
| EBs-Scale | MP 1 | MP 2 | MP 1 and MP 2 |
|---|---|---|---|
| UDA Assessment | |||
| Source | 0.86 | 0.89 | 0.9 |
| Certainty | 0.8 | 0.81 | 0.85 |
| Development | 0.78 | 0.85 | 0.87 |
| Justification | 0.74 | 0.78 | 0.8 |
| Original Assessment | |||
| Source | 0.83 | 0.9 | 0.89 |
| Certainty | 0.74 | 0.75 | 0.81 |
| Development | 0.75 | 0.79 | 0.82 |
| Justification | 0.41 | 0.66 | 0.62 |
| Fit Values | ||||||||
|---|---|---|---|---|---|---|---|---|
| Stage | Chi-Square | dF | p | RMSEA | CFI | TLI | SRMR | Accepted? |
| Configural | 41.31 | 30 | 0.082 | 0.053 | 0.984 | 0.971 | 0.034 | Yes |
| Metric | 43.47 | 39 | 0.287 | 0.03 | 0.991 | 0.987 | 0.054 | Yes |
| Scalar | 69.95 | 48 | <0.05 | 0.058 | 0.969 | 0.964 | 0.057 | Yes |
| Strict | 70.96 | 59 | 0.137 | 0.039 | 0.976 | 0.977 | 0.073 | Yes |
Publisher’s Note: MDPI stays neutral with regard to jurisdictional claims in published maps and institutional affiliations. |
© 2021 by the authors. Licensee MDPI, Basel, Switzerland. This article is an open access article distributed under the terms and conditions of the Creative Commons Attribution (CC BY) license (https://creativecommons.org/licenses/by/4.0/).
Share and Cite
Roski, M.; Walkowiak, M.; Nehring, A. Universal Design for Learning: The More, the Better? Educ. Sci. 2021, 11, 164. https://doi.org/10.3390/educsci11040164
Roski M, Walkowiak M, Nehring A. Universal Design for Learning: The More, the Better? Education Sciences. 2021; 11(4):164. https://doi.org/10.3390/educsci11040164
Chicago/Turabian StyleRoski, Marvin, Malte Walkowiak, and Andreas Nehring. 2021. "Universal Design for Learning: The More, the Better?" Education Sciences 11, no. 4: 164. https://doi.org/10.3390/educsci11040164
APA StyleRoski, M., Walkowiak, M., & Nehring, A. (2021). Universal Design for Learning: The More, the Better? Education Sciences, 11(4), 164. https://doi.org/10.3390/educsci11040164


