Abstract
Multidisciplinarity and the enrichment of science and mathematics education toward the so-called STEAM-approach where the A stands for art, has raised a lot of academic interest in the past decade. In this study, 5th and 6th graders from the greater Helsinki area (N = 390) participated in a several months long, Mars-colonization themed STEAM-learning intervention. Testing the students’ science knowledge using pre- and post-tests, their learning outcomes were compared to those of 5th and 6th graders from a control school (N = 119), who during the same period studied STEM-subjects in a more traditional manner. The main factors that were taken into account during the comparisons were gender and academic achievement level. Based on only whether there was any improvement between the pre- and post-test scores, girls were found to have benefitted from the Mars-module more than boys did. While also considering the magnitude of the said improvement, no significant difference in the effectiveness of the learning module was found between genders. The group of academically highest-achieving students improved their test scores the most after participating in the STEAM-learning module. This is an important, somewhat surprising finding, as often informal, outside of school learning has been found to benefit especially students with lower grade point averages.
1. Introduction
The Sputnik phenomenon in 1950s’ and the Apollo Moon Program in 1960s had a huge impact also on science education [1,2]. Now, the challenge and opportunity for science education is travelling to Mars. The objective of the project documented in this article was to study the effects of expanding STEM (Science, Technology, Engineering, Mathematics) subjects to include Arts; arts in this case taking form of any artistic, creative, or crafty element added to the traditional science subjects.
Bridging the gap between formal education and informal learning is considered a great challenge as well as a promising solution for many educational dilemmas globally. Out-of-school education, combining open learning environments, digital solutions, and classroom teaching in a manner fitting the curriculum, seems to offer fruitful opportunities for STEAM-pedagogy. In this article, we attempt to find evidence supporting the benefits of this approach by means of a long-term intervention [3].
School classes were planning their own trip to Mars in hopes of introducing creative approaches into STEAM-education, in order to generate alternative ideas and strategies within scientific enquiry and critical reasoning [4]. The project’s approach was driven by a motivation to foster everyday creativity in students so that they engage in purposive, imaginative activity by generating outcomes that are original and valuable to them, thus resulting in a fascination with the subject and encouraging learning results [5].
The project was administrated according to the national core curriculum in Finland as “Transversal Competencies,” which formed a 60 h entity spread over one term, consisting of entire school days as well as single lectures. The pupils and the teachers used and applied especially informal learning and out-of-school education such as visits to planetarium, museum and science centre exhibition, study trips, environmental education, and workshops. These are activities that have often been found to increase the level of interest and motivation of students experience towards STEM-subject, making it more likely for them to later enroll in related studies and to pursue careers in related fields [6]. Also digital learning such as Augmented Reality solutions and international learning platform where students developed and presented stories about their own ideas, plans and proposals for Mars-travel, were utilized. Applying mathematics was in a central role during the project. However, the key element was to support and supplement traditional science education by art, languages, skills, and humanities, i.e., expanding the STEM into STEAM.
For this expansion, the acronym STEAM is commonly used, although umbrella terms such as creative learning are also used in literature to refer to the same phenomenon (e.g., [7,8]). The concept of STEAM-learning is obviously predated by creative learning, hands-on learning and the perception of art and aesthetic elements as inherently present in also subjects such as science and mathematics. All this is clearly described in for example John Dewey’s work during the first half of the 20th century [9,10,11]. In Dewey’s work, combining art with mathematics in a tactile way, thus making learning more “hands-on,” was found to benefit particularly academically lower-achieving students. The problem with the concept of STEAM and making comparisons between the successes of different STEAM-learning experiments lies in the definition of the letter A in the acronym. While some define it extensively as we do to include all forms of arts and crafts, others use it to refer to the subject art as it is taught in school, and a third clique to humanities in general [12]. Comparing the results of different STEAM studies, one should make note of how the ways art or arts are defined in the said studies compared to one another.
The focus of STEAM has often been specifically on scientific technology and its use in motivating students in regard of science subjects. It aims to enhance their learning experience and ability for creative problem solving by teaching science, mathematics, and technology in an interdisciplinary manner, focusing strongly on real world applications [13]. In addition to introducing elements of arts and humanities into traditional STEM-subjects in order to raise interest and motivate, an important objective of STEAM-approach is to improve the level of students’ scientific literacy and their understanding of principles of science and scientific technology.
For STEAM-approach to be successful, the real world problem providing context for the introduction of the concepts should be one the students can experience as something that could affect them. Further, it should be able to integrate science subjects, mathematics, engineering, and art in a manner that feels as organic as possible. The more familiar the students perceive the problem presented to them and the difficulties they encounter while solving it, the more engaging and meaningful they find it and the more motivated they thus become towards solving it [13]. The problems should be chosen in a manner that lets the students find their own ways to solve them, but also so that they cannot be easily solved by approaching them solely from a scientific or artistic point of view. In addition to developing students’ thinking- and problem solving skills [13], STEAM has also been found useful in developing more inclusive teaching practices [12]. An approach to teaching science subjects that allows more active, hands-on learning has shown great promise among students with disabilities and serious emotional disturbances [14].
The most recent literature reviews seem to present evidence validating the high expectations toward STEAM [15]. Many different approaches have shown promise in utilizing, as well as increasing the students’ understanding of, both science and artistic concepts, thus building up the students’ sense of competence readiness and their perception of modes of cooperation, such as individual responsibility and promotive interaction. In these approaches, the art dimension has been introduced for example via music, dance, theatre, architecture, and multi-approach projects.
Latest innovations related to immersive technologies are rapidly transforming the field of education. Among them, Augmented Reality (AR) has shown promise as a resource for STEAM pedagogy [16]. Artificial Intelligence (AI) is also one of the ambiguous opportunities for the future of education, and it seems possible for it to encourage and induce students’ capacities in the area of abstract and logical thinking by utilizing STEAM approach [17].
Regrettably, creativity is very often seen as exclusively connected to artistic activities. However, recent findings demonstrate its linkage with the STEM learning processes, both in the classroom environment and via STEAM approach also in informal settings [18].
In this study, we attempt to find out whether a Mars-colonialization themed, multidisciplinary learning module helped students develop their 21st century skills (learning to learn and thinking skills, group work, leadership etc.,) or the way they approach problem solving. Due to their important role in helping students study science and mathematics in a manner that enables much deeper level of learning, this article focuses mainly on thinking skills and learning to learn. Especially the development of reasoning and thinking skills is crucial in learning science, as through metacognitive awareness it can free the students from having to learn solely by memorizing facts, and let them evaluate and question new information based on what they already know and what they observe [19,20]. During the project, the level of motivation the students experienced towards school and more specifically toward science was also studied. This aspect of the project will be documented in another article.
Multiple-choice questionnaires were used to assess the learning outcomes of both the students who participated in the Mars module and the students in the control group, who studied science subjects in a more traditional manner and setting. The purpose was to learn if some groups of students, in this article divided mainly based on gender and grade point average, benefitted from the Mars module more than others did. Questionnaires were used to measure both motivation and learning outcomes. However, this article focuses exclusively on learning outcomes.
Based on previous research relating to STEAM-learning, the research questions were set as follows:
- (1)
- Do learning outcomes of the students who took part in the Mars colonization-themed learning module differ from those of students who studied the subject matter in a more traditional manner?
- (2)
- Is there a difference in effectiveness of the Mars-module in terms of learning outcomes between girls and boys?
- (3)
- Is there a difference in effectiveness of the Mars-module between academically low- and high-achieving students?
2. Materials and Methods
2.1. Participants
The students who participated in the study came from 8 schools in the Helsinki capital area (N = 509), 7 schools that participated in the Mars-learning module (n = 390), and 1 control school (n = 119). They were randomly selected from the more than 2000 students representing this age group that attended the project as part of routine out-of-school education according to the official school curriculum, which in Finland [21] gives a lot of freedom for the teachers to utilize informal learning settings and out-of-school education like science centers.
Out of the students who participated in the Mars-module, 5.3% were 4th graders (n = 27) who we decided to leave out of this article because of their small number. We also left out all the students who did not answer one of the pre- or post- questionnaires, since it would have been impossible to study their improvement during the learning module. Two students who did not answer the question about gender were also left out due to their small number and the role gender plays in the analysis in this article. The skewness of the results based on both pre- and post-questionnaires and the students’ grade point averages was studied separately for the students who remain in the study and the ones who got left out, and it was found that the groups do not differ from each other significantly. Out of the 5th and 6th-grade students who answered both the pre- and post-questionnaires including the question about gender (N = 364), 48.4% (n = 176) were girls and 51.6% (n = 188) were boys. Total of 90 (n = 90) of the students were from the control school and did not participate in the STEAM-learning activities the other students had in common. During the time the learning module took place, the students (excluding the 4th graders whose answers were left out) were between 10 and 12 years old. The study followed the empirical permission requirements and ethical principles and the students cannot be identified from the results.
2.2. The Learning Module
The activities the students participated in followed the national core curriculum. They were planned to satisfy the call for versatility in learning methods with a distinct focus on enabling the students to develop their 21st century skills, targeting especially thinking skills and learning to learn. During some of the activities all the schools participated in, the students would work in groups adding hands-on elements and creativity into learning about Mars and the challenges they would expect to face during the imagined colonization process. Creative tasks performed in groups were designed to motivate students, working and having conversations with their peers was also supposed to aid the students reflect on their work and possibly reach what has been referred to as assisted metacognition [22]. Discussing the best ways to approach problems and reflecting on their learning together with other students supported the goals of the learning module, as having to verbalize one’s own thinking process helps in structuring one’s thoughts, thus helping in development of thinking skills.
2.3. Testing
Progress during the learning module (the Mars-colonization themed STEAM-learning module for other schools, normal science classes for the control school) was monitored with two paper and pencil knowledge tests that were taken under controlled conditions. Both the pre- and post-tests had the same 27 multiple-choice questions that could be divided under three different cognitive fields; knowing, reasoning, and applying. Each question had four answer choices, with the possibility of more than one being correct. The points for the questions were given ranging from one to three, depending on how difficult the question was deemed. In some of the questions, the students had to find all the correct answers in order to score points, in other questions partially correct answer would suffice for either partial or even full credit. No points were taken away for incorrect answers. In addition to the multiple-choice questions, the questionnaire had one open question that was not utilized for the purpose of this article. The students were informed that the test results would have no effect on their grades. The students also answered a Likert scale questionnaire measuring their science motivation, findings from which will be discussed in another article.
The pre- and post-tests did not measure the learning outcomes specifically relating to the subject matter that was studied (i.e., Mars or space), but to science in general. In some questions, the students had to, among other things, be able to give answers based on pictures using their knowledge of natural sciences (For example a picture showing different layers of earth, the question being in which of them it is the hottest, or a picture of a circuit including a lamp and a battery, based on which the students had to answer whether the lamp would light up, while also identifying the reason as to why or why not). Others, while also being based on pictures, were perhaps more related to logic (In this category falls for example a picture showing three different seesaws, on them pairs of four different objects. Based on this, the students had to be able to tell the weight of one object in relation to the other three). Most of the questions did not require particular visual reasoning skills. Students were among other things asked the following questions:
Which of the following can make objects repel one another?
- (a)
- Gravity
- (b)
- Magnetism
- (c)
- Electricity
- (d)
- None of the above
There are plants that produce fruit, such as apples. What is the purpose of the fruit?
- (a)
- To protect the seeds
- (b)
- To produce nutrients for the seeds
- (c)
- To spread the seeds with the help of animals
- (d)
- To store water for the germination of seeds
As the children who answered the questionnaire were approaching the age where their level of cognitive development allows more abstract thinking [23,24], many of the questions were formulated to measure the ability to apply previously acquired knowledge and the capacity to find answers by reasoning. More than to learn whether the students had more fact-based knowledge after the learning module than before, the goal was to uncover the possible advantage the students who participated in the STEAM-learning module that emphasized development of thinking skills may have had in questions that required transfer of knowledge or reasoning. The detailed description and validated version of the questionnaire are reported in the research literature (cf. [5]).
2.4. Data-Analysis Methods
One-way repeated measures analysis of variance (ANOVA) was used to determine whether there was a significant change between the students’ pre- and post-test scores. Using it, the possible interaction effects between the following factors were also studied:
- (1)
- Change between the pre- and post-test scores
- (2)
- Gender
- (3)
- Academic achievement level
- (4)
- Whether the student participated in the Mars-themed STEAM learning module.
A chi-square-test was applied to test the goodness of the fit of the models. Multivariate analysis of variance (MANOVA) was utilized to detect whether the student’s performance in the pre-test would predict their progress or the lack of it during the learning module. The interactions between variables were also studied and taken into account.
3. Results
Both the pre- and post-test had the same 28 items, the last of which was an open question that was not used for the purposes of this article. The reliabilities calculated based on the 27 numerical questions in the pre- and post-test were satisfactory, Cronbach’s score for the pre-test and for the post-test . The Cronbach’s score for students’ grades that were used to measure the academic performance level was good, .
For the purpose of this study, the students were divided into groups based on gender (girl/boy) and their academic performance level. Academic performance was measured using grade point average (GPA) calculated from all subjects for which the students were graded, because in terms of STEAM learning it stands to reason to also include subjects that are not strictly academic. In Finland, students in primary school (except for the lowest grades, where students usually only receive written feedback) are graded from 4 to 10, 10 being the highest and 4 a failing grade. In this article, the division into academic performance groups is done by dividing the students into three groups based on GPA, the lowest 25% being in group 1, the 50% in the middle in group 2, and the highest 25% in group 3. In addition to gender and academic performance, the third factor based on which the students were divided was whether they participated in the Mars-module or were from the control school. Dividing students into groups based on all three factors at once leads to groups that are too small for meaningful comparisons using the methods of this article, and during the numerical data analysis, the groups are kept larger by focusing on only two factors at once. Here, however, in order to gain a general sense of what to expect from the results, the graphs are also presented for groups that are simultaneously divided based on whether the student participated in the Mars-module, gender and academic achievement. Later in the article, students are also divided based on whether they improved their score in the post-test compared to the pre-test or not. All of the following results are reported on a significance level.
Figure 1 gives a rough overview of how the different academic performance groups have progressed between the pre- and post-tests.
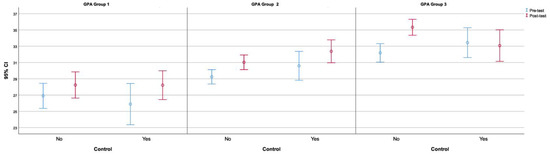
Figure 1.
The pre- and post-test scores of the three different academic performance groups. On the X-axis No means that the student participated in the Mars-module, Yes that the student was from the control school.
It would seem that in the lowest academic performance group, the students who participated in the STEAM-learning module did not improve between the pre-and post-tests in a way that would have differed from the improvement shown by the students from the control school. The Mars-module appears to have had a larger influence on the learning of the students, who belonged to the GPA group 2 (50% in the middle), as well as those with top 25% GPAs. In both of these groups, the students who participated in the learning module progressed more than those who did not, the difference being more pronounced among the students in the highest academic achievement group. In all of the three performance groups, the students from the control school appear to have had a wider range of test scores in both the pre-and post-tests, but this is explained by the number of students from the control school being smaller and the averages thus having been calculated from a smaller number of test scores.
Figure 2 shows the pre- and post-test scores in a similar manner, now divided based on gender instead of academic achievement.
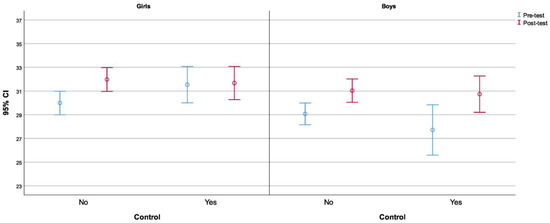
Figure 2.
The pre- and post-test scores divided based on gender. On the X-axis No means that the student participated in the Mars-module, Yes that the student was from the control school.
Both girls and boys seem to have improved their scores more significantly after having participated in the Mars-module. The wider range of test scores of the students of the control school is predictably visible also here, but once again it is caused by the number of students from the control school being smaller. What is immediately noticeable is that while girls from the control school as a group have barely had any change in their test scores between the pre- and post-tests, boys from the control school have performed much better in the post-test than they did in the pre-test.
These results still raise a question of whether there is a difference in improvement between pre- and post-tests between genders in the different academic performance groups. Unfortunately dividing students into groups based on whether they participated in the Mars-module, gender, and academic achievement level simultaneously leads to groups that are too small for the data-analysis methods used in this article, and is hence not done in these preliminary examinations either.
After using the previous graphs to detect the clearest results visually, one-way repeated measures analysis of variance (ANOVA) was next used to determine whether and how much learning actually occurred between the pre- and post-tests, as well as to expose possible interactions between the improvement between the pre- and post-test results, whether the student participated in the Mars-module, and gender. This method of statistical analysis can be used, as the pre- and post-test score variables are approximately normally distributed (skewness −0.37 and −0.76 respectively, kurtosis −0.07 and 0.68 respectively).
Repeated measures ANOVA of the whole population without dividing it into groups based on any variable reveals that learning between the pre- and post-tests has happened (, approximately 11.2% effect size). Examining the scores of the control group and the students who participated in the Mars-module separately shows that both groups improved their scores significantly during the studied period ( and an effect size of approximately 4.7% for the control group, with an effect size of approximately 14.7% for the students who participated in the Mars-module). The way the students who participated in the module surpassed the students from the control school can be seen in Figure 3. Studying the data divided into groups based on whether the student participated in the Mars-module or was from the control school also revealed significant interactions between the change between the pre- and post-test scores and gender (, approximately 1.4% effect size). Another significant interaction was found between the change between the pre- and post-test results, whether the student participated in the Mars-module or was from the control school, and gender (, approximately 1.5% effect size).
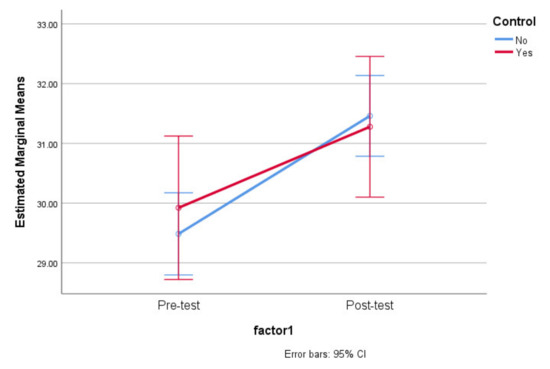
Figure 3.
A visual representation of the means and standard deviations of the pre- and post-test scores for the students who participated in the Mars-module (blue) and the students from the control school (red).
Table 1 reveals the information that could already largely be detected in Figure 2. It shows that girls have performed slightly better than boys in all the groups, but that in the control school girls improved very little, while boys on average improved even more than either the girls or the boys who participated in the Mars-module did. In the control school, the boys’ pre-test scores on average were lower than the scores of any of the other groups. For this group the pre-test score also had almost two points higher standard deviation than the post-test score, which indicates that the students with lowest pre-test scores managed in the post-test to diminish the gap to the students who had performed better in the pre-test. It is possible that the way science was studied in the control school between the pre- and post-tests served particularly academically lower-achieving students. The group of students with lower GPAs is likely to have overlap with the group that has lower pre-test scores at least to a certain degree, as there is a significant positive correlation (0.388) between a student’s grade point average and their pre-test score.

Table 1.
The pre- and post-test scores for both girls and boys among the students who participated in the Mars-module (top) and in the control school (bottom).
The model that takes into account the gender and whether the student participated in the Mars-module, where the different groups are studied separately, reveals that there was a significant change between the pre- and post-test scores for all of the groups expect for girls from the control school. Very little difference was found between the occurred learning of girls and boys who participated in the learning module; the null hypothesis was that no difference would be detected between genders. For girls the p-value was and the effect size approximately 14.9%. For boys the same statistics were, approximately 14.5% effect size. For the boys of the control school these values differ slightly more, with and effect size of approximately 20.9%. The way the difference between genders remained very similar in the post-test for the students who participated in the Mars-module but dwindled in the control school is interesting and merits further examining.
In the following statistical models the students have been divided into two groups first based on gender (girl/boy) and within those two groups again based on the difference between their pre- and post-test scores: those, whose score either got lower or stayed the same (0 or Neg) and those, whose score got higher (Pos). It is worth noting for the sake of all the remaining results in this article that the majority of the students did improve their scores; there were 228 students with a positive difference between the post-test and the pre-test scores (n = 228). 111 of the students had a post-test score that was lower than their pre-test score (n = 111) and 25 students’ score remained the same in the post-test (n = 25). The results are also studied separately for the students who participated in the Mars-module and the students from the control school. Table 2 shows the results of this crosstabulation.
Table 2.
Crosstabulation showing the students divided based on gender, and whether their post-test score was same or lower than their pre-test score (0 or Neg) or higher than their pre-test score (Pos). The students who participated in the Mars module are shown in the column on the left, the students from the control school in the centre column.
The observed difference between scores differed from the expected only for girls (absolute value of adjusted residual 2.1) so that there were 78 girls who had a positive difference between the pre-and post-test scores among the students who participated in the Mars-module, which is more than the expected count of 71.9. For boys there were no significant differences between the observed and expected counts. This indicates that in terms of strictly whether the change between the pre- and post-tests was positive or negative, girls may have benefited from the Mars-module more than the boys did. Without considering gender, the crosstabulation revealed no significant results.
The statistical significance of this result is displayed in Table 3, which is truncated to show only girls since for boys the crosstabulation revealed no significant results. The Chi-square value is 4.22 with a p-value of 0.04 for girls, leading to conclusion that the variables are not independent and there is a statistically significant relationship between them. This implies that for girls participating in the Mars-module likely made a difference in terms of learning outcomes. There are no cells with expected count less than 5 and no empty cells.
Table 3.
Chi-square tests, table is truncated to show only girls. Significant p-value of 0.04 and Chi-square value of 4.22. There are no cells with expected count less than 5 and no empty cells.
Within the group of students who participated in the Mars-module, ANOVA repeated measures revealed no significant difference between girls and boys in the change between the pre- and post-test results, when the actual change in points was being studied. Considering only whether a student scored higher or lower in the post-test than they did in the pre-test, however, made girls who participated in the Mars-module over represented among the students who did better in the post-test. After these findings about gender differences in the effectiveness of the Mars-module, the students were next divided into groups based on academic achievement, in Group 1 the students with GPAs in the bottom 25%, in Group 2 the 50% in the middle, and in Group 3 the top 25%.
The information that is presented in Table 4 shows that in groups 1 and 2 the observed difference between the pre- and post-test scores did not significantly differ from the expected score. Just as Graph 1 (which, however, shows the pre- and post-test scores in points, and not the number of students whose scores improved and whose did not) already suggested, the highest GPA group was the one that seems to have benefited from the Mars-module. Crosstabulation showed a significant difference for Group 3 with adjusted residual with an absolute value of 2.2. Among the students who participated in the Mars-module and belonged to the GPA group 3, the expected count for students who improved their result in the post-test was 47.7; the actual number of students 52. Correspondingly, the students belonging to the highest GPA quartile from the control school were over represented in the group of students whose test score was lower in the post-test.
Table 4.
Crosstabulation showing the students divided based on grade point average (bottom 25% in Group 1, middle 50% in Group 2, and top 25% in Group 3), and whether their post-test score was same or lower than their pre-test score (0 or Neg) or higher than their pre-test score (Pos). The students who participated in the Mars module are shown in the column on the left, the students from the control school in the centre column. The table is truncated to leave out the total results of all three groups, which showed no significant results.
Table 5 shows the statistical significance of the findings concerning Group 3. The other two groups as well as the total results of all three are left out due to the lack of significant discoveries. The Chi-square value was 4.70 for the group 3 with a p-value of 0.030, concluding that there is a relationship between variables and that Mars-module may have had a positive effect on academically high-achieving students. There are no expected frequencies of under 5 and no empty cells.
Table 5.
Chi-square tests, table is truncated to show only the GPA group 3 (the top 25%). Significant p-value of 0.03 and Chi-square value of 4.7. There are no cells with expected count less than 5 and no empty cells. The table is truncated to only show group 3, as there were no significant results in its other parts.
Dividing students into groups simultaneously based on gender and GPA is not done at this point, as it leads to groups that using this method are too small for meaningful comparisons. Doing this leads to expected counts that are smaller than 5. Studying gender- and GPA- groups separately leads to a conclusion that the Mars-module may have been beneficial for girls and for academically high-achieving students. It is, of course, impossible to know what outside factors may have affected the students’ learning between the pre- and post-tests. Previous tests have also not considered how high the original level (pre-test score) was for the students who seem to have benefited from the module or for the students, who scored lower in the post-test than in the pre-test. Did the students who improved their scores in the post-test in a large number of cases have similar pre-test scores? What about the students who did not improve? Multivariate analysis of variance (MANOVA) was next applied in order to answer these questions.
In the following tables, the students have again been divided into groups based on whether they improved their score in the post-test (Pos) or not (Neg or 0). Table 6 shows that the group of students that scored lower or the same points in the post- that in the pre-test (Neg or 0) had a slightly higher average score in the pre-test (3.4 point difference; 31.7 compared to 28.3). In the post-test, the group of students who improved their scores in the post-test (Pos) also surpassed the score of the Neg or 0-group, while the Neg or 0-group’s mean score dropped close to the pre-test score of the Pos-group. These significant changes between the scored points in the pre- and post-tests for both the students who improved their score and the ones who did not are shown in a visual form in Figure 4.
Table 6.
Means and standard deviations of the pre- and post-test scores for the students who scored higher in the post- than in the pre-test, and the students, who scored lower or the same points in the post-test.
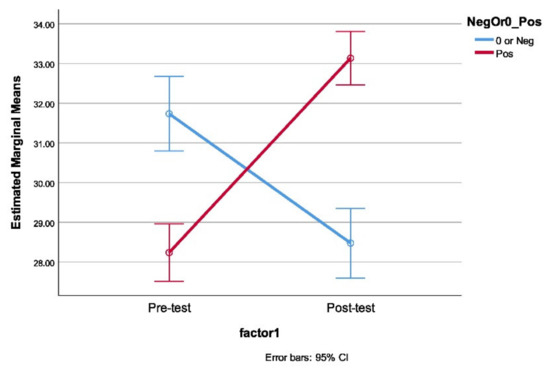
Figure 4.
Visual representation of the information in Table 6.
As the visual representation of the change between these test scores in Figure 4 already suggests, there was a statistically significant change between the pre- and post-test scores based on whether or not improvement had occurred between the scores. The p-value was approximately and the effect size 59.2%. In other words, whether the difference between a student’s post-test score and their pre-test score was positive or negative seems to predict their score in each of the tests individually. Looking at the pre- and post-test scores separately, whether this difference was positive or negative predicted the scores in a statistically significant way, with p-values of approximately and respectively and effect sizes of 8.2% and 16.0% respectively. It would appear that the students who did very well in the pre-test were more likely to lower their score in the post-test and the students with more modest pre-test scores were more likely to improve in the post-test. Ceiling effect has likely contributed to this phenomenon; the maximum number of points in both the pre- and post-tests was 45, and the students who scored the highest number of points in the pre-test had very little room for improvement. Figure 5 shows the frequencies of each score in both the pre- and post-tests.
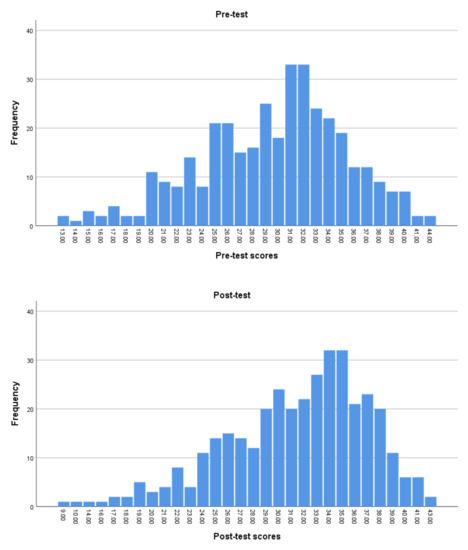
Figure 5.
Frequencies of each individual score, above in the pre-test and below in the post-test.
Gender together with whether a student improved their score or not did not have a significant effect on either the pre- or the post-test score. Both gender and whether there was improvement or not studied separately did, however, significantly affect the performance in both the pre- and post-tests. p-values for pre-test were approximately 0.020 and respectively for gender and whether there was improvement, with corresponding effect sizes of 1.5% and 7.7%. The same numbers for the post-test were 0.014 and with effect sizes of 1.7% and 16.9%.
The mean scores and standard deviations for both girls and boys for both the students who improved their score in the post-test and the students whose score either got lower or stayed the same are presented in Table 7 and did not reveal anything very unexpected. Girls scored a little bit higher than boys in both the pre- and post-tests among both the students with a positive difference between the post- and pre-test scores and the students for whom the difference was negative. The difference seems to be smaller within the group of students that improved their score in the post-test.
Table 7.
Means and standard deviations for the pre- and post-test scores of the students divided into groups based on whether they improved their score in the post-test (Pos) or not (0 or Neg) and gender.
It would seem that gender played a role in the students’ pre- and post-test scores, and that the level on which the student performed in the pre-test to some extent predicted their post-test score. Next results show whether the students’ academic performance level (based on grade point average) affected the pre- or post-test scores either separately or together with whether the student improved their score in the post-test or not.
Students have again been divided into three groups based on the grade point average of all subjects, so that in group 1 are the lowest-achieving 25%, in group 2 the 50% in the middle, and in group 3 the top 25%. This division together with whether the difference between the student’s post-test score and pre-test score was positive or negative did not have a significant effect on either one of the test scores. Studying the main effects of both variables separately reveals that both GPA and whether there was improvement in the post-test or not did, however, affect both the pre- and post-test scores. For the pre-test, the p-values were approximately and respectively for GPA and whether there was improvement in the post-test or not. The effect sizes corresponding to those values were 17.0% and 11.6%. For the post-test, the numbers in question were approximately and for p-values and 17.3% and 16.5% for effect sizes.
Table 8 shows the mean scores and standard deviations for both the pre- and post-test scores for all the six groups of students (GPA classes 1–3 as well as the students who improved in the post-test and the ones who did not). The scores in both the pre- and post-tests are in the same order for all three groups, so that group 1 on average scored the lowest and group 3 the highest (which is not very surprising). Among the students whose scores on the post-test either were lower or stayed the same, the difference between groups 1 and 3 was larger than it was with the students who improved their scores. For the students whose scores either were lower or stayed the same, the difference between groups 1 and 3 was approximately the same in both the pre- and post-tests.
Table 8.
Means and standard deviation for the pre- and post-test scores of the students divided into groups based on whether they improved their score in the post-test (Pos) or not (0 or Neg) and GPA in three classes (1: the bottom 25%, 2: the 50% in the middle, 3: the top 25%). Total number of students here is only 363, because information about GPA is missing from one student.
In terms of this article, whether the student participated in the Mars-module or was from the control school is clearly a factor the effects of which are particularly interesting. To obtain the following results the students have once again been divided into groups based on whether they improved their score in the post-test or not. The students have before further analysis also been divided into two groups based on whether they participated in the Mars-module or not. Whether the difference between the post- and the pre-test scores was positive or negative predicted both the pre-test score and the post-test score separately in a statistically significant way for both the students who participated in the Mars-module and the students from the control school. For the students who participated in the Mars module, the p-values and effect sizes relating to the improvement in the post-test or the lack of it were approximately with an effect size of 4.5% and with an effect size of 17.6% for the pre- and post-tests respectively. In the control school, whether the difference between the post- and the pre-test scores was positive or negative predicted the pre-test score even more effectively, the p-values and effect sizes for the pre- and post-tests respectively being approximately with an effect size of 23.4% and with an effect size of 11.7%. The predictions that could be made for the students’ success in the post-test were, however, more accurate for the ones who participated in the Mars-module.
Table 9 shows the mean scores and standard deviations of the pre- and post-test scores for both the students who participated in the Mars-module (top part of the table) and the ones from the control school (bottom part of the table). The scores are presented separately and in total for the students who improved their score in the post-test and the students who did not. As can be seen in Figure 6, the students from the control school seem to have a wider range of scores in the pre-test, but in the post-test the range dwindles. For the students who participated in the Mars-module the situation is the other way around based on the averages, the scores in the pre-test being close together and the difference growing in the post-test. In the post-test, the students who participated in the Mars-module appear to have scored a wider range of results than the students from the control school did, even though in the pre-test the situation was reversed. Out of the students who participated in the learning module, approximately 64.6% improved their score in the post-test. In the control school, approximately 56.7% of the students improved their score.
Table 9.
Means and standard deviations for the pre- and post-test scores of the students divided into groups based on whether they participated in the Mars-module (control = No) or were from the control school (control = Yes) and whether they improved their score in the post-test (Pos) or not (0 or Neg).
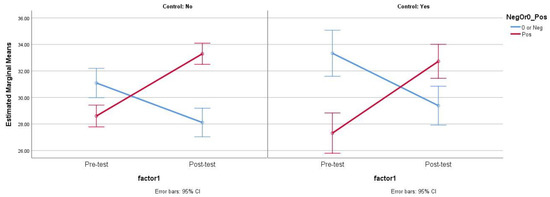
Figure 6.
Visual demonstration the information in Table 9. On the left the students who participated in the Mars-module, on the right the students from the control school.
Studying genders or academic achievement groups together with whether a student improved their score in the post-test or not for the group that participated in the Mars-module and the control group separately leads to groups that are too small for meaningful comparisons using the method of data-analysis applied here, and will hence not be done in this article.
4. Discussion
There are certain limitations to the study that ought to be considered while interpreting the results. While differences between schools in Finland are extremely small and the role socio-economic factors play is largely inconsequential [25], there were some of the schools that participated in the study very specialized and had a selective student base. The thirteen students who participated in the study from a school with science focus for example had an average GPA of 9.143 on a scale from four to ten. The mean for the grade point average of all students who participated in the research was 8.43 with a standard deviation of 0.73, meaning that the students were generally reasonably high achieving. The results of the study might have differed slightly if more students with lower GPAs were included.
The lack of standardized testing in Finland makes grade point average virtually the only possible way for measuring academic achievement. Although there are guidelines that direct teachers in their grading, can some teachers certainly be stricter in their grading than others are. As teachers are only human, it is also entirely possible that some teachers cannot entirely hinder personal preferences from affecting the grades they give. Grade point averages in this article were calculated from all subjects, as leaving out arts or other non-academic subjects would have seemed to undermine the spirit of STEAM-education. That being said, for especially children as young as the 10–12-year-olds who participated in this study, the grade in these non-academic subjects may have more to do with motivation and enthusiasm shown in class than any particular skill or talent. Both the students who participated in the Mars-module and the students from the control school on average improved their scores in the post-test. The students who participated in the STEAM learning module seem to, however, have improved more. Studying the whole population divided into groups based on whether they participated in the Mars-module or not and gender revealed that all of the groups except for the girls from the control school improved their scores significantly. Within the group of students who participated in the Mars-module, gender alone was not a factor that affected the change between the pre- and post-test scores in a statistically significant way.
The Mars-related STEAM-learning intervention of this project differed from many other interventions that have been studied in relation to STEAM-education [26,27]. The interventions have often been short, taking place during just one school day instead of over several weeks, like the intervention studied for this article. Maybe this can at least in part explain perhaps the most considerable difference in the findings of this article compared to its predecessors: academically low-achieving students have often been found to benefit from the informal learning and out-of-school education interventions [3], in this project the ones in the top 25% GPA group were the ones who improved their scores in the post-test the most. Overall, it would appear that the way science was studied within the Mars-module benefited particularly academically high-achieving students. In the control school, the high-achieving students did not improve their scores, but the students belonging to the bottom 25% GPA group did.
Gender becomes a significant factor when the pre- and post-test scores are studied strictly based on whether the student improved their score or not. Dividing the population into groups in this manner (the students who improved their score and the students who did not) shows that the Mars-module likely had an effect on the learning outcomes of girls, making girls who participated in the module over represented in the group that improved their scores. Studying only whether there was improvement or not also confirmed the result that the module was beneficial to the academically high-achieving students.
Whether a student improved their score or not also served as a factor that to some extent could predict the magnitude of their pre- and post-test scores separately. The students who scored very high points in the pre-test were more likely to get a lower score in the post-test, and the students with more modest pre-test scores were more likely to improve them in the post-test. This is most likely at least partly a result of the ceiling effect; the students who scored very high points in the pre-test simply did not have much room for improvement. This is particularly true as, since we were especially interested in finding out which students benefitted from the project, the students whose score remained the same were grouped with the students whose score got lower in the post-test. Neither gender nor academic achievement level combined with whether the students improved their score or not had a significant effect on the accuracy with which estimates about the pre- and post-test scores separately could be made.
STEAM-learning interventions that take place over a longer period of time definitely merit more research. Discovering that the academically high-achieving students in particular were the ones that benefited from the module was especially interesting, given that it differed from the findings of many previous STEAM-intervention studies. Was there something in the intervention studied for this article that confused the students who may generally struggle academically in school, or maybe something that motivated the academically high-achieving students and helped them push their limits? Based on a single intervention (long as it may have been) no conclusions can be drawn on whether it was the length of time over which it took place or some other factor that caused the differences. Of course, it is also impossible to rule out, or even keep track of, the multitude of elements that may have affected the students’ learning over the several months during which the Mars-themed learning module was organized.
Gender roles and stereotypies are developed already from early childhood with the family and peer groups [27]. For example attitudes toward further studies and career choices seem to become rather permanent already in the early teen years [28]. Thus, the goal is to spark girls’ interest in STEM disciplines starting from childhood, helping them grow more self-confident in these areas [29].
Informal learning and out-of-school education have been found to diminish gender gaps [3], and to support non-traditional career choices especially by means of extra-curriculum activities and tutorial encouragement [30]. Different types of projects [18] and interventions during past decade resulted in more equal and gender balanced outcomes both in cognitive learning, attitudes, and interest. The “art” element added to STEM seems to be essential and positive not only for girls [12] but also for boys, providing opportunities for re-framing and observing the everyday STEAM phenomena from wider, non-traditional, and gender balanced perspective [13].
This is also essential in the global reality of tricky challenges related to climate change, pandemic, and the environment. To discover sustainable solutions for these problems, all the intellectual and creative resources are needed, as several expert groups [31] and meta-studies [32] have recommended. The ambitions have expanded from simply concentrating on pure science education producing more talented researchers and technicians, to improving the scientific literacy of all the demographics of the modern society [33]. Citizen science projects have been one relevant and cost-effective approach for advancing sustainable development and awareness. For example in the media, sustainable development has often been portrayed in terms of environmental aspirations. However, it is important to note that sustainability as a concept extends beyond environmental considerations, which is increasingly recognized also by the general public. Several aspects of technology such as digitalization, Internet of Things, AI, and big data, are becoming essential in the process of producing also social innovations solving technological and ecological problems. (cf. [34]).
Repeating a similar intervention with a larger set of participants would be highly beneficial, not only to see if the results of this study could be repeated, but also to address some of the problems that were encountered while analyzing the data collected during this experiment. The relatively small number of students who answered both the pre- and post-questionnaires resulted in groups becoming too small for meaningful comparisons when the students were divided into subsets based on all of the factors we were interested in for the purposes of this article (participation in the Mars-module, gender, academic performance and whether there was improvement between the pre- and post-test scores). Because of this, some of the analysis had to be performed in parts, taking into account only some of the factors, instead of putting all the factors of interest into the same model at once. This in turn led to the significance levels and effect sizes estimated by the model varying slightly for some variables when they were tested using different models, depending on the other factors that were present in that particular model. Being able to insert all of the factors into the same model would lead to only one result per variable for each question posed. This result would also be slightly more accurate than the estimates from several different models.
STEAM-approach aims to not only help the students understand how something works, but also teach them why this information is important to them and where they can apply the acquired knowledge. When implemented properly, adding creative and artistic elements to science subjects can enable the students to understand and even experience the real world applications of the studied material and thus in many situations help bridge the gap between formal education and informal learning. In this way, STEAM can also be an effective tool in helping students develop their thinking skills.
The purpose of the Mars-module was two-fold: The first goal was to detect whether the semester-long intervention would help students learn, reason, and develop their thinking skills more effectively, while the second goal was to reveal the effects this approach to studying traditional hard sciences had on the students’ motivation, both toward school in general and toward science subjects more specifically. We were also interested in possible gender differences in both of these aspects, since it is well-known that girls and women are underrepresented in many science-related fields (e.g., [6,35]). When examining strictly whether learning occurred or not, the finding that girls seem to have benefitted more from the module is interesting, especially as this gender difference disappeared when also the magnitude of said learning was considered. There are many possible reasons for this. It is likely that the girls’ slightly higher scores in the pre-test have contributed to this, as there was less room for improvement. It can also be speculated that the girls, who are often stereotypically believed to be more hardworking and conscientious than boys, have during the module studied because they felt that was expected of them, but that they perhaps did not get excited in the same way some of the boys who improved their test scores considerably did.
Many projects have made an effort to motivate and encourage girls and to raise their self-efficacy beliefs in relation to STEM-subjects (e.g., [6,29,36]). Informal learning environments seem to diminish gender differences both in motivation and in cognitive learning. Of course, certain contents and contexts of the museums or science centre exhibitions might favor boys [6]—or girls [37]—but some meta-articles [38] underline the overall gender-balancing role of out-of-school education and informal learning [3].
In this light, in order to promote gender equity [39] as well as to be more accurately able to reach all the different demographics [40], it is especially important to gather more information about the types of interventions that seem to benefit different types of students. This article focused on trying to study this problem from the point of view of learning outcomes, while the motivation aspect of the same project will be tackled in another article.
Author Contributions
Conceptualization, E.P., H.S., and H.T.; methodology, E.P., H.T., and H.S.; software, H.S. and E.P.; validation, H.T. and E.P.; formal analysis, E.P. and H.T. and H.S.; investigation, E.P.; resources, H.S.; data curation, E.P.; writing—original draft preparation, E.P.; H.S., H.T.; writing—review and editing, E.P., H.T., H.S.; visualization, H.T. and E.P.; supervision, H.S.; project administration, H.S. and E.P.; funding acquisition, H.S. All authors have read and agreed to the published version of the manuscript.
Funding
This work was supported by European Union: [Grant Number 731872].
Institutional Review Board Statement
This study was administrated and reported according to permanent guidelines set by University of Helsinki and General Data Protection Regulation, GDPR, by European Commission, and thus did not require additional Ethical Commission approval.
Informed Consent Statement
Informed consent was obtained from all subjects involved in the study.
Data Availability Statement
Data available upon request.
Conflicts of Interest
The authors declare no conflict of interest.
References
- Salmi, H. Science centres as learning laboratories: Experiences of Heureka, the Finnish Science Centre. Int. J. Technol. Manag. 2003, 25, 460. [Google Scholar] [CrossRef]
- Alberts, B. Making a Science of Education. Science 2009, 323, 15. [Google Scholar] [CrossRef]
- Rennie, L. Learning Science Outside of School. In Handbook of Research on Science Education; Lederman, N., Abell, S., Eds.; Routledge: New York, NY, USA, 2014; Volume II, pp. 120–144. [Google Scholar]
- STORIES. Stories of Tomorrow. Students’ Visions of the Future Space Exploration. Horizon 2020 EU-Programme. Available online: http://www.storiesoftomorrow.eu/ (accessed on 18 June 2020).
- Otto, S.; Körner, F.; Marschke, B.A.; Merten, M.J.; Brandt, S.; Sotiriou, S.; Bogner, F. Deeper learning as integrated knowledge and fascination for Science. Int. J. Sci. Educ. 2020, 42, 807–834. [Google Scholar] [CrossRef]
- López-Iñesta, E.; Botella, C.; Rueda, S.; Forte, A.; Marzal, P. Towards Breaking the Gender Gap in Science, Technology, Engineering and Mathematics. IEEE Rev. Iberoam. Tecnol. Aprendiz. 2020, 15, 233–241. [Google Scholar] [CrossRef]
- Arieli, B. The Integration of Creative Drama into Science Teaching. Ph.D. Thesis, Kansas State University, Manhattan, KS, USA, 2007. [Google Scholar]
- Sriraman, B. Are Giftedness and Creativity Synonyms in Mathematics? J. Second. Gift. Educ. 2005, 17, 20–36. [Google Scholar] [CrossRef]
- Dewey, J. Art as Experience; Capricorn Books: New York, NY, USA, 1934. [Google Scholar]
- Mack, A. A deweyan perspective to aesthetic in mathematics education. Philos. Math. Educ. J. 2006, 19, 27–42. [Google Scholar]
- Pugh, K.; Girod, M. Science, Art, and Experience: Constructing a Science Pedagogy from Dewey’s Aesthetics. J. Sci. Teach. Educ. 2007, 18, 9–27. [Google Scholar] [CrossRef]
- Colucci-Gray, L.; Burnard, P.; Cooke, C.; Davies, R.; Trowsdale, J. (Eds.) Reviewing the Potential and Challenges of Developing STEAM Education through Creative Pedagogies for 21st Learning: How Can School Curricula Be Broadened towards a More Responsive, Dynamic, and Inclusive Form of Education? BERA-Report; The British Educational Research Association: London, UK, 2017. [Google Scholar]
- KOFAC. The Korea Foundation for the Advancement of Science and Creativity–KOFAC, Seoul 2017. Available online: https://steam.kofac.re.kr/?page_id=11269# (accessed on 2 December 2019).
- McCarthy, C.B. Effects of thematic-based, hands-on science teaching versus a textbook approach for students with disabilities. J. Res. Sci. Teach. 2005, 42, 245–263. [Google Scholar] [CrossRef]
- Bassachs, M.; Cañabate, D.; Nogué, L.; Serra, T.; Bubnys, R.; Colomer, J. Fostering Critical Reflection in Primary Education through STEAM Approaches. Educ. Sci. 2020, 10, 384. [Google Scholar] [CrossRef]
- Jesionkowska, J.; Wild, F.; Deval, Y. Active Learning Augmented Reality for STEAM Education—A Case Study. Educ. Sci. 2020, 10, 198. [Google Scholar] [CrossRef]
- How, M.-L.; Hung, W.L.D. Educing AI-Thinking in Science, Technology, Engineering, Arts, and Mathematics (STEAM) Education. Educ. Sci. 2019, 9, 184. [Google Scholar] [CrossRef]
- Conradty, C.; Sotiriou, S.A.; Bogner, F.X. How Creativity in STEAM Modules Intervenes with Self-Efficacy and Motivation. Educ. Sci. 2020, 10, 70. [Google Scholar] [CrossRef]
- Harris, P. Delving into Uncle Albert’s cabinet: Further thoughts on the pretence-reality distinction. Dev. Sci. 2002, 5, 419–421. [Google Scholar] [CrossRef]
- Michalsky, T.; Mevarech, Z.; Haibi, L. Elementary school children reading scientific texts: Effects of metacognitive instruction. J. Educ. Res. 2009, 102, 363–376. [Google Scholar] [CrossRef]
- FNCC. National Core Curriculum for Basic Education 2014; Finnish National Board of Education: Helsinki, Finland, 2014. [Google Scholar]
- Catterall, J.S. Conversation and Silence. Transfer of Learning through the Arts. J. Learn. Through Arts 2005, 1. Available online: http://escholarship.org/uc/item/6fk8t8xp (accessed on 22 January 2020). [CrossRef]
- Piaget, J. Cognitive Development in Children: Piaget–Development and Learning. J. Res. Sci. Teach. 1964, 2, 176–186. [Google Scholar] [CrossRef]
- Piaget, J. Reason. New Ideas Psychol. 2006, 24, 1–29. [Google Scholar] [CrossRef]
- OECD. PISA 2015 Results (Volume I): Excellence and Equity in Education; OECD Publishing: Paris, France, 2016. [Google Scholar] [CrossRef]
- Salmi, H.; Vainikainen, M.; Thuneberg, H. Mathematical thinking skills, self-concept and learning outcomes of 12-yearolds visiting a mathematics science centre exhibition in Latvia and Sweden. J. Sci. Commun. 2015, 14, 1–19. [Google Scholar] [CrossRef][Green Version]
- Ainley, M.; Hillman, K.; Hidi, S. Gender and interest processes in response to literary texts: Situational and individual interest. Learn. Instr. 2002, 12, 411–428. [Google Scholar] [CrossRef]
- Eccles, J. Gendered educational and occupational choices: Applying the Eccles et al. model of achievement-related choices. Int. J. Behav. Dev. 2011, 35, 195–201. [Google Scholar] [CrossRef]
- Benavent, X.; de Ves, E.; Forte, A.; Botella-Mascarell, C.; López-Iñesta, E.; Rueda, S.; Roger, S.; Perez, J.; Portalés, C.; Dura, E.; et al. Girls4STEM: Gender Diversity in STEM for a Sustainable Future. Sustainability 2020, 12, 6051. [Google Scholar] [CrossRef]
- Wang, M.-T. Educational and career interests in math: A longitudinal examination of the links between classroom environment, motivational beliefs, and interests. Dev. Psychol. 2012, 48, 1643–1657. [Google Scholar] [CrossRef] [PubMed]
- Rochard, M.; Csermely, P.; Jorde, D.; Lenzen, D.; Walwerg-Heriksson, H.; Hemmo, V. (Eds.) Science Education Now: A New Pedagogy for the Future of Europe; Rochard-report. Report for the European Commission; 2007; Available online: https://ec.europa.eu/research/science-society/document_library/pdf_06/report-rocard-on-science-education_en.pdf (accessed on 22 May 2020).
- Osborne, J.F.; Dillon, J. Science Education in Europe; Nuffield Foundation: London, UK, 2008. [Google Scholar]
- Coombs, P. The World Crisis in Education. The View from the Eighties; Oxford University Press: Oxford, UK, 1985. [Google Scholar]
- Queiruga-Dios, M.Á.; López-Iñesta, E.; Diez-Ojeda, M.; Sáiz-Manzanares, M.C.; Vázquez Dorrío, J.B. Citizen Science for Scientific Literacy and the Attainment of Sustainable Development Goals in Formal Education. Sustainability 2020, 12, 4283. [Google Scholar] [CrossRef]
- Blau, J. Science still not a “girl thing” in Europe. Res. Technol. Manag. 2012, 55, 9–10. Available online: https://search.proquest.com/docview/1247870050?accountid=11365 (accessed on 4 March 2020).
- Dubetz, T.A.; Wilson, J.A. Girls in Engineering, Mathematics and Science, GEMS: A Science outreach program for middle-school female students. J. STEM Educ. Innov. Res. 2013, 14, 41–47. [Google Scholar]
- Goldschmidt, M.; Bogner, F. Learning about Genetic Engineering in an Outreach Laboratory: Influence of Motivation and Gender on Students’ Cognitive Achievement. Int. J. Sci. Educ. Part B 2015, 6, 166–187. [Google Scholar] [CrossRef]
- Salmi, H. Augmented Reality in Education: EDEN-2011 Open Classroom Conference: Proceedings of the “Science Center to Go” Workshops; Ellinogermaniki Agogi: Athens, Greece, 2012; Available online: http://www.sctg.eu/materials/sctgo_proceedings_low.pdf (accessed on 15 December 2020).
- EU. Directorate-General for Research and Innovation (European Commission); Helsinki Group on Gender in Research and Innovation. Guidance to Facilitate the Implementation of Targets to Promote Gender Equality in Research and Innovation. 2018. Available online: https://ec.europa.eu/research/swafs/pdf/pub_gender_equality/KI-07-17-199-EN-N.pdf (accessed on 7 January 2021).
- UNESCO. Cracking the Code: Girls’ and Womens’ Education in Science, Technology, Engineering and Mathematics (STEM). 2017. Available online: http://unesdoc.unesco.org/images/0025/002534/253479e.pdf (accessed on 7 January 2021).
Publisher’s Note: MDPI stays neutral with regard to jurisdictional claims in published maps and institutional affiliations. |
© 2021 by the authors. Licensee MDPI, Basel, Switzerland. This article is an open access article distributed under the terms and conditions of the Creative Commons Attribution (CC BY) license (http://creativecommons.org/licenses/by/4.0/).