Article

Revealing Impact Factors on Student Engagement: Learning Analytics Adoption in Online and Blended Courses in Higher Education

1
School of Education, University of Tasmania, Launceston, TAS 7248, Australia
2
School of Information and Communication Technology, University of Tasmania, Hobart, TAS 7001, Australia
3
Tasmanian Institute of Learning and Teaching, University of Tasmania, Hobart, TAS 7001, Australia
4
Department of Computing, Hong Kong Polytechnic University, Hong Kong, China
5
School of Humanities, University of Tasmania, Launceston, TAS 7248, Australia
*
Author to whom correspondence should be addressed.
Educ. Sci. 2021, 11(10), 608; https://doi.org/10.3390/educsci11100608
Submission received: 30 August 2021 / Revised: 22 September 2021 / Accepted: 24 September 2021 / Published: 2 October 2021
(This article belongs to the Special Issue Student Preferences and Satisfaction: Measurement and Optimization)

Abstract

:
This study aimed to identify factors influencing student engagement in online and blended courses at one Australian regional university. It applied a data science approach to learning and teaching data gathered from the learning management system used at this university. Data were collected and analysed from 23 subjects, spanning over 5500 student enrolments and 406 lecturer and tutor roles, over a five-year period. Based on a theoretical framework adapted from Community of Inquiry (CoI) framework by Garrison et al. (2000), the data were segregated into three groups for analysis: Student Engagement, Course Content and Teacher Input. The data analysis revealed a positive correlation between Student Engagement and Teacher Input, and interestingly, a negative correlation between Student Engagement and Course Content when a certain threshold was exceeded. The findings of the study offer useful suggestions for future course design, and pedagogical approaches teachers can adopt to foster student engagement.

1. Introduction

The past decade has seen a rapid growth in online learning offerings, especially in higher education. The COVID-19 pandemic has pushed learning and teaching further into the online space, even amongst the most traditional universities. While online learning has demonstrated its potential in attracting students and in meeting their learning needs, student engagement and retention has long been a challenge for universities [1]. Research also highlights the need to investigate factors that hinder student engagement and lead to attrition [2]. This study aims to form a preliminary understanding of the factors affecting student engagement, using data collected from online and blended courses at one Australian regional university. This paper applies a data science approach to data sets gathered from the learning management system (LMS) adopted at this university. This research was conducted with the assumption that LMSs offer rich learning and teaching data which can reveal hidden patterns of student behaviour and engagement. Careful statistical analysis of this data can help identify factors that help foster student engagement and retention, and thereby to provide alerts on student disengagement and attrition, allowing early intervention.

2. Background

2.1. Learning Analytics—Definition and Application in Higher Education

Learning analytics have seen increased adoption in recent years. In this research, we adopt the most commonly-cited definition of learning analytics proposed by Siemens (2010, cited in [3]): “the measurement, collection, analysis and reporting of data about learners and their contexts, for purposes of understanding and optimising learning and the environments in which it occurs” (p. 1). Learning analytics is being increasingly used by educational institutions to build predictive models on student outcomes, to identify at-risk students, and to flag early warnings and need for interventions [4,5]. This present research is such an exploration built on this recognition.
Learning analytics adoptions appear in different forms. Ferguson and Shum [6] proposed the concept of social learning analytics, which identified learning as a knowledge building process that occurs in a social and cultural setting. This concept provides a good summary of the five learning analytics techniques commonly used: (1) social networks: relationships of the networked individuals and the strength of those relationships; (2) discourses: revealing quality of students’ dialogue and knowledge construction through their language use and interactions; (3) content: tracking learner progress through student-generated hashtag and categorising hashtag resources for each student; (4) dispositions: using self-reporting tools to reveal students’ dispositions to their learning; and (5) contexts: identifying relevant information for the context in which the student is constructing knowledge. Points Three and Five can also be seen in Swenson [7]. All these techniques can be observed in later learning analytic research conducted in the context of higher education in Australia (for example, see [5,8]).
Applications of learning analytics have demonstrated positive outcomes in higher education contexts. One widely recognised benefit is they enable educational institutions to build models to predict students’ learning outcomes, especially to identify at-risk students and to provide early warning so that interventions can be made [9]. For instance, learning analytics has been employed in the University of Alabama in the U.S. to improve student retention in the first and second years of their programs [10]. Australian universities are using learning analytics technics to support student engagement and retention, for instance, through exploration of help-seeking learner profiles [11], or using early alert systems to identify potential student dropouts [5]. There is also research that combines longitudinal data about learners and their learning from various sources to predict areas where these learners are likely to be unsuccessful [4]. In addition to prediction of student performance, learning analytics has demonstrated its ability to identify learners’ individual needs and learning difficulties, which could inform flexible educational frameworks with customised instructions for individual students [12]. When used appropriately, learning analytics could lead to increased accountability at all levels of education [13].
In higher education, one major source of data is the LMSs. Recent increased adoption and functionalities of LMSs have led to increased availability of learning and teaching data. These institution-wide systems make available aggregated and heterogeneous datasets, along with the ability to reveal hidden threads, trends and patterns through tracking information flow [14]. Universities see the potential for these data to provide insights regarding student experiences, interests, expectations and evaluation. In 2012 and 2013, the Office of Learning and Teaching funded a seed grant and two strategic commissioned projects focusing on the potential and challenges associated with learning analytics adoption in higher education [15,16,17]. Colvin et al. [15] described learning analytics research as a potential “game changer”, and highlighted its potential to address core education challenges, including student retention, academic performance, and learning and teaching quality. Their project report, however, also revealed the need for a greater understanding of this research field, and for the extension of capacity-building initiatives within universities [15]. This research was, therefore, designed in response to this call.

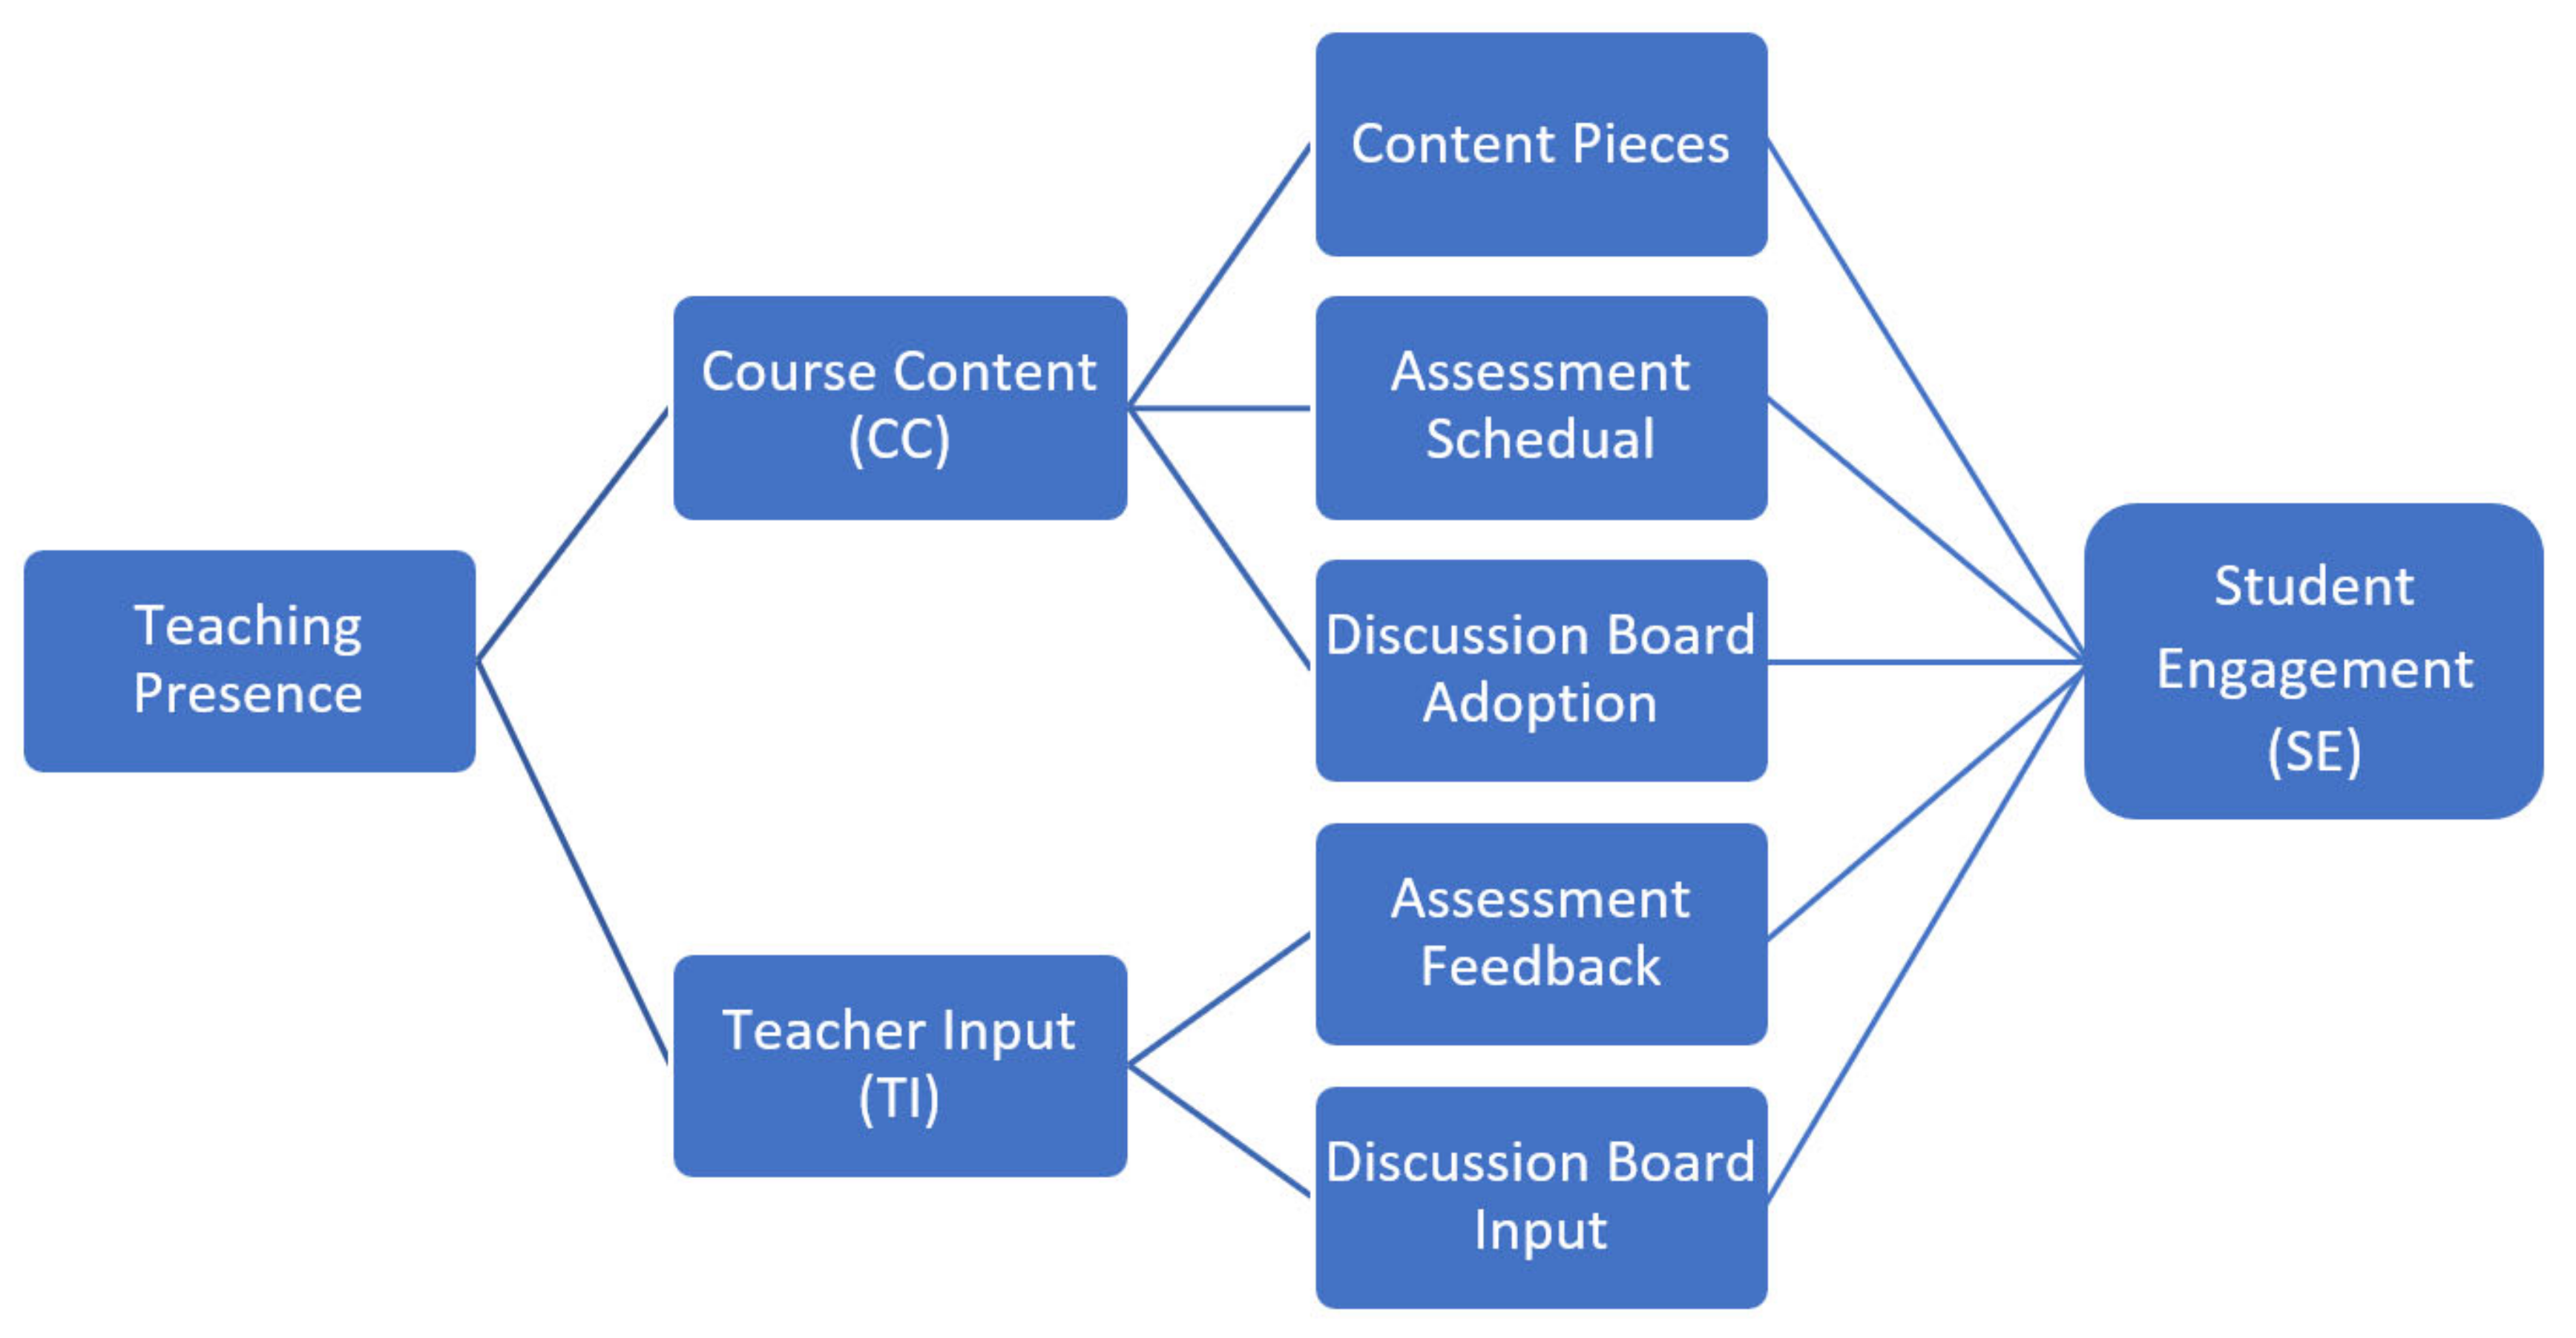
2.2. Conceptual Framework Based on the Community of Inquiry (CoI) framework

This study uses a conceptual framework based on the Community of Inquiry (CoI) framework by Garrison, Anderson, and Archer [18]. This is an established and comprehensive theoretical framework relevant to online learning contexts [18]. We have chosen to base the conceptual framework on this theory for its suitability in decoding and understanding the LMS data collected, and in revealing student engagement patterns and its influencers using these data sets.
The framework explains the interactions among three distinct types of presence that are critical to positive learning experiences: cognitive, social and teaching presence. Cognitive presence represents the ability of the learner to construct meaning through sustained communication in the online learning environment. Social presence refers to the learner’s ability to project their personal characteristics into the online community and present themselves to other members as a real person. Teaching presence consists of the design and facilitation of the learning experience. These three elements are described as the “crucial prerequisites” for successful learning in higher education [18] (p. 87).
This project is particularly interested in the third type: teaching presence, and how the lecturers’ and tutors’ teaching presence are influencing student engagement in the subjects taught. Existing literature suggests that key functions in this domain include design of the educational experience and the facilitation to support student learning [18]. Based on this conceptual idea and the data available in this project, we have labelled these two functions as Course Content (CC) and Teacher Input (TI). We looked for correlations between factors in these categories, and factors that indicate Student Engagement (SE). The conceptual framework developed based on the Community of Inquiry (CoI) framework is presented in Figure 1. Overall, the project sought to answer the following two research questions:
  • How is Course Content (CC) design influencing Student Engagement (SE) in online and blended subjects at the target university?
  • How is Teacher Input (TI) influencing Student Engagement (SE) in the chosen online and blended subjects?

3. Material and Methods

3.1. Data Collection and Participants

This research was conducted at one Australian regional university. The data collection used purposive sampling. The university was purposefully selected due to its large student population in online and blended courses. In 2019, this university had over 30,000 students, with majority (over half) of these students studying some parts of their courses in blended and/or online modes. The central LMS is adopted across different disciplines at this university.
Invitation to participate in this study was sent to subject coordinators in four disciplines. It was considered important to include data at different levels and disciplines, therefore, the participants in this study also included subjects at undergraduate and postgraduate levels, from both pure (education and humanities) and applied disciplines (engineering, information and communications technology (ICT), and natural sciences) (see Table 1). Responses were received from coordinators from 23 online and blended subjects. These subjects had varying degrees of online involvement, ranging from pure online units, within which all learning materials and communication are delivered or conducted online through the LMS, to blended subjects that deliver materials online but with face-to-face communication retained as the dominant teaching method. In this way, the data obtained could capture the commonalities and distinctiveness of these various online courses.
The data sets covered over 5500 student enrolments and 406 lecturer and tutor roles. In cases where the same student, lecturer or tutor is involved in multiple subjects or deliveries, they were counted as separate enrolments or roles. All the included subjects were delivered three to five times during the data collection period (five years), as any subjects delivered only once or twice were not included in the data sets for analysis. This was considered important as the research team hoped to see trends in delivery patterns in the subjects.

3.2. Data Preparation

Once the data sets were collected, they were prepared for analysis. There were three steps for the data preparation. As the first step of this preparation, the data were grouped into three subsets according to the conceptual framework adapted from the Community of Inquiry (CoI) framework (Figure 1). These are explained below:
  • Course Content (CC): This subset refers to the data around subject design. This data set included items such as subject names, semesters of delivery, numbers of content pieces, numbers of tasks required of students, numbers of assignments (dropboxes), and numbers of tasks in the discussion board.
  • Teacher Input (TI): This subset refers to the data set around lecturer and tutor involvement. This data set included items such as numbers of content pieces visited by the teacher(s), number of comments on student assignments, numbers of assignments graded, numbers of logins to the LMS, and numbers of discussion posts authored.
  • Student Engagement (SE): This subset refers to the data set around student engagement. This data set included items such as numbers of content pieces read, time spent on each item of content material, numbers of assignments submitted in dropboxes, numbers of quizzes completed, numbers of logins to the LMS, and numbers of discussion posts created, replied to and read.
As the second step of the preparation, the data sets were converted into features that are comparable. There were two types of features: number counts and rates. For the number counts type, an example is a feature “Number of Content”, which refers to the number of content pieces per subject per semester. For the rates type, an example is a feature “Content Visit Rate”. This is calculated by the number of content pieces visited/number of content pieces. The actual features used in the different stages of data analysis are explained in the data analysis section.
As the third step of the preparation, the data sets were cleaned to remove any anomalies in data that might have caused ambiguity in the findings. There were four such anomalies identified in the data sets:
‘Content Complete Rate’ feature in Student Engagement subset: This feature indicates the proportion of content a student completed within the content required. It is computed using (Number of content pieces completed/Number of contents required to be completed). It was noticed that the ‘Content Complete Rate’ for some students in some subjects was more than 1. This could be caused by the total number of content pieces being greater than the number of content pieces required, as there are optional content as additional resources provided to students. An example of this is shown in Figure 2. To handle such outliers, we set their ‘Content Complete Rate’ as 1.
‘Dropbox Submission Rate’ feature in Student Engagement subset: This is computed using (Number of dropbox submissions/Number of dropboxes). Since there were some students who submitted their assignments into the dropbox more than once for a particular assignment, leading to their Dropbox Submission Rate being over 1, we set their dropbox submission rate to 1.
‘Time in Content’ feature in Student Engagement subset: This indicates the amount of time students spent in studying the content in a subject. While observing the values of the ‘time in content’ feature, there were few values that were much higher. For example, in Subject 10 in one of the semesters, the time spent by three students was about eight times higher than other students in the unit (see Figure 3). The reason of this is unknown. Although, since the LMS logs users out after they have been unactive for a period of time, the time in content does not include idle time, which is a commonly seen noise in learning analytics [19]. In such cases, algorithms (in this case modified Z-Scores) were applied to remove the outliers.
‘Number of Logins’ feature in Student Engagement subset: This illustrates how many times a student logged into the LMS for a subject. This number varies for different students in the subject. To compare student engagement for a subject in different offerings, a median value of all the students’ login counts for each unit is utilised for analysis.

3.3. Data Analysis

After the data preparation, data analysis was performed following a two-stage approach.
Stage 1 involved descriptive analysis, which focused particularly on the impact of changes made by the teaching team to the subjects over time. Some individual subjects, for example, were offered in different study periods/semesters through the data collection period. Since any changes in subject delivery might have an impact on students’ learning and engagement, it is important to understand how the data changed across these different timings of delivery.
Stage 2 involved the identification of correlations between the three data subsets, in particular, relationships between Student Engagement (SE) and the other two factors: Course Content (CC) and Teacher Input (TI).

4. Results and Findings

The section will first introduce results from the first stage of data analysis, which involves mainly the descriptive analysis of data from the three data subsets: Course Content (CC), Teacher Input (TI), and Student Engagement (SE). This part will introduce patterns discovered from data in the different subjects involved that are related to these three factors. It will then discuss results emerging from the second stage of data analysis, which reveals correlations between the three data subsets.

4.1. Results from Stage 1: Descriptive Analysis

4.1.1. Observation of Course Content (CC) Design Per Subject over Time

We examined factors related to course content design for each of the subjects, including: the number of content topics, assignments submitted and the number of discussion posts in the discussion board. Examples of key features used are presented in Table 2.
As an example, the observations on Subject 4 are shown in Figure 4. Data collected from this online subject included its delivery during a five-year period, once per year.
Figure 4 shows that in Subject 4 the number of content materials kept increasing for the first four years, peaked in Year 4 and then decreased slightly in Year 5. At the same time, the number of grade items or the assignment did not follow the same trend. One factor that could have contributed to the significant increase in content topics is that the subject changed from a nine-week subject in Years 1–3 to a 12-week subject in Years 4 and 5. In addition, and interestingly, the number of discussion posts followed a reverse trend over time, that is, the numbers of posts increased from Year 1 to Year 2, and then decreased gradually from Year 2 to Year 5. This trend was consistent with the overall decrease in the number of enrolments in this subject over the observed period.
Overall, data related to course content from each subject were examined, with underlying reasons for the changes discussed within the research team. After all the 23 subjects had been examined, the research team identified the following trends which were shared across multiple subjects:
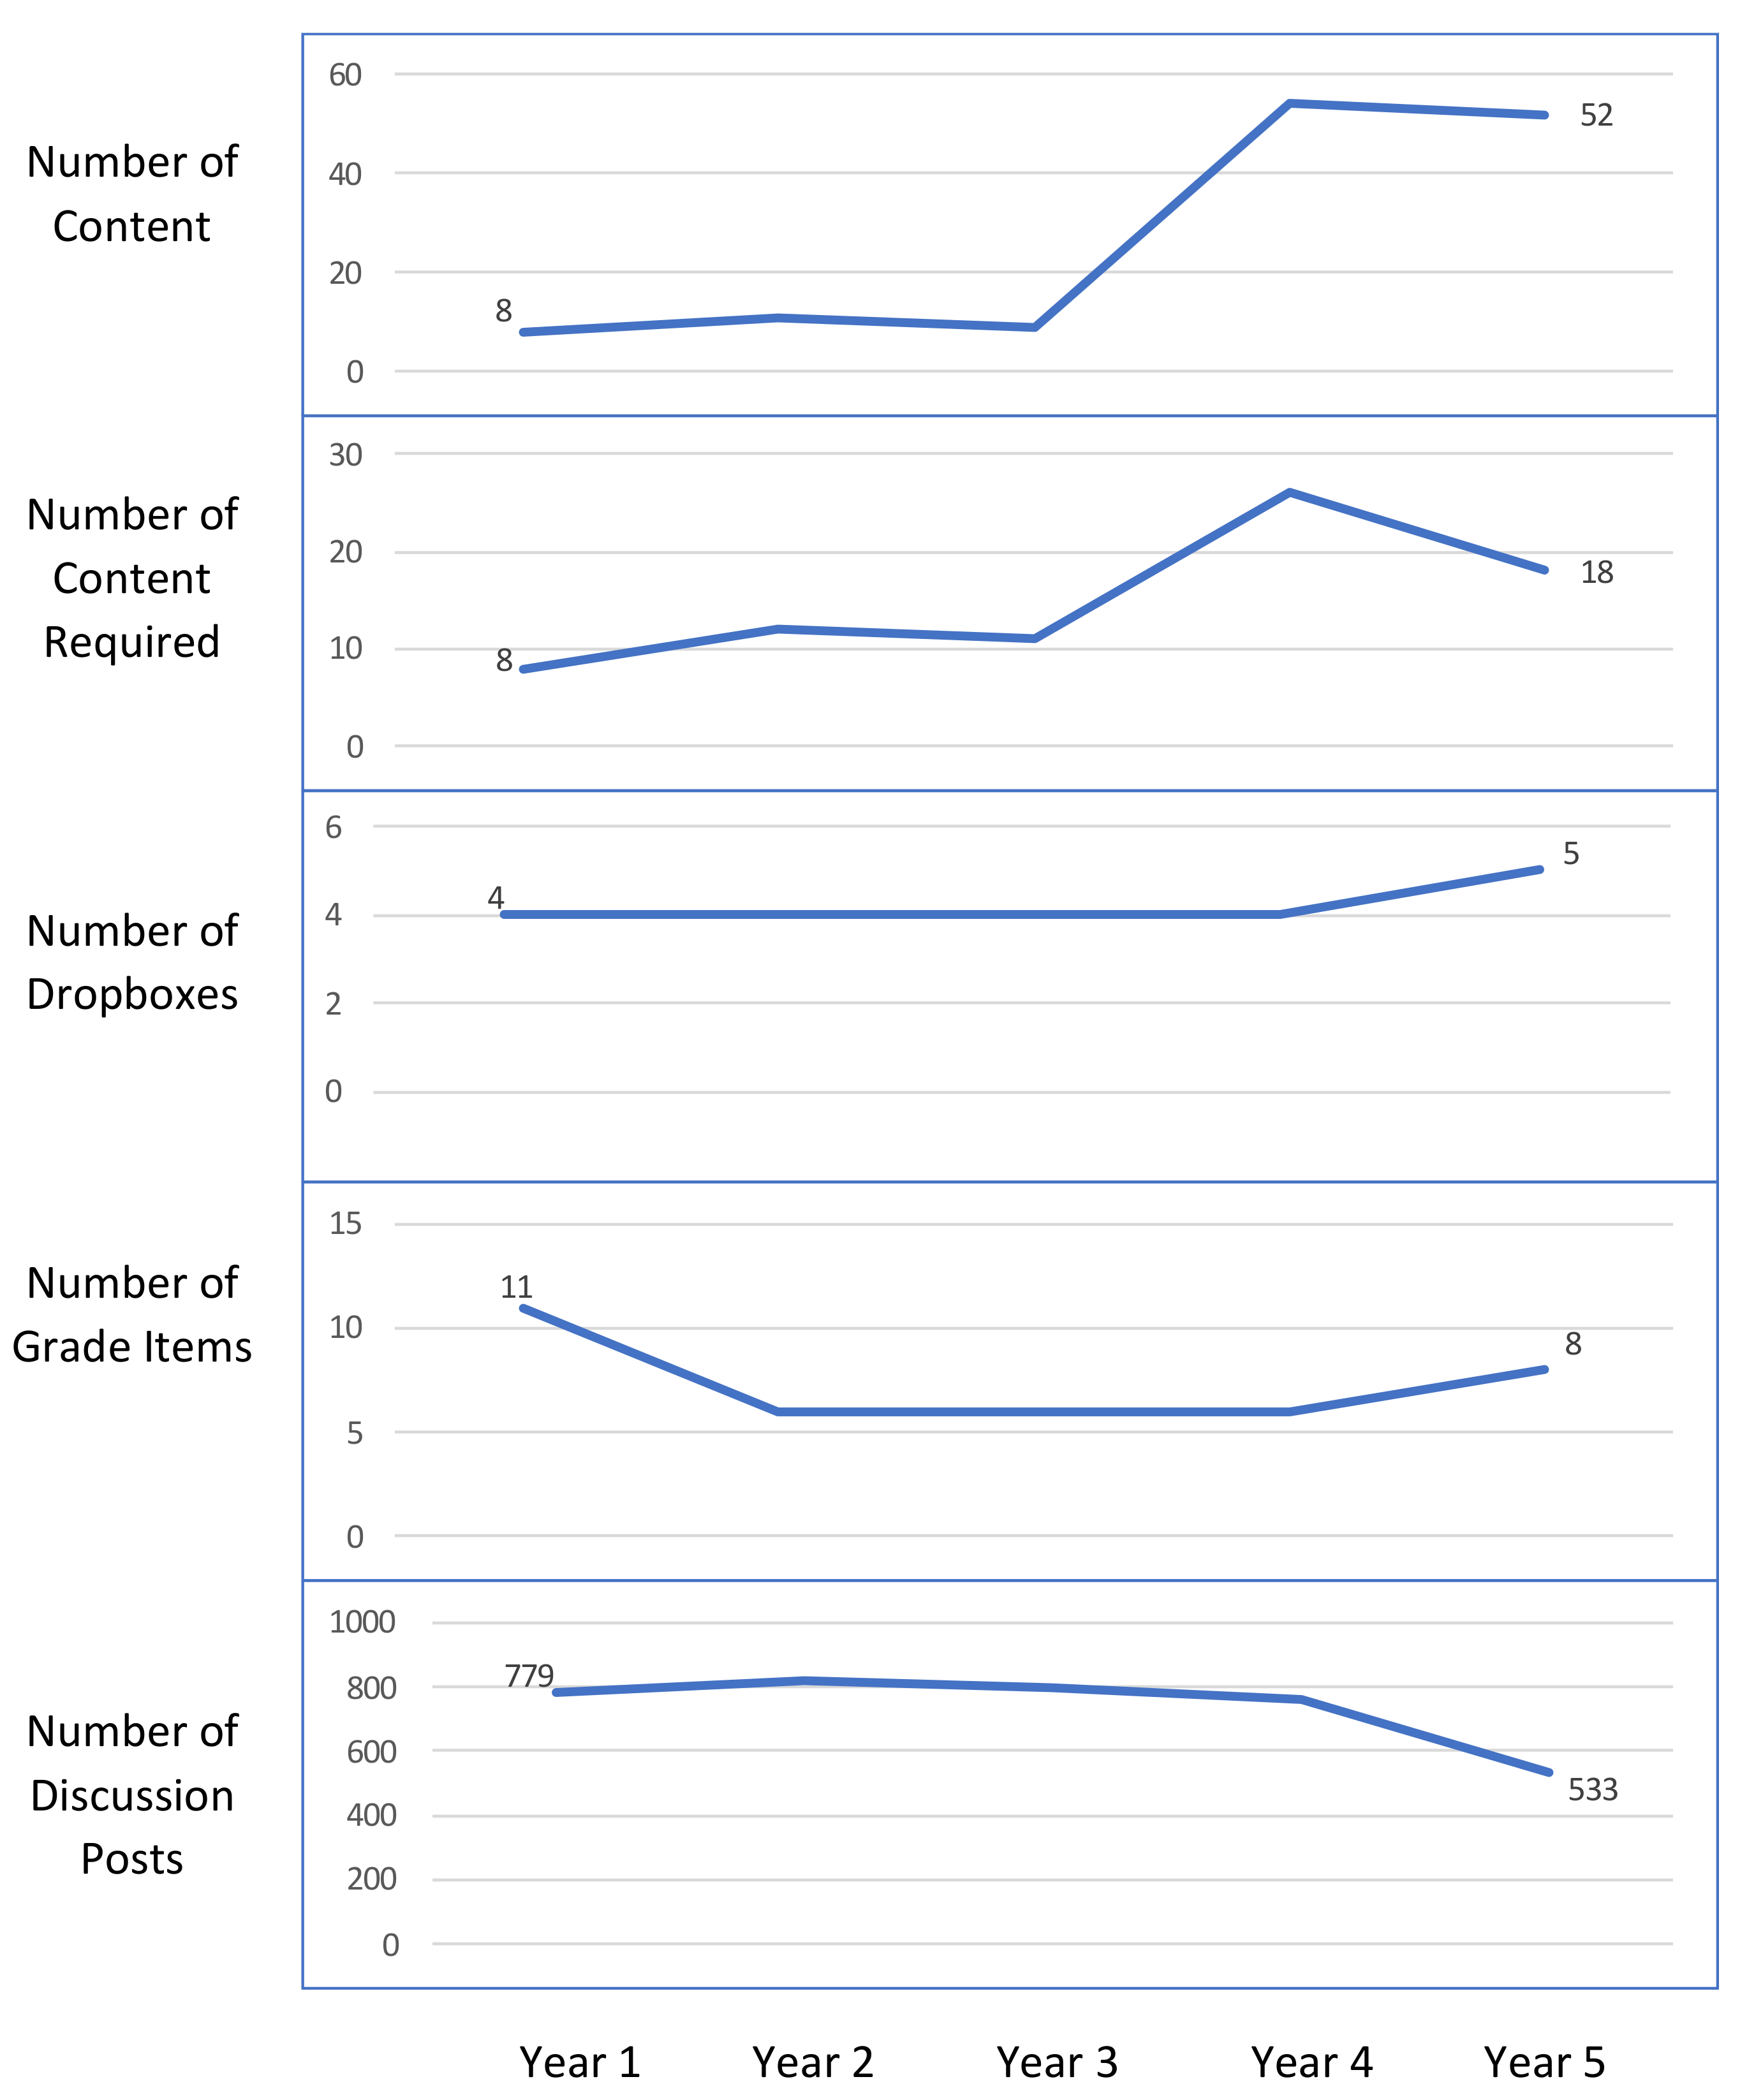
  • Over half of the subjects (n = 14, 61%) continuously increased the number of course content items over time. This indicates a constant updating of the content for most of the subjects.
  • Only a few subjects (n = 9, 39%) continuously increased the number of assignments over time, while 10 subjects (40%) kept the number of assignments at the same level over the years of delivery. It is important to note that the number of assignments is calculated using the numbers of dropboxes, so it does not include assessments that may have been conducted using other means, such as paper-based submissions or in-class tests.
  • A similar trend is observed in the number of grade items, where 10 subjects (40%) increased the number of grade items over the years and 10 subjects (40%) kept grade items at the same level over the years.
Overall, there was no clear correlation observed between course content pieces and assignments/grade items across the subjects. We will discuss the correlation between course content pieces and discussion posts in the following sections.

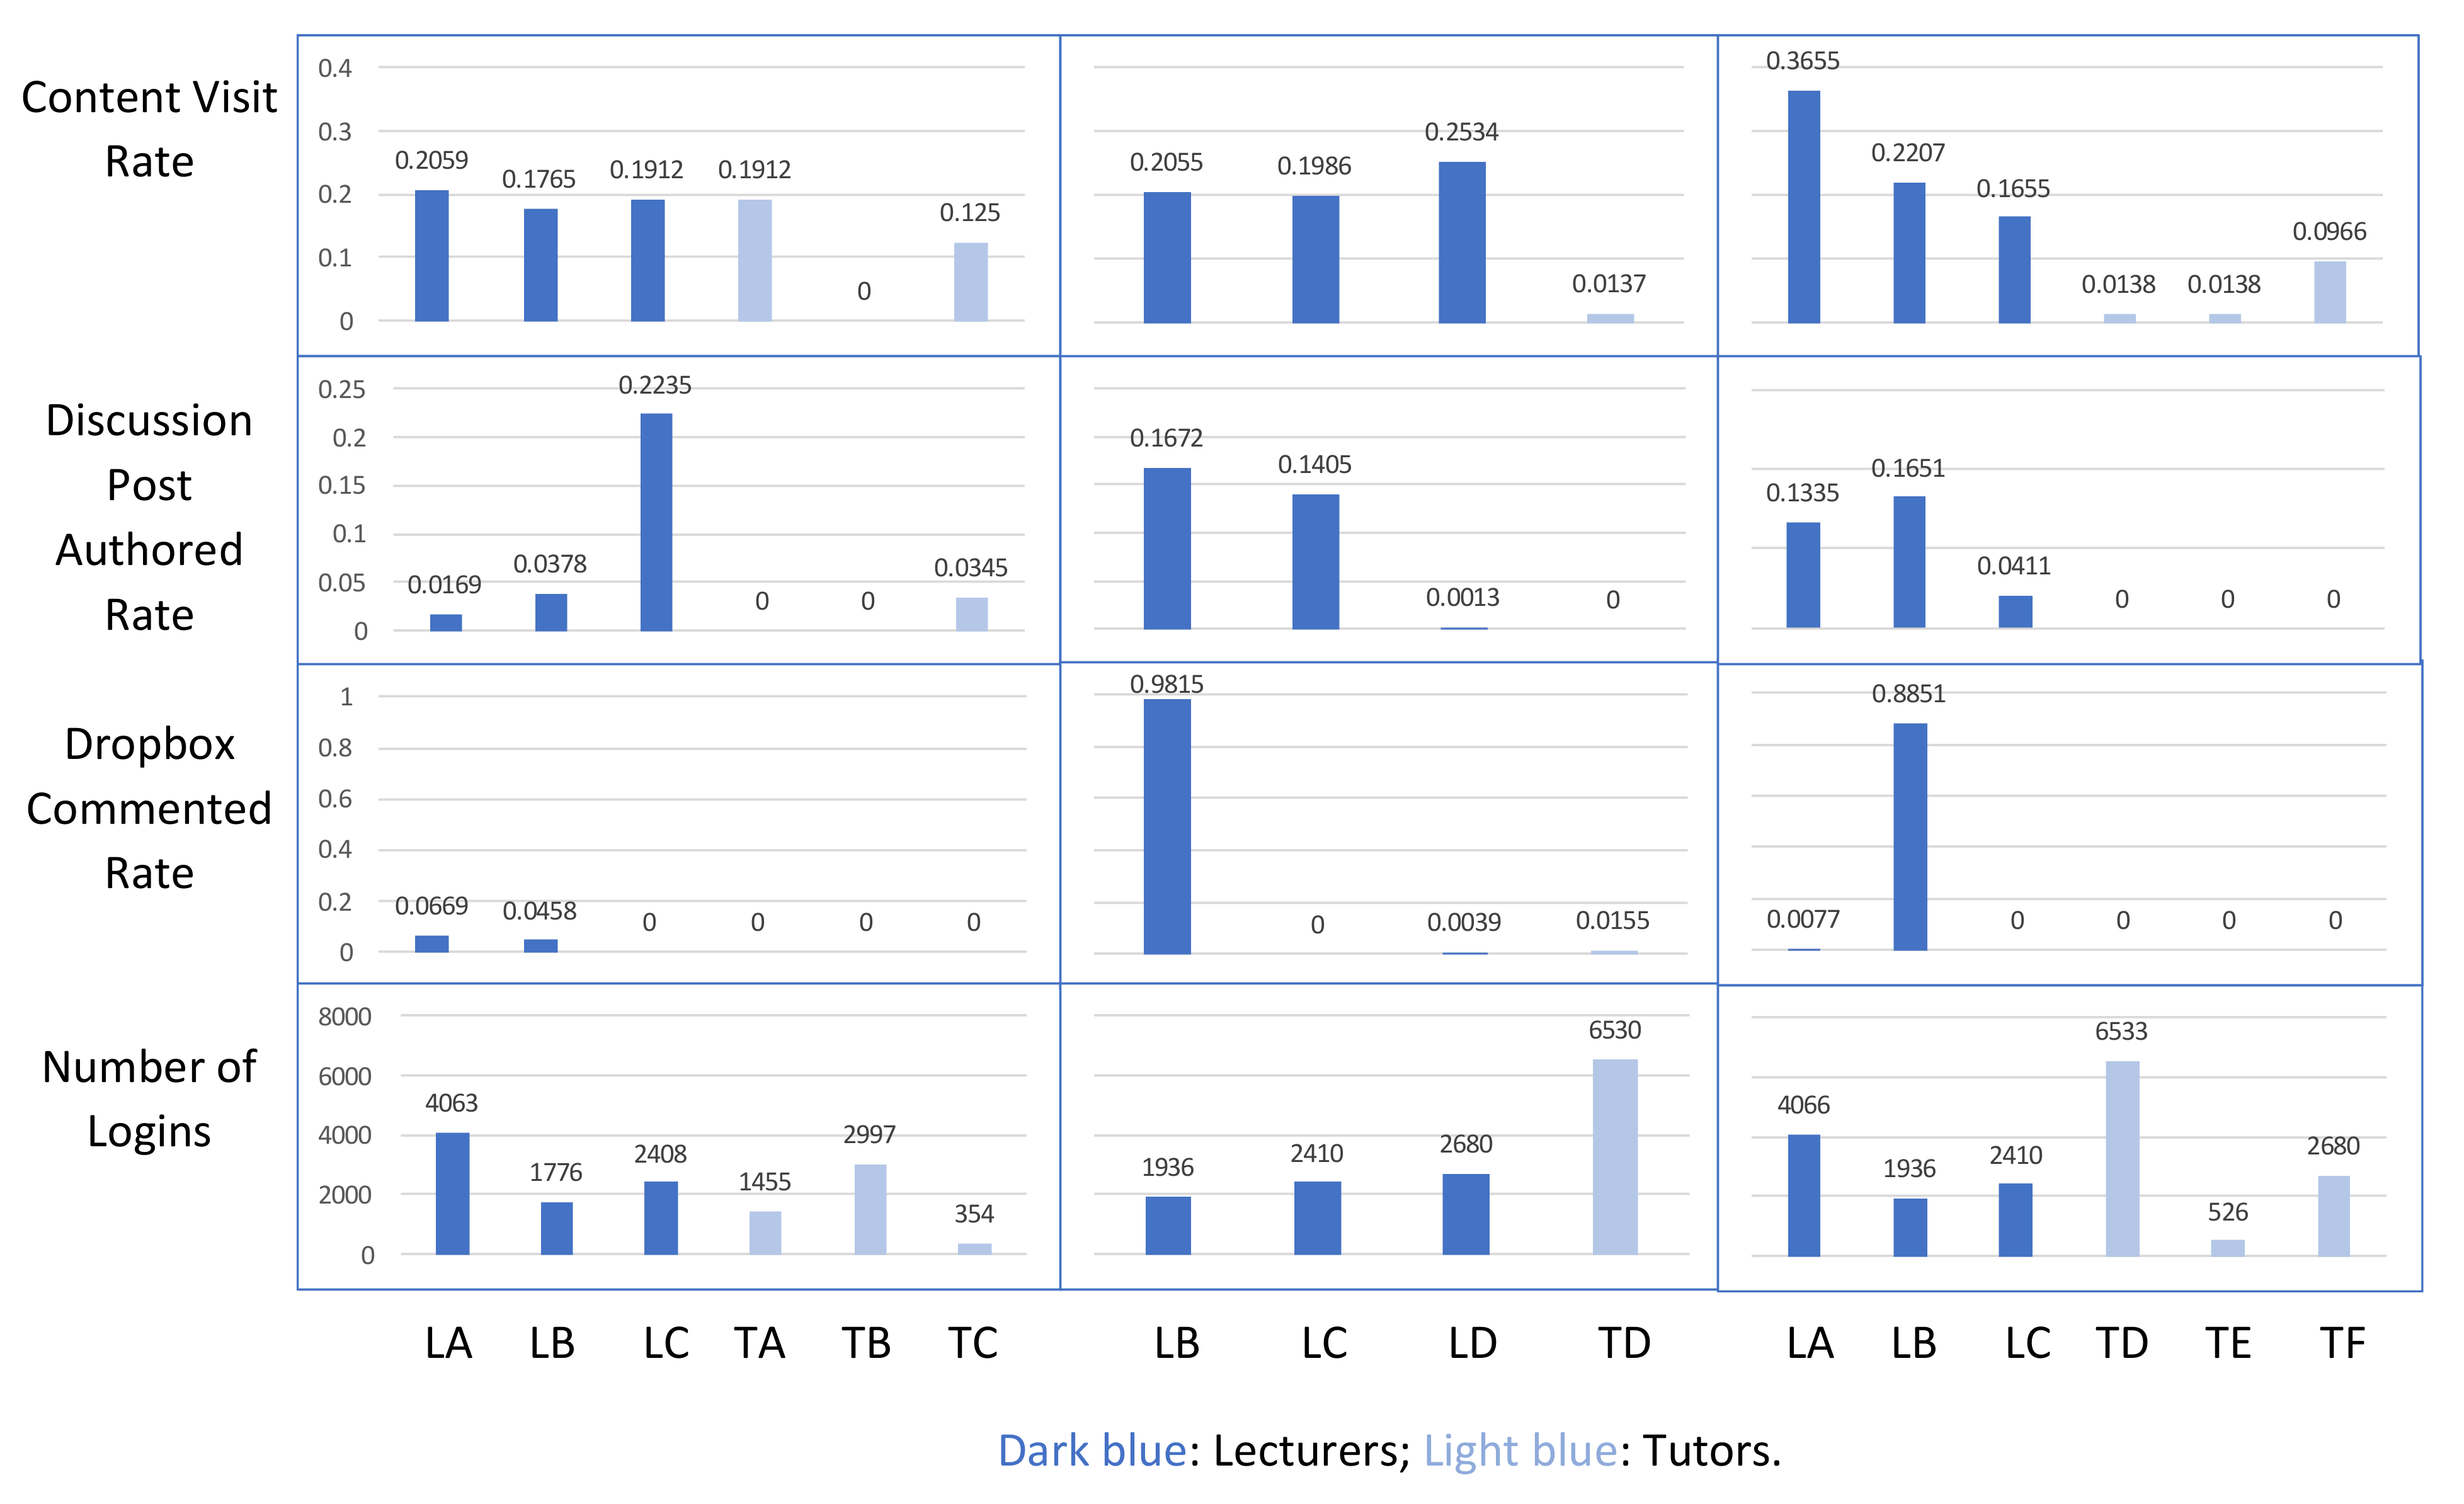
4.1.2. Observation of Teacher Input (TI) Per Subject over Time

This part analyses the observations of teacher engagement (including both lecturers and tutors) with the course content and with students. These include: the number of content topics visited by the lecturer and tutors, assignments (dropboxes) commented on, and interactions in the form of discussion posts authored in the discussion board. Examples of key features used here are presented in Table 3.
As an example, observations using Subject 3 are demonstrated in Figure 5. This is a medium-sized (approx. 150 enrolments) blended subject which was taught over a three-year period, once per year. The same lecturer led this subject over the observed period.
In Figure 5, the X axis shows the anonymised IDs of the teaching staff of Subject 3 over three years. For instance, LA stands for Lecturer A, and TA stands for Tutor A. The features extracted for observations are those given in Table 3. The ‘Content Visit Rate’ reflects whether the content has been modified, updated or reviewed by the lecturer(s). Other features indicate how the teachers, including the lecturers and tutors, interacted with the content and students (through discussions and assignment feedback).
Figure 5 shows that the content visit rates of teachers fluctuate over time. Teacher Input in terms of assignment (dropbox) comments and discussion posts authored is a fraction of their content visit rates and they too fluctuate over time. There seems to be no correlation between the teachers’ content visit rate and the assignment commenting or discussion authoring rates. The overall time the same teacher spent on the system stayed similar over time (as shown in the number of logins to the LMS).
Overall, data related to Teacher Input from each subject were examined, with underlying reasons for the changes discussed within the research team. After all the 23 subjects were looked at, the research team identified the following trends:
  • There were seven subjects (30%) where teachers did not give any feedback on student assignments, and eleven subjects (48%) where it seemed that only the lecturer actively gave feedback on student assignments, but not the tutors.
  • In nine subjects (39%) teachers did not use the discussion boards as one type of activity.
  • The research team considered these two points interesting as these factors may have impacted on students’ assignment completion and content completion rates. Therefore, correlations between these factors were examined in the next step of data analysis.

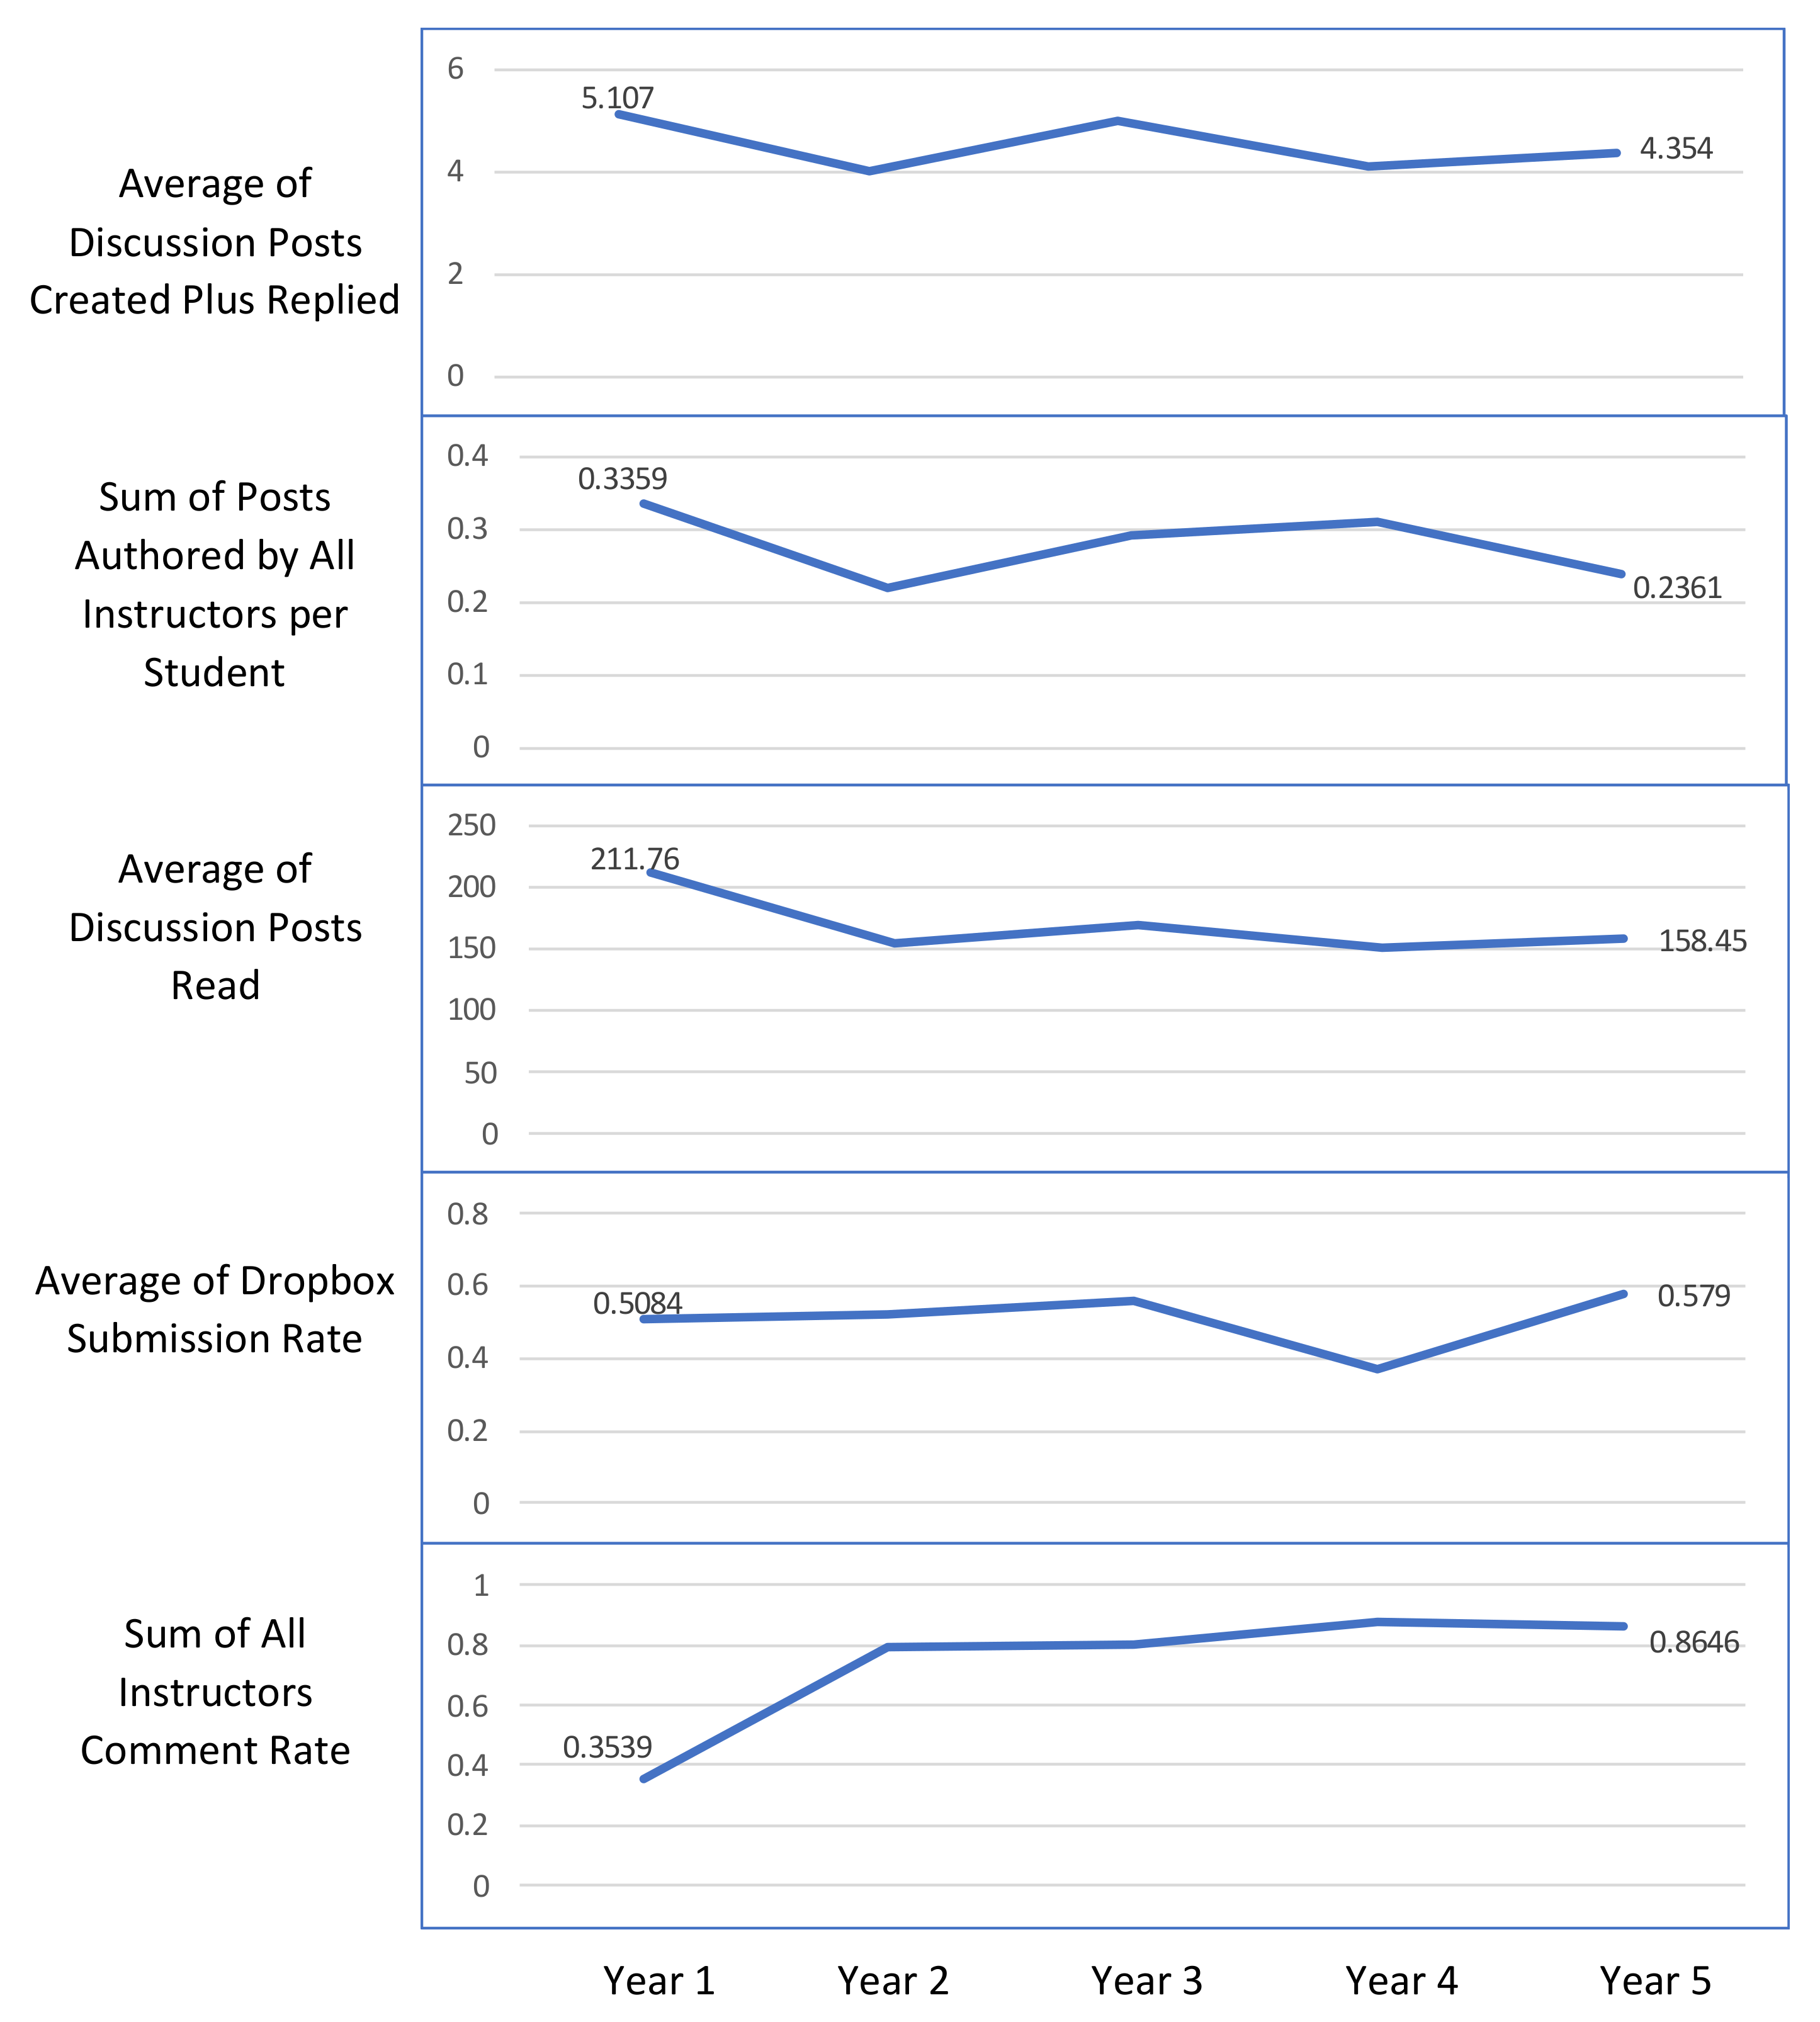
4.1.3. Observation of Student Engagement (SE) Per Subject over Time

This part analyses the observations of Student Engagement (SE) per subject over time. For the purpose of understanding student behaviour related to engagement, we sub-divided the student data into three categories: engagement with unit content, discussions, and assessment.
The unit content category refers to students’ general engagement with the unit content; these included the amount of time students spent in the LMS, their number of logins to the system, and their content completion rate.
The discussions category included observations of student involvement in the discussion board. These observations include the number of discussion posts they created or read, and the number of times they replied to other students. It was particularly interesting to observe the proportion of students who showed no engagement at all in the discussion board.
The assessment category included observations of student involvement related to assessment tasks. These include students’ dropbox submission rates and the numbers of quizzes attempted and completed.
Even though there are several features in each category, here we have focused mainly on discussion board engagement of students as it can be studied independently. The features related to discussions are explained in Table 4.
Figure 6 gives an example of student engagement in discussion boards. This example was taken from Subject 3, which did use discussion board, and the teachers, lecturers in particular, supported students in the discussions (as seen in Figure 5).
As it appears in Figure 6, the average rates for discussion posts created, read and replied remained similar over the years, with the average rates for discussion posts read and replied increased slightly over this period. Students in this subject appeared to be more active than most of the students in the other subjects. Across another nine of the 23 subjects, only 20% of students created a discussion post or replied to one. In six of the 23 subjects, no student engagement in discussion boards was observed. It is worth noting, however, that some of these subjects did not adopt the discussion boards as a communication tool, and some only used them as a supplementary tool to other forms of communication. Overall, though, the observations show decreasing engagement with student activity in discussion boards over time, and overall low student engagement in this space.
Student engagement patterns varied greatly in terms of the course content and teacher input in the various subjects. It was difficult to generate convincing results by independently observing the trend of student engagement activities in individual subjects, without considering the issues of content design and teacher input. Thus, the trends in student engagement per subject were examined together with the other two feature groups in the second stage of analysis.

4.2. Results from Stage 2: Correlation between Student Engagement (SE) with Course Content (CC) and Teacher Input (TI)

As our aim is to identify factors influential to student engagement, in this section we investigated whether SE is correlated with CC and TI, and the nature of such relationships if they exist. This part of the analysis was an extension of the examination of Student Engagement (SE) features, as mentioned in the previous section. As dividing the features into three categories provided a more systematic approach in understanding the data, this latter part of analysis again used three groups of features corresponding to the categories developed before. Examples of key features used here are presented in Table 5.
As an example, the observations using Subject 1 are demonstrated in Figure 7. This is a large (approx. 250 enrolments), blended subject which was taught over a five-year period, once per year. The same lecturer taught this subject over the observed period. These characteristics are considered typical of large-sized blended subjects in the education discipline.
Figure 7 shows that when interactions between students and teachers increase, students’ content completion and assessment completion also increase. However, the same trend is not observed between the number of content pieces in the subject and student or teacher engagement, suggesting that there may be an optimum number of content pieces beyond which the student engagement rate starts to fall.
When we considered features relevant to the three categories: Student Engagement (SE), Course Content (CC) and Teacher Input (TI), across all the subjects, the following trends started to emerge. Correlations between features along with the categories they belong to are presented below.
  • There appears to be a negative linear relationship between “Number of Content” (CC) and students’ “Content Complete Rate” (SE), and it seems the number of content pieces that can result in an optimum content complete rate of 50% is around 60. For instance, in Subject 7 the numbers of content pieces were between 61 and 113 over the years, with a 50% content completion rate. Subject 4 had content pieces ranging from 8 to 18, the completion rates were 76% to 43%. In Subject 16, the numbers of content pieces were between 83 to 230 over the years, and the completion rates were 38% to 20%.
  • There appears to be a positive linear relationship between the “Content Complete Rate” (SE) and the total number of discussion posts created and replied to (SE)-indicating students tend to have more questions or discussions if they complete more content.
  • There appears to be a positive linear relationship between students’ number of logins to the system (SE) and their “Time in Content” (SE)—indicating that the more the students log in to the system, the more time they spent on the course content.
  • There appears to be a negative linear relationship between the “Dropbox Submission Rate” (SE) and the number of dropboxes (CC), indicating that the probability of students completing assignment reduce as the number of assignments increase. Students’ dropbox submission rate was at the highest when the number of assignments is four. A potential explanation for this observation is some subjects included assignment extension request dropboxes, which would only be used by a small number of students who required extensions. For instance, when Subject 10 increased the number of dropboxes from four to eight, the Dropbox Submission Rate dropped from 79% to 23%.
  • There appears to be a positive linear relationship between the “Dropbox Submission Rate” (SE) and the “Dropbox Comment Rate” (TI)—indicating that the more comments there are from teachers, the higher the probability of students completing their assignments.
  • There appears to be a positive linear relationship between the “Sum of All Instructors Comment Rate” (TI) and “Content Complete Rate” (SE), indicating that the more comments are made by teachers, the higher the probability of students completing the subject content.

5. Discussions

The data analysis was conducted with consideration of the Community of Inquiry (CoI) framework by Garrison et al. [18], in particular the teaching presence element within this framework. The data were divided into three groups: Course Content, Teacher Input and Student Engagement. The inferences generated from the data observation and analysis indicate several approaches which can help create a more positive student experience. These approaches may be useful for future lecturers and course designers at universities.
From the course design viewpoint, the number of content pieces appeared to be an important factor influencing student engagement. Although student engagement does seem to increase with the content pieces provided through the LMS, when the number of contact materials exceeded a certain number, student engagement stopped increasing. This indicates that it is the relevance and quality of the content material that seem to positively impact on student engagement, rather than the quantity. A large number of materials that are not perceived as relevant may even decrease student engagement. The data indicate that the optimum number of content pieces for a subject delivered in a regular 13-week semester is 60 pieces, for which 50% of the students can be expected to complete the content provided. This is revealed in its correlation with students’ content completion rates, and with participation in discussion boards. It is important to note that this suggested number is intended to be indicative, and should be considered in light of the specific subject/teaching context, as some subjects may require a larger volume of materials due to specific topic needs. In addition, the data indicate that approximately four assessments are the optimal number in a subject, beyond which the submission rate starts to drop. When setting up dropboxes, it is important to label assignment submission dropboxes differently to the extension request dropbxes. This will help reveal clearer correlation between student assignment completions and other engagement behaviour. This finding can be used to inform course design, especially in online and blended subjects delivered with similar teaching patterns as those examined in this study. Again, it is important to note that the number of assessment items will also largely depend on the nature and needs of the subject, and a larger number of assessment items may be necessary in other contexts.
From the pedagogical perspective, the positive impact of teacher presence on student engagement is significant and obvious in the analysis results. In the subjects which are demonstrating active discussions by the teachers (e.g., at least one post per student), as many as 91% of the students were actively creating posts, indicating a significantly higher level of student engagement compared to the other units. Thus, despite that the level of teacher input in the LMS was found to be low overall, with only 60% of the subjects having some teacher engagement in the discussion boards, and most subjects having less than 50% of students actively engaged in creating and replying to discussion posts, it was obvious that teachers’ continued input is critical in maintaining students’ interest and engagement, especially if discussion board participation is used as an important activity in the subject. In addition, feedback from lecturers and tutors on students’ assignments is positively correlated to both students’ assignment completion rate and their content completion rate. A teacher comment rate of 90% was associated with an assignment/dropbox submission rate of as high as 60% and a content completion rate of 1. Thus, teacher feedback on assignments appears to be a critical influencer for student engagement and retention.
The findings of this research have both theoretical and practical implications. From a theoretical aspect, this research has been a useful attempt in integrating the Community of Inquiry (CoI) framework by Garrison et al. [18] with learning analytics approaches. The Community of Inquiry (CoI) framework was considered as a highly suitable choice for the theoretical framework supporting this study and guiding the data analysis. The findings of this research confirm it is valid approach to use content design and teacher input as two major factors of teaching presence. Although this research focused primarily on the teaching presence component of the CoI framework, we see the potential of the learning analytics methods used in supporting the other elements, in particular the social presence component.
The findings of this research also offer practical recommendations to inform design of future online and blended courses in higher education. They contribute to filling the knowledge gaps indicated by previous research, both qualitative studies on student engagement [20,21], and explorations on learning analytics adoptions to measure student engagement [22,23,24]. The findings reassure the importance of teacher presence and input on student engagement [20]. Existing research has gathered learners’ views on the significance of lecturer input on their learning, through assessment feedback [25], and discussions [21]. This research further adds quantitative evidence on the impact of lecturers’ and tutors’ input on student engagement, especially in the discussion boards and through assessment feedback. The findings in this research further confirm that it is the quality rather than the quantity of the course content pieces that matters [26]. The revealed correlation between the number of assessment tasks and student engagement also offers practical implications to inform future online and blended course design at universities.

6. Limitations and Challenges

As might be expected due to the scale of this research project, it was affected by a number of limitations and challenges. First, the quality of the data collected from the different subjects was largely uneven, due to the significantly diverse subject design and presentation modes between subjects and disciplines. The correlations identified are more reliable with pure online and blended subjects that have used the LMS functions more fully, for instance, those that used the discussion board as an important communication channel, and placed all learning materials into the LMS. Using some factors as indicators of student engagement may mean that we miss out other indicators which are not recorded in the LMS, especially with blended subjects that have an add-on face-to-face teaching component.
In addition, there are limitations in the quality of data generated by the LMS. Despite the time required for data cleaning and preparation, the collected data sets only provided summary information in some of the areas, rather than providing the raw data. For instance, students’ usage of the LMS can be indicated by their time spent in the system, however, there are risks in using the total length of time spent as the sole indicator for student engagement [27]. Future research might also include the number of clicks performed by users during different time periods in a day (e.g., dividing a day into four time periods), which can provide more nuanced insights on their engagement patterns.
Lastly, the data presented in this paper were behavioural in nature, and can only indicate LMS users’ behaviour to a certain extent. Relevant literature highlights that engagement is a multifaceted construct [28]. It is, therefore, of great importance to examine this concept from multiple aspects, for instance, emotional [29], cultural [30], and cognitive and social engagement [18,31], as well as student perceptions on their own engagement [32]. In addition, it is important to collect qualitative data, for instance, examining the content of posts from discussion boards, which will provide clearer insights on students’ level of understanding and knowledge gained in the subject.

7. Conclusions

This paper describes an exploration that is useful in examining influential factors to student engagement, using LMS data. This research uses a data science driven approach. Since many learning analytics research using LMS data focuses on individual units or disciplines [33], this current research is a useful exploration in using LMS data to reveal student engagement patterns in a broader context. Given the wide and easy accessibility of LMS data at higher education institutions, and the potential of learning analytics to handle large data sets, such methods may help enhance the ability of relevant studies in this area to reveal students’ behaviour patterns. Similar approaches in LMS data analysis and the discovered data-driven insights can be used or adapted by lecturers or learning and teaching support units for the purpose of informing teaching practice and policy making.
Based on the reported research findings, and with consideration of the limitations and challenges as discussed above, further research is being conducted to better incorporate the other elements in the Community of Inquiry (CoI) framework [18]. This later stage will aim to integrate learning analytics technics with the CoI survey, which is a qualitative tool to measure student engagement. It is hoped that integrating both quantitative and qualitative data will generate a more comprehensive picture, not only on student behavioural engagement patterns, but also on their cognitive understanding and knowledge construction.

Author Contributions

Conceptualisation, S.F., S.G. and S.Y.; methodology, L.C., S.G. and M.N.; data collection, G.K., Y.W.; writing—original draft preparation, S.F. and M.N.; writing—review and editing, S.G., S.Y. and Y.Y.; funding acquisition, S.F., Y.W., S.G., S.Y., G.K. All authors have read and agreed to the published version of the manuscript.

Funding

This research was funded by the Research Enhancement Grant Scheme at the University of Tasmania.

Institutional Review Board Statement

The study was approved by the Human Research Ethics Committee (Tasmania) Network (Reference number H16064).

Informed Consent Statement

Informed consent was obtained from lecturers coordinating the subjects involved in the study.

Data Availability Statement

The data presented in this paper are not publicly available.

Conflicts of Interest

The authors declare no conflict of interest.

References

  1. Muir, T.; Milthorpe, N.; Stone, C.; Dyment, J.; Freeman, E.; Hopwood, B. Chronicling engagement: Students’ experience of online learning over time. Distance Educ. 2019, 40, 262–277. [Google Scholar] [CrossRef]
  2. Kember, D.; Ellis, R.A. Admission and Success for Low SES University Students: Report on a HEPPP 2018 National Priorities Pool Project; Department of Education, Skills and Employment: Canberra, ACT, Australia, (under review).
  3. SOLAR. What Is Learning Analytics? 2020. Available online: https://www.solaresearch.org/about/what-is-learning-analytics/ (accessed on 31 August 2021).
  4. Rienties, B.; Boroowa, A.; Cross, S.; Kubiak, C.; Mayles, K.; Murphy, S. Analytics4Action evaluation framework: A review of evidence-based learning analytics interventions at the Open University UK. J. Interact. Media Educ. 2016, 1, 1–11. [Google Scholar]
  5. Villano, R.; Harrison, S.; Lynch, G.; Chen, G. Linking early alert systems and student retention: A survival analysis approach. High. Educ. 2018, 76, 903–920. [Google Scholar] [CrossRef]
  6. Ferguson, R.; Shum, S.B. Social learning analytics: Five approaches. In Proceedings of the Presented at the 2nd International Conference on Learning Analytics and Knowledge, Vancouver, CO, Canada, 29 April–2 May 2012; pp. 23–33. [Google Scholar] [CrossRef]
  7. Swenson, J.A. Understanding ethical concerns in the design, application, and documentation of learning analytics in post-secondary education. Doctoral Dissertation, University of Minnesota, Minneapolis, MN, USA, 2015. [Google Scholar]
  8. Ellis, R.A.; Han, F.; Pardo, A. Improving learning analytics–Combining observational and self-report data on student learning. J. Educ. Technol. Soc. 2017, 20, 158–169. [Google Scholar]
  9. López Zambrano, J.; Lara Torralbo, J.A.; Romero Morales, C. Early prediction of student learning performance through data mining: A systematic review. Psicothema Oviedo 2021, 33, 456–465. [Google Scholar]
  10. Timms, M. Big Data in Education: A guide for Educators; Centre for Strategic Education Occasional Paper: Melbourne, VIC, Australia, (No. 139); 2015; pp. 1–10. [Google Scholar]
  11. Corrin, L.; De Barba, P.G.; Bakharia, A. Using learning analytics to explore help-seeking learner profiles in MOOCs. In Proceedings of the Seventh International Learning Analytics Knowledge Conference, Vancouver, CO, Canada, 13–17 March 2017; pp. 424–428. [Google Scholar]
  12. Czerkawski, B.C. When learning analytics meets e-learning. Online J. Distance Learn. Adm. 2015, XVIII, 2. [Google Scholar]
  13. Dietz-Uhler, B.; Hurn, J.E. Using learning analytics to predict (and improve) student success: A faculty perspective. J. Interact. 2013, 12, 17–26. [Google Scholar]
  14. Ellaway, R.H.; Pusic, M.V.; Galbraith, R.M.; Cameron, T. Developing the role of big data and analytics in health professional education. Med Teacher. 2014, 36, 216–222. [Google Scholar] [CrossRef] [PubMed]
  15. Colvin, C.; Rogers, T.; Wade, A.; Dawson, S.; Gasevic, D.; Buckingham Shum, S.; Nelson, K.; Alexander, S.; Lockyer, L.; Kennedy, G.; et al. Student Retention and Learning Analytics: A Snapshot of Australian Practices and a Framework for Advancement. Australian Government Office for Learning and Teaching. 2016. Available online: https://opus.cloud.lib.uts.edu.au/bitstream/10453/117173/1/AUS_OLT_LearningAnalytics_2016.pdf (accessed on 31 August 2021).
  16. Fisher, J.; Valenzuela, F.-R.; Whale, S. Learning Analytics: A bottom-up Approach to Enhancing and Evaluating Students’ Online Learning. Government Office for Learning and Teaching. 2014. Available online: https://ltr.edu.au/resources/SD12_2567_Fisher_Report_2014.pdf (accessed on 31 August 2021).
  17. West, D.; Heath, D.; Huijser, H.; Lizzio, A.; Toohey, D.; Miles, C.; Searle, B.; Bronnimann, J. Learning analytics: Assisting UniVersities with Student Retention. Government Office for Learning and Teaching. 2015. Available online: https://researchrepository.murdoch.edu.au/id/eprint/35134/ (accessed on 31 August 2021).
  18. Garrison, D.R.; Anderson, T.; Archer, W. Critical inquiry in a text-based environment: Computer conferencing in higher education. Internet High. Educ. 2000, 2, 87–105. [Google Scholar] [CrossRef] [Green Version]
  19. Kovanović, V.; Gašević, D.; Dawson, S.; Joksimović, S.; Baker, R.S.; Hatala, M. Penetrating the Black Box of Time-on-task estimation. In Proceedings of the Presented at the Fifth International Conference on Learning Analytics and Knowledge, New York, NY, USA, 16–20 March 2015; Available online: https://dl.acm.org/doi/abs/10.1145/2723576.2723623 (accessed on 31 August 2021).
  20. Rapanta, C.; Botturi, L.; Goodyear, P.; Guàrdia, L.; Koole, M. Online university teaching during and after the Covid-19 crisis: Refocusing teacher presence and learning activity. Postdigital Sci. Educ. 2020, 2, 923–945. [Google Scholar] [CrossRef]
  21. Kember, D.; Douglas, T.; Muir, T.; Salter, S. Umbrella action research projects as a mechanism for learning and teaching quality enhancement. High. Educ. Res. Dev. 2019, 38, 1285–1298. [Google Scholar] [CrossRef]
  22. Fan, S. Learning analytics: A growing interest for Big Data analytics in Australian higher education. In Proceedings of the 4th International Conference on BigData Analysis and Data Mining, Paris, France, 7–8 September 2017. [Google Scholar]
  23. Fan, S.; Garg, S.; Yeom, S. Exploring the Use of Big Data Analytics for Improving Support to Students in Higher Education. In Advances in Artificial Intelligence. Lecture Notes in Computer Science; Kang, B., Bai, Q., Eds.; Springer: Cham, Switzerland, 2016; Volume 9992. [Google Scholar] [CrossRef]
  24. Kember, D.; Leung, D.; Prosser, M. Has the open door become a revolving door? The impact on attrition of moving from elite to mass higher education. Stud. High. Education. 2019, 46, 258–269. [Google Scholar] [CrossRef]
  25. Killingback, C.; Drury, D.; Mahato, P.; Williams, J. Student feedback delivery modes: A qualitative study of student and lecturer views. Nurse Educ. Today. 2020, 84, 104237. [Google Scholar] [CrossRef] [PubMed]
  26. Green, R.A.; Whitburn, L.Y.; Zacharias, A.; Byrne, G.; Hughes, D.L. The relationship between student engagement with online content and achievement in a blended learning anatomy course. Anat. Sci. Education 2018, 11, 471–477. [Google Scholar] [CrossRef] [PubMed]
  27. Fan, S.; Garg, S.; Kregor, G.; Yeom, S.; Wang, Y. Exploring the Potential of Learning Analytics to Measure Student Participation and Engagement: Researchers’ Experiences from an Exploratory Study. In Proceedings of the Australian Association for Research in Education (AARE) Annual Conference, Melbourne, VIC, Australia, 28 November–2 December 2021; University of Sydney: Sydney, NSW, Australia, 2021. [Google Scholar]
  28. Fredricks, J.A.; Blumenfeld, P.C.; Paris, A.H. School engagement: Potential of the concept, state of the evidence. Rev. Educ. Research. 2004, 74, 59–109. [Google Scholar] [CrossRef] [Green Version]
  29. Bensimon, E.M. Foreword. In Student Engagement in Higher Education; Harper, S.R., Quaye, S.J., Eds.; Routledge: New York, NY, USA; London, UK, 2009; pp. xxi–xxvi. [Google Scholar]
  30. Hess, D.J.; Lanig, H.; Vaughan, W. Educating for equity and social justice: A conceptual model for cultural engagement. Multicult. Perspectives 2007, 9, 32–39. [Google Scholar] [CrossRef]
  31. Garrison, D.R.; Anderson, T.; Archer, W. The first decade of the community of inquiry framework: A retrospective. Internet High. Educ. 2010, 13, 5–9. [Google Scholar] [CrossRef]
  32. Dyment, J.; Stone, C.; Milthorpe, N. Beyond busy work: Rethinking the measurement of online student engagement. High. Educ. Res. Dev. 2020, 39, 1440–1453. [Google Scholar] [CrossRef]
  33. Fan, S.; Wu, Q.; Yang, Y. Learning analytics for prediction and measurement of student retention and performance in Higher Education in Australia and New Zealand: A systematic Review. In progress.
Figure 1. Conceptual framework based on the Community of Inquiry (CoI) framework [18].
Education 11 00608 g001
Figure 2. Number of content pieces completed vs. number of content pieces required in Subject 10.
Education 11 00608 g002
Figure 3. Time in content distribution for each student in Subject 10 in a given year.
Education 11 00608 g003
Figure 4. Changes in course content in Subject 4 over five years.
Education 11 00608 g004
Figure 5. Teachers’ input in Subject 3 over three years.
Education 11 00608 g005
Figure 6. Student engagement in Subject 3 over three years.
Education 11 00608 g006
Figure 7. Teacher and student engagement vs. subject features for Subject 1 over five years.
Education 11 00608 g007
Table 1. Numbers of subjects in four disciplines.
DisciplinesSubjects
EducationSubjects 1 to 6
HumanitiesSubjects 7 to 9
Engineering and ICT Subjects 10 to 14
Natural SciencesSubjects 15 to 23
Table 2. Course Content (CC) Features.
Feature NameDescription
Number of ContentNumber of content pieces per subject per semester.
Number of Content RequiredNumber of content pieces required for students of this subject per semester.
Number of DropboxesNumber of assignments per subject per semester.
Number of Grade ItemsNumber of grade items for this subject.
Number of Discussion Posts Number of posts from both students and teachers (including lecturers and tutors) in the discussion boards.
Table 3. Teacher Input (TI) Features.
Feature NameDescription
Content Visit RateNumber of content visited/number of contents.
Discussion Post Authored RateNumber of discussion posts authored by the teacher/total number of discussion posts.
Dropbox Commented RateNumber of comments from teachers/number of student assignments submitted to dropboxes.
Number of LoginsNumber of logins to the LMS.
Table 4. Student Engagement (SE) features related to discussions.
Feature NameDescription
Average Content Complete RateAverage number of content pieces completed by a student/total number of content pieces in the subject.
Average Discussion Post Create RateAverage number of discussion posts created by a student/total number of discussion posts.
Average Discussion Post Read RateAverage number of discussion posts read by a student/total number of discussion posts.
Average Discussion Post Reply RateAverage number of discussion post replies by a student/total number of discussion posts
Table 5. Examples of features used in Stage 2 correlation analysis.
CategoriesFeature NameDescription
DiscussionsAverage of Discussion Posts Created Plus RepliedNumber of discussion posts created and replied by all students/number of students enrolled in the unit.
Sum of Posts Authored by All Instructors per StudentSum of all discussion posts authored by instructors/number of students enrolled in the unit.
Average of Discussion Posts ReadNumber of discussion posts read by all students/number of students enrolled in the unit.
AssessmentAverage of Dropbox Submission RateNumber of dropbox submissions by student/number of dropboxes.
Sum of All Instructors Comment RateSum of all instructors’ comments/number of assignment submissions.
Publisher’s Note: MDPI stays neutral with regard to jurisdictional claims in published maps and institutional affiliations.

