Revealing Impact Factors on Student Engagement: Learning Analytics Adoption in Online and Blended Courses in Higher Education
Abstract
:1. Introduction
2. Background
2.1. Learning Analytics—Definition and Application in Higher Education
2.2. Conceptual Framework Based on the Community of Inquiry (CoI) framework
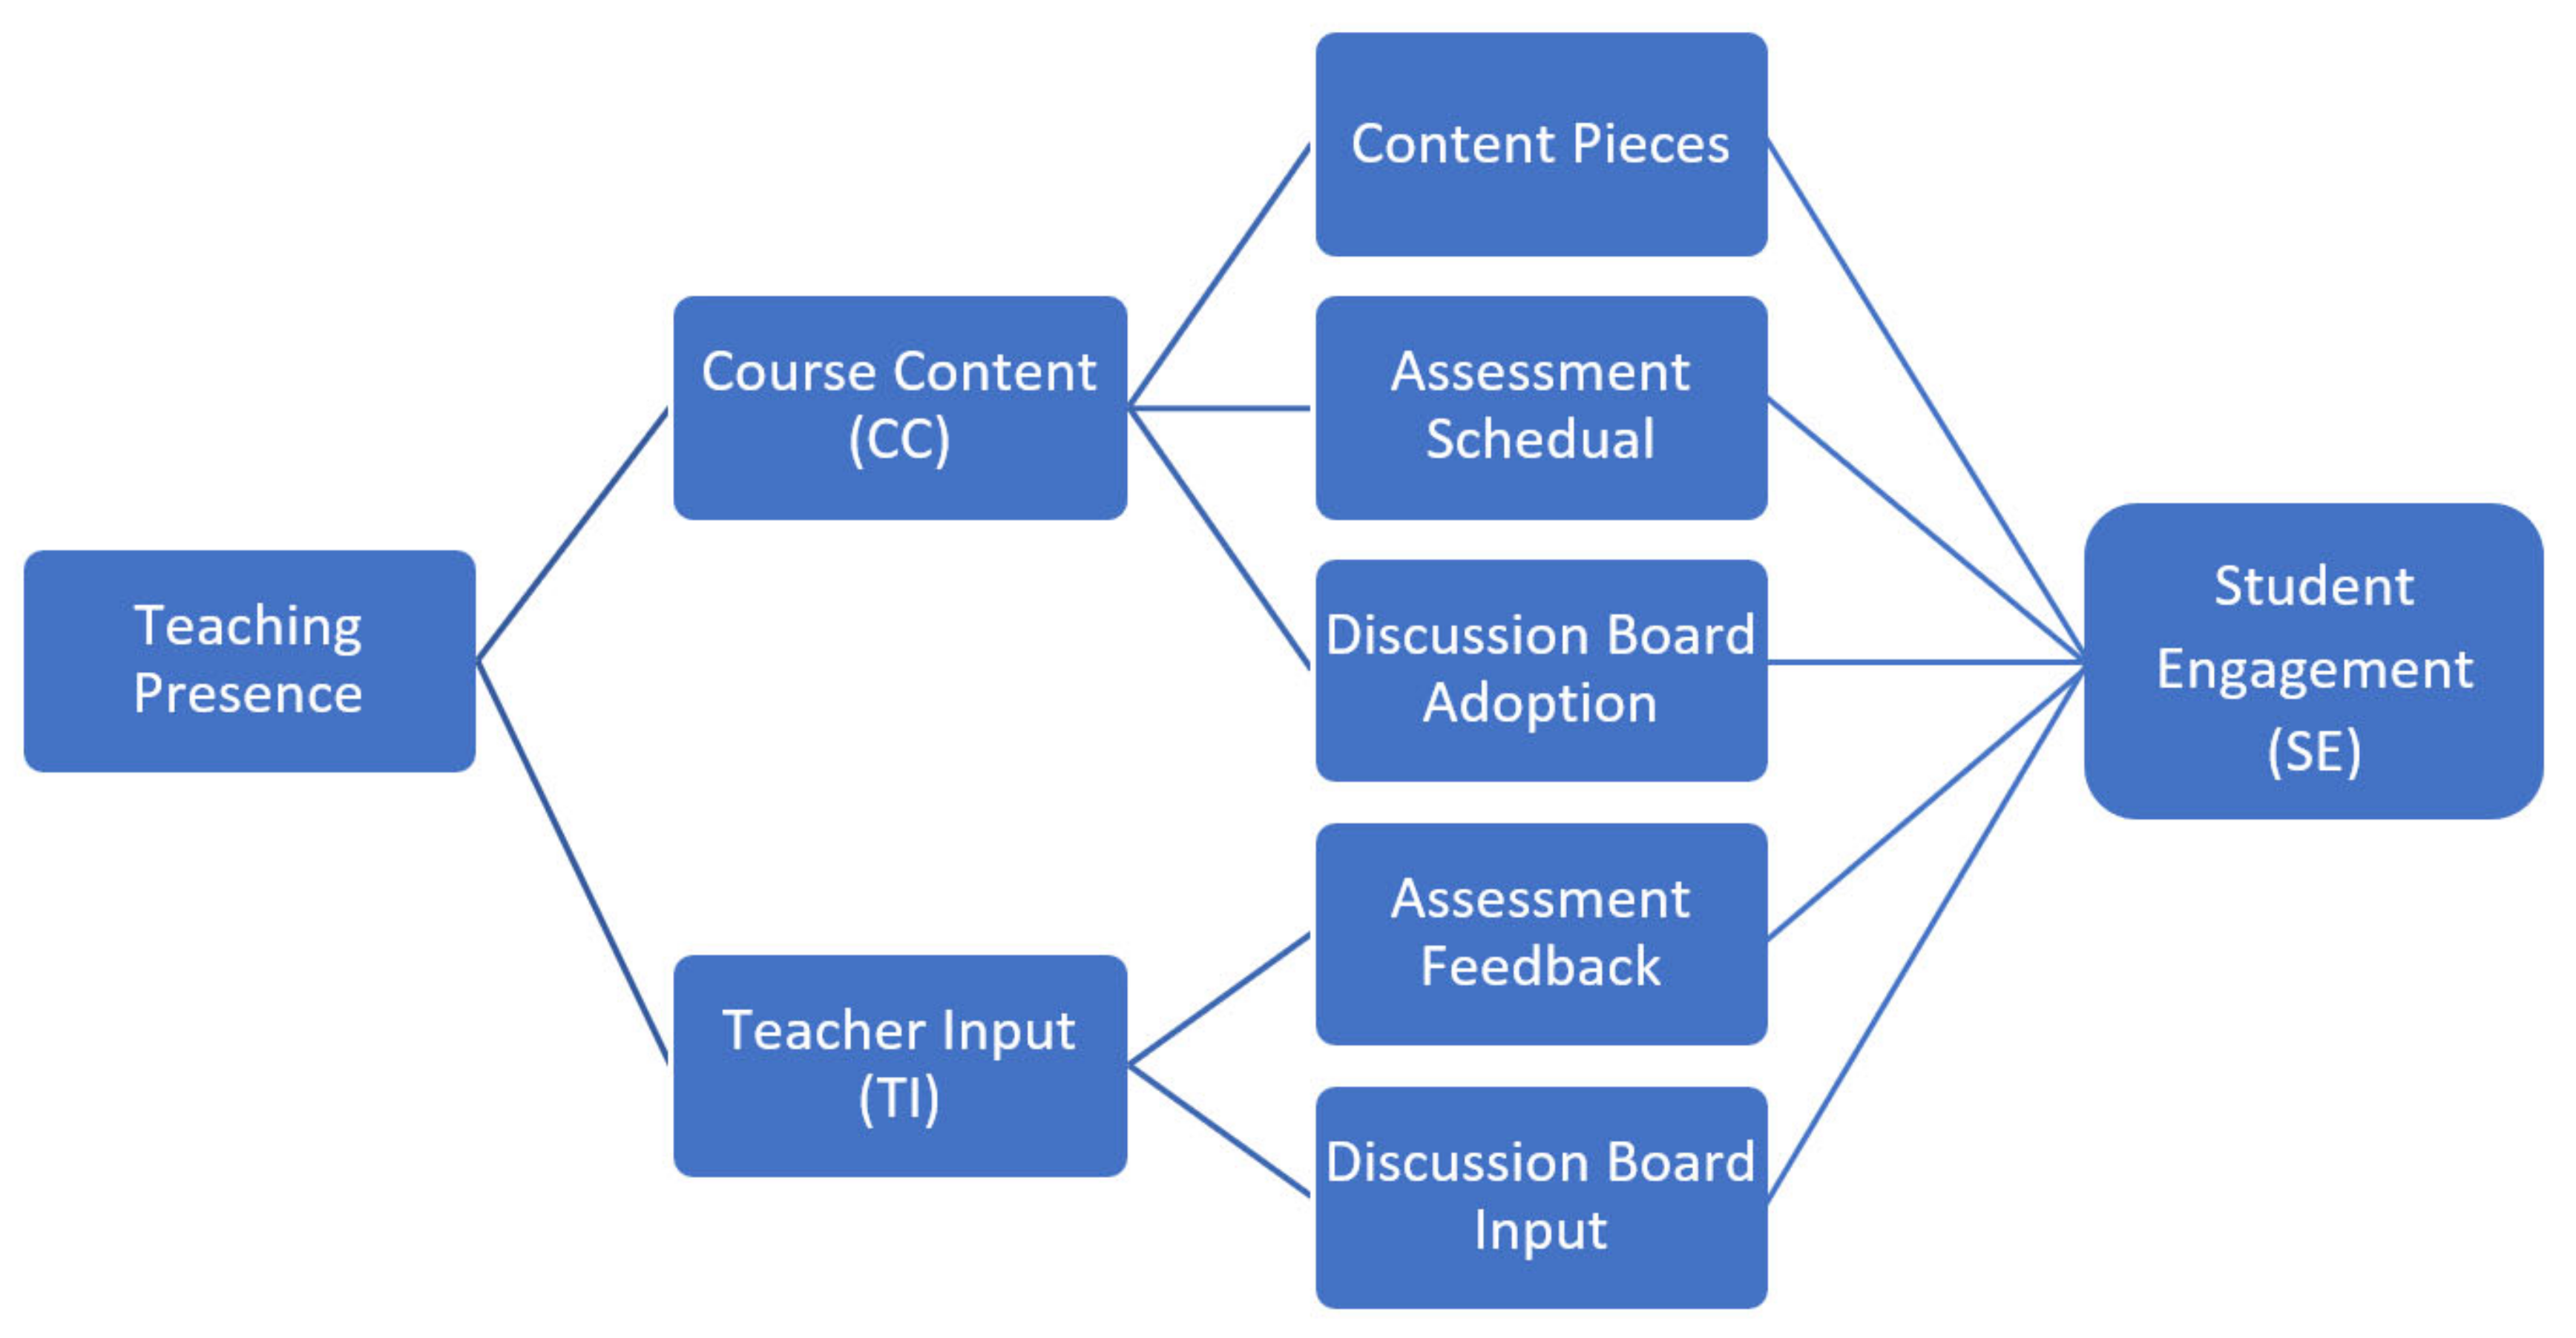
- How is Course Content (CC) design influencing Student Engagement (SE) in online and blended subjects at the target university?
- How is Teacher Input (TI) influencing Student Engagement (SE) in the chosen online and blended subjects?
3. Material and Methods
3.1. Data Collection and Participants
3.2. Data Preparation
- Course Content (CC): This subset refers to the data around subject design. This data set included items such as subject names, semesters of delivery, numbers of content pieces, numbers of tasks required of students, numbers of assignments (dropboxes), and numbers of tasks in the discussion board.
- Teacher Input (TI): This subset refers to the data set around lecturer and tutor involvement. This data set included items such as numbers of content pieces visited by the teacher(s), number of comments on student assignments, numbers of assignments graded, numbers of logins to the LMS, and numbers of discussion posts authored.
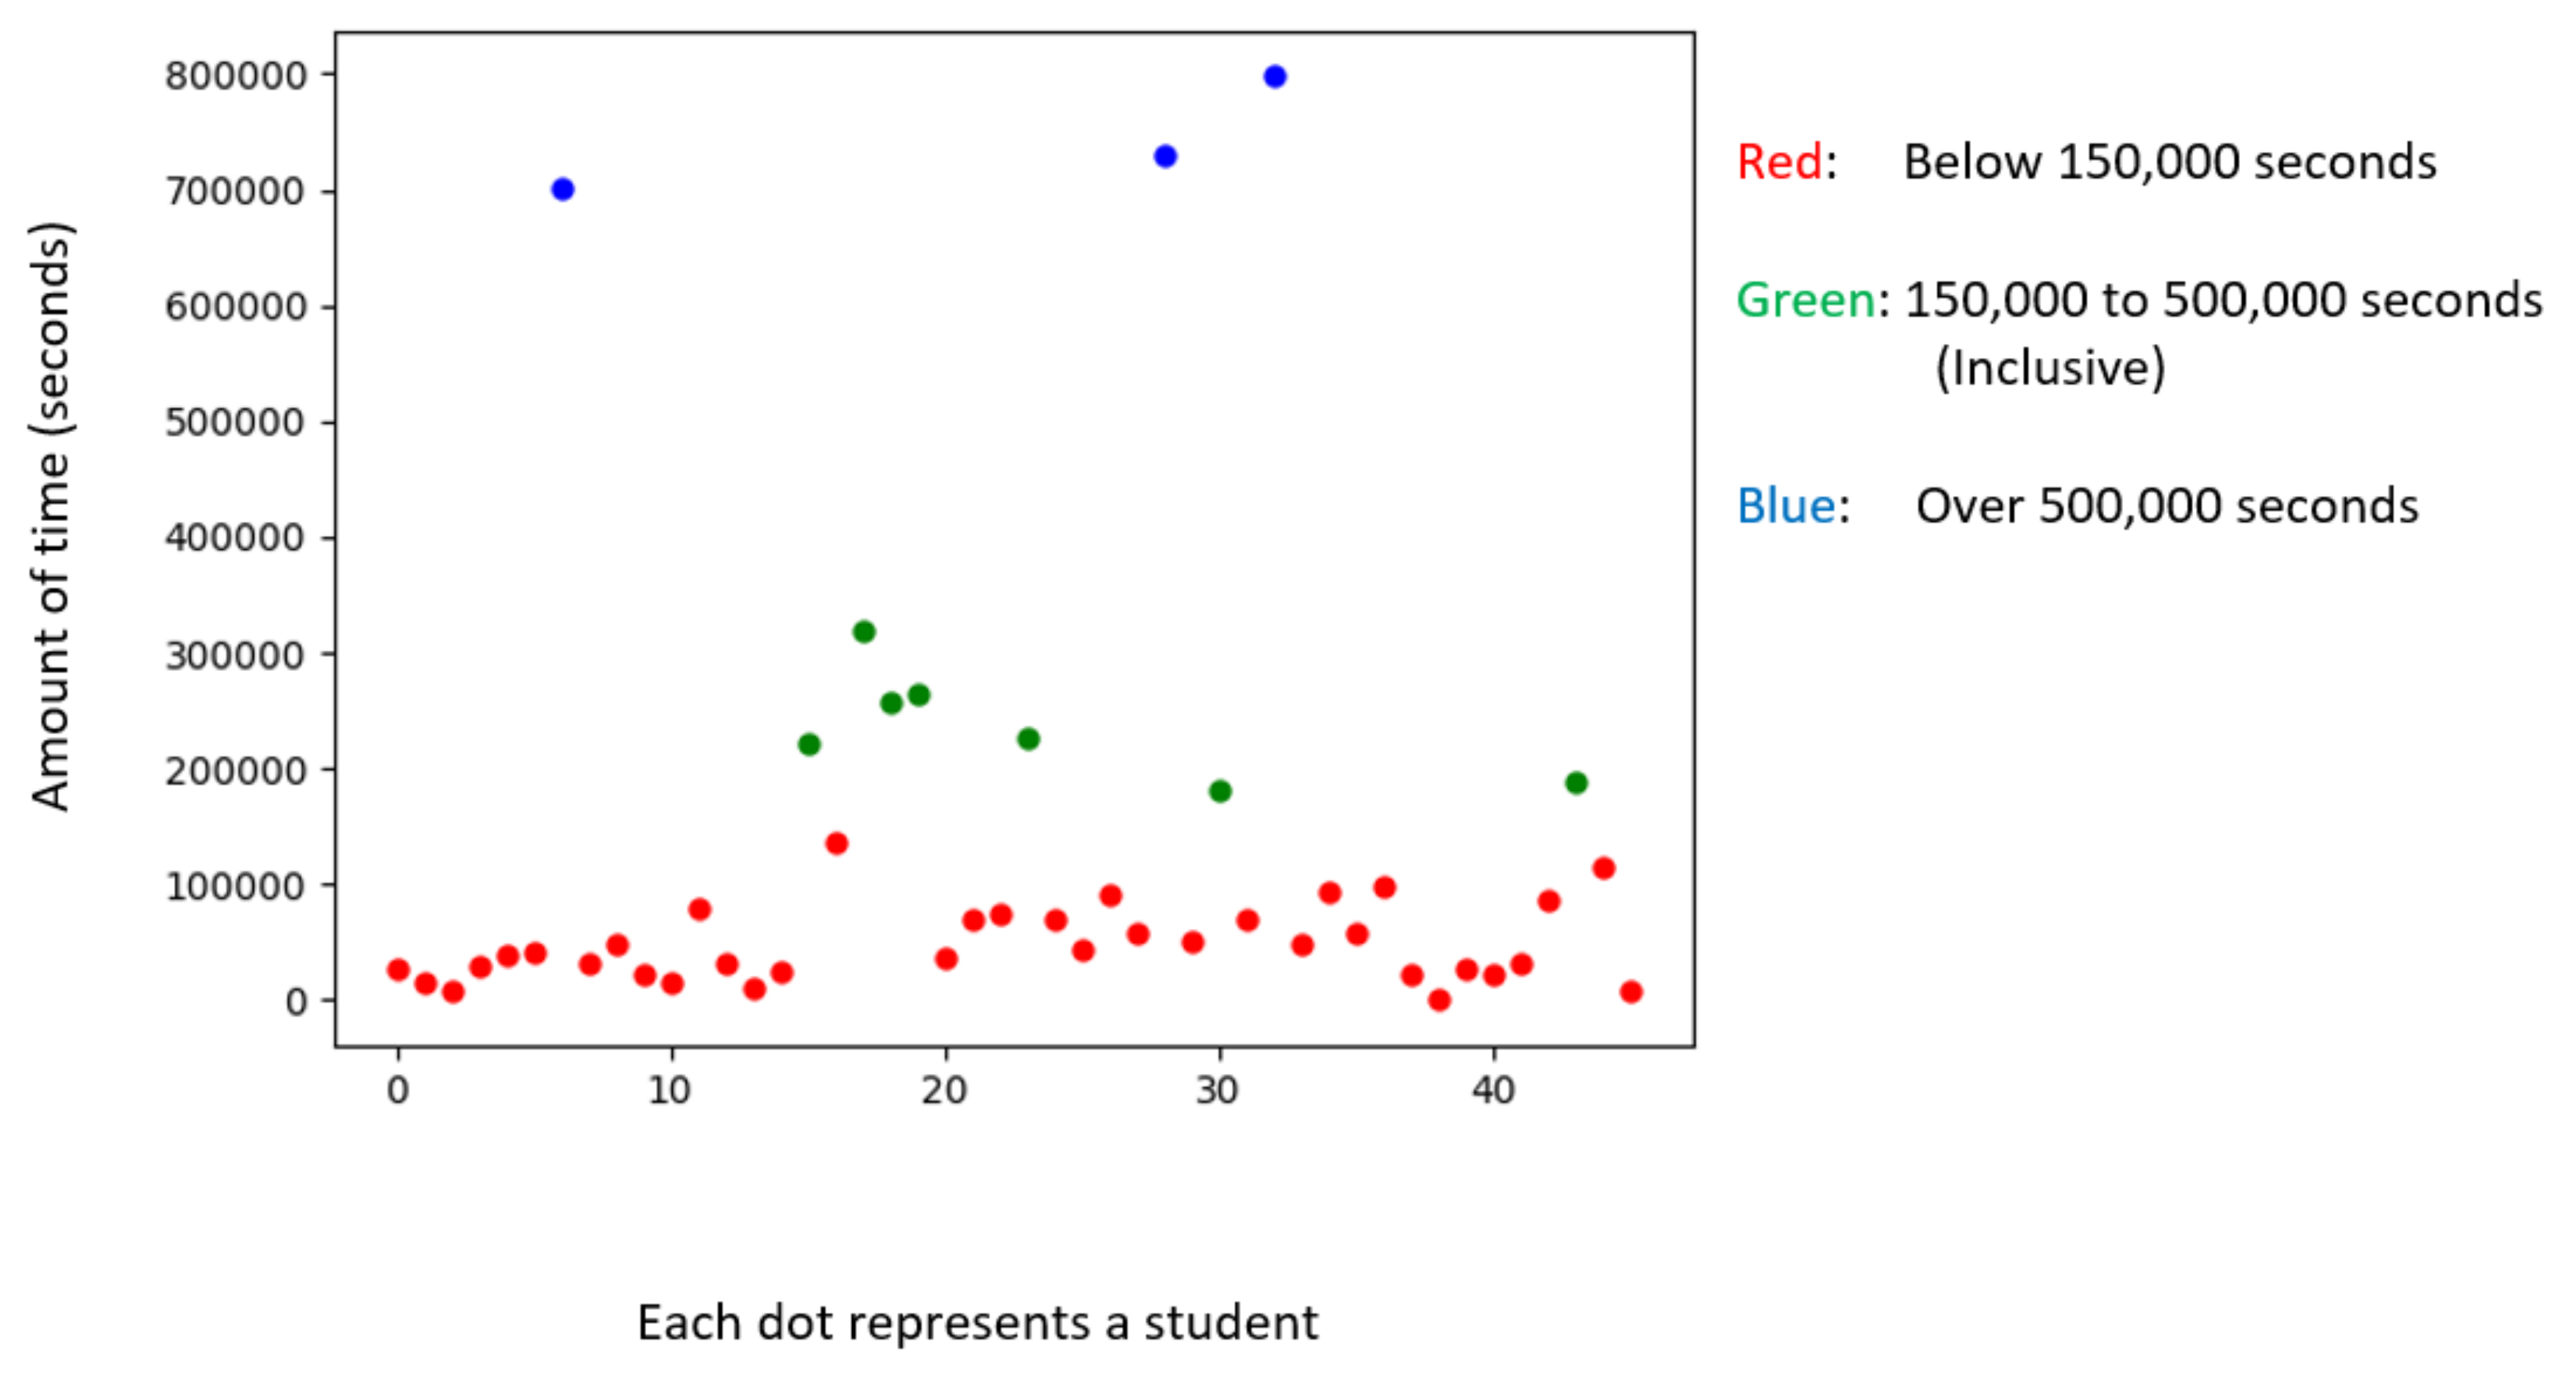
- Student Engagement (SE): This subset refers to the data set around student engagement. This data set included items such as numbers of content pieces read, time spent on each item of content material, numbers of assignments submitted in dropboxes, numbers of quizzes completed, numbers of logins to the LMS, and numbers of discussion posts created, replied to and read.
3.3. Data Analysis
4. Results and Findings
4.1. Results from Stage 1: Descriptive Analysis
4.1.1. Observation of Course Content (CC) Design Per Subject over Time
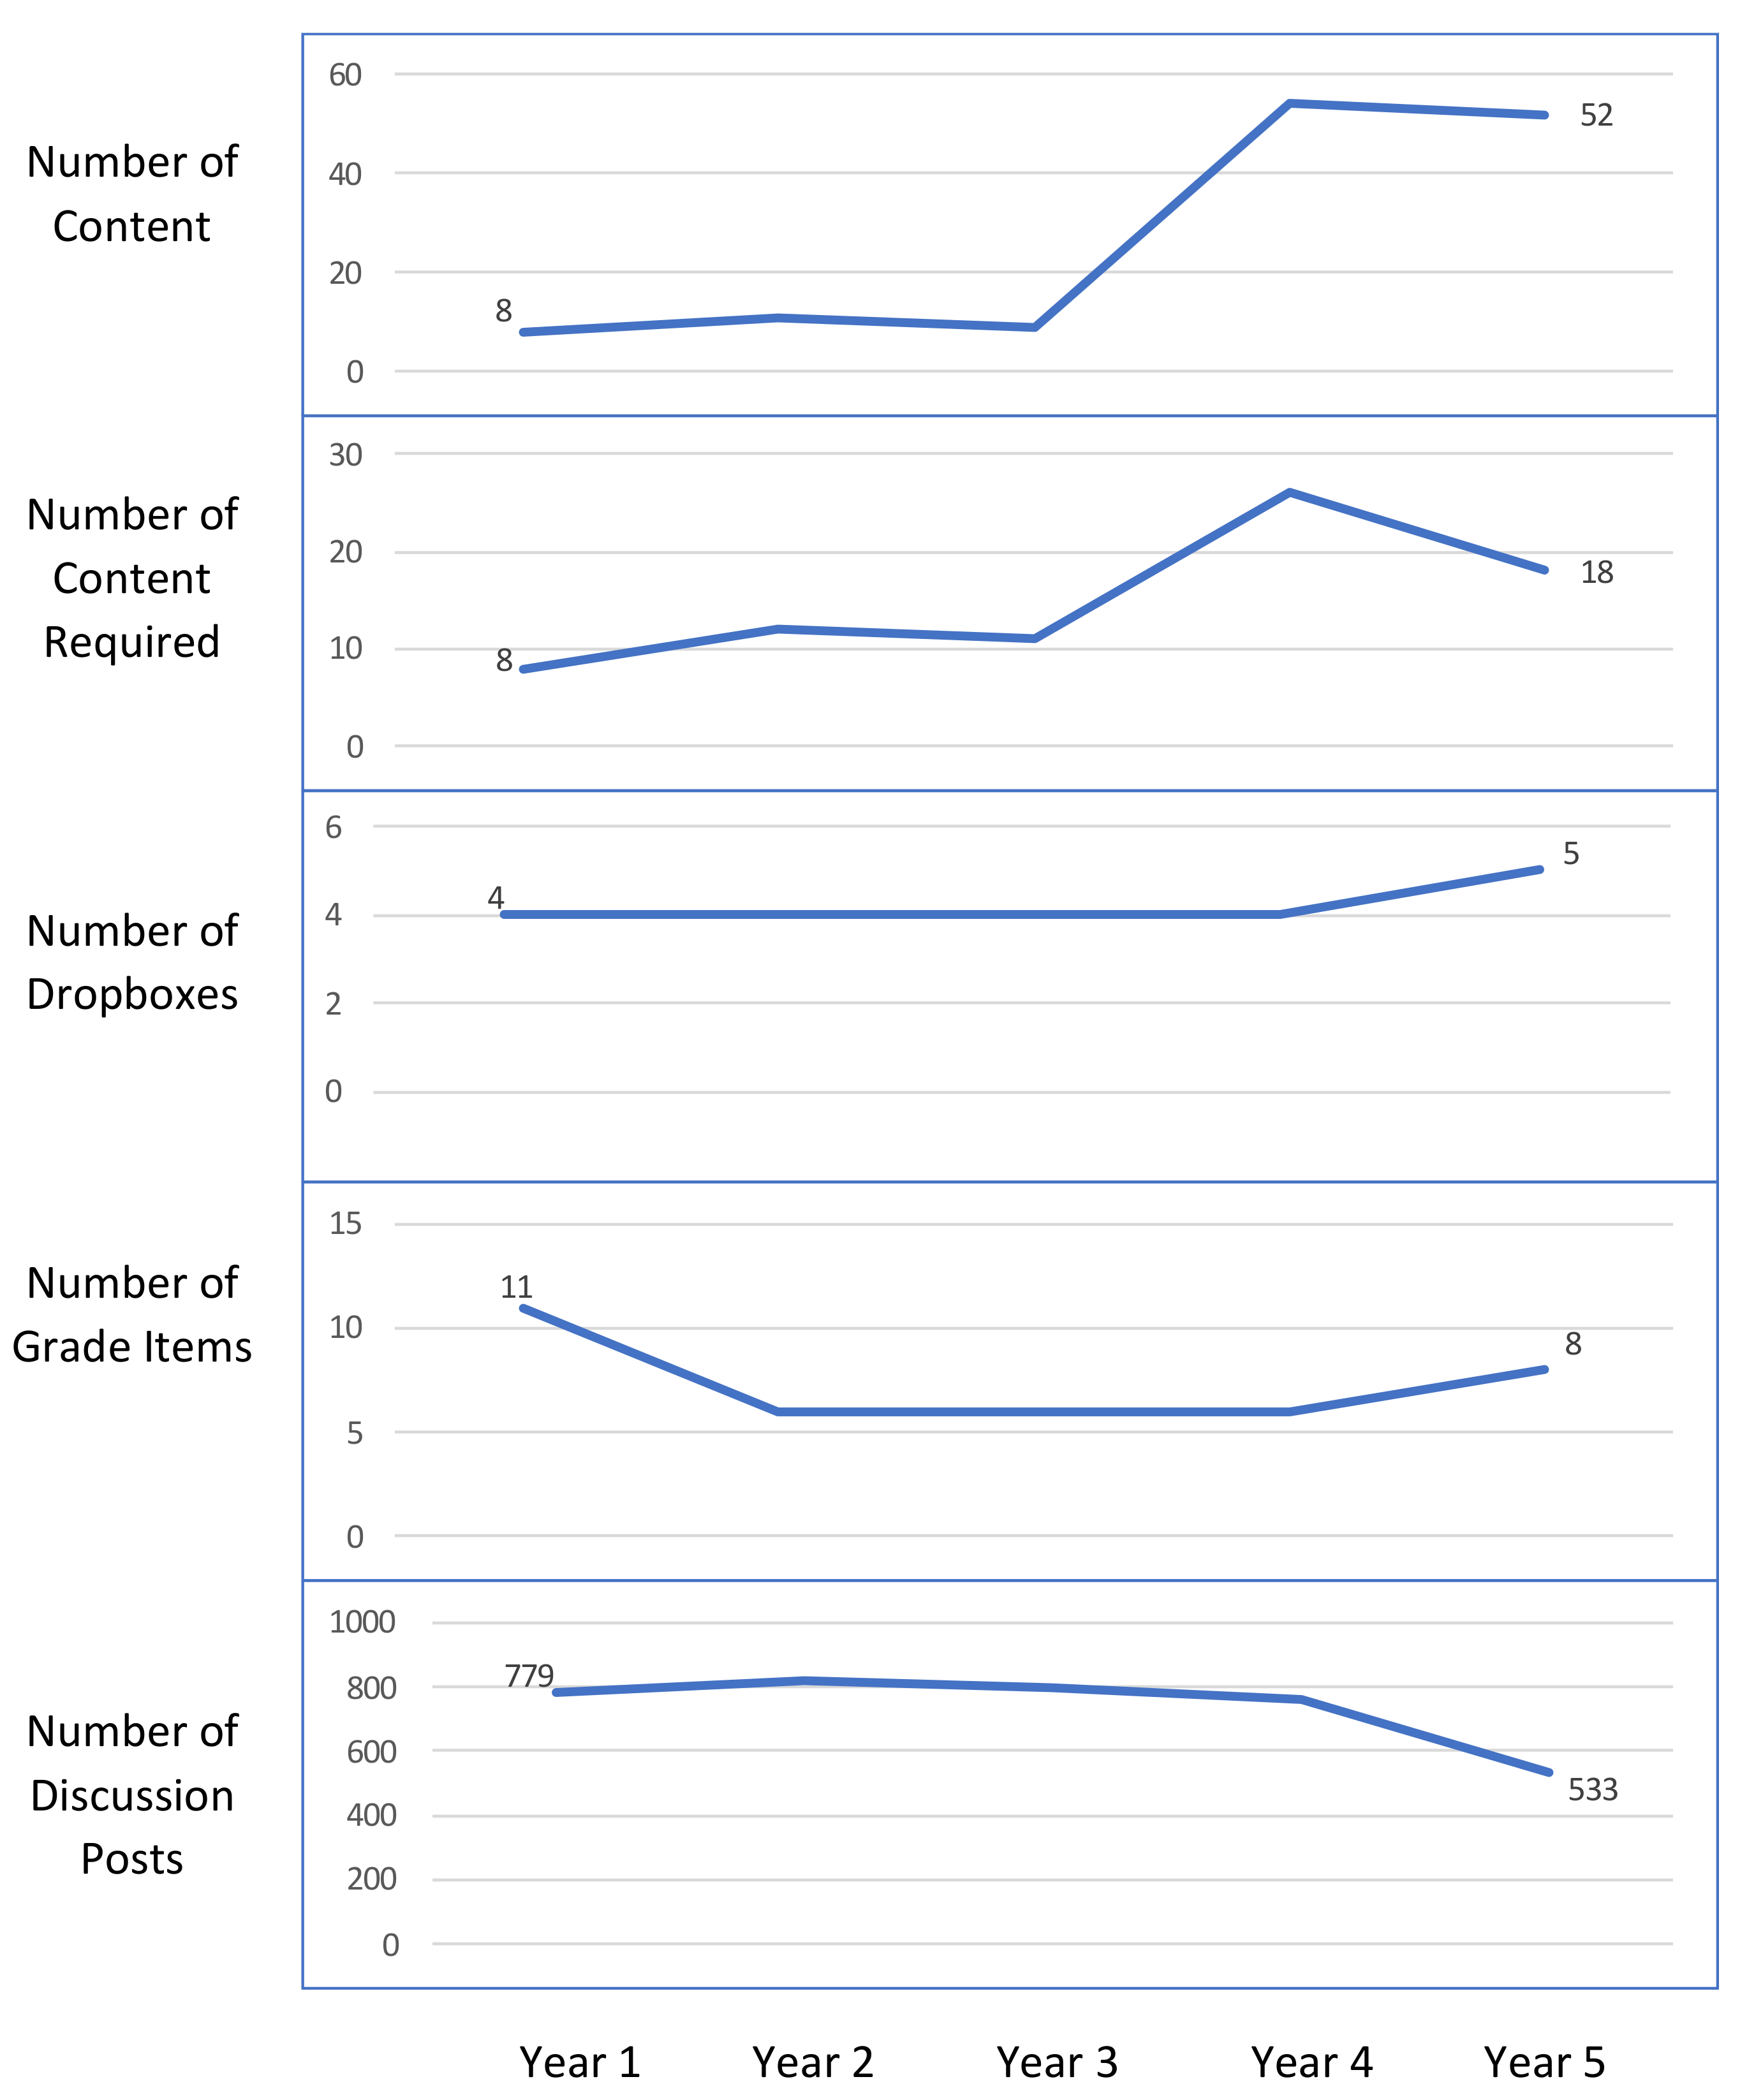
- Over half of the subjects (n = 14, 61%) continuously increased the number of course content items over time. This indicates a constant updating of the content for most of the subjects.
- Only a few subjects (n = 9, 39%) continuously increased the number of assignments over time, while 10 subjects (40%) kept the number of assignments at the same level over the years of delivery. It is important to note that the number of assignments is calculated using the numbers of dropboxes, so it does not include assessments that may have been conducted using other means, such as paper-based submissions or in-class tests.
- A similar trend is observed in the number of grade items, where 10 subjects (40%) increased the number of grade items over the years and 10 subjects (40%) kept grade items at the same level over the years.
4.1.2. Observation of Teacher Input (TI) Per Subject over Time
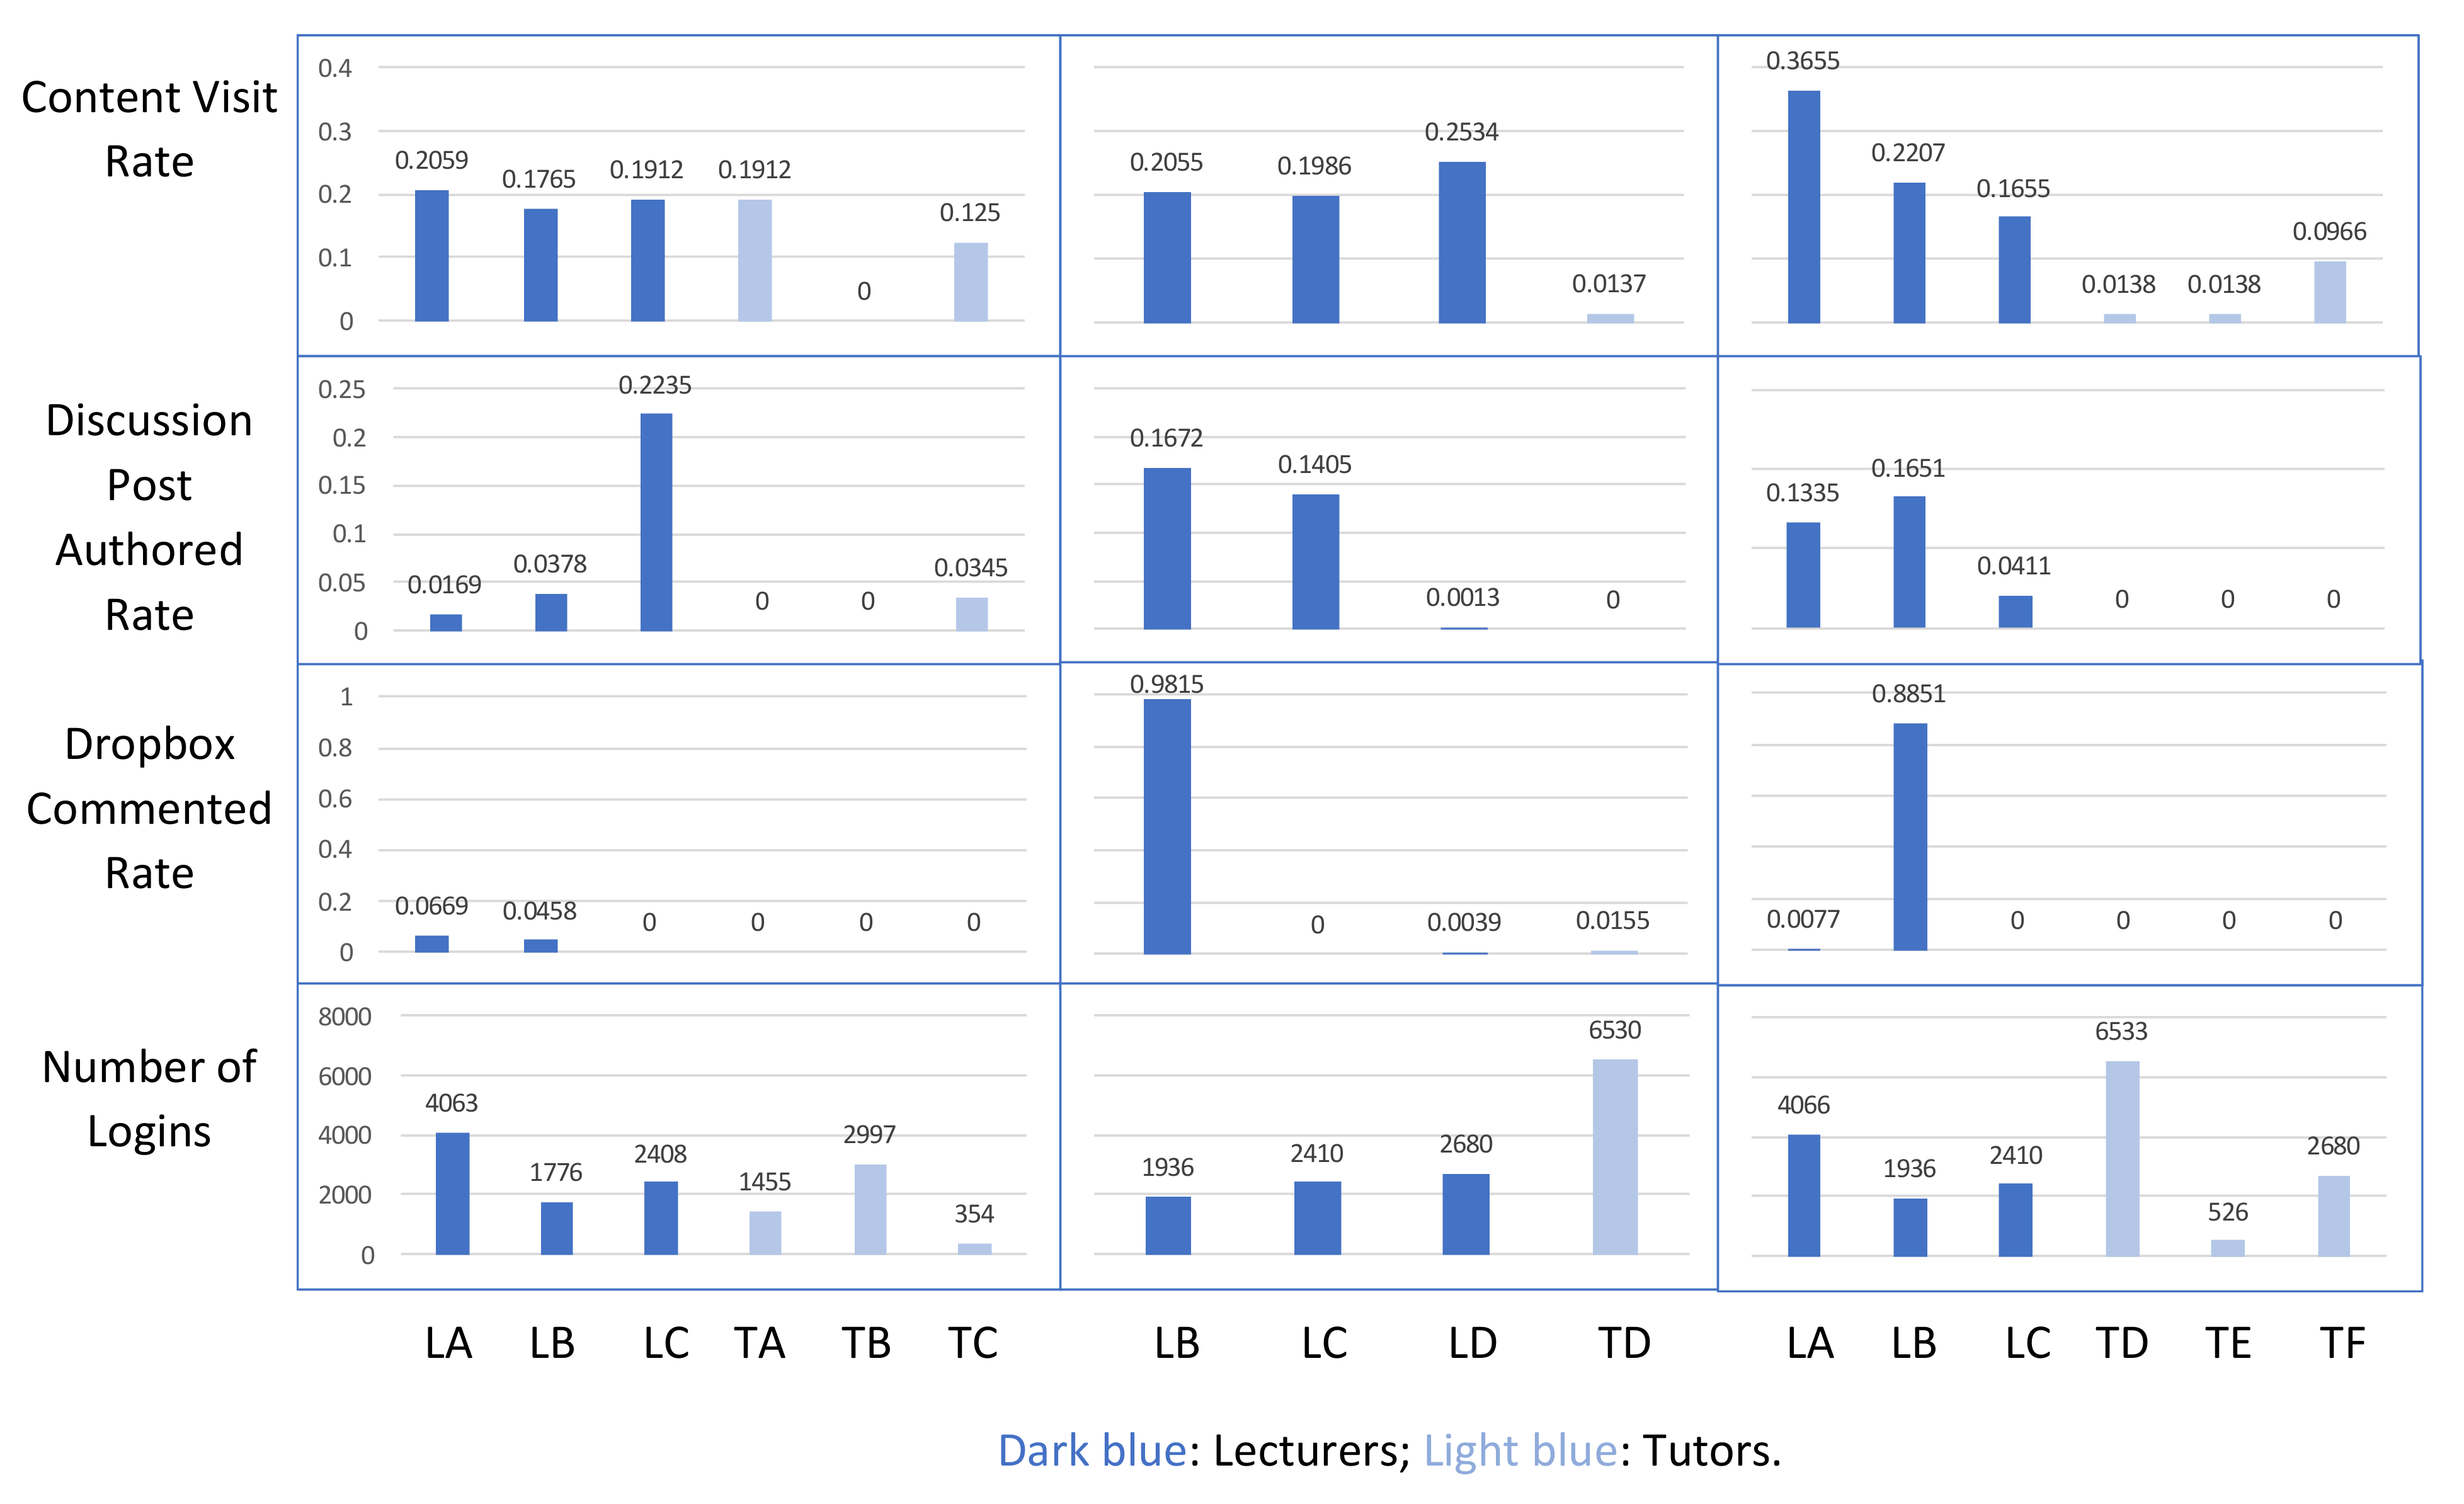
- There were seven subjects (30%) where teachers did not give any feedback on student assignments, and eleven subjects (48%) where it seemed that only the lecturer actively gave feedback on student assignments, but not the tutors.
- In nine subjects (39%) teachers did not use the discussion boards as one type of activity.
- The research team considered these two points interesting as these factors may have impacted on students’ assignment completion and content completion rates. Therefore, correlations between these factors were examined in the next step of data analysis.
4.1.3. Observation of Student Engagement (SE) Per Subject over Time
4.2. Results from Stage 2: Correlation between Student Engagement (SE) with Course Content (CC) and Teacher Input (TI)
- There appears to be a negative linear relationship between “Number of Content” (CC) and students’ “Content Complete Rate” (SE), and it seems the number of content pieces that can result in an optimum content complete rate of 50% is around 60. For instance, in Subject 7 the numbers of content pieces were between 61 and 113 over the years, with a 50% content completion rate. Subject 4 had content pieces ranging from 8 to 18, the completion rates were 76% to 43%. In Subject 16, the numbers of content pieces were between 83 to 230 over the years, and the completion rates were 38% to 20%.
- There appears to be a positive linear relationship between the “Content Complete Rate” (SE) and the total number of discussion posts created and replied to (SE)-indicating students tend to have more questions or discussions if they complete more content.
- There appears to be a positive linear relationship between students’ number of logins to the system (SE) and their “Time in Content” (SE)—indicating that the more the students log in to the system, the more time they spent on the course content.
- There appears to be a negative linear relationship between the “Dropbox Submission Rate” (SE) and the number of dropboxes (CC), indicating that the probability of students completing assignment reduce as the number of assignments increase. Students’ dropbox submission rate was at the highest when the number of assignments is four. A potential explanation for this observation is some subjects included assignment extension request dropboxes, which would only be used by a small number of students who required extensions. For instance, when Subject 10 increased the number of dropboxes from four to eight, the Dropbox Submission Rate dropped from 79% to 23%.
- There appears to be a positive linear relationship between the “Dropbox Submission Rate” (SE) and the “Dropbox Comment Rate” (TI)—indicating that the more comments there are from teachers, the higher the probability of students completing their assignments.
- There appears to be a positive linear relationship between the “Sum of All Instructors Comment Rate” (TI) and “Content Complete Rate” (SE), indicating that the more comments are made by teachers, the higher the probability of students completing the subject content.
5. Discussions
6. Limitations and Challenges
7. Conclusions
Author Contributions
Funding
Institutional Review Board Statement
Informed Consent Statement
Data Availability Statement
Conflicts of Interest
References
- Muir, T.; Milthorpe, N.; Stone, C.; Dyment, J.; Freeman, E.; Hopwood, B. Chronicling engagement: Students’ experience of online learning over time. Distance Educ. 2019, 40, 262–277. [Google Scholar] [CrossRef]
- Kember, D.; Ellis, R.A. Admission and Success for Low SES University Students: Report on a HEPPP 2018 National Priorities Pool Project; Department of Education, Skills and Employment: Canberra, ACT, Australia, (under review).
- SOLAR. What Is Learning Analytics? 2020. Available online: https://www.solaresearch.org/about/what-is-learning-analytics/ (accessed on 31 August 2021).
- Rienties, B.; Boroowa, A.; Cross, S.; Kubiak, C.; Mayles, K.; Murphy, S. Analytics4Action evaluation framework: A review of evidence-based learning analytics interventions at the Open University UK. J. Interact. Media Educ. 2016, 1, 1–11. [Google Scholar]
- Villano, R.; Harrison, S.; Lynch, G.; Chen, G. Linking early alert systems and student retention: A survival analysis approach. High. Educ. 2018, 76, 903–920. [Google Scholar] [CrossRef]
- Ferguson, R.; Shum, S.B. Social learning analytics: Five approaches. In Proceedings of the Presented at the 2nd International Conference on Learning Analytics and Knowledge, Vancouver, CO, Canada, 29 April–2 May 2012; pp. 23–33. [Google Scholar] [CrossRef]
- Swenson, J.A. Understanding ethical concerns in the design, application, and documentation of learning analytics in post-secondary education. Doctoral Dissertation, University of Minnesota, Minneapolis, MN, USA, 2015. [Google Scholar]
- Ellis, R.A.; Han, F.; Pardo, A. Improving learning analytics–Combining observational and self-report data on student learning. J. Educ. Technol. Soc. 2017, 20, 158–169. [Google Scholar]
- López Zambrano, J.; Lara Torralbo, J.A.; Romero Morales, C. Early prediction of student learning performance through data mining: A systematic review. Psicothema Oviedo 2021, 33, 456–465. [Google Scholar]
- Timms, M. Big Data in Education: A guide for Educators; Centre for Strategic Education Occasional Paper: Melbourne, VIC, Australia, (No. 139); 2015; pp. 1–10. [Google Scholar]
- Corrin, L.; De Barba, P.G.; Bakharia, A. Using learning analytics to explore help-seeking learner profiles in MOOCs. In Proceedings of the Seventh International Learning Analytics Knowledge Conference, Vancouver, CO, Canada, 13–17 March 2017; pp. 424–428. [Google Scholar]
- Czerkawski, B.C. When learning analytics meets e-learning. Online J. Distance Learn. Adm. 2015, XVIII, 2. [Google Scholar]
- Dietz-Uhler, B.; Hurn, J.E. Using learning analytics to predict (and improve) student success: A faculty perspective. J. Interact. 2013, 12, 17–26. [Google Scholar]
- Ellaway, R.H.; Pusic, M.V.; Galbraith, R.M.; Cameron, T. Developing the role of big data and analytics in health professional education. Med Teacher. 2014, 36, 216–222. [Google Scholar] [CrossRef] [PubMed]
- Colvin, C.; Rogers, T.; Wade, A.; Dawson, S.; Gasevic, D.; Buckingham Shum, S.; Nelson, K.; Alexander, S.; Lockyer, L.; Kennedy, G.; et al. Student Retention and Learning Analytics: A Snapshot of Australian Practices and a Framework for Advancement. Australian Government Office for Learning and Teaching. 2016. Available online: https://opus.cloud.lib.uts.edu.au/bitstream/10453/117173/1/AUS_OLT_LearningAnalytics_2016.pdf (accessed on 31 August 2021).
- Fisher, J.; Valenzuela, F.-R.; Whale, S. Learning Analytics: A bottom-up Approach to Enhancing and Evaluating Students’ Online Learning. Government Office for Learning and Teaching. 2014. Available online: https://ltr.edu.au/resources/SD12_2567_Fisher_Report_2014.pdf (accessed on 31 August 2021).
- West, D.; Heath, D.; Huijser, H.; Lizzio, A.; Toohey, D.; Miles, C.; Searle, B.; Bronnimann, J. Learning analytics: Assisting UniVersities with Student Retention. Government Office for Learning and Teaching. 2015. Available online: https://researchrepository.murdoch.edu.au/id/eprint/35134/ (accessed on 31 August 2021).
- Garrison, D.R.; Anderson, T.; Archer, W. Critical inquiry in a text-based environment: Computer conferencing in higher education. Internet High. Educ. 2000, 2, 87–105. [Google Scholar] [CrossRef] [Green Version]
- Kovanović, V.; Gašević, D.; Dawson, S.; Joksimović, S.; Baker, R.S.; Hatala, M. Penetrating the Black Box of Time-on-task estimation. In Proceedings of the Presented at the Fifth International Conference on Learning Analytics and Knowledge, New York, NY, USA, 16–20 March 2015; Available online: https://dl.acm.org/doi/abs/10.1145/2723576.2723623 (accessed on 31 August 2021).
- Rapanta, C.; Botturi, L.; Goodyear, P.; Guàrdia, L.; Koole, M. Online university teaching during and after the Covid-19 crisis: Refocusing teacher presence and learning activity. Postdigital Sci. Educ. 2020, 2, 923–945. [Google Scholar] [CrossRef]
- Kember, D.; Douglas, T.; Muir, T.; Salter, S. Umbrella action research projects as a mechanism for learning and teaching quality enhancement. High. Educ. Res. Dev. 2019, 38, 1285–1298. [Google Scholar] [CrossRef]
- Fan, S. Learning analytics: A growing interest for Big Data analytics in Australian higher education. In Proceedings of the 4th International Conference on BigData Analysis and Data Mining, Paris, France, 7–8 September 2017. [Google Scholar]
- Fan, S.; Garg, S.; Yeom, S. Exploring the Use of Big Data Analytics for Improving Support to Students in Higher Education. In Advances in Artificial Intelligence. Lecture Notes in Computer Science; Kang, B., Bai, Q., Eds.; Springer: Cham, Switzerland, 2016; Volume 9992. [Google Scholar] [CrossRef]
- Kember, D.; Leung, D.; Prosser, M. Has the open door become a revolving door? The impact on attrition of moving from elite to mass higher education. Stud. High. Education. 2019, 46, 258–269. [Google Scholar] [CrossRef]
- Killingback, C.; Drury, D.; Mahato, P.; Williams, J. Student feedback delivery modes: A qualitative study of student and lecturer views. Nurse Educ. Today. 2020, 84, 104237. [Google Scholar] [CrossRef] [PubMed]
- Green, R.A.; Whitburn, L.Y.; Zacharias, A.; Byrne, G.; Hughes, D.L. The relationship between student engagement with online content and achievement in a blended learning anatomy course. Anat. Sci. Education 2018, 11, 471–477. [Google Scholar] [CrossRef] [PubMed]
- Fan, S.; Garg, S.; Kregor, G.; Yeom, S.; Wang, Y. Exploring the Potential of Learning Analytics to Measure Student Participation and Engagement: Researchers’ Experiences from an Exploratory Study. In Proceedings of the Australian Association for Research in Education (AARE) Annual Conference, Melbourne, VIC, Australia, 28 November–2 December 2021; University of Sydney: Sydney, NSW, Australia, 2021. [Google Scholar]
- Fredricks, J.A.; Blumenfeld, P.C.; Paris, A.H. School engagement: Potential of the concept, state of the evidence. Rev. Educ. Research. 2004, 74, 59–109. [Google Scholar] [CrossRef] [Green Version]
- Bensimon, E.M. Foreword. In Student Engagement in Higher Education; Harper, S.R., Quaye, S.J., Eds.; Routledge: New York, NY, USA; London, UK, 2009; pp. xxi–xxvi. [Google Scholar]
- Hess, D.J.; Lanig, H.; Vaughan, W. Educating for equity and social justice: A conceptual model for cultural engagement. Multicult. Perspectives 2007, 9, 32–39. [Google Scholar] [CrossRef]
- Garrison, D.R.; Anderson, T.; Archer, W. The first decade of the community of inquiry framework: A retrospective. Internet High. Educ. 2010, 13, 5–9. [Google Scholar] [CrossRef]
- Dyment, J.; Stone, C.; Milthorpe, N. Beyond busy work: Rethinking the measurement of online student engagement. High. Educ. Res. Dev. 2020, 39, 1440–1453. [Google Scholar] [CrossRef]
- Fan, S.; Wu, Q.; Yang, Y. Learning analytics for prediction and measurement of student retention and performance in Higher Education in Australia and New Zealand: A systematic Review. In progress.


| Disciplines | Subjects |
|---|---|
| Education | Subjects 1 to 6 |
| Humanities | Subjects 7 to 9 |
| Engineering and ICT | Subjects 10 to 14 |
| Natural Sciences | Subjects 15 to 23 |
| Feature Name | Description |
|---|---|
| Number of Content | Number of content pieces per subject per semester. |
| Number of Content Required | Number of content pieces required for students of this subject per semester. |
| Number of Dropboxes | Number of assignments per subject per semester. |
| Number of Grade Items | Number of grade items for this subject. |
| Number of Discussion Posts | Number of posts from both students and teachers (including lecturers and tutors) in the discussion boards. |
| Feature Name | Description |
|---|---|
| Content Visit Rate | Number of content visited/number of contents. |
| Discussion Post Authored Rate | Number of discussion posts authored by the teacher/total number of discussion posts. |
| Dropbox Commented Rate | Number of comments from teachers/number of student assignments submitted to dropboxes. |
| Number of Logins | Number of logins to the LMS. |
| Feature Name | Description |
|---|---|
| Average Content Complete Rate | Average number of content pieces completed by a student/total number of content pieces in the subject. |
| Average Discussion Post Create Rate | Average number of discussion posts created by a student/total number of discussion posts. |
| Average Discussion Post Read Rate | Average number of discussion posts read by a student/total number of discussion posts. |
| Average Discussion Post Reply Rate | Average number of discussion post replies by a student/total number of discussion posts |
| Categories | Feature Name | Description |
|---|---|---|
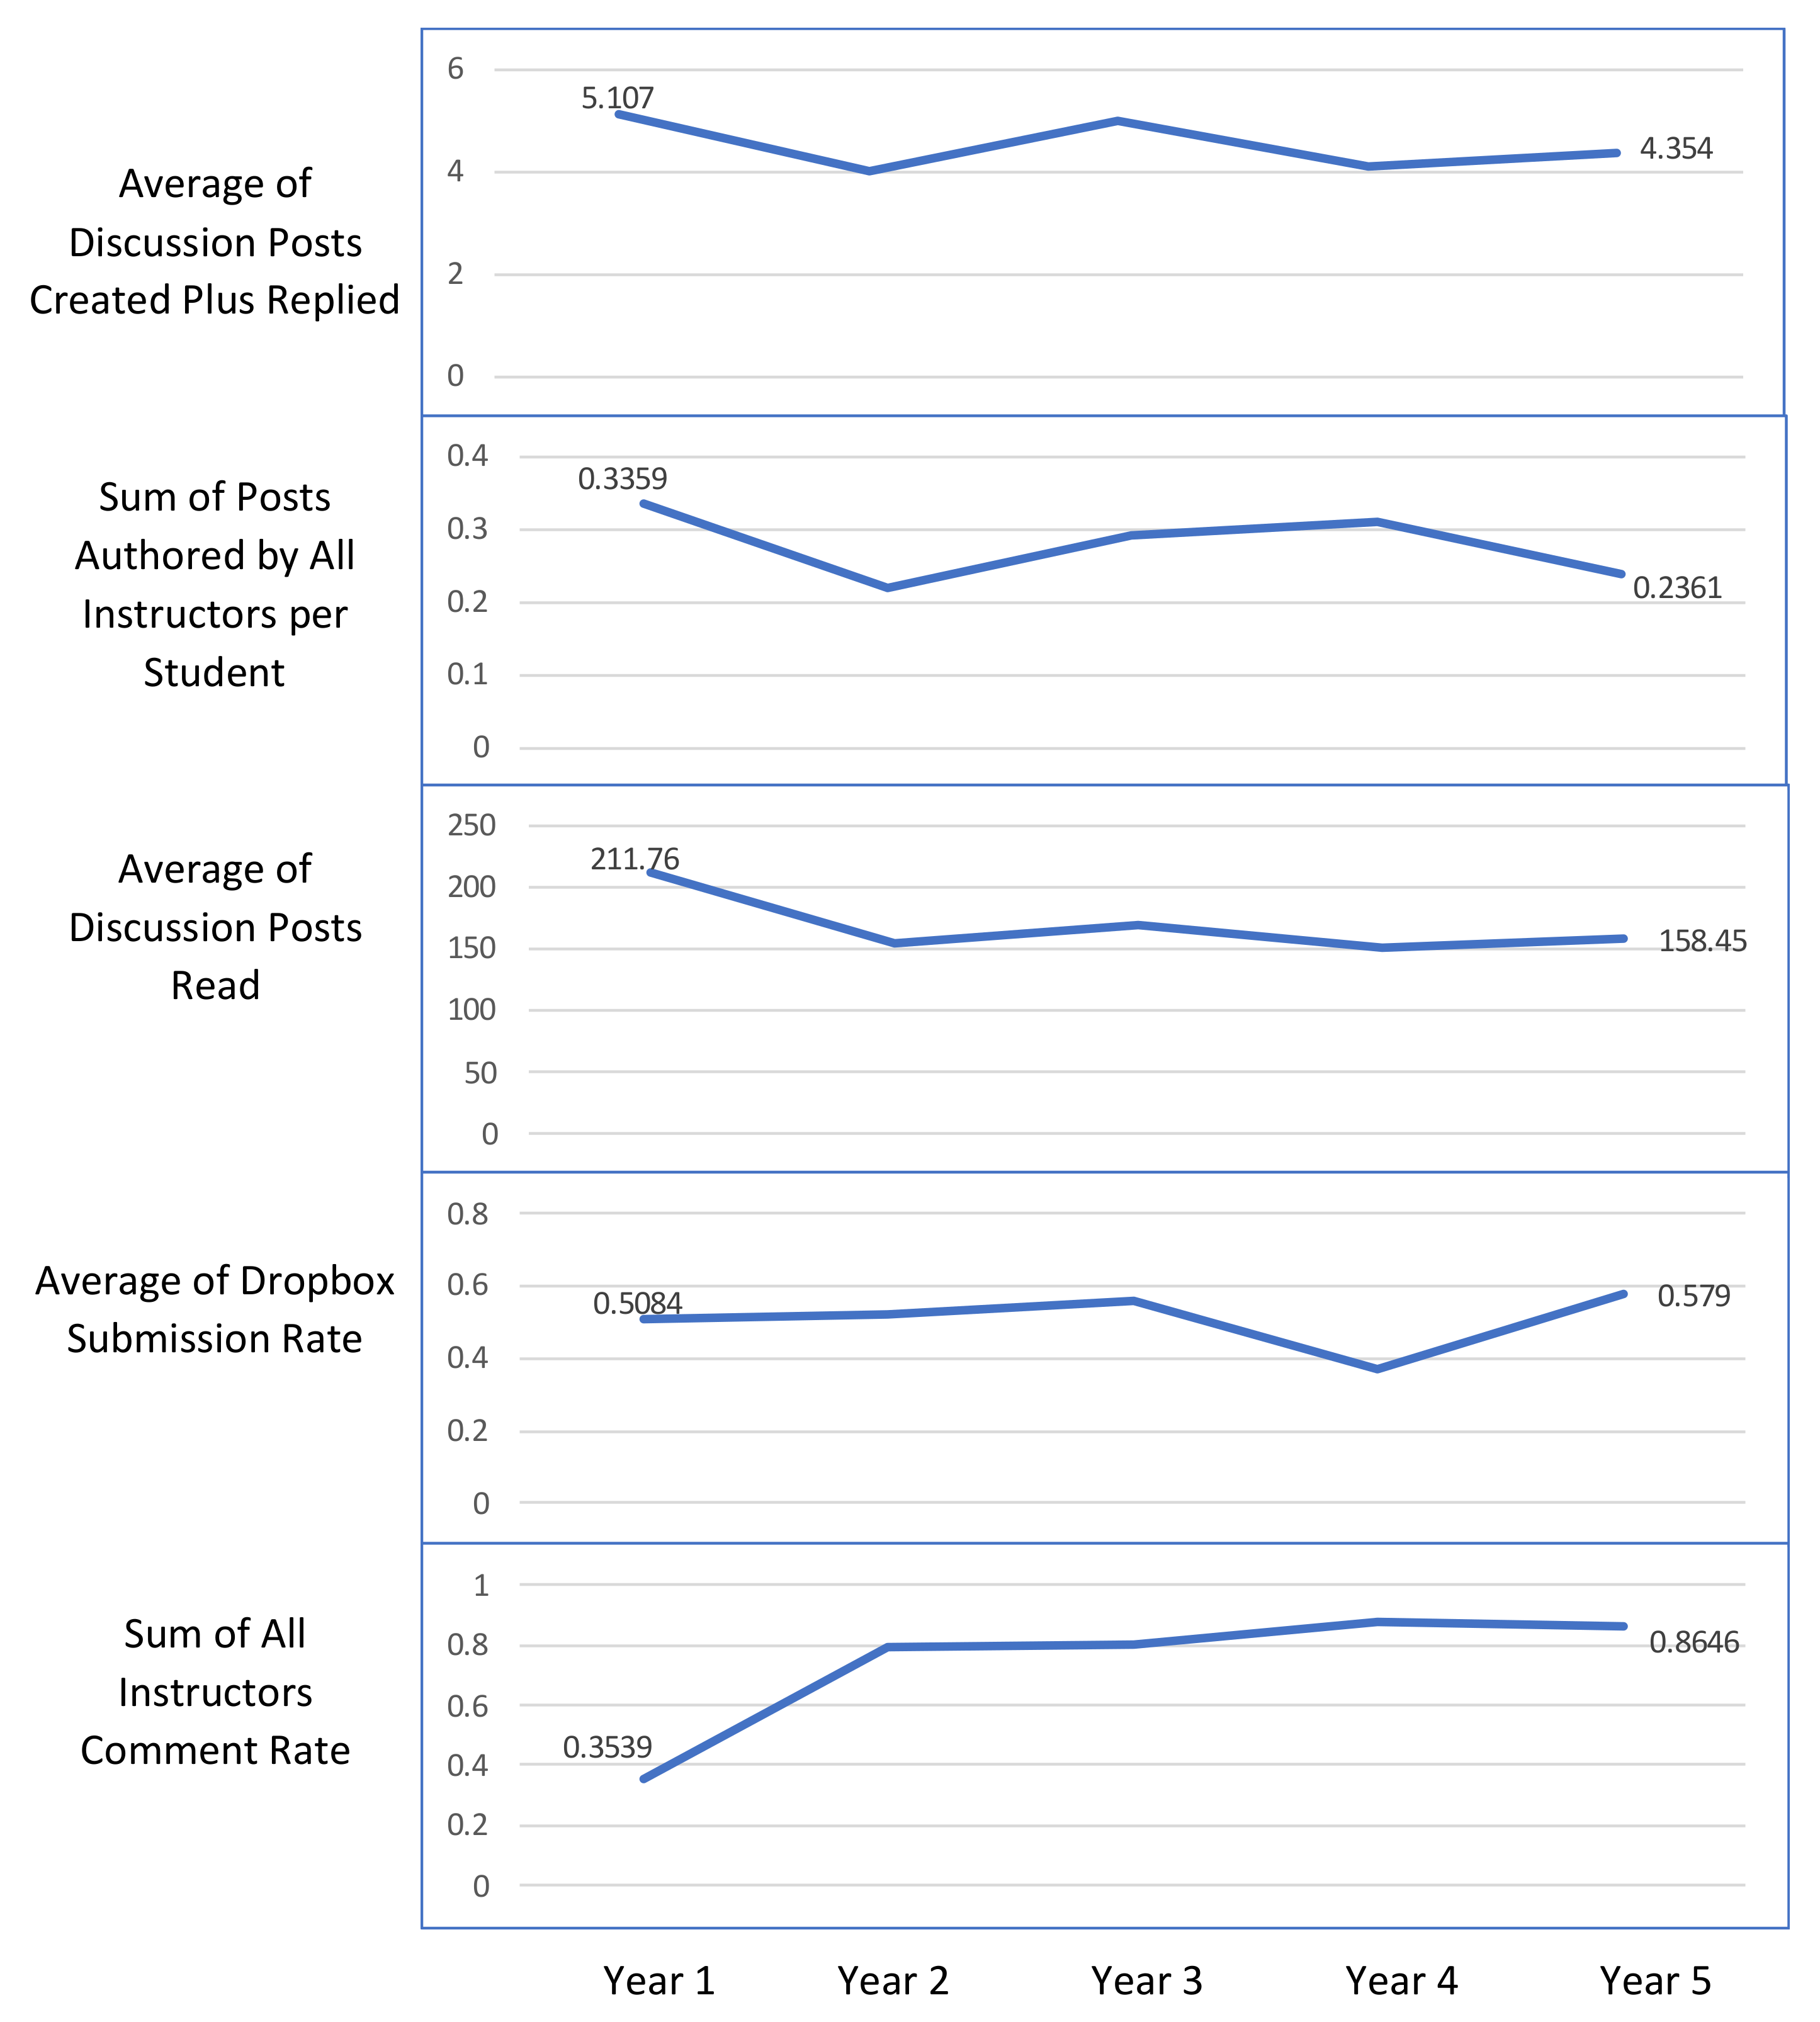
| Discussions | Average of Discussion Posts Created Plus Replied | Number of discussion posts created and replied by all students/number of students enrolled in the unit. |
| Sum of Posts Authored by All Instructors per Student | Sum of all discussion posts authored by instructors/number of students enrolled in the unit. | |
| Average of Discussion Posts Read | Number of discussion posts read by all students/number of students enrolled in the unit. | |
| Assessment | Average of Dropbox Submission Rate | Number of dropbox submissions by student/number of dropboxes. |
| Sum of All Instructors Comment Rate | Sum of all instructors’ comments/number of assignment submissions. |
Publisher’s Note: MDPI stays neutral with regard to jurisdictional claims in published maps and institutional affiliations. |
© 2021 by the authors. Licensee MDPI, Basel, Switzerland. This article is an open access article distributed under the terms and conditions of the Creative Commons Attribution (CC BY) license (https://creativecommons.org/licenses/by/4.0/).
Share and Cite
Fan, S.; Chen, L.; Nair, M.; Garg, S.; Yeom, S.; Kregor, G.; Yang, Y.; Wang, Y. Revealing Impact Factors on Student Engagement: Learning Analytics Adoption in Online and Blended Courses in Higher Education. Educ. Sci. 2021, 11, 608. https://doi.org/10.3390/educsci11100608
Fan S, Chen L, Nair M, Garg S, Yeom S, Kregor G, Yang Y, Wang Y. Revealing Impact Factors on Student Engagement: Learning Analytics Adoption in Online and Blended Courses in Higher Education. Education Sciences. 2021; 11(10):608. https://doi.org/10.3390/educsci11100608
Chicago/Turabian StyleFan, Si, Lihua Chen, Manoj Nair, Saurabh Garg, Soonja Yeom, Gerry Kregor, Yu Yang, and Yanjun Wang. 2021. "Revealing Impact Factors on Student Engagement: Learning Analytics Adoption in Online and Blended Courses in Higher Education" Education Sciences 11, no. 10: 608. https://doi.org/10.3390/educsci11100608
APA StyleFan, S., Chen, L., Nair, M., Garg, S., Yeom, S., Kregor, G., Yang, Y., & Wang, Y. (2021). Revealing Impact Factors on Student Engagement: Learning Analytics Adoption in Online and Blended Courses in Higher Education. Education Sciences, 11(10), 608. https://doi.org/10.3390/educsci11100608


