Article

Developing a Motion Infographic-Based Learning System for Effective Learning

Graduate School of Design, National Yunlin University of Science and Technology, Douliou, Yunlin 640, Taiwan
*
Author to whom correspondence should be addressed.
Educ. Sci. 2020, 10(9), 247; https://doi.org/10.3390/educsci10090247
Submission received: 3 August 2020 / Revised: 9 September 2020 / Accepted: 11 September 2020 / Published: 15 September 2020

Abstract

:
The motion infographic system combines the characteristics of continuous images and the simplification of information, which can make up for the disadvantages of content in static images, and may have the advantage of deepening the impression of infographics. As Taiwan’s elementary school resource classes (elementary school pupils with mild disabilities or learning challenges) do not yet have exclusive learning content, resource class teachers prepare their own teaching content, but they cannot integrate existing learning lists and network resources. Therefore, this study designed and developed a motion infographic system to assist with resource class learning. The theme of this motion infographic system uses a very rare natural phenomenon in Taiwan, the Arctic oscillation, which in early 2016 brought to Taiwan the lowest recorded temperature on the flat ground. The study analyzed the learning effectiveness of this system applied to resource classes through an experimental and control group. The final result shows that the motion infographic system was different from the original content used in the resource class. The improvement in the academic achievement and the grasp of the image shapes of the experimental group was better than the control group, which verified that the motion infographic system can improve learning outcomes in a resource class.

1. Introduction

With the advancement of information in today’s society and the popularization of technology products, more schools have responded to the trend of technology promoting the use of multimedia digital systems for classroom teaching [1,2]. The advent of digital systems has changed the way we read and learn and has also become a future trend [3,4]. Digital systems are not constrained by time and place, so the use of web-based education or e-learning systems has grown exponentially [5]. Teachers are also aware that the current curriculum and teaching methods are designed for the previous generation and they are not suitable for the new generation of students [6]. On the other hand, Woo et al. stated that “In the 21st century, digital resources are introduced into teaching through digital system communication and platform learning, effectively improving the learning process.” [7]; and through carefully designed training, skills and creativity can be enhanced [8]. In response to the use of digital systems in modern education, many teachers use digital systems to strengthen students’ knowledge and concepts, making up for the shortcomings of text description through the continuous actions of images [9]. Most Taiwanese elementary school children habitually use computers and smart phones. Motion images are the most attractive and most commonly used media format for school children. This study used the characteristics of motion images to present knowledge in a motion image system for students’ learning.

1.1. Background

The trending image form in recent years is Infographic. Infographic is a combination of “information” and “graphic”, so that readers can easily understand the image and it leaves an impression in their minds through the image characteristics. The blunt text and data are interesting and energetic, presenting data, information or knowledge in a visual format (Figure 1) [10,11]. The infographic is often applied to complicated and abundant information that must be clearly and accurately explained or expressed, so images are used to replace text explanations. These include different types of document files, maps, signs, news, posters, graphic design, advertising, media, etc. The main thrust of the design is to simplify things [10,12]. The most commonly used feature of infographics is that the designed images achieve the effect of conveying messages and they are easy to understand. They are more attractive than a text of great length and they are regarded as important tools for transmitting information today [13]. In the process of sharing the message communication, language, words, and images are used to express meaning, and the implication of images is better than languages and words. Because vision is the most direct form of communication, the brain easily interprets and analyses the text [14]. The purpose of the infographic is to help students to understand the content of the text, and then convert the difficult text in the natural climate into a motion image. Charts and images can induce students’ learning motivation [15]. The human response to text stimuli is part of acquired learning, with the image stimuli an instinctive reaction to acquired learning, making it easier to learn via images [16]. As the image is accepted by most learners, it must have its advantages. For example, the static or dynamic image is the most effective and direct way to acquire knowledge during the learning process [17]. After the image is rearranged through planned organization, the image message transmission system allows learners to integrate knowledge, enhance thinking, and help to understand and learn [18]. The Ministry of Education also pointed out that the application of digital technology in Taiwan learning is a key system of expectations; therefore, the transfer function and image characteristics of infographics may be suitable for use as a digital system for resource class learning [19].

1.2. Motivation

Resource classes offer a unique form of education in Taiwan falling between ordinary and special classes. They are targeted at students with mild disabilities (usually undiagnosed) and gifted students [20]; resource classes are designed mainly for students studying in ordinary classes but who still need special education services to adapt to learning difficulties [20,21]. From previous research on resource classes and the experience of resource class teachers, we know that students in resource classes are easily able to recognize single sounds and fonts, but they encounter problems when reading the full text [20,22,23]. These problems include a failure to understand the meaning of the content; they cannot get the relevant information, or they do not know the learning method and are unable to define the content focus or to understand the meaning of the content, which in turn affects their learning capabilities in other disciplines [24]. In a study on learning disabled learners, Van Garderen [25] explored whether images could effectively improve the problem-solving ability in applied problems. The study confirmed that images could improve the problem-solving ability of people with learning disabilities and offer positive help for learning, as specific things could be better understood and learned than abstract concepts.
Therefore, this study assumes that if motion images are used in teaching, and the characteristics of infographics are designed to convert text and data into images to reduce complexity, it could help resource class students to understand textbook knowledge and reduce the pressure of understanding the text; just like the American natural science classroom, in addition to the specified textbooks, many teachers use scientific textbooks (Design for Science, DS) designed with their own teaching experience to achieve the best evolutionary process through science and digital design [7,26].

1.3. Research Focus and Limiting Conditions

The resource class is a unique education system in Taiwan. Although its nature is similar to that of a Special Education school (or class), the original intention was to enable children with symptoms of mild disabilities to maintain normal study and to integrate into the school’s group life, with minimum separation, so as not to make them feel any different from most of their classmates. However, not all primary schools in the villages, towns, counties and cities in Taiwan have set up such resource classes. Only large primary schools that are in high demand have the funds to apply for resource classes and to employ fixed and specialized resource class teachers [20,21,23]. The Ministry of Education stipulates that the number of primary resource classes can only be 10, at most, and that these students must be divided into an experimental group and a control group, with each group consisting of five students at most. The aim of this study is to apply the findings to a teaching demonstration school that is characterized by a large number of students in the resource classes. Therefore, the total number of samples in this paper is 24, which is 1.5 times that of the ordinary resource classes. The sampling of resource classes is difficult and requires the cooperation of professional resource class instructors. The learning efficiency of resource classes is complex and needs to be solved immediately. In addition, due to the small number of resource classes, the experimental design cannot cover the contents of large data right now. However, there is no motion infographic system applied to resource classes so far, because it is a new system and a rare experimental group. Therefore, we designed this system, with a wish to help improve learning efficiency. Consequently, the research purpose is to turn ill-defined problems into well-defined problems, which are closer to solvable, and could be a preliminary study of similar models.

2. Materials and Methods

The “experimental group and control group unequal group pre-test and post-test” of the quasi-experimental research method was adopted as the experimental method. The subject was a resource class from an elementary school in New Taipei City. The experimental group used a motion infographic system, and the control group maintained the original teaching method. In addition to the different teaching tools, the experimental group and the control group were both taught by the same teachers to ensure the consistency of content so that the only difference was the teaching tools; discussion and evaluation were completed after the course so that the children could discuss and think in groups. The discussions among the schoolchildren were observed.

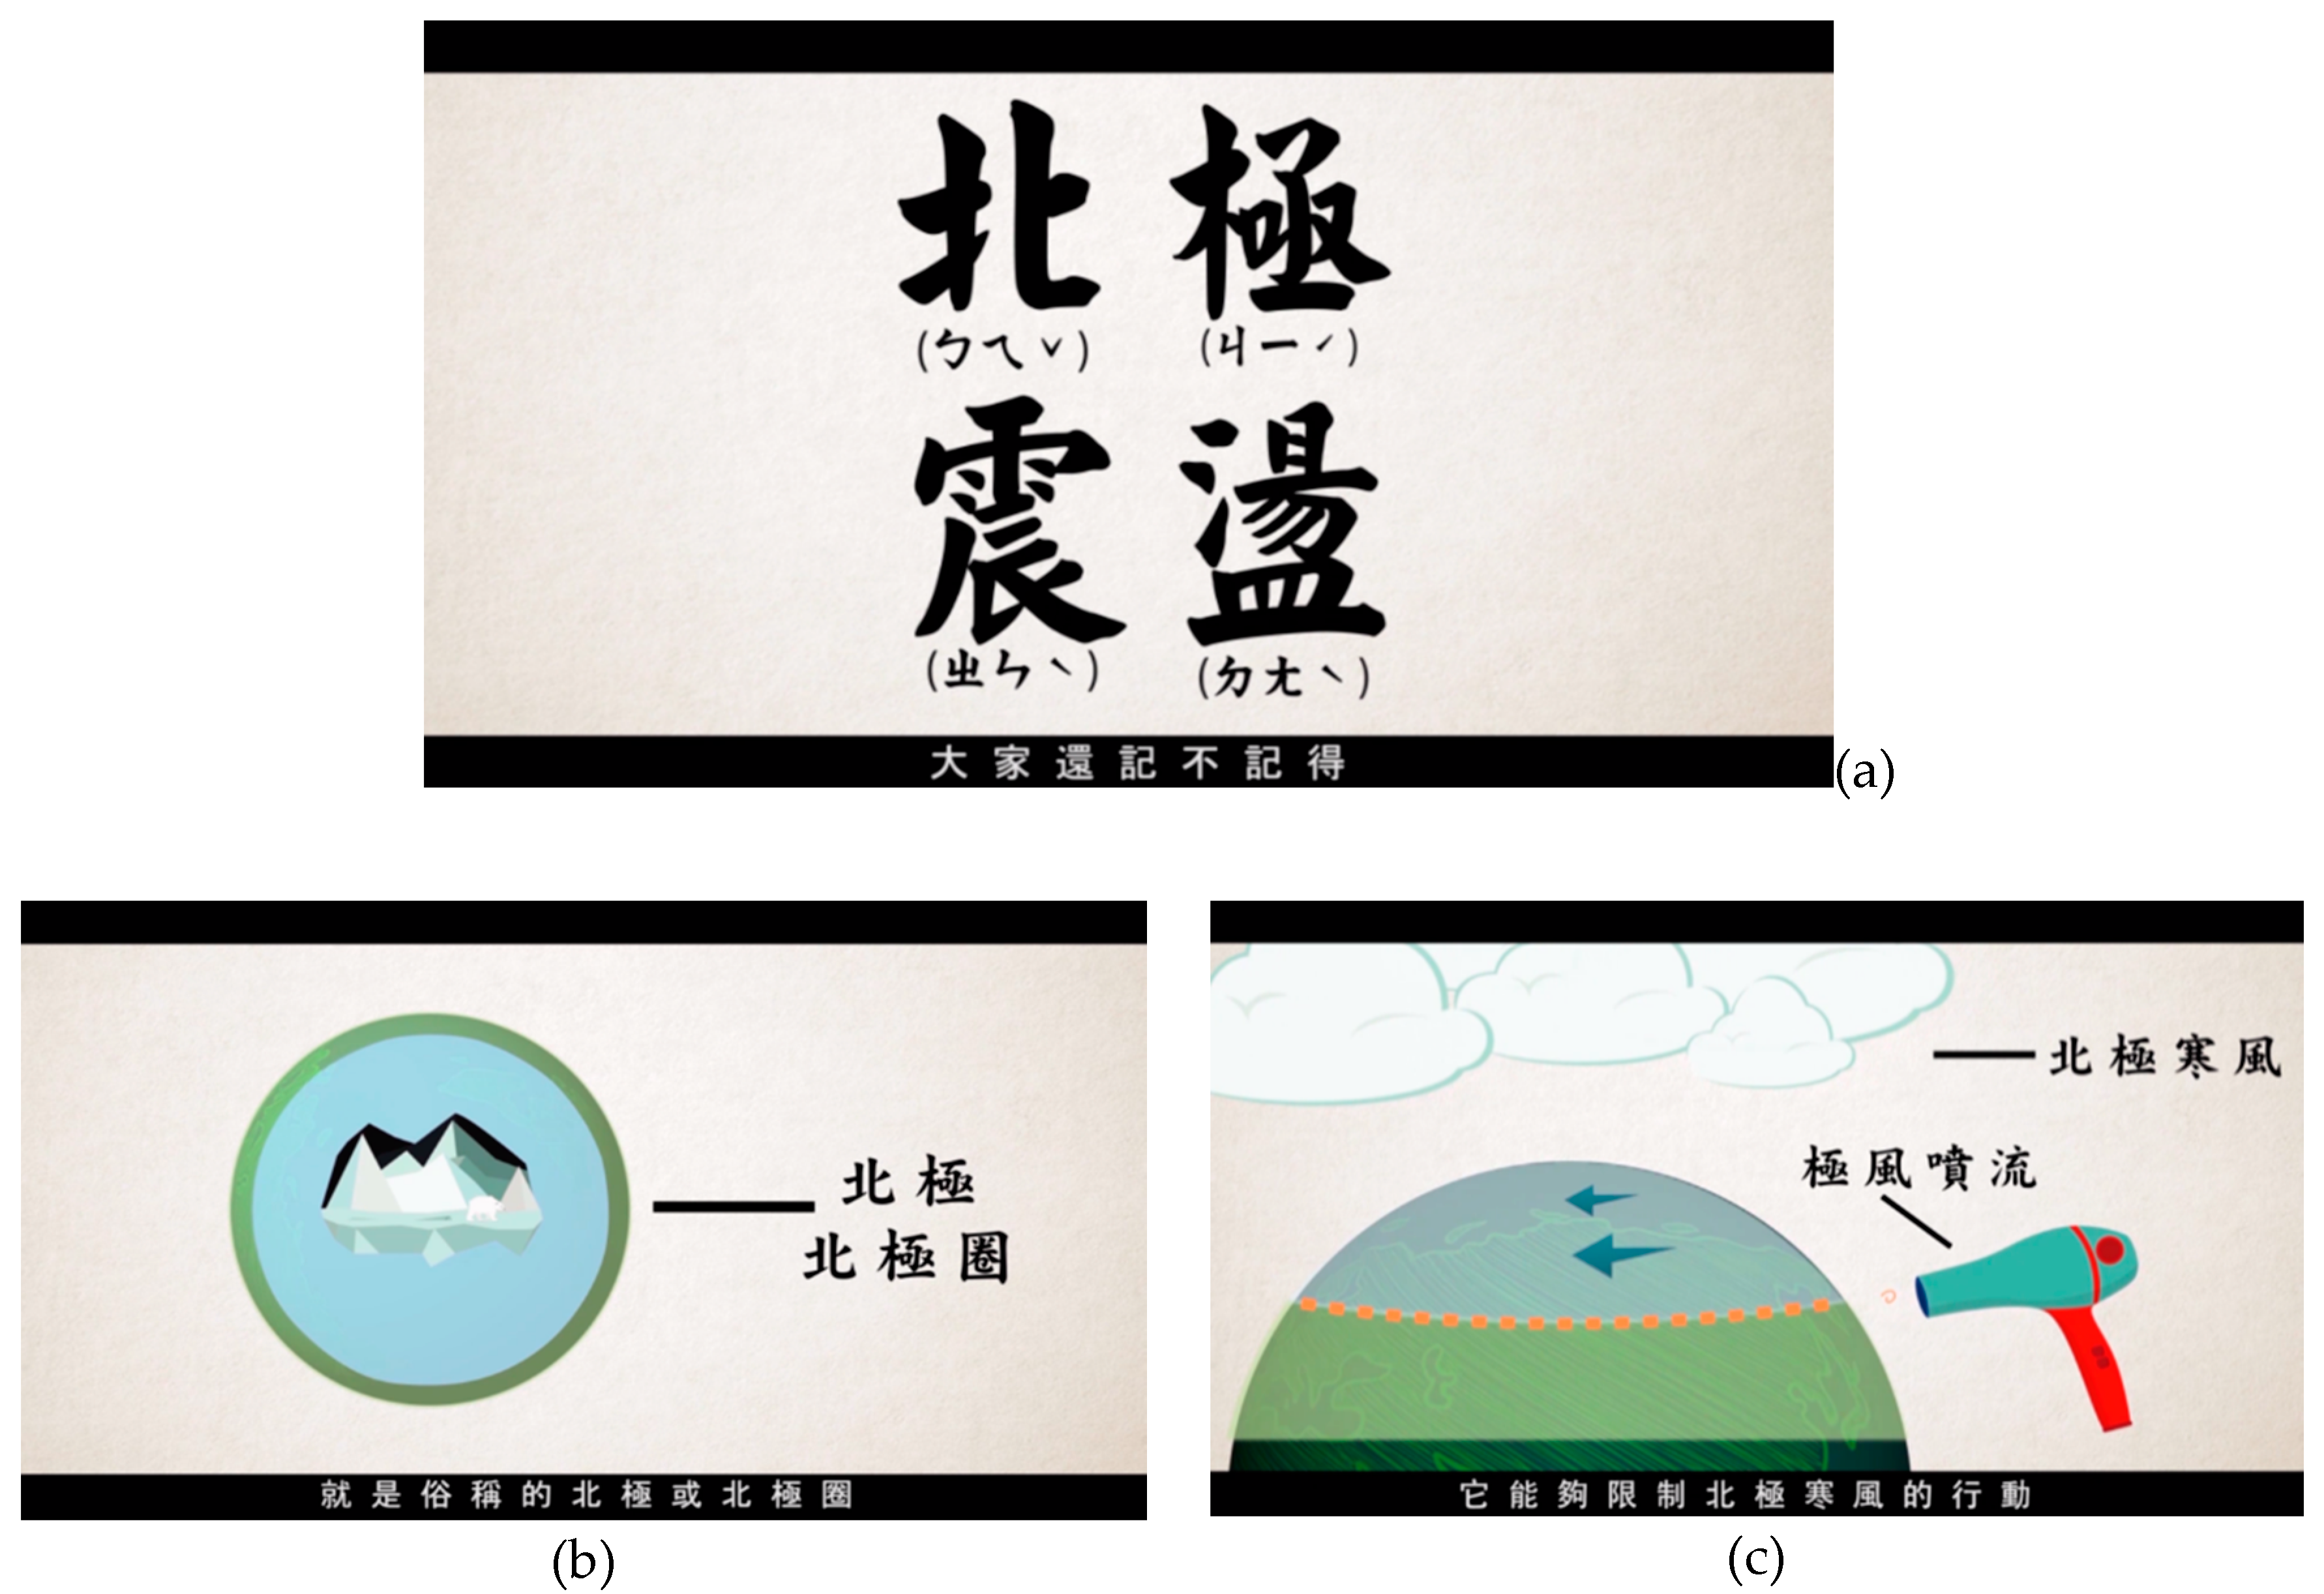
2.1. Topic: Arctic Oscillation

Arctic oscillation (AO) is a rare climatic phenomenon that occurred in Taiwan in 2016. At that time, it caused a large amount of snow to fall on the high mountains of Taiwan, and ice storms occurred on flat land, which caused Taiwan’s flat land temperature to fall to a new low. AO refers to one of the most significant phenomena in the area north of the 20 degrees latitude line in the northern hemisphere. The amplitude of change is significant in winter and the AO index is used in meteorology to explain this phenomenon. When the AO index is positive, the atmospheric pressure in the arctic region is relatively low, while the atmospheric pressure in the middle and high latitudes is relatively high. At this time, the westerly jets (areas with the highest wind speed, also called polar wind jets) near the Arctic are generally stronger. When the westerly jet is strong (that is, the AO index is positive), the weather system tends to move east-west, and the cold air in the arctic regions is less likely to go south to affect the weather in the mid-latitude regions. North America is, for example, prone to warmer weather, countries in the Mediterranean region are prone to drought, and countries in Northern Europe are warmer and wetter. When the AO index is negative, the pressure in the polar region is relatively high, the pressure in the mid-latitudes is relatively low, and the westerly jet is also weak. When the westerly jets are weak, the weather system is more likely to move in a north-south direction. Currently, the cold air in the arctic regions is more likely to go south to affect the weather in the mid-latitude region [27,28].
Because, at that time, the polar wind jets in the Arctic Circle weakened, the Arctic cold winds crossed the polar wind jets, and went through the cold belt entering the temperate zone, which directly affected Taiwan. Record low temperatures hit Taiwan with a rare ice storm; this natural phenomenon is quite a rare experience for Taiwanese schoolchildren, as this phenomenon seldom happens in this region. Also, because it is quite special, it does not appear in natural science textbooks. This study chose the AO as the theme to bring newer natural scientific knowledge to school children.

2.2. Motional Infographic System: Design and Development

Infographics have become one of the most popular messaging tools in recent years. They contain information in images and can also carry stories, and provide more information or knowledge conveying it in a simplified visual design. This study made use of the characteristics of infographics to explain the more difficult natural science information in motion images that are easy to understand and can effectively transmit information. It is hoped that this novel visual image system will help the children in the resource class to better understand and learn the more difficult scientific concepts about this phenomenon.
The scripts (Figure 2) of the motion infographic system were compiled based on the official data of Central Weather Bureau. They were all edited in collaboration with the resource class teachers. The vision was based on high recognition and emphasized color recognition. Narrative techniques and keyword presentations were used for the content. The system design and production process were supervised jointly by the resource class teachers to ensure that the degree of difficulty and test evaluation was of a suitable standard for the resource class students.
The design and development of the motion infographic system was based on Adobe Inc. and it was founded by John Warnock and Charles Geschke software Adobe CC series Illustrator and Photo Shop (Adobe, Mountain View, California, U.S.A) which was used to draw the infographic objects; Premiere was used to connect motion pictures and edit them; and finally, After Effect was employed for post-production and sound effects (Figure 3 and Figure 4).

2.3. Experimental Object and Venue

The experimental subjects were made up of a total of 12 students from a resource class in an elementary school in New Taipei City. The age ranged from 9 to 11 years old after screening. The resource class teachers divided the group of 12 equally into 2 groups (so that the averages total semester grades of the two groups of students were the same). There were 6 students each in the experimental and the control groups. The resource class teachers confirmed that the 12 school children neither understood the theme of the AO nor had heard of it before. The conditions for the students in this resource class were as follows: the students (1) were not able to achieve the intellectual disabilities identified by Committee Responsible for Identification and Placement of Gifted and Disabled Students, and (2) needed to be in a resource class for only 2 or 3 subjects. The purpose of taking the school’s native resource class is to understand the use of the system in the classroom and the acceptance of the students in the normal establishment of an elementary school. The symptoms and learning behavior of the tested children before and after the experiment were classified and analyzed. The reason for adopting this experimental design was to observe the effects and differences in the performance of school children in the curriculum [29].
The experimental venue was a resource classroom in a national elementary school in New Taipei City. It was equipped with a desktop computer for teaching, a large screen and audio and video playback equipment. Since the school, and the class itself, are naturally formed complete groups, to effectively collect relevant data, the children were not informed of the experiment so that they could perform naturally in the learning environment. After the experiment was completed, both groups of students were informed about the purpose of the experiment, and the control group was also allowed to use the system designed in this study. The experiment was conducted only with the consent of the school and the children’s parents.

2.4. Experimental Process

The experiment lasted for 4 h, 1 h a week. The purpose of running the experiment once a week was to allow the motion infographic system to be separated by a week to see whether the resource class students would still carry an impression of the content after this period of time, rather than over a shorter period. Before the motion infographic system was placed in the experiment, a pre-test was carried out. This was used as a baseline for post-test analysis.
In the first week, the pre-test covering the natural science test content was conducted. The AO content was included in the test. The test mode was the same as the mid-term evaluation. Starting from the second week, the two groups attended courses which were conducted differently. While the experimental group was taught using a motion infographic system, the teachers of the control group used the original teaching method (generally resource class teachers collect books and online data themselves and then edit them onto study sheets, and then support this with YouTube or online video). The class in the third week took the form of a theme discussion. The teachers and children reviewed the theme and discussed their personal experience of the AO phenomenon in Taiwan. In the fourth week, the AO post-test was evaluated (Table 1, Figure 5 and Figure 6).

2.5. Learning Evaluation

The learning evaluation was to simulate the mid-term test questions of the elementary school and evaluate the effectiveness of the resource class in a form familiar to the schoolchildren (Figure 7). This assessment was compiled jointly with the resource class teachers, and the format used the “National Academy for Educational Research-National Elementary and Secondary School Question Bank Network” as a framework. This meant that not only could the resource class consider this a formal test, but it was also easily understood. The score was based out of 100 points. Through this evaluation, we can understand the effect on the resource class semester evaluation after the motion infographic system was used.

3. Results

3.1. Data Analysis

The paired sample t test was adopted for statistical analysis of the learning effectiveness evaluation of the experimental group and the control group. From Table 2 we learn that the average pre-test score of the control group was 64.1, while the average post-test score was 69.1. Therefore, the control group average grew by 5 points from the pre-test to the post-test; the experimental group’s pre-test average score was 74.1, and the post-test average score was 86.6. Therefore, the experimental group’s average score increased by 12.5 points after using the motion information imaging system. The table also shows that the control group’s pre-test and post-test results (t = −0.838, p > 0.05) did not reach a significant level in this experiment; while a significant level was reached with the pre-test and post-test results (t = −2.454 *, p < 0.05) of the experimental group that used the motion infographic system.
Table 2 shows that there were obvious differences in the pre-test scores of the two groups. Due to the different initial ability (preliminary knowledge), there may be different learning results. To confirm whether there are obvious differences, the pre-test scores of the experimental group and the control group were used as analysis of covariance (ANCOVA). The data 0.032 (p < 0.05) after the analysis shows that when the pre-test was a covariate, the initial ability was a factor affecting the post-test score. After the introduction of the motion infographic system, the experimental group’s post-test scores improved significantly compared to the control group, proving that this system does improve the learning outcomes of resource class students.
As it was difficult to collect samples, and as the number of the samples in this study was relatively large, ANOVA, as well as a t test, were carried out to obtain rigorous data. ANOVA shows that there was a significant difference, F (1, 23) = 4.994, p = 0.035 < 0.05, in the learning effect of the motion infographic system.

3.2. Performance Observation

Through experimental observation and data inference, it was found that in-depth learning only started when the students entered the theme of AO, which is knowledge to which they were exposed for the first time, while the content of the pre-test covered the natural science knowledge of the school, or the basic common knowledge to which the children were frequently exposed, and the difficulty is slightly higher than the content of the pre-test. If the formation and subsequent impact of the AO is expressed only with text and static pictures, or videos not designed for exclusive groups, it takes a long time for the students of the resource class to digest, so the control group’s performance did not improve much, and four of them got lower post-test scores than pre-test scores.
After the multimedia game teaching materials were put into the course attended by the experimental group students, their scores increased from 74.1 points to 86.6 points (Figure 8). It can be concluded from this data that the experimental group naturally absorbed knowledge and information through the characteristics of motion infographics, and from the continuous pictures of motion infographics, allowing them to understand the formation and subsequent impact of the AO, as well as every possible scenario and situation when the AO occurs.

4. Discussion and Conclusions

Motion infographics have come into more general use in recent years, and is often used in visual design. Motion infographics appear in the main vision of the award ceremony in Taiwan (for example: Golden Horse Awards, Golden Bell Awards, Golden Melody Awards), or YouTube channels (such as Taiwan Bar), and are included in the images and advocacy films of companies, enterprises and institutions. The reason they are used is because they are easy to understand and can deepen the image characteristics. Moreover, they offer good results in these fields, but, until now, they have not been used to assist in teaching, especially not in resource classes that require special learning contents or methods.
In the entire experimental process it was clear that the experimental group achieved better results in learning about the AO when they used the motion infographic system, and they were more able to fully express their personal experience of that time during the discussion process. When the resource class students were asked by the teachers to draw the types of weather conditions (snow, hail and frost) of the AO, the images drawn by the experimental group were more specific and different, while most of the images drawn by the control group were broader and less specific and the shape of the weather patterns were fuzzy and not as specific. We can infer from this that the use of a motion infographic system could increase the grasp of the shape and outline of the images by resource class students.
In conclusion, when applying the infographic for the resource class, the content could be more simple, clear and memorable. Using the digital motion infographic system can enhance the continuous presentation and fluency of the content. In addition, the digital motion system function combined with the characteristics of the infographic and matching the specific theme of natural science in assisting resource class students to be more helpful in learning is an important original intention of this research design and development. This is the process of turning ill-defined problems into well-defined problems, and it is expected to provide a basis and set of pilot examples for related research in the future.

5. Suggestion

(1) This study took the resource class as a preliminary point. After verification, it was also understood that the motion infographic system is positively helpful to the learning effectiveness of the resource class students, and the experimental results also show good acceptance. The composition of the students in the resource class was quite diverse, and the common components included hyperactivity, autism, Asperger, inattention, emotional instability, backward learning, language expression difficulties, cognitive and social difficulties and other behavioral performance. Based on the results of this study, it is recommended that relevant research scholars in the future could target a single behavior group and collect wider sample numbers in the resource class to study the deeper level and the effect of a motion infographic system applied to a single behavior group.
(2) Exploring an unknown case or group is important and challenging, especially with the small sample. Furthermore, if the experimental sample is smaller than this research, the researchers could consider applying reliable statistics that may be more suitable for small sample N research. The WRS2 R software package provides a reliable solution for smaller samples [30].

Author Contributions

Conceptualization, S.-T.T.; methodology, S.-T.T.; software, S.-T.T.; validation, S.-T.T. and H.-Y.H.; formal analysis, S.-T.T.; investigation, S.-T.T.; resources, S.-T.T. and T.-W.C.; data curation, S.-T.T. and H.-Y.H.; writing—original draft preparation, S.-T.T.; writing—review and editing, H.-Y.H. and T.-W.C.; visualization, S.-T.T. and H.-Y.H.; supervision, H.-Y.H. and T.-W.C.; project administration, S.-T.T. and T.-W.C. All authors have read and agreed to the published version of the manuscript.

Funding

This research received no external funding.

Conflicts of Interest

The authors declare no conflict of interest.

References

  1. Hatlevik, O.E.; Throndsen, I.; Loi, M.; Gudmundsdottir, G.B. Students’ ICT self-efficacy and computer and information literacy: Determinants and relationships. Comput. Educ. 2018, 118, 107–119. [Google Scholar] [CrossRef]
  2. Balogh, Z.; Kuchárik, M. Predicting student grades based on their usage of LMS Moodle using petri nets. Appl. Sci. 2019, 9, 4211. [Google Scholar] [CrossRef] [Green Version]
  3. National Academy for Educational Research, Taiwan. 2013. Available online: https://www.naer.edu.tw/bin/home.php (accessed on 19 July 2020).
  4. Ramirez, G.M.; Collazos, C.A.; Moreira, F. All-Learning: The state of the art of the models and the methodologies educational with ICT. Telemat. Inform. 2018, 35, 944–953. [Google Scholar] [CrossRef] [Green Version]
  5. López-Zambrano, J.; Lara, A.J.; Romero, C. Towards portability of models for predicting students’ final performance in university courses starting from Moodle Logs. Appl. Sci. 2020, 10, 354. [Google Scholar] [CrossRef] [Green Version]
  6. Chen, Y.H. Will Digitalized learning of textbooks make sense? Take the animation production course as an example. Taiwan Educ. Rev. Mon. 2015, 4, 85–86. [Google Scholar]
  7. Woo, H.S.; Kim, J.M.; Lee, W.G. Development of curriculum design support system based on word embedding and terminology extraction. Electronics 2020, 9, 608. [Google Scholar] [CrossRef] [Green Version]
  8. Chao, S.H.; Jiang, J.; Hsu, C.H.; Chiang, Y.T.; Ng, E.; Fang, W.T. Technology-enhanced learning for graduate students: Exploring the correlation of media richness and creativity of computer-mediated communication and face-to-face communication. Appl. Sci. 2020, 10, 1602. [Google Scholar] [CrossRef] [Green Version]
  9. Chang, C.C.; Chuang, H.C.; Lwo, L.S. Effects of multimedia presentation modes and cognitive styles on natural science learning in an elementary school. Res. Educ. Commun. Technol. 2014, 108, 31–48. [Google Scholar]
  10. Smiciklas, M. The Power of Infographics: Using Pictures to Communicate and Connect with Your Audiences; Que Publishing: New York, NY, USA, 2012. [Google Scholar]
  11. Scott, H.; Fawkner, S.; Oliver, C.; Murray, A. How to make an engaging infographic? Br. J. Sports Med. 2017, 51, 1183–1184. [Google Scholar] [CrossRef] [PubMed]
  12. Jennifer, F. Infographics: An Introduction; Coventry University: Coventry, UK, 2014. [Google Scholar]
  13. Schiphorst, C.; Murray, A.; Kelly, P.; Oliver, C.; Bull, F. Infographic. Best investments for physical activity. Br. J. Sports Med. 2016, 51, 1227–1228. [Google Scholar] [CrossRef] [PubMed] [Green Version]
  14. Lester, P.M. Visual Communication: Images with Messages; Thomson/Wadsworth: Belmont, CA, USA, 2003. [Google Scholar]
  15. Fleming, M.; Levie, W.H. Instructional Message Design: Principles from the Behavioral Sciences; Educational Technology: Englewood Cliffs, NJ, USA, 1993. [Google Scholar]
  16. Rieber, L.P. Computers, Graphics & Learning; Brown & Benchmark: Madison, WI, USA, 1994. [Google Scholar]
  17. Lin, L.C. Computer Vision Design: Motion Factors and Students’ Characteristics; Fu Jen Catholic University Press: Taipei, Taiwan, 2000. [Google Scholar]
  18. Zeng, B.W.; Chang, S.H. Effect of intel K-12 educator’ thinking tools integrated into teaching program on reasoning ability and creativity by gifted students in the elementary school. Spec. Educ. Forum 2013, 14, 1–19. [Google Scholar]
  19. Ministry of Education, Taiwan. New-Generation Digital Learning Plan. Available online: https://www.edu.tw/Default.aspx (accessed on 19 July 2020).
  20. Yen, T.R. What Is a Resource Class? A Great Place to Make Children Better; Ministry of Education, Taiwan-Student Affairs and Special Education Department: Taipei, Taiwan, 2010. [Google Scholar]
  21. Wang, H.Y.; Tsai, Y.T. The Effects of social skills program for teaching students with mild intellectual disabilities in an elementary school. J. Res. Spec. Educ. Assist. Technol. 2013, 6, 1–21. [Google Scholar]
  22. Meng, E.R.; Chang, S.P. Chinese teaching in resource classes-Interesting literacy teaching design. State Educ. Century 2003, 207, 31–207. [Google Scholar]
  23. Meng, E.R. Emotional Behavior Disorder Student Counseling Manual/Special Education Counseling Strategies/Teacher Edition; Taoyuan City Government: Taoyuan, Taiwan, 2018.
  24. Hu, Y.S. Text-based language teaching in elementary school resource class: Direct teaching combining language and text. Nanping Spec. Educ. 2014, 5, 45–53. [Google Scholar]
  25. Garderen, D.V. Teaching students with LD to use diagrams to solve mathematical word problems. J. Learn. Disabil. 2007, 40, 540–553. [Google Scholar] [CrossRef] [PubMed]
  26. Cajas, F. The science/technology interaction: Implications for science literacy. J. Res. Sci. Teach. 2001, 38, 715–729. [Google Scholar] [CrossRef]
  27. Taiwan Environmental Information Center. Arctic Oscillation. TEIA Arctic Oscillation Home Page. Available online: http://e-info.org.tw/taxonomy/term/31564 (accessed on 19 July 2020).
  28. Central Weather Bureau Arctic Oscillation. Central Weather Global Information Network. Available online: http://www.cwb.gov.tw/V7/hottopic/ao.pdf (accessed on 19 July 2020).
  29. Lin, M.S.; Lin, S.L. The effects of an interactive multimedia sexuality learning program on the sexual knowledge of high school level students with intellectual disabilities at a special education school. Spec. Educ. Q. 2013, 126, 17–33. [Google Scholar]
  30. Mair, P.; Wilcox, R. Robust statistical methods in R using the WRS2 package. Behav. Res. Methods 2020, 52, 464–488. [Google Scholar] [CrossRef] [PubMed]
Figure 1. Examples of infographic—visualization of text and information (From THINKLABS).
Education 10 00247 g001
Figure 2. Motion infographic system scripts.
Education 10 00247 g002
Figure 3. Motion infographic system home page (a), content (b,c).
Education 10 00247 g003
Figure 4. Motion infographic system content: (a) frost, (b) sleet, (c) hail, (d) snow.
Education 10 00247 g004aEducation 10 00247 g004b
Figure 5. Resource class students using motion infographic system.
Education 10 00247 g005
Figure 6. Original classroom teaching mode of resource class.
Education 10 00247 g006
Figure 7. Learning evaluation.
Education 10 00247 g007
Figure 8. Scores of pre and post-tests.
Education 10 00247 g008
Table 1. Experimental Process. AO: Arctic oscillation.
Experimental GroupControl Group
Week 1Pre-test: natural science evaluation
Week 2Motion infographic system: AOTeacher’s own textbook: AO
Week 3Topic discussion
Week 4Post-test: AO learning evaluation
Table 2. Learning evaluation pre- and post-tests of experimental group and control group.
GroupNumberPre-Test ScorePost-Test ScoreDifference Between Pre and Post-Test Scoret Statistic of Students
MSDMSD
Experimental group12 people74.113.786.616.1+12.5−2.454 *
Control group12 people64.113.769.117.8+5−0.838
* p < 0.05.

