Article

A Comparative Trend Analysis of Changes in Teacher Rate of Absenteeism in South Africa

by
Steven Kayambazinthu Msosa
Department of Marketing, Faculty of Management Sciences, Mangosuthu University of Technology, Durban 4031, South Africa
Educ. Sci. 2020, 10(8), 189; https://doi.org/10.3390/educsci10080189
Submission received: 19 May 2020 / Revised: 7 July 2020 / Accepted: 8 July 2020 / Published: 23 July 2020

Abstract

:
The aim of this research was to analyze the changes in the rate of teacher absenteeism among South African provinces as a major in-class factor contributing to student performance and effective learning. Time series analysis of exponential smoothing, moving average, and seasonal autoregressive integrated moving average model (SARIMA) were applied to model and assess the designed hypothesis as a major factor for educational advancement using different provincial data input from the Department of Basic Education in South Africa. The performances of all the models were analyzed using statistical indexes: Mean Square Error (MSE) and Mean Absolute Percentage Error (MAPE). The overall performance showed that the absence rate increased statistically significantly from 2011 to 2017. Thus, this opinion was held by more than half of the general populace depending on the province type. The findings of this research could assist the management of the basic education department in general, and in schools in particular, to understand the problem of absenteeism and thereby enabling the implementation of effective strategies that can be used to curb the practice.

1. Introduction

The South African education sector is riddled with several challenges affecting the provision of quality education to learners. For instance, the post-democratic South African education system is faced with the challenge of ensuring that schools have sufficient numbers of motivated and skilled teachers. In addition, the sector is plagued with several problems, such as shortage of teachers in certain subjects, poor performance of teachers in classrooms, and teacher absenteeism, which lead to loss of time for teaching and insufficient coverage of the curriculum. The right to education entails giving learners adequate quality education. In this regard, the constitutional court of the Republic of South Africa in its jurisprudence observed that role-players in the education sector, such as national officers, provincial officers, and bodies governing schools, have an obligation to make sure that the right to education is achieved [1]. Thus, among the role-players, teachers are an important human resource towards building a functional and effective system of education, and act as “loco parentis” because they also assume the role of ‘‘parents for the learners’’. The learners in the classroom look up to their teachers as role models, hence they are expected to conduct themselves based on the behavior of their teachers, whether good or bad. Teachers play a critical role in nurturing learners, building their skills and knowledge base, which can help them to contribute positively to society. They are also expected to provide support and motivate the learners so that their academic performance is enhanced. However, this can only be done and achieved by teachers who are present and actively participating in education programs [2].
Teacher absenteeism is a problem that affects many countries. This problem is very high and prevalent in developing countries compared to developed countries, and also other jobs or workers in countries that are less developed [3]. According to the World Bank National Absence Surveys (WBNAS), an absenteeism rate of 10–12% is deemed to be higher than the absenteeism rates in countries with high income, but is lower than the absenteeism rates in countries with low income. Thus, based on the physical presence of teachers in their designated schools rather than their attendance as indicated on logbooks, the WBNAS found that there was a 17% absence rate in Zambia, 19% in Indonesia, and 25% in India. Furthermore, it was noted that there was a 6% absenteeism rate in Canada, and as high as 26% in Brazil. In India, at least one in four teachers were absent on a typical working day. As a result, there is fiscal wastage because the government has to pay salaries for teachers who are not reporting for duties. The cost of teacher absenteeism is very high in India, as it is reported that approximately $1.5 billion is the fiscal cost associated with absenteeism [4]. According to the World Bank, 10–24% of expenditure spent on education across the globe is a result of teacher absenteeism. This includes approximately $16 million spent in Ecuador and $2 billion spent in the Indian education sector [5].
South Africa has not been immune to the scourge of absenteeism. According to the Basic Education Minister, Angie Motshegka, 7.5 million teachers were absent during the year 2012. Furthermore, South Africa has the highest rate of teacher absenteeism in the Southern Africa Development Community (SADC) region. Teacher absenteeism in SADC is on average 9 days per teacher annually, whereas, in South Africa, teacher absenteeism was on average 19 days per teacher annually as of 2012 [6]. Chauke [7] argues that teacher absenteeism contributes to students’ underperformance in schools. It is assumed that between 10 to 12% of teachers shun schools, and these amounts to 39,000 teachers on a daily basis. In addition, 77% of instances where teachers are absent are Mondays and Fridays. Thus, despite spending a lot of money on the education system as compared to other countries in Africa, South Africa is faced with the challenge of weak education outcomes. For instance, South Africa provides for 6% of its GDP on education, which is on par with the Organisation for Economic Cooperation and Development (OECD) countries [8]. According to Brown and Arnell [9], teacher absenteeism is a global challenge which may lead to wastage of financial resources and short-changing young students. Simply put, it is viewed as one of the worst forms of corruption in education. While some teachers may have legitimate reasons for staying away from the classroom, the majority have no valid reasons for absenteeism. They are involved in ‘moonlighting’, thus working or conducting private teaching lessons not sanctioned by the school where they are supposed to be teaching. In some cases, absences that are purported to be official may be the genesis of inefficiency or corruption upstream. Regardless of the reason, teachers and the system are failing the learner due to high levels of absenteeism [10]. “Because it is not measured, chronic absenteeism is not acted upon. Like bacteria in a hospital, chronic absenteeism can wreak havoc long before it is discovered. That havoc may have already undermined school reform efforts of the past quarter-century and negated the positive impact of future efforts.” [11] (p. 3). The impact of teacher absenteeism is severe and real hence it is important to investigate the problem and find ways of addressing it. Thus, addressing teacher absenteeism is critical for the education sector so that government resources in the form of public expenditure on salaries are justified [12]. This research analyzed changes in the rate of teacher absenteeism in South Africa among the nine provinces as a major in-class factor contributing to student performance and effective learning. Specifically, the research looks at what has changed between 2011 and 2017.

2. Literature Review

2.1. Teacher Absenteeism

Teacher absenteeism refers to the failure of the teacher to report for duties as scheduled or expected irrespective of the reasons that have prompted the absence. Absenteeism reflects badly on the individual teachers’ performance, and if habitually done, it breaches the contract of employment between the employer and the teacher [13]. Teacher absenteeism is a very complex subject. The notion of absenteeism is twofold; authorized or unauthorized. Authorized absenteeism is whereby teachers’ absence is granted by the authorities. The examples of authorized absenteeism are: Leave, health reason, administrative, in-service training, collecting salaries, and others. Conversely, unauthorized absenteeism includes truancy, tardiness, moonlighting, security, teacher strikes, abscondment, kickbacks, and fraud [14]. Another school of thought suggests that there are four types of teacher absenteeism viz. ‘‘Authorized absenteeism, unauthorized absenteeism, wilful absenteeism and authorized absenteeism beyond our control” [15]. Absenteeism in the context of education is multidimensional. It includes teacher absenteeism from the school and teacher absenteeism from the classroom. Teachers’ absenteeism from the schools refers to the absence of teachers from the school on a particular day for various reasons, whereas teacher’s absenteeism from the classroom refers to the failure by the teacher to report for a scheduled classroom despite reporting for duties on a particular day [16].
A report by the World Bank indicated that in developing countries, the scourge of absenteeism is very high. For instance, the rates of absenteeism range from 11% in Peru, 21% in Indonesia, 27% in Uganda, and 30% in Kenya [17]. In South Africa, teachers are by law expected to offer teaching services for at least a minimum of seven hours daily. This implies that the absence of teachers from performing their duties is a breach of a contract agreement with their employers, as they have failed to provide the services for which they were employed [18].

2.2. Causes of Teacher Absenteeism

The causes of teacher absenteeism are not the same across different countries. Wambua [19] believes that absenteeism is caused by situational and personal factors. Situational factors are job-related factors such as the routine, repetitive, or boring nature of the job. Thus, a job that is not interesting may lead to stress and resentment by the employee. On the other hand, personal factors are employee-related factors such as personality, age, or gender of the employee. These may have an impact on how one behaves towards his or her job. Teacher absenteeism can be explained better based on Steers and Rhodes’ Process Model of Employee Attendance [20]. This model suggests that individual satisfaction towards a job is triggered by organization and personal factors. This means that the job itself and the environment in which it takes place have an influence on whether the individual will be satisfied or not. Other factors related to the job are the scope, opportunities for growth, and relationships with workmates. Similarly, Siu [21] believes that there are several factors that are attributed to teacher absenteeism viz. job satisfaction, psychological fatigue by teachers, the type of school where they work, the nature of interaction between the teacher and the school or superiors, and the level of involvement of the teachers in terms of their participation in school processes. According to the research in Turkey on teacher absenteeism by Sezgin, Koşar, Kılınç, and Öğdem [22], some of the factors that contribute to teacher absenteeism were the authoritarian type of administration by the principals or headmasters, the negative students’ behavior, long distances between the school and homes of teachers, and a school environment that is not conducive for learning. Mkhwanazi [23] believes that teacher absenteeism is caused by illness, transportation problems, excessive use of alcohol, attending political party functions, funeral services, job stress, cultural issues, and absence due to further education (research leave).
In some cases, education policies contribute to teacher absenteeism. For instance, teachers in Gauteng province in South Africa are only reprimanded and a substitute teacher identified if he/she is absent for a period of more than 20 days, which translates into a full working month. The implication is that the absence of the teachers for less than 20 days is not treated as a serious breach of the employee–employer contractual obligation. Thus, this policy contributes to teacher absenteeism, which subsequently affects performance and productivity [24]. In Kenya, research on teacher absenteeism by Obiero, Mwebi, and Nyang’ara [25] found that the reasons for absenteeism are illness, personal or family problems, bereavement, and attending official duties. Betweli [26] believes that teacher absenteeism is sometimes compounded by low salaries such that teachers are forced to abscond work and perform additional work elsewhere in order to supplement their income. Bennell and Akyeampong [27] have noted that sometimes teachers’ absenteeism is triggered by the high cost of transportation, especially in urban schools where they have to travel long distances and incur transport costs on a daily basis. The same is true in rural schools where accommodation is a challenge and as a result, teachers are forced to stay in nearby towns and have to incur travel costs daily. The excessive transport costs sometimes act as deterrence for teachers to travel considering that their salaries are low.
Atege and Okibo [12] argue that teacher absenteeism should not be treated as merely an individual or private phenomenon, but also as something that may be driven by groups or organizational dynamics such as culture. According to Miller [28] (p. 5), “the professional culture of a school, the norms, formal and informal, that guide teachers’ behaviour has a facet related to absence. The first has to do with how similarly teachers behave to one another”. Thus, how principals and fellow teachers deal with teacher absenteeism has an impact on subsequent teacher behavior, which can either be dealt with or worsen in terms of the frequency [29].

2.3. Effects of Teacher Absenteeism

An employee can only be effective and contribute significantly to the objective of an organization if he makes himself available to work. The absence of the said employee is a recipe for lost productivity [30]. According to Chapman [31], the decline in the quality of education and efficiency are the major challenges of the third world. Some of the issues affecting education quality are teacher absenteeism and turnover. Teacher absenteeism robs students of classroom instructional time. In the third world countries, the growth of the education system has been alarming, and the demand for teachers due to an increase in enrolments and participation rates is very high and has put a strain on national education budgets considering the fact that many countries are facing economic turmoil. Governments have been forced to cut spending on instructional materials. In addition, teachers’ salaries are very low and failing to keep pace with rising inflation. Ultimately, the quality of education has declined significantly. Adeleye [32] believes that the absence of teachers from schools leads to low education standards and the underperformance of both the learners in particular and the school in general. In addition, maximum utilization of teaching staff is hampered by teacher absenteeism and attrition, which subsequently affects instructional quality.
Teacher absenteeism leads to an increase in the negative perception of teachers in the eyes of students and society. It further disrupts a good working relationship with colleagues and contributes to a toxic working environment at school, and affects a student’s motivation and interest in their studies [33]. A draft report on quality education by Dr. Nick Taylor has noted that teachers abscond classes more than students. The tragedy of teacher absenteeism is that lessons are not delivered as planned and students lose time. The government suggests that an electronic clocking-in system at schools should be implemented to monitor attendance. However, the South African democratic teachers’ union (SADTU) had indicated that they would not support the implementation of such a system. SADTU believes that what is critical is for the authorities to address the reason why teachers are absent. They believe that the current working conditions are poor and strenuous [34]. The problem of teacher absenteeism has been overstated. For instance, teacher absenteeism leads to low productivity, excessive workload on other employees, and additional costs through replacement or new staff members. The costs associated with new employees may be excessive, as there may be a need to recruit individuals to train these new staff or replacement members, pay overtime, and other hidden administrative costs [35]. This view is shared by Pitts [36], who argued that the absence of teachers at school has a significant impact on students in terms of missed opportunity to attend a class and financial costs on the part of the school or the ministry of education.

3. Materials and Methods

Many researchers in forecasting application and model use mixed research methodology, where the theoretical principle of the subject matter is considered with field investigation through the questionnaire. The Mean Square Error (MSE) criteria and Mean Absolute Percentage Error (MAPE) criteria have been used as a measure of error. Mean Square Error (MSE) is the average of the square of the error sum between the forecasted data and the actual data, while Mean Absolute Percentage Error (MAPE) value provides an indication about how much is the average of the absolute error of the forecasted data compared to the actual data [37,38]. Triple Exponential Smoothing [Holt–Winters Method), moving average, and Seasonal Autoregressive Integrated Moving Average (SARIMA) model were used to analyze the trend, while t-test and ANOVA test were used for comparison.

3.1. Instruments and Procedures

For this research, a random sample of 1000 schools out of the 6167 schools (with a learner population of 647,032) was drawn [39]. Analysis of trends over time was treated with caution in view of differences in data collection and instrument development between 2011 and 2017. Exponential smoothing was used for removing random variation in the time series, while the moving average curve indicated the general trends regarding an increase or decrease of annual absenteeism with time. The t-test, Chi-square test, and ANOVA were used for the level of significant comparison. Based on the pre-data analysis, the series is not stationary, which means there is a need to transform the data before trying to adapt to a SARIMA model. Furthermore, Kwiatkowski–Phillips–Schmidt–Shin (KPSS) test for stationarity was done.

3.2. Data Analysis

The XLSTAT version 2020.1 statistical software was used for the time series visualization, analysis and inferences deduction in answering the research questions. Can we conclude that the proportion of the rate of teacher absenteeism in the 9 provinces was the same? Can we investigate if this opinion was held by more than half of the general populace irrespective of the province? Based on an opinion sample poll from a sample of 1000 schools conducted in 9 provinces, out of this number, 424 responded “yes”. The theory of normality and stationarity in data [40] was used with the following assumption attributes of same mean, variance, and degree of clustering, which do not vary with time. To carry out the quantitative analysis of the dataset, the statistical analysis must contain at least the t-test or the Chi-square test. The t-test is not applicable to establish the impact of teachers absent from school in which data on age at admission (in years) into the schools and scores obtained (in %) by students in a major subject were collected. The Chi-square test can only be applied if both age and scores are grouped.

4. Results

The quantitative analysis was based on secondary data indicators for the 2011 and 2017 academic years. Summary statistics for variables are presented in Table 1.
When a series is cyclical for period T, differencing can also be performed by removing the value corresponding to time t-T which breaks it into seasonal, cyclical, and trend [41]. Figure 1 shows the different cyclical nature of the data series. This may be a result of the scanty measured yearly dataset. In all, the data series appears to represent an increase in the average value from the 2011-till date and conform to the stationarity test.
The test for stationarity on the series following differencing performance was as depicted in Table 2:
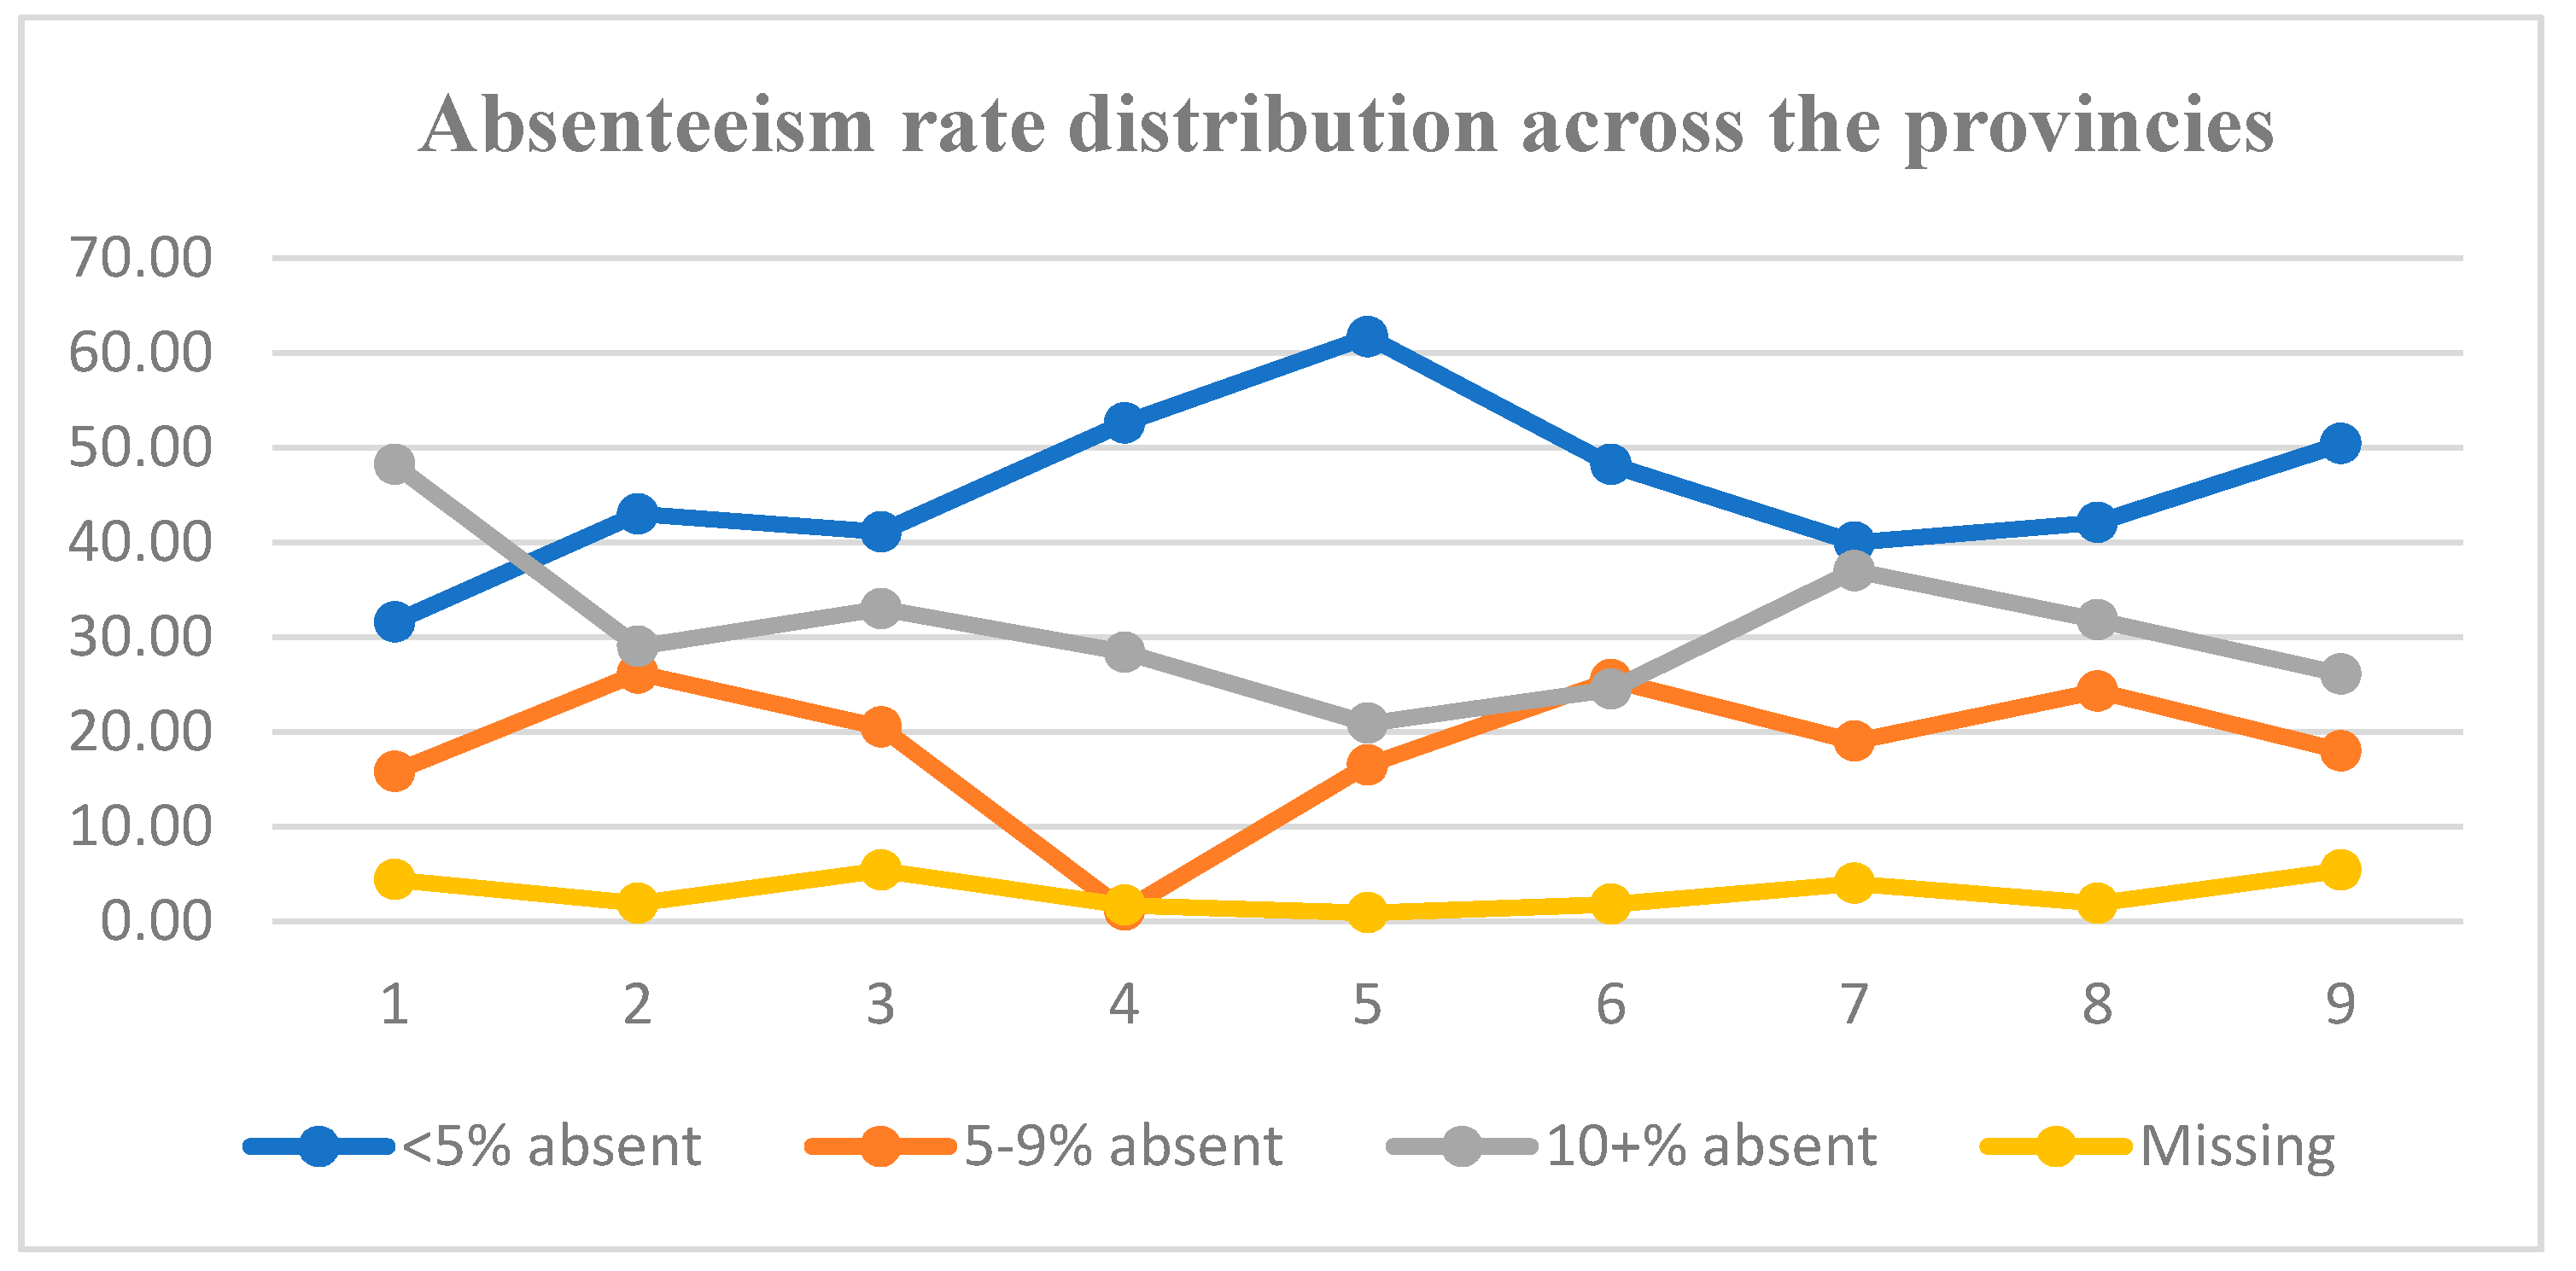
The next issue is how to calculate if the average scores of rates of absenteeism are the same across the provinces. Figure 2 depicts the different rates of absenteeism in respective provinces, which are represented by numbers 1 (Eastern Cape (EC)) to 9 (Western Cape (WC)).
Figure 2 shows that less than five percent has the highest frequency magnitude across the provinces. This rate of absenteeism was considered from the school attendance signatures and subsequent follow-up confirmation from the principal [39]. Using the latest thinking on the applications of various trend detection in generating stochastic time series deduction inferences, the Holt–Winters method, exponential smoothing, and SARIMA was used to model and forecast the rate of absenteeism data.

4.1. The Holt–Winters Method

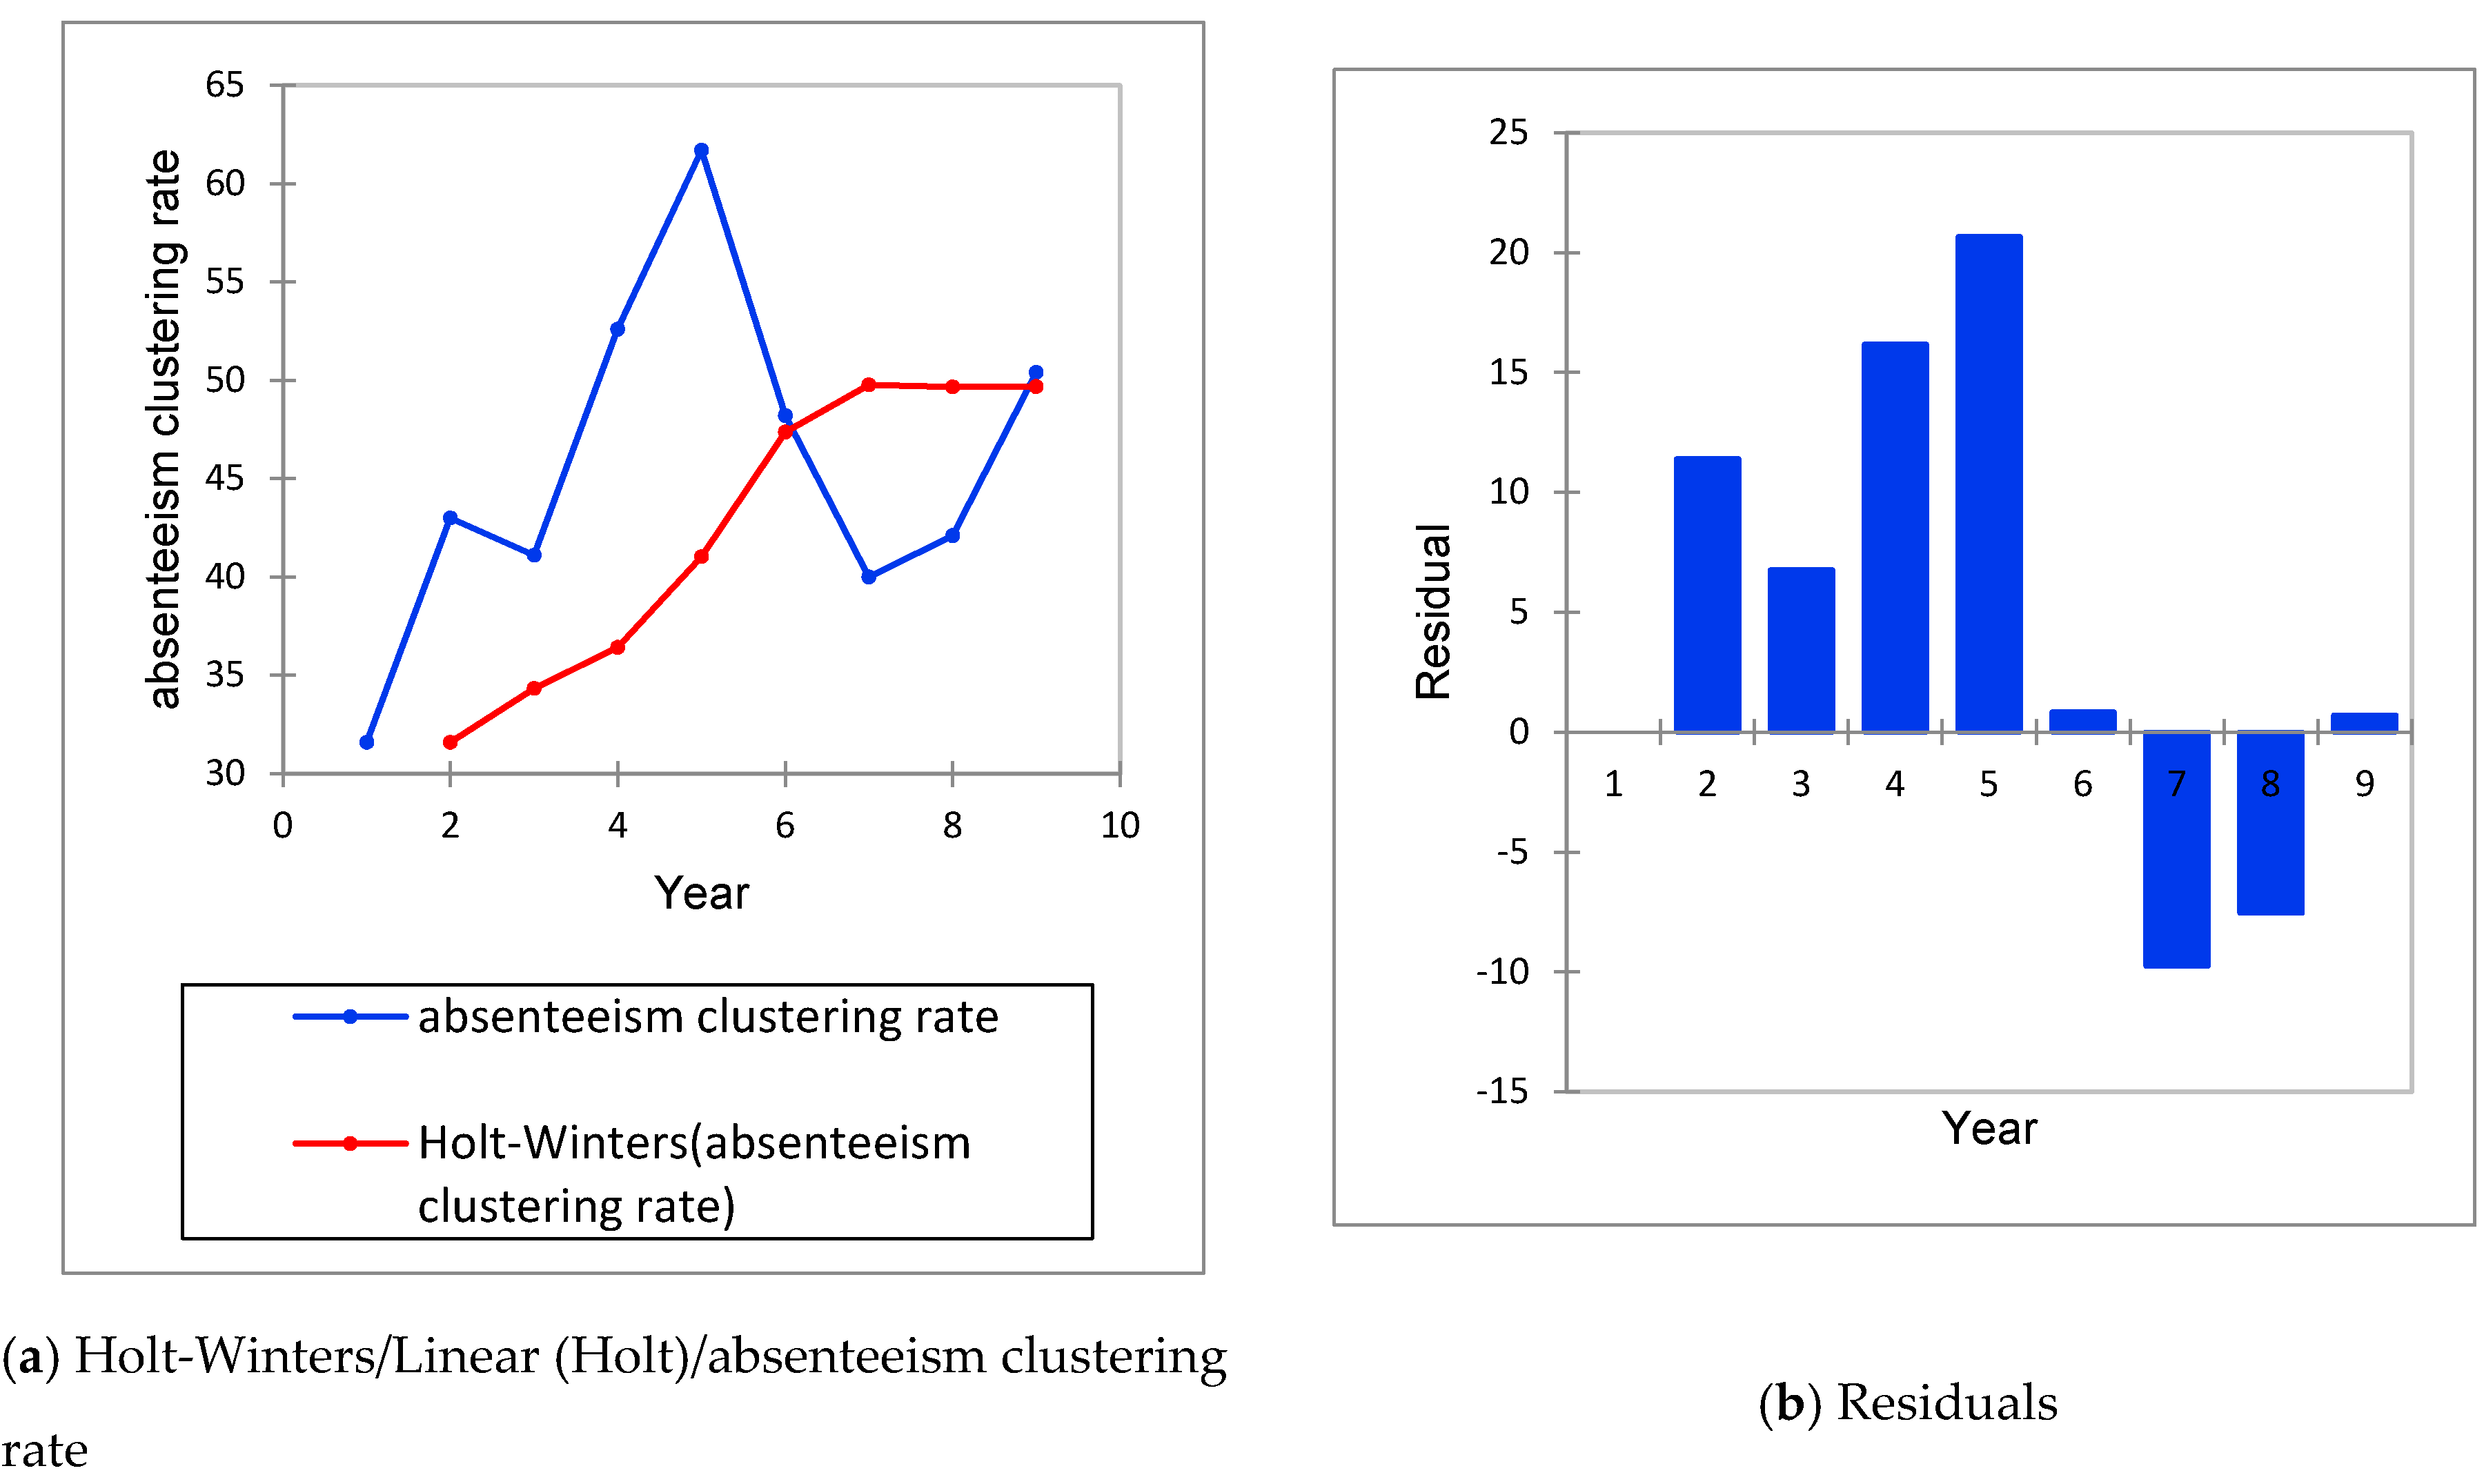
The Holt-Winters method is well suited to time-series data with seasonality. This method offers the added advantage, contrary to models such as ARIMA, as it does not require data hypotheses. The exponential smoothing is used for removing random variation in a time series. The X-axis in the Figure 3 shows the 10 months for the school calendar year, whereas the respective nine provinces are represented by numbers 1 (EC) to 9 (WC). In between the two years, using the Smoothing function in XLSTAT, the Triple Exponential Smoothing (or Holt–Winters) trend variation was depicted in Figure 3.
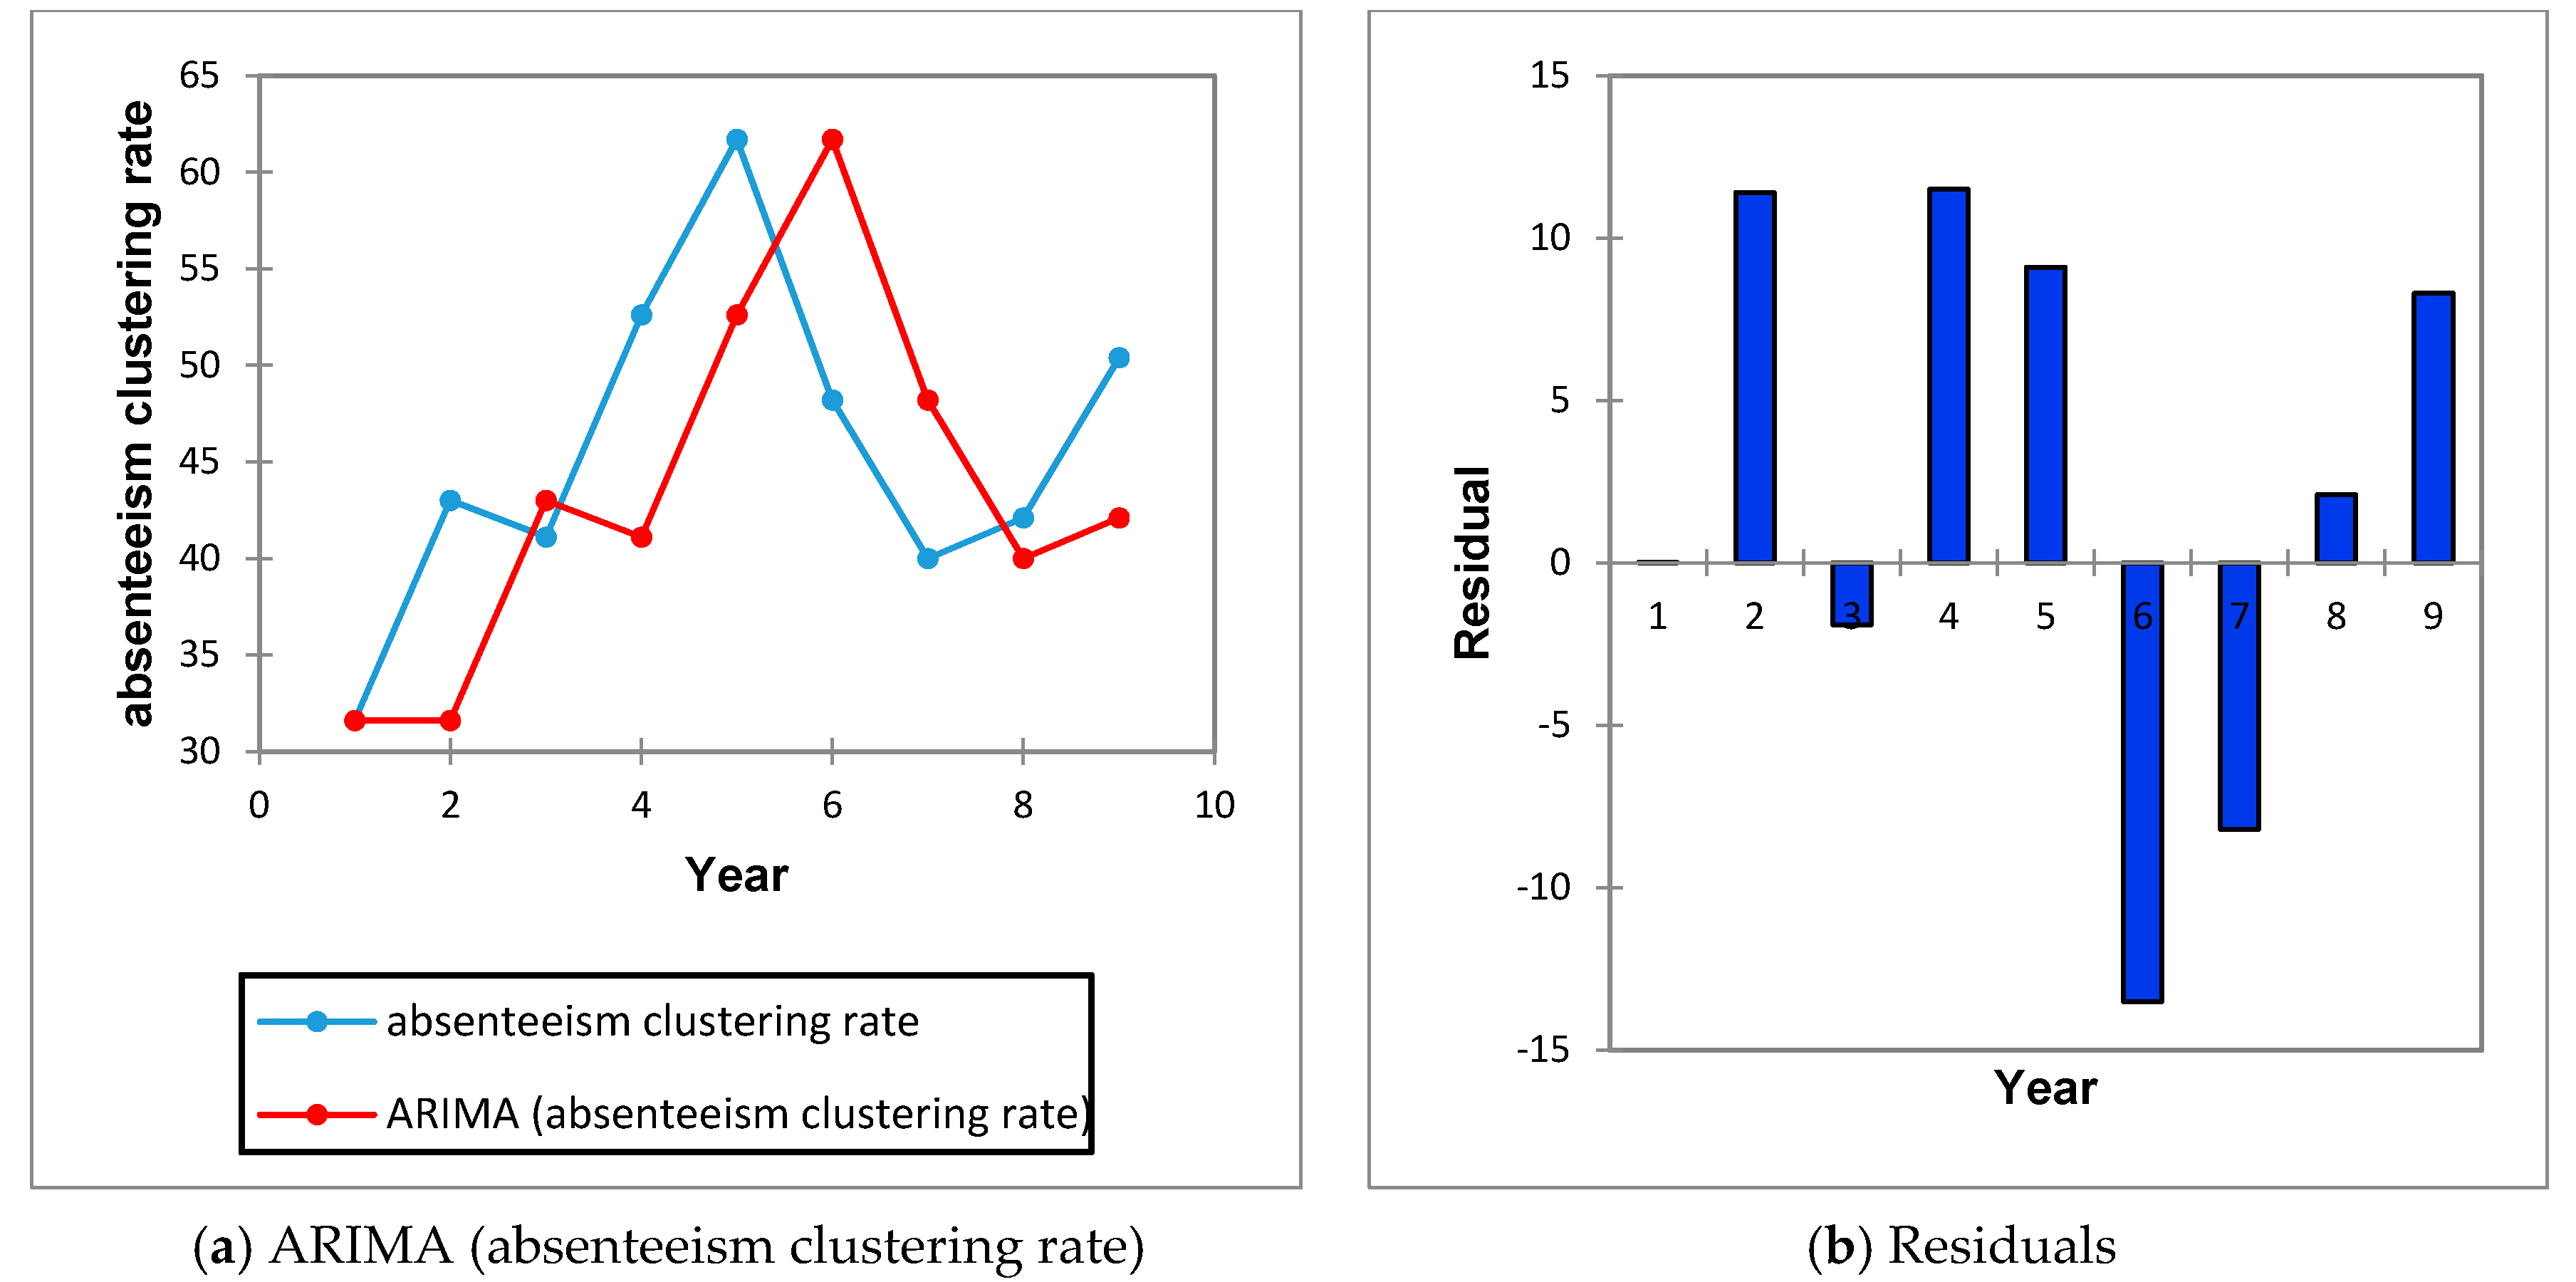
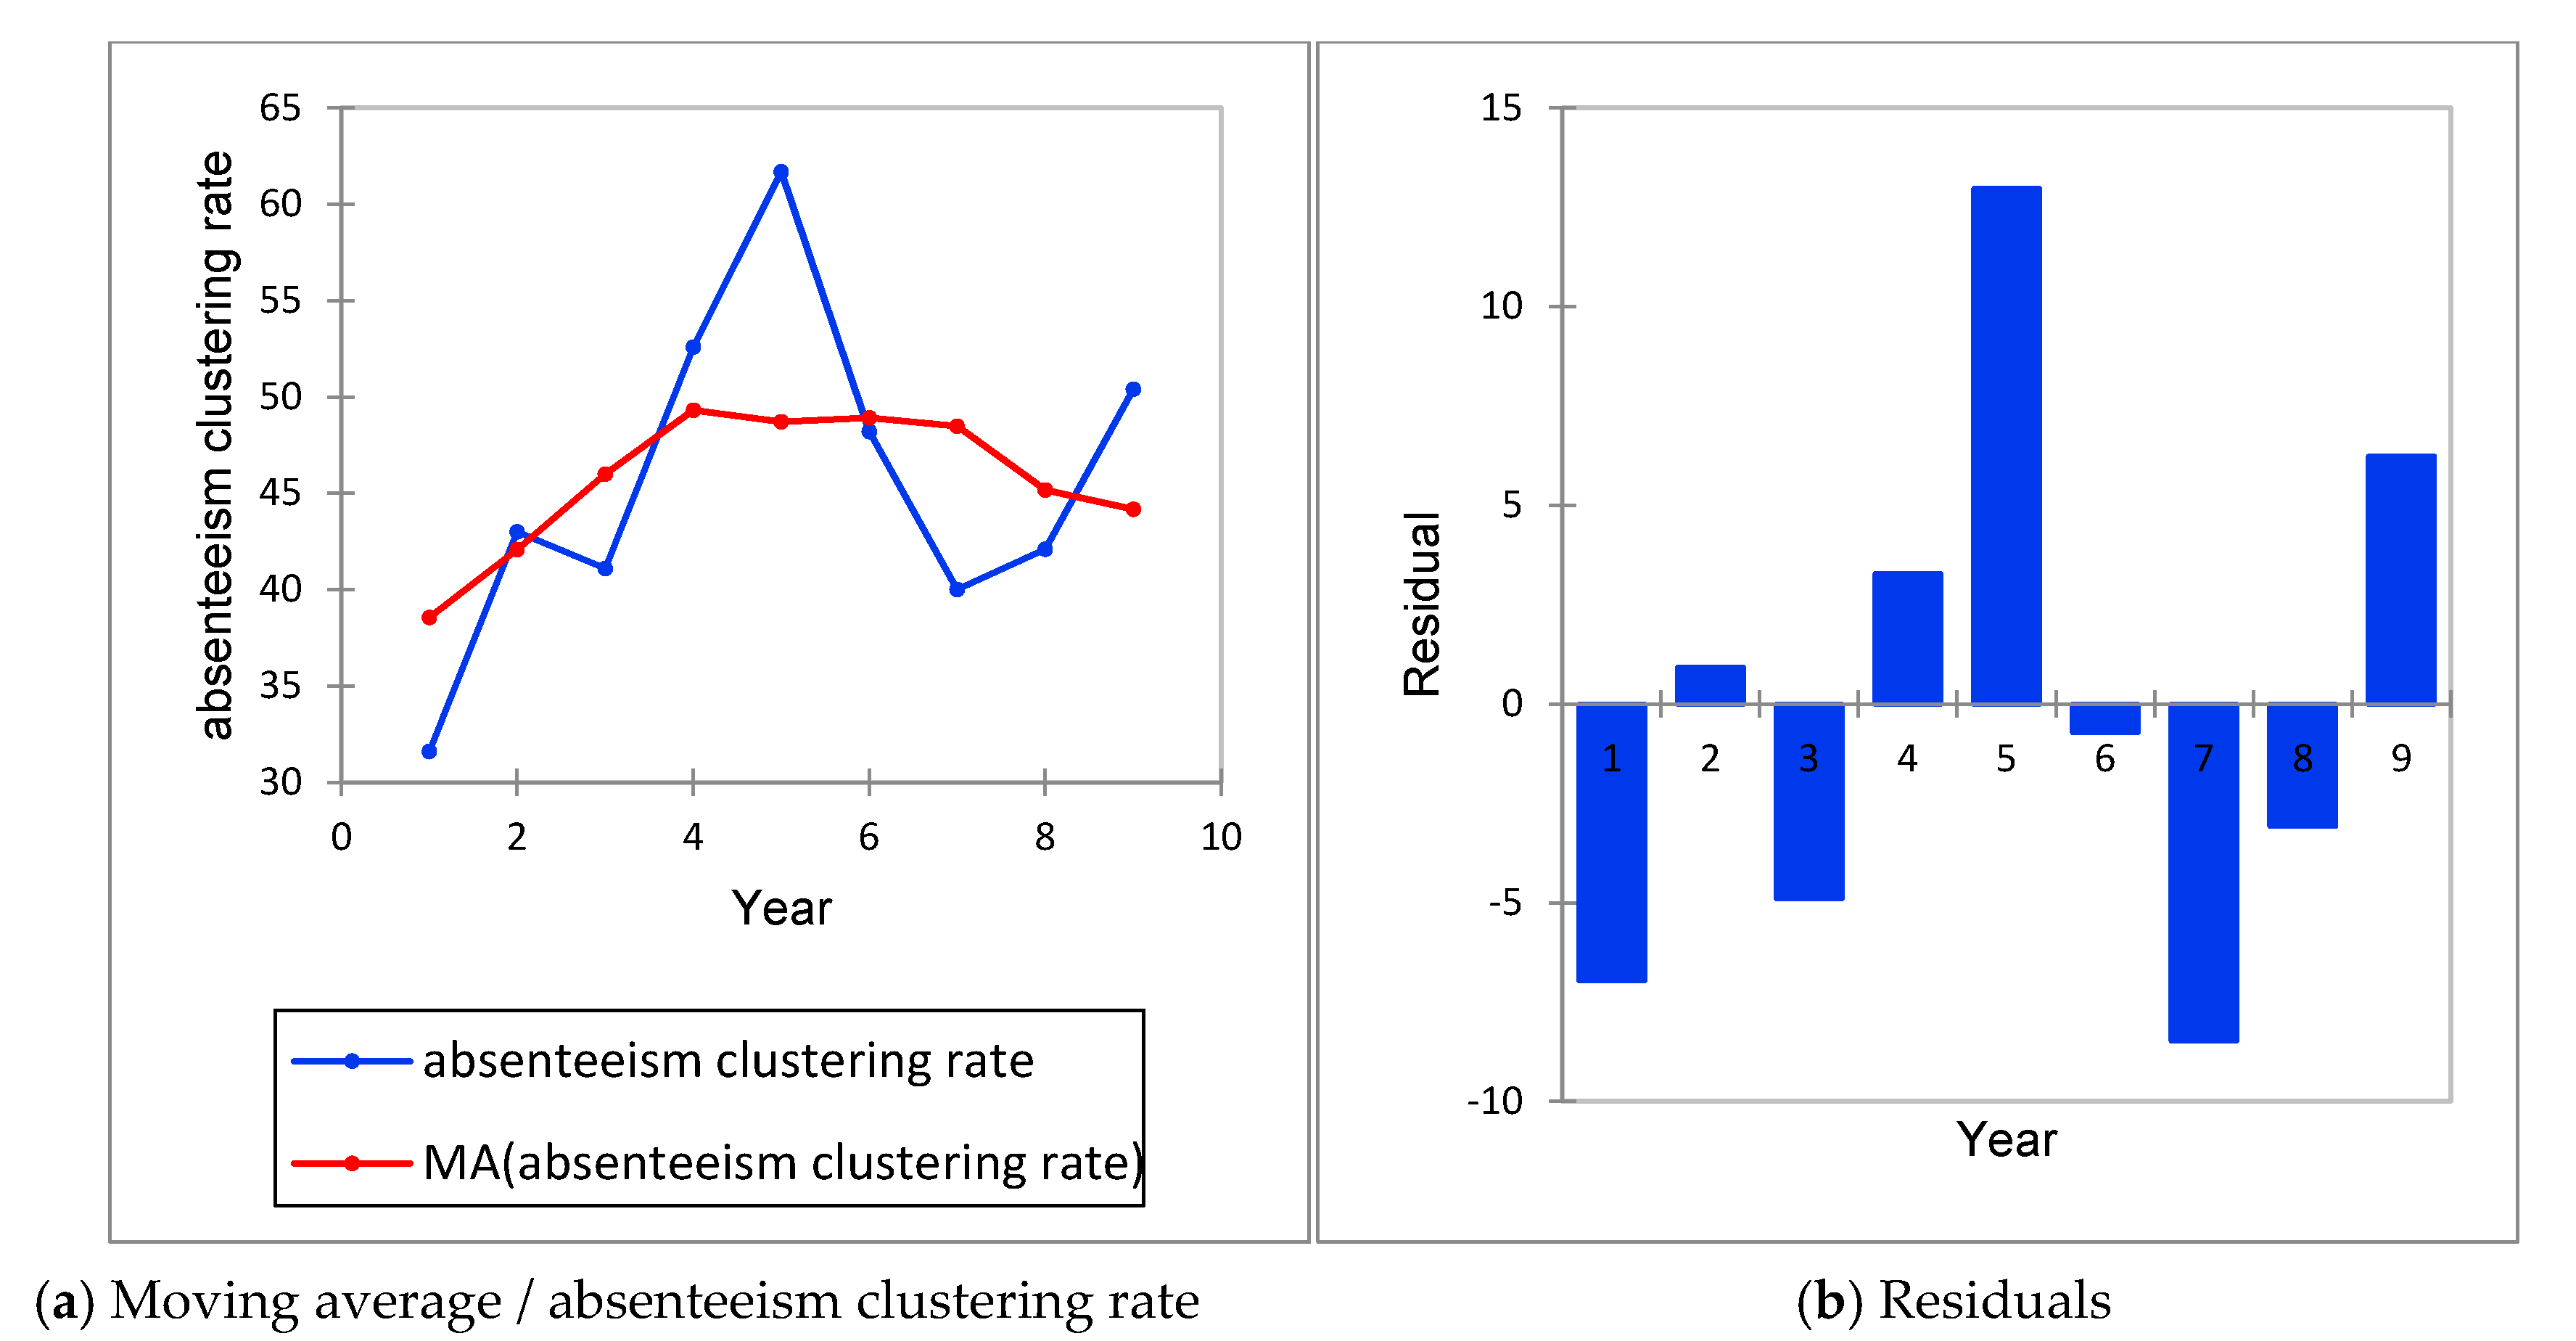
The results of smoothing the Holt’s winter model shows a residual error of 18.04% MAPE to produce an inferior result when compared with investigated ARIMA model. While Figure 4 and Figure 5 show the ARIMA model with seasonality and the Moving Average trend from the year 2011 to 2017. The model that is well suited to our data can be predicted using these models with the least residual errors.
Figure 4 shows that seasonal ARIMA model is well suited to the data with an MAPE value of 15.30% in yearly rate of absenteeism to represent the best fitted predicted model, Figure 5 shows the seasonal moving average rate of absenteeism distribution.
Figure 5 illustrates the moving average curve of absenteeism clustering rate which indicate the general decrease trends observed with the annual time series.

4.2. Moving Average

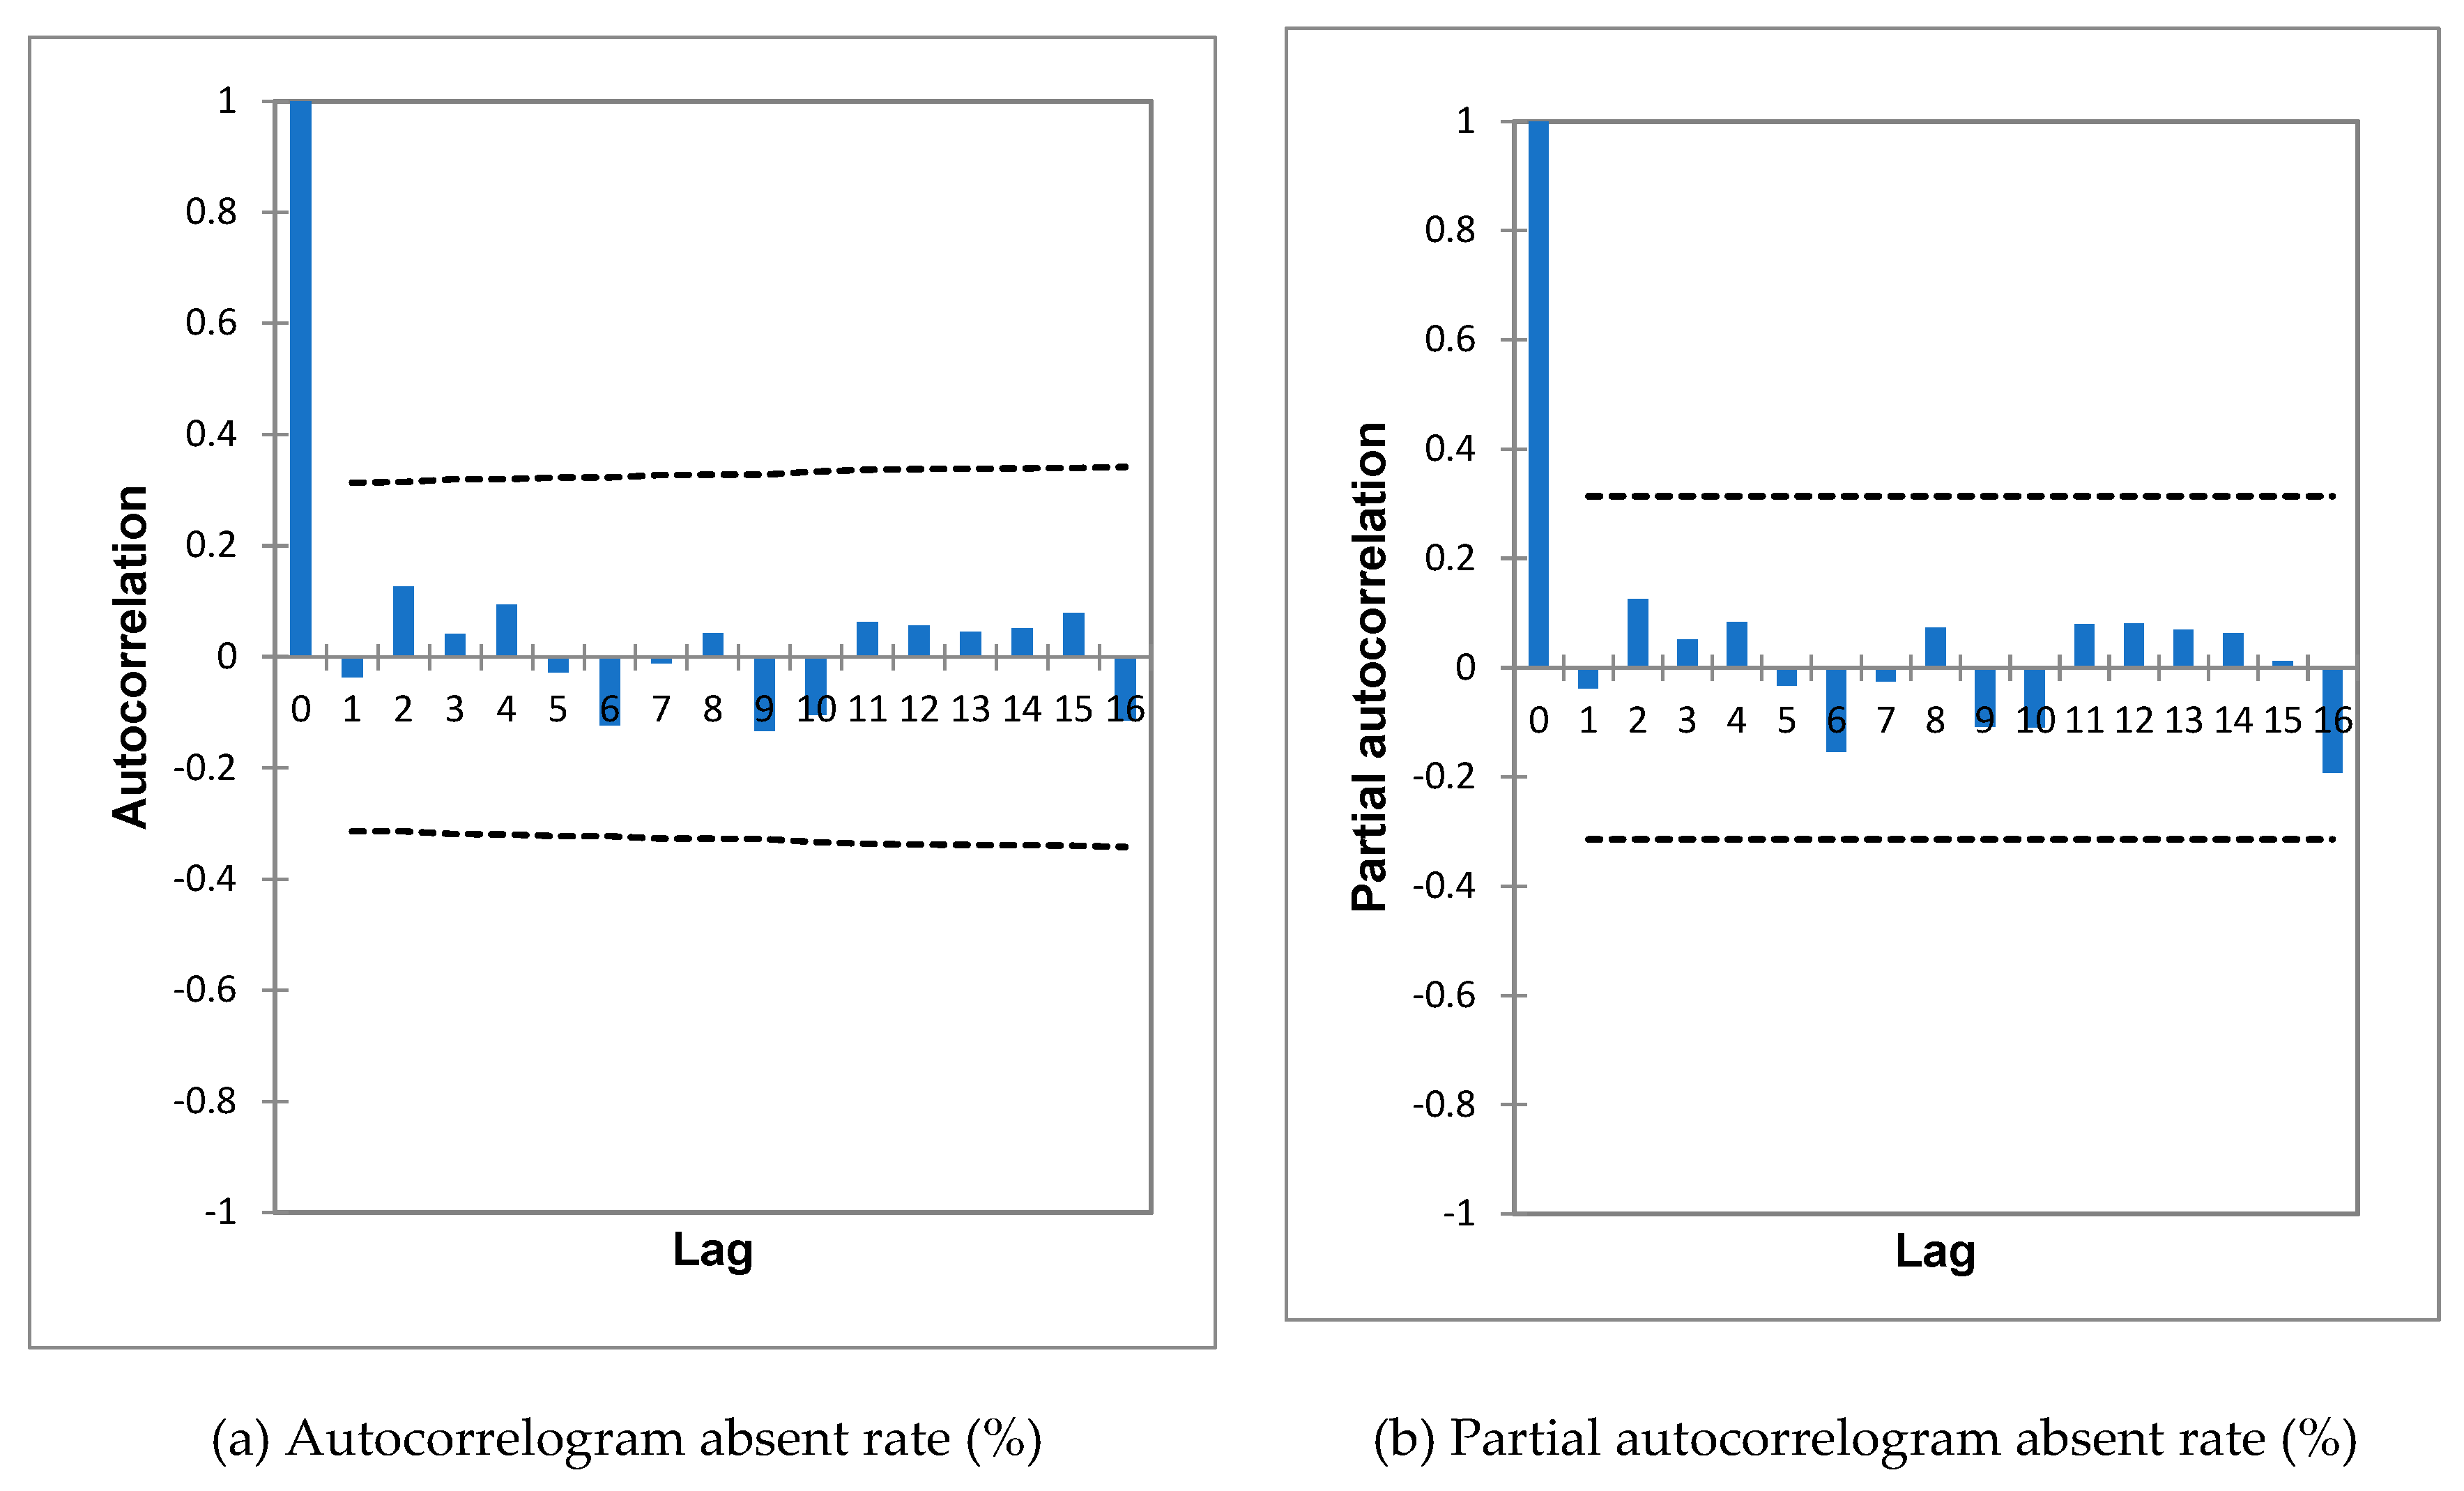
This section shows the rate of absenteeism using the seasonal moving average distribution. The autocorrelation function (ACF) and the partial autocorrelation function (PACF) have proven to be two very important concepts in analyzing time series [42]. They depict the degree to which a measurement taken at time t is correlated to the measurements were taken at time t-k. Autocorrelation at lag k is the correlation between a measurement X (t) taken at time t and a measurement X (t-k) taken at time t-k. To validate the models, it is essential to verify that the residuals are indeed Gaussian white noise. To do this, the ACF and PACF of the residuals were used in Figure 6.
The Figure 6 clearly shows that the ACF and PACF are not significant from lag 1. Therefore, we consider that the residuals are Gaussian white noise and that our Seasonal ARIMA model is valid. Furthermore, the ANOVA test result in Table 3 confirms an annual progressive increase growth rate of less than 5 percent. Table 4 depicts the analysis of variance between 2011 and 2017. The ANOVA performance shows that the absence rate of growth increased statistically significantly by 0.46 in the year 2017.
Table 4 shows the dynamic least square of the pooled linear regression, indicating both the significant province and the year dependent variable. The variable respondents as the year had a level of a significant contribution of 0.3% to the average province absent rate. The predictor (provinces) is positively related. Additionally, the result shows that there is a negative relationship between the year 2011 and 2017. The annual rate of change in absenteeism is also negatively influenced by different factors. The ANOVA F result means a good fitness of 60%. Thus, a large percentage of schools that had reported teacher absence rates of 5% or more were secondary schools in the Eastern Cape. This can be attributed to an increase in the number of small schools, and also the mere fact that the Eastern Cape is predominantly a rural landscape. In addition, few secondary schools in the Eastern Cape (32%), in the Free State, Gauteng, the Northern Cape, and the North West (around 40% respectively), registered teacher absence rates below 5%.
In order to validate the SARIMA model, Figure 6 parameter q was selected because it is the largest significant value in the ACF. Here at lag 1, the ACF is clearly significant, but not at lag 2. Therefore, the choice q = 1 for the SARIMA model. The parameter p was selected because it is the largest significant value in the PACF. Here at lag 4, the PACF is clearly significant, but not at lag 5. Therefore, the choice is p = 4 for the SARIMA model. Table 5 shows that the best model (with the smallest Akaike information criterion (AICC) is obtained from P = 0 and Q = 2.

4.3. Forecast Error Measurement

In order to carry out a comparison and ascertain the precision and robustness of the proposed trend detection method against other average methods, the paper adopted measurement tools that are commonly used, i.e., Mean Square Error (MSE) and Mean Absolute Percentage Error (MAPE). As indicated in Table 6, the MSE and MAPE measurement with the smallest values means the better forecasting time series analysis tool for the research. Regardless of the year analysis, the SARIMA model did adequately represent the rate of absenteeism across the provincial series text.

5. Discussion

The findings of this study showed that teacher absenteeism increased statistically significantly between 2011 and 2017. The findings of this study are consistent with a study by Pitts [36], who found that teacher absenteeism rates in central Virginia increased between the 2005 and 2008 academic years. The study further noted that women are more likely to be absent from school than men. A similar study on teacher absenteeism in Wake County Public School System, 2007–2008, found an increase in teacher absenteeism than in 2004–2005 [43]. A trend analysis on teacher absenteeism in North Franklin School District found an increase in absenteeism rates between 1974 and 1985 academic years [44]. Conversely, studies in Indonesia have found a decrease in the rate of absenteeism over a certain period of time. However, the decrease in the rate of absenteeism was attributed to changes in policy and society at large [16]. This research also found that the SARIMA trend or model represents the best fit for forecasting the rate of absenteeism when compared to other models. However, caution should be exercised in using this model as a predictor of absenteeism rate due to the managerial and human assertive motive for teachers.
In addition, it was found that the respondents as a province, KwaZulu Natal (KZN), Limpopo (LP), and WC were significant at the 5% level. This implies that these provinces had higher rates of absenteeism (all things being equal). Teacher absenteeism is a major problem that is affecting the delivery of quality education in South Africa. It is evident that the number of teachers that are absent from schools continues to grow. If the situation is allowed to deteriorate without being checked, the country may find itself moving in backwards, as education is key to national development. Generally, according to Weisberg, Sexton, Mulhern, Keeling, Schunck, Palcisco, and Morgan [45], in developing countries, there is laxity in terms of supervision and management of teachers such that there is no proper mechanism to monitor and punish teachers who are absent from work. Teachers are rewarded on the basis of seniority, and decisions regarding their deployments are based on cronyism and political association.

6. Conclusions

This research analyzed the changes in teacher rate of absenteeism among South African provinces as a major in-class factor contributing to student performance and effective learning. Based on the findings of this research, several recommendations are made for the practice and management of schools. Principals should exert their power in terms of communicating to teachers what behaviors are acceptable and certain behaviors that cannot be tolerated. In this regard, appropriate penalties should be communicated to teachers and applied consistently when teachers do not report for duties without providing a concrete reason. It is imperative for school principals to instill a culture of discipline as modus operandi. There is also a need for school principals to regularly evaluate the issues that are affecting teachers and leading to absenteeism so that proper measures can be put in place to address the scourge at a local level or reported to superiors at the Department of Basic Education for intervention. The problem of teacher absenteeism can also be resolved through mentorship and in-service training for teachers. It is important that teachers undergo training to change their mind-set, attitude, and inculcate positive behaviors that will enable them to be accountable and start taking their jobs seriously. Thus, teachers need to be informed of the implication of absenteeism on the image of the school, their performance, and that of learners. This research has not only contributed to the literature on teacher absenteeism, but it has also provided a broader perspective of statistics on teacher absenteeism in the context of a developing country. Thus, this research, therefore, could act as a benchmark for teacher absenteeism across the Southern African Development Community (SADC) and beyond. The only limitation of this study is that the researcher used secondary data such that it was difficult to gauge the teachers’ perception of absenteeism. However, the data served its purpose in terms of assessing the changes registered on issues of absenteeism between 2011 and 2017. Future studies should make a comparative analysis of the causes of the teacher absenteeism across each of the nine provinces so that interventions can be tailor-made to a particular province.

Funding

This research received no external funding.

Conflicts of Interest

The author declares no conflict of interest.

References

  1. Franklin, S.; McLaren, D. Realising the Right to A Basic Education In South Africa: An Analysis of the Content, Policy Effort, Resource Allocation And Enjoyment of the Constitutional Right to A Basic Education; Studies in Poverty and Inequality Institute: Johannesburg, South Africa, 2015. [Google Scholar]
  2. Asiyai, R.I. Exploring teacher absenteeism dilemma in public secondary schools in Delta State, Nigeria. Issues Ideas Educ. 2017, 5, 73–86. [Google Scholar] [CrossRef]
  3. Chaudhury, N.; Hammer, J.; Kremer, M.; Muralidharan, K.; Rogers, F.H. Missing in action: Teacher and health worker absence in developing countries. J. Econ. Perspect. 2006, 20, 91–116. [Google Scholar] [CrossRef] [PubMed] [Green Version]
  4. Muralidharan, K.; Jishnu, D.; Alaka, H.; Aakash, M. The fiscal cost of weak governance: Evidence from teacher absence in India. J. Public Econ. 2017, 145, 116–135. [Google Scholar] [CrossRef] [PubMed] [Green Version]
  5. Salami, A.O.; Galibaka, G.; Biharnu, D.; Ressaisi, N. Africa economic and financial brief. Mark. Brief 2013, 4, 1–7. [Google Scholar]
  6. News24. SA Teachers Set Absentee Record. 2013. Available online: https://www.news24.com/SouthAfrica/News/SA-teachers-set-absentee-record-20130226 (accessed on 17 October 2019).
  7. Chauke, P. Teacher Absenteeism Behind Failing Pupils. 2014. Available online: http://citizen.co.za (accessed on 11 January 2020).
  8. Mlachila, M.M.; Moeletsi, T. Struggling to Make the Grade: A Review of The Causes and Consequences of the Weak Outcomes of South Africa’s Education System; International Monetary Fund: Johannesburg, South Africa, 2019. [Google Scholar]
  9. Brown, S.L.; Arnell, A.T. Measuring the effect teacher absenteeism has on student achievement at a “Urban but not too urban:” Title I elementary school. Int. J. Humanit. Soc. Sci. 2012, 2, 172–183. [Google Scholar]
  10. Patrinos, H.A. The Hidden Cost of Corruption: Teacher Absenteeism and Loss in Schools. World Bank. 2013. Available online: https://blogs.worldbank.org/education/hidden-cost-corruption-teacher-absenteeism-and-loss-schools (accessed on 16 December 2019).
  11. Balfanz, R.; Byrnes, V. Chronic Absenteeism: Summarizing What We Know from Nationally Available Data; Johns Hopkins University Center for Social Organization of Schools: Baltimore, MD, USA, 2012. [Google Scholar]
  12. Atege, R.M.; Okibo, W. Social factors influencing teacher absenteeism in public primary schools in Kenya. Int. J. Econ. Commer. Manag. 2015, 3, 681–697. [Google Scholar]
  13. Ivatts, A.R. Literature review on teacher absenteeism. Commissioned by Roma Education Fund. J. Educ. 2010. [Google Scholar]
  14. Association for the Development of Education in Africa. Reducing Teacher Absenteeism: Solutionsfor Africa. 2015. Available online: http://www.adeanet.org/en/system/files/resources/policy_brief_reducing_teacher_absenteeism.pdf (accessed on 11 December 2019).
  15. Menon, S.D. Absenteeism among the employees of BSNL in south Indian states. Int. J. Appl. Res. 2014, 2, 152–156. [Google Scholar]
  16. McKenzie, P.; Nugroho, D.; Ozolins, C.; McMillan, J.; Sumarto, S.; Toyamah, N.; Febriany, V.; Sodo, R.J.; Bima, L.; Sim, A.A. Study on Teacher Absenteeism in Indonesia; Education Sector Analytical and Capacity Development Partnership (ACDP): Jakarta, Indonesian, 2014. [Google Scholar]
  17. Abadzi, H. Absenteeism and Beyond: Instructional Time Loss and Consequences; The World Bank: Washington, DC, USA, 2007. [Google Scholar]
  18. Mthombeni, J.S. Teachers’ absenteeism in schools within the Ekurhuleni South District Education Department. Master’s Thesis, University of Johannesburg, Johannesburg, South Africa, 2010. [Google Scholar]
  19. Wambua, G.S. Factors influencing teachers’ absenteeism in public primary school in Ruiru constituency, Kiambu County. Ph.D. Thesis, United State International University, Nairobi, Kenya, 2015. [Google Scholar]
  20. Steers, R.M.; Rhodes, S.R. Major influences on employee attendance: A process model. J. Appl. Psychol. 1978, 63, 391. [Google Scholar] [CrossRef]
  21. Siu, O. Predictors of job satisfaction and absenteeism in two samples of Hong Kong nurses. J. Adv. Nurs. 2002, 40, 218–229. [Google Scholar] [CrossRef] [PubMed]
  22. Sezgin, F.; Koşar, S.; Kılınç, C.; Öğdem, Z. Teacher absenteeism in turkish primary schools: A qualitative perspective from school principals. Int. Online J. Educ. Sci. 2014, 6, 612–625. [Google Scholar] [CrossRef] [Green Version]
  23. Mkhwanazi, B.B. The Effects of Teacher Absenteeism in KwaZulu Natal Secondary Schools. Master’s Thesis, University of Zululand, Durban, South Africa, 1997. [Google Scholar]
  24. Mashaba, E.K.; Maile, S. The cost of teacher absenteeism in selected soshanguve township schools, South Africa. Int. J. Soc. Sci. Entrep. 2013, 1, 171–197. [Google Scholar]
  25. Obiero, E.O.; Mwebi, B.R.; Nyang′ara, N.M. Factors influencing teacher absenteeism in public secondary schools in Borabu Sub-County, Kenya. Int. J. Educ. Res. 2017, 5, 123–138. [Google Scholar]
  26. Betweli, O. The Nature of teacher professional misconduct in Tanzanian public primary schools: The case of sumbawanga municipal and rural districts. Int. J. Educ. 2013, 5, 81–93. [Google Scholar] [CrossRef] [Green Version]
  27. Bennell, P.; Akyeampong, K. Teacher Motivation in Sub-Saharan Africa and South Asia; Department for International Development (DFID): London, UK, 2007.
  28. Miller, R. Teacher absence as a leading indicator of student achievement. Center for American Progress. 2012. Available online: www.americanprogress.org (accessed on 13 September 2019).
  29. Griffith, D. Teachers’ Absenteeism in Charter and Traditional Public Schools; The Thomas B. Fordham Institute: Washington, DC, USA, 2017. [Google Scholar]
  30. Ejere, I.E. Absence from work: A study of teacher absenteeism in selected primary schools in Uyo, Nigeria. Int. J. Bus. Manag. 2010, 5, 29–46. [Google Scholar]
  31. Chapman, D.W. Reducing Teacher Absenteeism and Attrition: Causes, Consequences and Responses; UNESCO, IIEP: Paris, France, 1994. [Google Scholar]
  32. Adeleye, A. Teacher Absenteeism in Nigerian Public Schools; Independent Advocacy Project (IAP): Nigeria, Africa, 2008. [Google Scholar]
  33. Stoica, C.A.; Wamsiedel, M. Inequity and Inequality in Education: Teacher Absenteeism, Romani Pupils, and Primary School in Romania. 2012. Available online: http://www.academia.edu/2545975/Inequality_and_Inequality_Teacher_Absenteeism_Romani_Pupils_and_Primary_Schools_in_Romania (accessed on 15 November 2019).
  34. Govender, P. It’s Not Kids Bunking—It’s Teachers. Mail & Guardian. 3 June 2016. Available online: https://beta.mg.co.za/article/2016-06-02-its-not-kids-bunking-its-teachers/ (accessed on 19 September 2019).
  35. Nyerinda. How Teachers’ Absenteeism Greatly Affects Education. 2014. Available online: http://www.uwezo.net/how-teachers-absenteeism-greatly-effects-education/ (accessed on 10 October 2019).
  36. Pitts, K. Teacher Absenteeism: An Examination of Patterns and Predictors. Ph.D. Thesis, Virginia Commonwealth University, Richmond, VA, USA, 2010. [Google Scholar]
  37. De Myttenaere, A.; Golden, B.; Le Grand, B.; Rossi, F. Using the Mean Absolute Percentage—Error for Regression Models. In Proceedings (p. 113); Presses universitaires de Louvain: Bruges, Belgium, 2015. [Google Scholar]
  38. Kim, S.; Kim, H. A new metric of absolute percentage error for intermittent demand forecasts. Int. J. Forecast. 2016, 32, 669–679. [Google Scholar] [CrossRef]
  39. Department of Basic Education. School Monitoring Survey 2017/2018; Technical Report; Department of Basic Education: Pretoria, South Africa, 2018.
  40. Hadri, K. Testing for stationarity in heterogeneous panel data. Econom. J. 2000, 3, 148–161. [Google Scholar] [CrossRef]
  41. Montgomery, D.C.; Jennings, C.L.; Kulahci, M. Introduction to Time Series Analysis and Forecasting; John Wiley & Sons: Hoboken, NJ, USA, 2015. [Google Scholar]
  42. Appiah, S.T.; Adetunde, I.A. Forecasting exchange rate between the Ghana cedi and the USdollar using time series analysis. Curr. Res. J. Econ. Theory 2011, 3, 76–83. [Google Scholar]
  43. Speas, C.M. Teacher Absences: Types, Frequency, and Impact on Student Achievement, Wake County Public School System, 2007-08. E&R Report No. 09.37; Wake County Public School System: Wake County, NC, USA, 2010. [Google Scholar]
  44. Thompson, G.A. Absenteeism Trends in the North Franklin School District from 1974 to 1985. Ph.D. Thesis, Central Washington University, Ellensburg, WA, USA, 1985. [Google Scholar]
  45. Weisberg, D.; Sexton, S.; Mulhern, J.; Keeling, D.; Schunck, J.; Palcisco, A.; Morgan, K. The Widget Effect: Our National Failure To Acknowledge And Act On Differences In Teacher Effectiveness; New Teacher Project: New York, NY, USA, 2009. [Google Scholar]
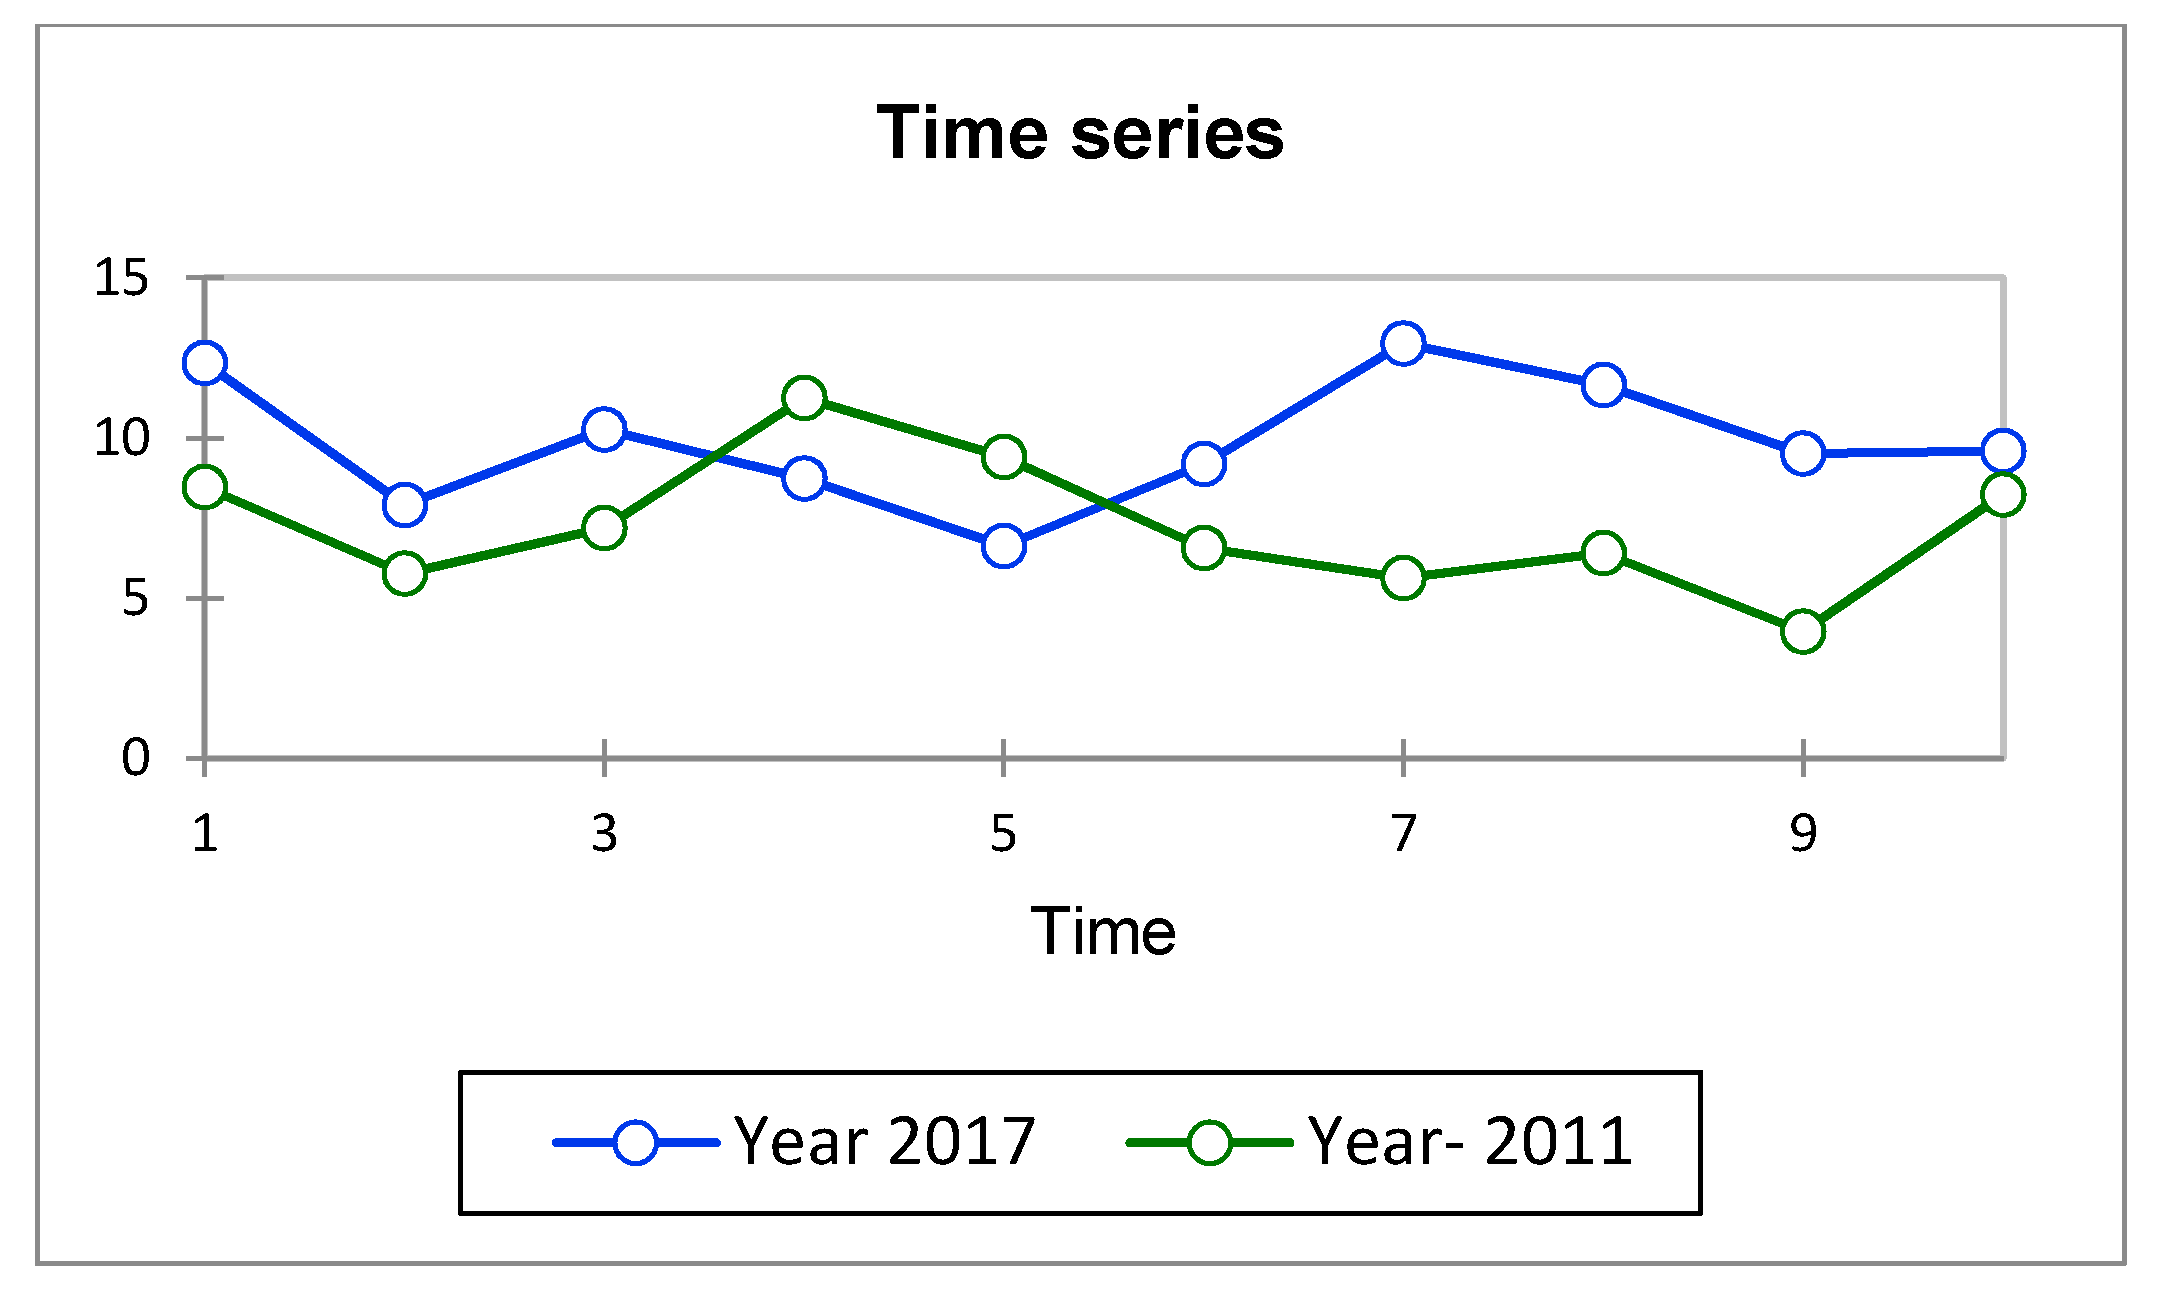
Figure 1. Yearly time series rate of absenteeism distribution.
Education 10 00189 g001
Figure 2. Provincial rate of absenteeism distribution in the year 2017.
Education 10 00189 g002
Figure 3. The Triple Exponential Smoothing rate of absenteeism model.
Education 10 00189 g003
Figure 4. Simple exponential rate of absenteeism model.
Education 10 00189 g004
Figure 5. The seasonal moving average rate of absenteeism distribution.
Education 10 00189 g005
Figure 6. (a,b). The autocorrelation function (ACF-a) and partial autocorrelation function (PACF-b) of the residual’s distribution.
Education 10 00189 g006
Table 1. Summary statistics of the different province’s rate of absenteeism (%).
VariableMinimumMaximumMeanStd. Deviation
1. Eastern Cape (EC)4.40048.20025.00019.068
2. Free State (FS)1.90043.00025.02517.079
3. Gauteng (GT)5.40041.10025.00015.574
4. KwaZulu Natal (KZN)1.20052.60020.97524.616
5. Limpopo (LP)0.90061.70025.00025.928
6. Mpumalanga (MP)1.80048.20025.00018.947
7. Northern Cape (NC)4.00040.00025.00016.793
8. North West (NW)1.90042.10025.02517.056
9. Western Cape (WC)5.40050.40024.97518.970
Table 2. Kwiatkowski–Phillips–Schmidt–Shin (KPSS) test (Trend/Lag Short/Diff (Absent rate (%)).
Eta (Observed Value)0.035
Eta (Critical value)0.144
p-value (one-tailed)0.936
alpha0.05
Test interpretation: H0: The series is stationary. Ha: The series is not stationary. Conclusion: Accept Ho since p > 0.05, and conclude that the data series is stationary.
Table 3. ANOVA.
Table 3. ANOVA.
SourceDFSum of SquaresMean SquaresFPr > F
Model12.7852.7850.6020.463
Error732.3784.625
Corrected Total835.164
Computed against model Y=Mean(Y).
Table 4. Model parameters (the Year 2017).
SourceValueStandard ErrortPr > |t|Lower Bound (95%)Upper Bound (95%)
Intercept11.8292.5774.5900.0035.73517.923
Year-2011−0.2680.345−0.7760.463−1.0830.548
Table 5. The best model (with the smallest AICC) is obtained from P = 0 and Q = 2.
pqPQAICC
4000526.717
4102521.897
The best model for the selection criterion is displayed in bold.
Table 6. Results and analysis of Mean Square Error (MSE) and Mean Absolute Percentage Error (MAPE) values for each method.
Time Series MethodMSEMAPE
Triple Exponential Smoothing(Holt-Winters)177.7518.04
Seasonal Auto-Regressive Integrated Moving Average95.8215.30
Moving Average (MA)57.23172.75