Review

Conceptual Model of Measuring MHEI Efficiency

Maritime Department, University of Zadar, 23000 Zadar, Croatia
*
Author to whom correspondence should be addressed.
Educ. Sci. 2020, 10(12), 385; https://doi.org/10.3390/educsci10120385
Submission received: 28 November 2020 / Revised: 11 December 2020 / Accepted: 13 December 2020 / Published: 16 December 2020
(This article belongs to the Section STEM Education)

Abstract

:
Modern societies, new technical equipment and technology confirm the importance of knowledge acquisition in everyday life, especially in economy. An education system is a non-profit system. Since it strongly affects economic efficiency, its quantification becomes a very complex process. In order to make the quantification process possible, this paper analyses the already existing criteria for measuring efficiency in higher education systems. The already existing models of measuring educational efficiency are universal and do not analyse different professions’ specific qualities. In this paper, models of measuring educational efficiency were analysed separately, whereas their interrelations were not a part of the analysis. A conceptual model of measuring maritime higher education institutions’ (hereinafter: MHEI) efficiency was proposed on the basis of the above-mentioned analysis. All the evaluation criteria relevant for MHEI and their interrelations were determined.

1. Introduction

It is a general opinion that a country’s social and economic growth depend on its citizens’ level of education, i.e., investment in higher education is an investment in the country’s economic prosperity. Investment in an education system and in scientific research has a positive effect on economic growth, regional competitiveness and on one’s personal growth [1]. Education system evaluation has become very important recently. The term evaluation implies the analysis of two basic factors—effectiveness and efficiency [2]. Since there is no clear difference in meaning between these two terms, effectiveness and efficiency are very frequently used interchangeably [3]. However, it is important to emphasise that they do not have the same meaning [4]. Both terms refer to ratios describing various aspects of the process [5]. Effectiveness refers to the ability of an educational institution to achieve institutional goals, whereas efficiency refers to achieving institutional goals with the best utilisation of resources [2]. In other words, effectiveness does not analyse the utilised resources and expenses, i.e., what is effective does not have to be efficient [3]. Research referring to higher education effectiveness started, in Western countries, in the 1980s and 1990s [6]; however, the research referring to some factors that affect effectiveness started even before, for example rating methods in research of teaching [7]. It is believed that an institution is effective if all stakeholders, such as government, students, parents, etc., are satisfied [8]. In addition, it is important to mention and emphasize the students’ evaluation, which has been used for decades to evaluate the teaching process [9]. Stakeholders in an education system, as defined in this paper, are government, local community, companies, educational institutions, and students. The stakeholders’ expectations force the institutions to manage money more efficiently and to increase government’s transparency in financing the institutions [10]. It is believed that a system is efficient if it achieves maximum results with minimal utilisation of given resources [11]. Educational institutions have shown the ability to maintain a satisfactory level of efficiency when the number of resources increases. However, when the number of resources decreases, the level of education efficiency decreases as well. Such situations demand bigger or the same work input with less financial resources [12]. A decrease in governments’ investments in education systems has been noticed recently, and it is the result of different circumstances [13]. Therefore, in order to satisfy the increasing demands, and to maintain the existing education quality, educational institutions have dedicated themselves to finding additional income and to increasing the efficiency level [14].
Criteria used to measure efficiency can, in part, be the same for different professions, i.e., study programmes. Therefore, because of the particularities of different professions, it is important to determine whether the additional criteria applicable to only one particular profession can be defined. In this case, criteria particular for the seafarers’ education. In order to achieve higher quality results, criteria should not be measured separately. Their mutual interrelations should be determined as well. The abovementioned analysis was applied in this research on the seafarers’ education system. In other words, all the relevant criteria that affect the seafarers’ higher education system were determined, as well as their interrelations.

2. Literature Overview

Education systems have many flaws, e.g., inadequate cooperation with the economy, inadequate orientation towards the generic competences acquisition, inadequate interrelations between science and professional competences, and lack of practical work [15]. Therefore, it is of the utmost importance to determine the adequate model of measuring efficiency. Measuring educational efficiency is a bit difficult because of the system’s characteristics. The system itself is the non-profit one; therefore, input and output expenditures are not measured [16]. The goal of the system is not to make profit, the final product is not for sale, there are many input and output variables, the results are visible only after some time and are mostly not evaluated [17]. In order to measure efficiency, it is important to analyse input and output variables, the process itself and stakeholders’ feedback [18]. Based on the literature analysis, the authors Kaur and Bhalla isolated eight factors that affect effectiveness: academic environment, college administration, student support services, learning material, infrastructure facilities, placement services, extracurricular activities and financial administration [19], most of which are used to measure quality in higher education [20].
Input variables needed to estimate efficiency are different in every system [10]. Since there is no standard to measure variables, it is very difficult to compare different countries’ study programmes [16]. Therefore, the efficiency estimate, in most of the cases, is based on the comparison and proportion of ensured resources and expenses. The system is efficient if ensured resources do not exceed expenses [17].
Generally speaking, it is possible to measure efficiency in two ways, by measuring input and by measuring output criteria. Table 1 shows different approaches to measuring efficiency based on the analysed literature, i.e., different input and output criteria used to measure educational efficiency.
According to the analysed literature and data shown in the tables, it can be concluded that the most common input criteria to measure efficiency are the number of teaching staff, the number of non-teaching staff and the number of students. The most common output criteria are the number of graduates and the number of publications, i.e., scientific productivity. According to [10] whose opinion is almost the same as the results shown in Table 1, the most common input criteria are total expenditure, financial resources, the number of students and employees, whereas the most common output criteria are scientific productivity, number of graduates, etc. [10].
It is important to emphasize that education system’s efficiency is very frequently measured by economic models [17]. Furthermore, data envelopment analysis (DEA) is also very frequently used to measure educational efficiency. This method is used to solve the problem of data envelopment in order to obtain a coherent and complete efficiency estimate [35]. The DEA method is used in systems with no clear data input needed to create output efficiency. It is applied in education systems, health systems, banking, military, sports, etc. [36].
In order to estimate to what extent a certain system is efficient, it is important to answer the following questions [37]:
  • Are all the students ready for labour market upon the completion of their education?
  • To what extent is the system available to students with different previous education?
  • Do the differences in previous education affect students’ success?
  • What is the percentage of scientific productivity?
  • How does the institution utilise the resources it has?
  • What is the average duration of studies per student?
  • Are contemporary methods used in teaching and what is their efficiency?
The answers to these questions show the level of efficiency of a higher education system. Therefore, on the basis of these questions, the analysed literature and particularities of the maritime education and training, a conceptual model of measuring maritime higher education institutions’ (MHEI) efficiency will be proposed in this paper. A conceptual model of measuring MHEI efficiency is based on universal variables used to measure higher education efficiency; however, it also takes into consideration variables specific only for the seafarers’ education.

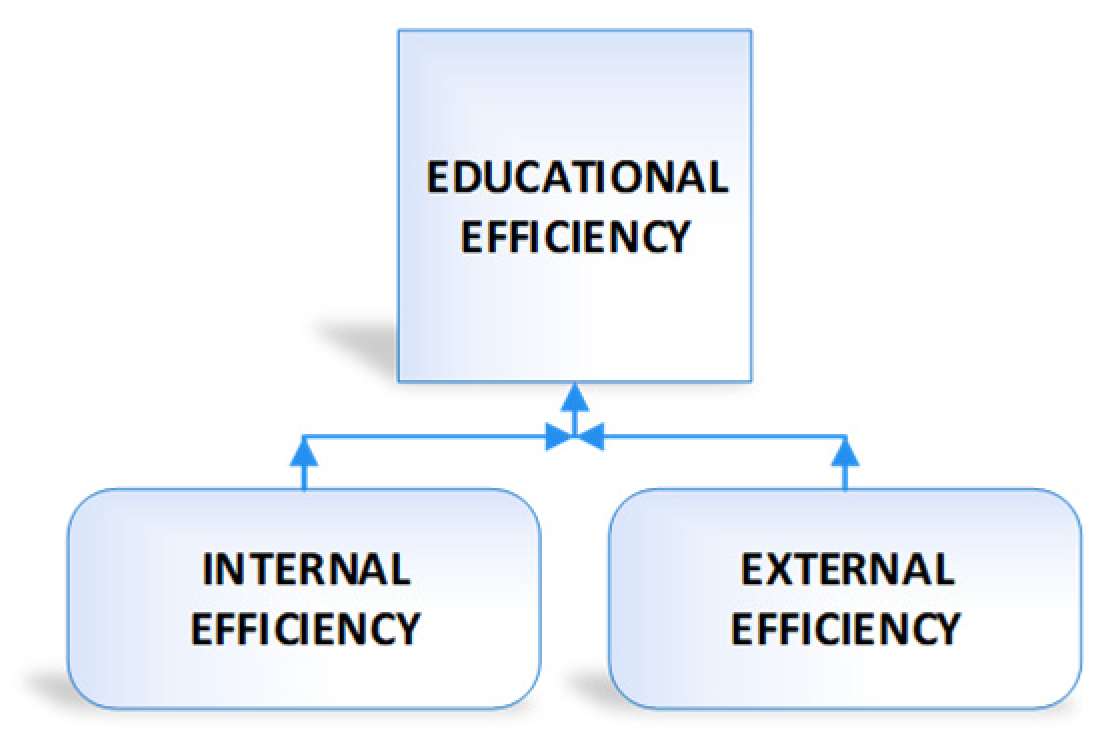
3. Conceptual Model of Measuring MHEI Efficiency

Concept presented in this paper suggests an approach to measure educational efficiency by classifying efficiency into the internal and external one (Figure 1). Although they are interrelated, they can be analysed separately. This classification should facilitate the process of measuring efficiency and, at the same time, help to increase the effect on the criteria that affect efficiency.

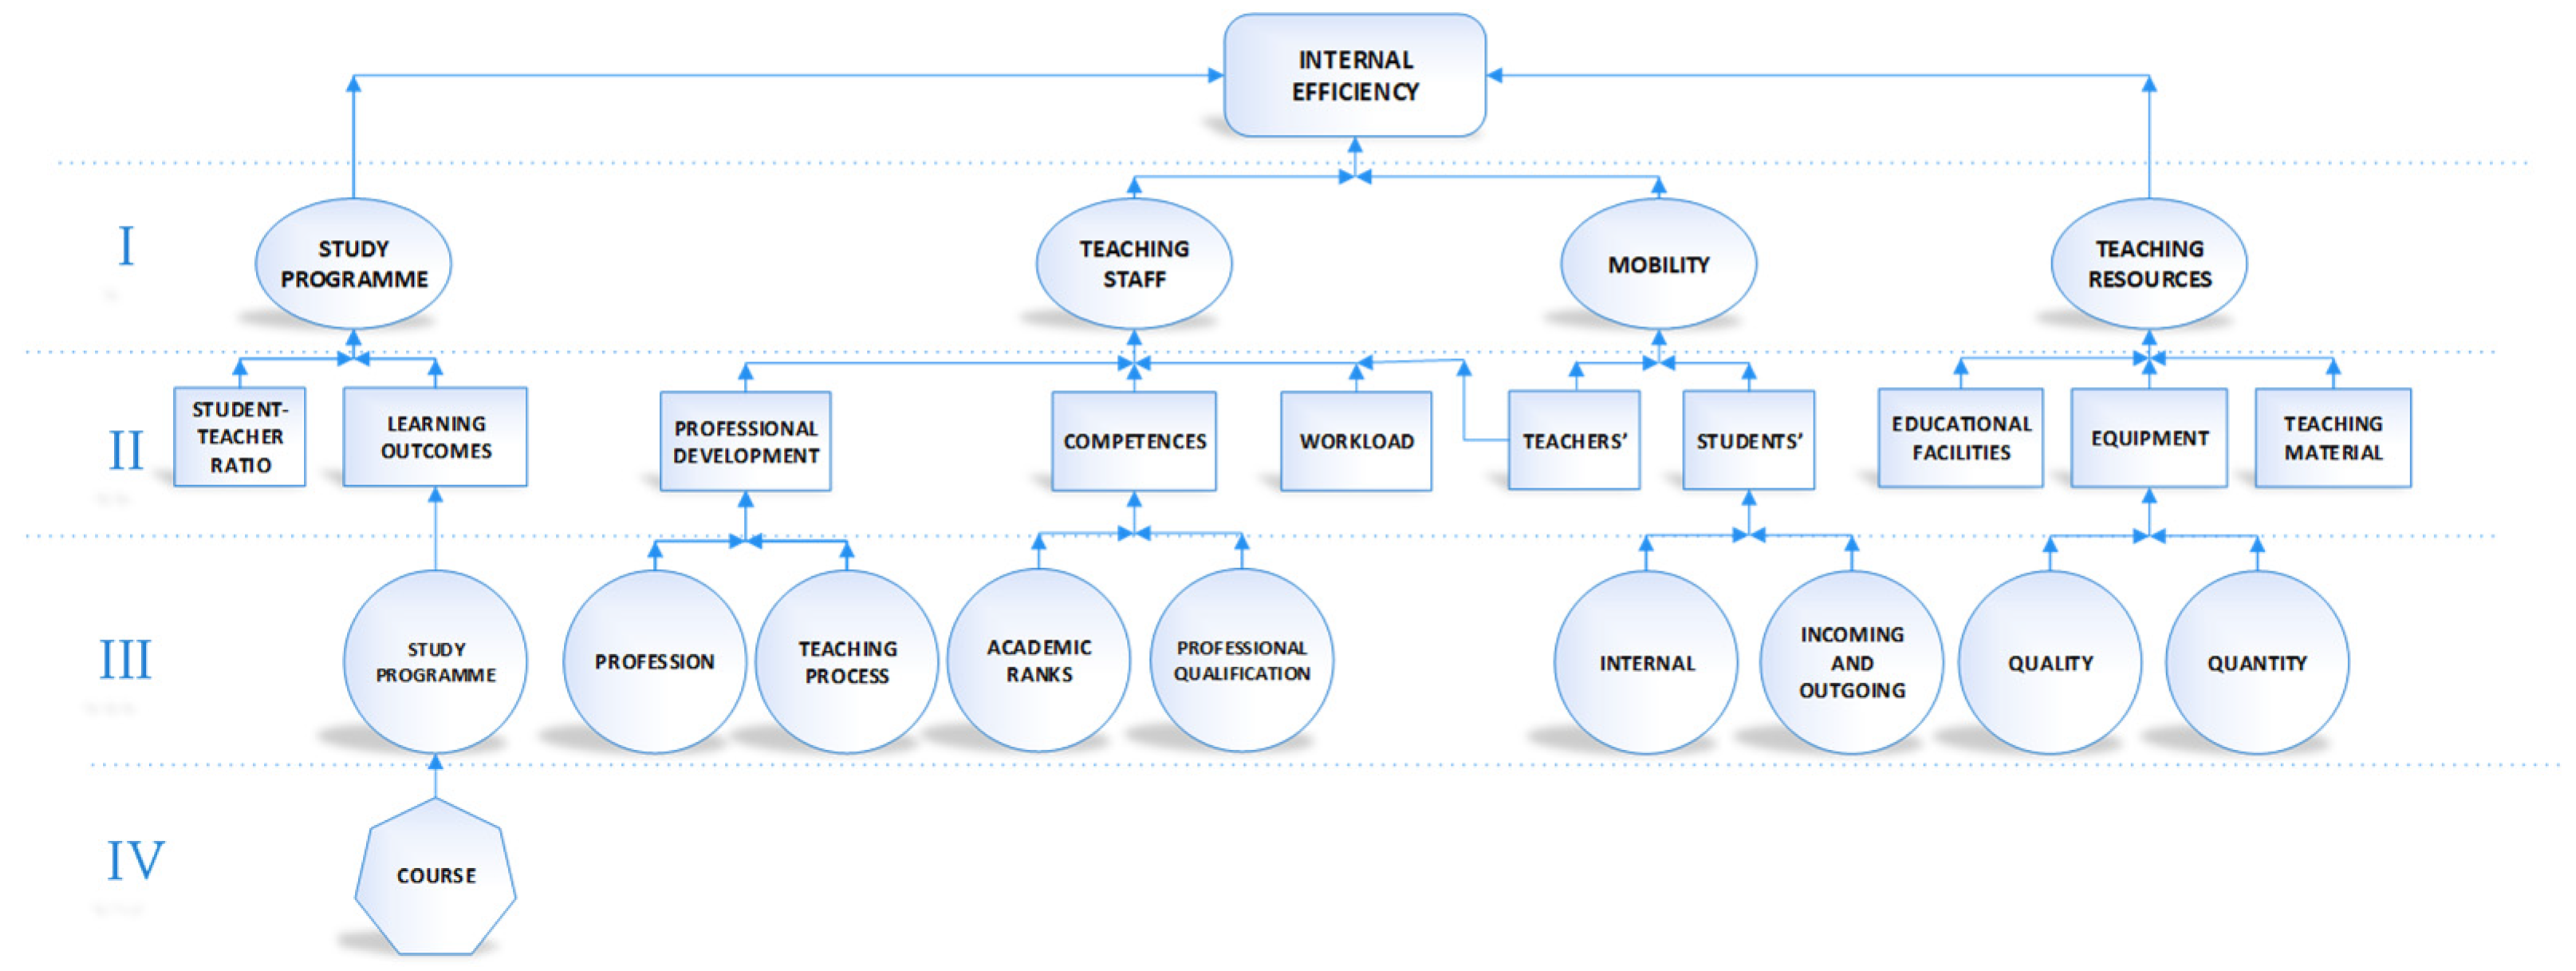
3.1. Internal Efficiency

The term internal efficiency implies the study programme’s success level. Success level is a level to which an institution ensures competence acquisition for jobs at management level on ships of 3000 gross tonnage or more. Internal efficiency depends on the study programmes (curriculum), students and staff mobility, teaching staff and resources invested in teaching. Based on definitions and classifications explained in the previous section, it was possible to hierarchically present the variables, starting from the first to the fourth degree criteria (Figure 2).

3.1.1. Study Programme

The first degree criterion, Study Programme, depends on the second degree criteria, Learning Outcomes and Student–Teacher Ratio. In practice, however, learning outcomes are measured at a study programme level or at a course level. Input data are based on the data on coordination of learning outcomes at the study programme level with European Qualifications Framework (EQF). EQF serves as an instrument to identify and understand the European countries’ qualification frames [38]. Identification of acquired qualifications level between the European countries is based on measurable learning outcomes, mutual trust, the security system and a system of quality management [39]. The fourth degree criterion, Course Learning Outcomes, affects the third degree criterion, Study Programme Learning Outcomes, which consequently affects the second degree criterion, Learning Outcomes. Some courses’ learning outcomes contribute to the learning outcomes of a whole study programme [39].
As far as the second degree criterion, Student–Teacher Ratio, is concerned, it is believed that systems with a smaller student–teacher ratio have more qualitative teaching process. The average student–teacher ratio in OECD (Organization for Economic Co-operation and Development) countries is 1:15 [40]. According to the 2006 research, Greece has the highest ratio, 1:30, whereas the ratio in Japan, Ireland, Slovakia and Sweden is 1:11 or even smaller. Generally speaking, the ratio that gets analysed is the ratio of the number of permanently employed teachers to students. However, when estimating the second degree criterion, Student–Teacher Ratio, it is not important whether teachers are permanently employed at an institution. What matters is the total number of teachers in the teaching process. It is important to emphasise that external associates at MHEIs are usually professionals working in the maritime industry who, with their practical knowledge, improve the quality of the teaching process.

3.1.2. Teaching Staff

The first degree criterion, Teaching Staff, depends on the second degree criteria, Teachers’ Professional Development, Teachers’ Competences, Teachers’ Workload and Teachers’ Mobility. The second degree criterion, Teachers’ Professional Development, depends on the professional development of teachers in the teaching process and in their profession. The term Professional Development in the Teaching Process implies professional development with the scope of improving a study programme and the way teaching process is carried out. Such a professional development includes workshops, training programmes, lectures on the process of implementation of new study programmes, external evaluation, modern teaching methods, leading a project, making important strategic documents, etc. The term Professional Development of Teachers in their Profession implies the professional development in maritime profession that is focused on acquiring new and/ or improving the already existing professional competences. Such a professional development includes workshops and training on the particular type of ships’ equipment, seagoing service relevant to the issue or revalidation of a certificate or other qualification, and any other additional training regarding ship’s equipment, etc. The second degree criterion, Teachers’ Competences, refers to academic ranks and qualifications in the maritime profession. National laws stipulate conditions for academic promotion and advancement requirements. A part of the courses at MHEI is highly practice-oriented with a focus on the acquisition of hands-on practical skills. Because of that reason, it is not necessary for all the teachers to possess a PhD academic degree. For teachers teaching practice-oriented courses, their professional qualification is enough. Something similar is written in the International Convention on Standards of Training, Certification and Watchkeeping for Seafarers (STCW Convention). According to the STCW Convention, every teacher teaching a practical course should be qualified in the task for which the training is being conducted and should have full understanding of the course material, assessment methods and practice. The second degree criterion, Teachers’ Workload, refers to the teacher’s number of working hours per year. National laws regulate it.

3.1.3. Mobility

The first degree criterion, Mobility, refers to students and teachers visiting higher institutions abroad with the goal of studying or working there [41]. Students and teachers’ mobility is one of the major goals of the Bologna Process [42]. Mobility positively affects an individual as well as the institution he/ she studies or works at. Positive effect on the individual can be noticed in the exchange of scientific and professional ideas and in the development of a part of generic competences, which are important for maritime professions. A positive effect on the institution can be noticed in the exchange in good practice that can improve institutional performance, students’ employability, international and institutional cooperation, etc. [41]. Students who have participated in the mobility programmes have better employment possibilities [43]. Five years after graduation, their unemployment rate was 23% smaller than of the students who did not participate in such programmes. The number of employers who think that mobility programmes are important for employment has doubled in the period from 2006 to 2013 (from 37 to 64%). On the other hand, 81% of the students who have participated in the mobility programmes think that their generic competences improved after the participation in the mobility programmes [44]. The EU’s goal is to have 20% of the total number of students participating in the mobility programmes by the end of 2020. Some of the obstacles to this goal are inadequate institutional formal recognition of the qualifications, insurance problems, visa problems, etc. The first degree criterion, Mobility, is affected by the second degree criteria, Students’ Mobility and Teachers’ Mobility.
The second degree criterion, Students, refers to studying abroad for at least one semester. Apart from the third degree criterion, Students’ Incoming and Outgoing Mobility, the third degree criterion, Internal Mobility also has an important role on students’ competence. The term Internal Mobility refers to the number of students who have taken up elective courses at other study programmes.
Generally speaking, there are restrictions referring to the number of teachers interested in the ongoing and incoming mobility. When planning mobility programmes, it is important to ensure teacher’s job continuity at his/her institution (e.g., continuity of the courses and administration).

3.1.4. Teaching Resources

The second degree criteria Educational Facilities, Equipment and Teaching Material affect the first degree criterion Teaching Resources.
The adequacy of educational facilities for teaching is determined by the ratio of the number of enrolled students to the size of usable space. For each student, there should be 1.25 m2 of usable space [39]. Educational facilities should be equipped with the sufficient number of seating places and with teaching equipment. Computer rooms should be equipped with modern computers, whereas the students should be able to use laptops even when the teaching process is not carried out.
The equipment should meet the requirements of the third degree criteria, Quality and Quantity. The equipment meets the quality requirements when it serves to acquire a competence prescribed by the Convention. The equipment meets the quantity requirements when it is adjusted to the number of students.
The second degree criterion, Teaching Material, depends on the number of obligatory and additional copies of the available literature. The number of copies of obligatory literature for every course should amount to 20% of the expected number of students enrolled in the subject [45]. On the other hand, the number of copies of the additional literature for every course should amount to 10% of the expected number of students enrolled in the subject.

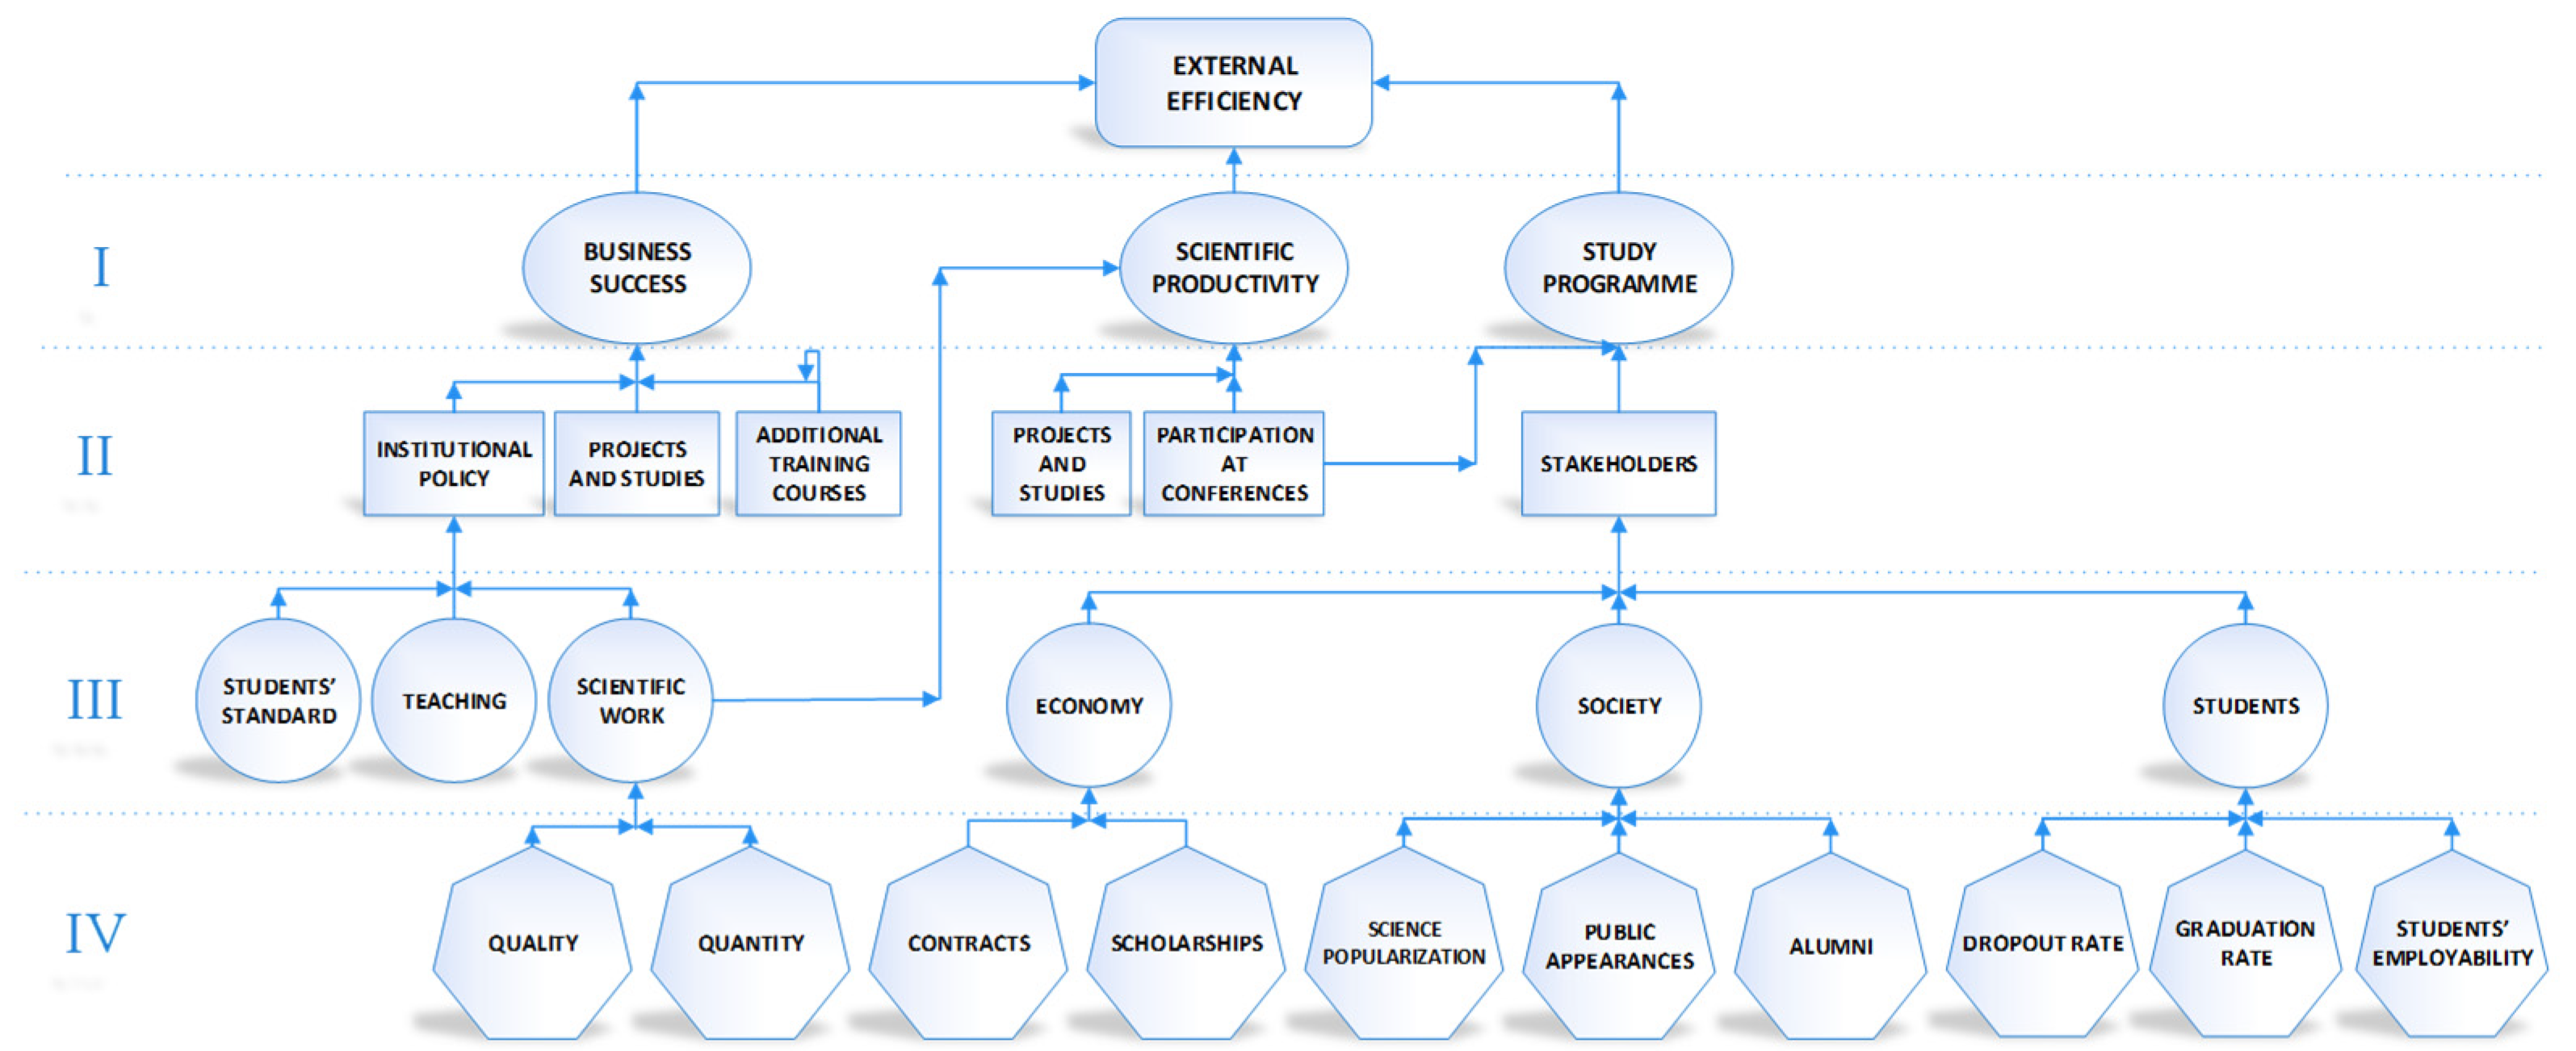
3.2. External Efficiency

External efficiency refers to an institution’s success level in regard to the requirements of all the partners in the educational process (Figure 3). External efficiency depends on the business success of an institution, scientific productivity and the study programme (curriculum).

3.2.1. Scientific Productivity

The first degree criteria, Scientific Productivity, refers to scientific publications, participation at international and national conferences, participation at and leading the international and national projects and studies. Scientific productivity is mostly measured by quantitative, bibliometric analysis tools that include type, publication number and other results of the scientific work measured in relation to the number of scientists at an institution [46]. Scientific productivity depends on the scientific work, projects and studies, participation at conferences and institutional policy.
One of the ways to measure scientific productivity is to determine the number of publications in scientific journals for a certain period of time [37]. Scientific productivity is usually analysed for every teacher individually. It can be presented by a quantitative and a qualitative model. The quantitative model refers to the average number of publications per teacher annually. Research quality can be determined on the basis of the journal quartile ranking—journal ranking by quartile (Q1, Q2, Q3, Q4). Quartile classification is mostly determined on the basis of the citations’ report Journal Citation Report (JCR) or SCImago Journal Rank Indicator (SJR) in the year of the publication [47].
Participation at conferences is measured on the basis of the average annual number of participations at conferences in the last five years.

3.2.2. Business Success

The first degree criterion, Business Success of an Institution, depends on the institutional policy, projects and studies carried out at the institution, and on the additional maritime training courses.
The second degree criterion, Institutional Policy, refers to the institution’s management and its orientation towards achieving its primary activities. It depends on third degree criteria, Scientific Work, Teaching and Students’ Standard. Scientific work refers to the figures referring to the institution’s investments in the scientific productivity of its teachers. Investments in the scientific productivity imply research funding, i.e., scientific publications and purchase of the equipment needed for the research.
The third degree criterion, Scientific Work, is affected by the fourth degree criterion, Quality and Quantity, as mentioned in the Section 3.2.1, Scientific Productivity. Teaching refers to financing teachers’ training, investing in modern equipment and educational activities. The term Students’ Standard refers to financing or co-financing students’ life or study expenses. Life expenses refer to accommodation, food, transport, health, communication, children, student loans and social activities.
Investments in the institution’s primary activities very frequently depend on the government’s higher education investments (as a gross domestic product percentage). The average budget allocated for higher education was around 1.2% in the EU countries in 2015. The highest allocations were in Sweden (1.96%), Finland (1.9%) and Denmark (2.4%), whereas the lowest were in Luxembourg (0.5%) and Bulgaria (0.7%) [48].
The term Projects refers to all scientific, professional, collaborative, EU and other projects that teachers had participated in.
Training programmes are not only the programmes that aim at gaining training and additional training certificates, but also all the programmes that result from the cooperation with the economy and/or the society.

3.2.3. Study Programme

The first degree criterion, Study Programme, is affected by the second degree criteria in which a study programme has to fulfil the stakeholders’ requirements. Stakeholders, a part of the third degree criteria, are Economy, Society and Students.
The third degree criterion, Students, is affected by the fourth degree criteria, Dropout Rate, Graduation Rate and Students’ Employability. The abovementioned is important because of the opinion that a positive effect on the economic growth and employment in the EU can be achieved only when the dropout rate is reduced. Moreover, it is important to ensure that at least 40% of persons aged from 30 to 34 have finished at least the tertiary level of education. These goals were defined by the EU strategy for growth in section referring to education [49]. It is estimated that around 30 to 40% of the students give up on their studies and never finish them [50]. The criterion, Dropout Rate, should be analysed for the first year of the study programme. In order to determine the graduation rate, it is important to analyse the number of students who had graduated on time, based on the five-year period.
Unemployment is a great economic and social problem [51]. Therefore, governments and institutions involved in higher education have to create study programmes that meet the requirements of labour market. As an example, the 2016 situation can be mentioned, when the graduates’ employment rate in the EU was 80.8 [52]. As far as maritime industry is concerned, when determining the rate of (un)employed persons, one should take into consideration only the persons who have graduated in maritime fields and who work solely in maritime related fields.
The third degree criterion, Economy, is affected by the fourth degree criteria, Contracts and Scholarships. Cooperation between higher education institutions and the economy is the key to the development of knowledge society. Their cooperation has a positive effect on the students’ employment, research success, technology transfer, research and teaching quality and the possibility of research funding [53]. It is not uncommon for a student to be given a scholarship and later to be employed by the economy firm that had given the scholarship (Contracts).
The third degree criterion, Society, is affected by the fourth degree criteria, Alumni, Science Popularization and Public Appearances. Generally speaking, institutions invest resources to involve the society in their activities. These activities usually refer to science popularisation projects, employees and students’ public appearances and alumni’s activities. Science popularisation is the evidence of cooperation between scientific institutions and the society as a whole [54]. Its goal is to increase the public interest in science. Investments in science popularisation are determined in the same way as the investments in students’ standard, scientific work and teaching. The term, Public Appearances, refers to different types of media coverage with the goal of promoting the institution’s work. The term media, in this paper, refers to newspapers, radio and television. Social media advertisement is not considered a public appearance. Alumni are founded with the goal of keeping the tradition alive, promoting the institutions’ reputation and development, strengthening the cooperation between former students, other institutions, research and development institutions and institutions where former students work [55].

4. Conclusions

Education has an important impact on country’s economic prosperity. Therefore, as of recently, more attention has been paid to measuring efficiency of higher educational institutions.
In order to measure MHEIs’ efficiency, it is important to define criteria that affect the efficiency level. These criteria are usually divided into the internal and external ones, and each of them is later subdivided into the first to the fourth degree criteria. It is possible to isolate the most frequently analysed criteria (the most important ones)—number of graduated students, number of teachers and scientific productivity. An education system’s efficiency is very frequently measured by economic models.
The problem with the systems analysed so far is that the criteria were measured separately without paying much attention to their interrelations. Moreover, when measuring criteria by using only economic models, not all the criteria that affect the level of educational efficiency were taken into consideration. Finally, if taking into consideration particularities of different systems as far as facilities, equipment and the need to employ teaching professionals for economic fields, it can be concluded that the criteria to measure different systems’ efficiency cannot be universal. Therefore, besides the criteria most commonly used for all professions, such as scientific productivity, it was important to determine the criteria, and their effects, that are applicable only on the seafarers’ education system. This paper gives a systematic overview of the criteria (and their classification) that have been scientifically proven to have an important effect on the internal and external efficiency of the seafarers’ higher education system.
This classification—criteria’s interrelations and their effect on the MHEIs efficiency—is the basis for the future research on this topic. One of the possible upgrades is the identification of a mathematical model that would enable measuring the criteria efficiency by using their classification elaborated in this paper. Apart from using more simple and standardised models to measure efficiency, this approach would make the comparison of two or more MHEI’s possible.

Author Contributions

Conceptualization, A.G. and D.Ž.; methodology, A.G., D.Ž., L.G. and M.B.; software, A.G. and D.Ž.; validation, A.G. and D.Ž.; formal analysis, A.G., D.Ž., L.G. and M.B.; investigation, A.G., D.Ž. and L.G.; resources, M.B.; data curation, M.B.; writing—original draft preparation, A.G. and D.Ž.; writing—review and editing, A.G. and D.Ž.; visualization, L.G.; supervision, A.G.; project administration, M.B.; funding acquisition, A.G., D.Ž., L.G. and M.B. All authors have read and agreed to the published version of the manuscript.

Funding

This research received no external funding.

Conflicts of Interest

The authors declare no conflict of interest.

References

  1. IMHE Info, Programme on Institutional Management in Higher Education. 2006. Available online: https://files.eric.ed.gov/fulltext/ED504117.pdf (accessed on 27 September 2020).
  2. Cornali, F. Effectiveness and Efficiency of Educational Measures: Evaluation Practices, Indicators and Rhetoric. Sociol. Mind 2012, 2, 255. [Google Scholar] [CrossRef] [Green Version]
  3. Lockheed, M.E.; Hanushek, E.A. Concepts of Educational Efficiency and Effectiveness; World Bank: Washington, DC, USA, 1994. [Google Scholar]
  4. Kenny, J. Efficiency and Effectiveness in Higher Education: Who is Accountable for what? Aust. Univ. Rev. 2008, 50, 11. [Google Scholar]
  5. Cowan, J. Effectiveness and Efficiency in Higher Education. High. Educ. 1985, 14, 235–239. [Google Scholar] [CrossRef]
  6. Guangli, Z. The Effectiveness of the Higher Education Quality Assessment System: Problems and Countermeas. China. Chin. Educ. Soc. 2016, 49, 39–48. [Google Scholar] [CrossRef]
  7. Remmers, H.H. Rating Methods in Research of Teaching. In Handbook of Research on Teaching; Gage, N.L., Ed.; Rand McNally: Chicago, IL, USA, 1971. [Google Scholar]
  8. Cameron, K.S. Domains of Organizational Effectiveness in Colleges and Universities. Acad. Manag. J. 1981, 24, 25–47. [Google Scholar]
  9. Leguey Galán, S.; Leguey Galán, S.; Matosas López, L. ¿De qué depende la satisfacción del alumnado con la actividad docente? Espacios 2018, 39, 13–29. [Google Scholar]
  10. Nazarko, J.; Šaparauskas, J. Application of DEA Method in Efficiency Evaluation of Public Higher Education Institutions. Technol. Econ. Dev. Econ. 2014, 20, 25–44. [Google Scholar] [CrossRef] [Green Version]
  11. Seiler, M.F.; Ewalt, D.J.A.G.; Jones, J.T.; Landy, B.; Olds, S.; Young, P. Indicators of Efficiency and Effectiveness in Elementary and Secondary Education Spending. In Legislative Research Commission; Office of Education Accountability: Frankfort, KY, USA, 2006. [Google Scholar]
  12. Massy, W. Metrics for Efficiency and Effectiveness in Higher Education: Completing the Completion Agenda. In Proceedings of the State Higher Education Executive Officers’(SHEEO) Annual Meeting, Boulder, CO, USA, 4–6 November 2011. [Google Scholar]
  13. Robinson-Bryant, F. Defining a Stakeholder-Relative Model to Measure Academic Department Efficiency at Achieving Quality in Higher Education. Ph.D. Thesis, University of Central Florida, Orlando, FL, USA, 2013. [Google Scholar]
  14. Gates, S.M.; Stone, A. Understanding Productivity in Higher Education; RAND Corporation: Santa Monica, CA, USA, 1997. [Google Scholar]
  15. Palekčić, M. Uspješnost i/ili učinkovitost obrazovanja nastavnika. Odgoj. Znan. 2008, 10, 403–423. [Google Scholar]
  16. Andersson, C.; Antelius, J.; Månsson, J.; Sund, K. Technical Efficiency and Productivity for Higher Education Institutions in Sweden. Scand. J. Educ. Res. 2017, 61, 205–223. [Google Scholar] [CrossRef]
  17. Duguleana, C.; Duguleana, L. Efficiency in Higher Education. Bull. Transilv. Univ. Bras. Econ. Sci. 2011, 4, 115. [Google Scholar]
  18. Kraipetch, C.; Kanjanawasee, S.; Prachyapruit, A. Organizational Effectiveness Evaluation for Higher Education Institutions, Ministry of Tourism and Sports. Res. High. Educ. J. 2013, 19, 1. [Google Scholar]
  19. Kaur, H.; Bhalla, G.S. Determinants of Effectiveness in Public Higher Education—Students’ Viewpoint. Int. J. Educ. Manag. 2018, 32, 1135–1155. [Google Scholar] [CrossRef]
  20. Gil Edo, M.T.; Roca Puig, V.; Camisón Zornoza, C. Hacia modelos de calidad de servicio orientados al cliente en las universidades públicas: El caso de la Universitat Jaume I. Investigaciones Europeas de Dirección y Economía de la Empresa 1999, 5, 69–92. [Google Scholar]
  21. Srairi, S.A. The Efficiency of Tunisian Universities: An Application of a Two-Stage DEA Approach. J. Knowl. Glob. 2014, 7, 31–58. [Google Scholar]
  22. Ramírez-Correa, P.; Peña-Vinces, J.C.; Alfaro-Pérez, J. Evaluating the Efficiency of the Higher Education System in Emerging Economies: Empirical Evidences from Chilean Universities. Afr. J. Bus. Manag. 2012, 6, 1441. [Google Scholar] [CrossRef]
  23. Agasisti, T.; Pohl, C. Comparing German and Italian Public Universities: Convergence or Divergence in the Higher Education Landscape? Manag. Decis. Econ. 2011, 33, 71–85. [Google Scholar] [CrossRef]
  24. Daraio, C.; Bonaccrosi, A.; Simar, L. Efficiency and Economies of Scale and Scope in European Universities: A Directioanl Distance Approach. J. Informetr. 2015, 9, 430–448. [Google Scholar] [CrossRef] [Green Version]
  25. Parteka, A.; Wolszczak-Derlacz, J. The Impact of Trade Integration with the European Union on Productivity in a Post Transition Economy: The Case of Polish Manufacturing Sectors. Emerg. Mark. Financ. Trade 2013, 49, 84–104. [Google Scholar] [CrossRef]
  26. Bursalioglu, S.A.; Selim, S. Factors Determining the Efficiency of Higher Education in the European Union and Turkey. BILIG 2015, 74, 45–69. [Google Scholar]
  27. Johnes, J.; Li, Y.U. Measuring the Research Performance of Chinese Higher Education Institutions Using Data Envelopment Analysis. China Econ. Rev. 2008, 19, 679–696. [Google Scholar] [CrossRef] [Green Version]
  28. Scheerens, J.; Luyten, H.; van Ravens, J. Measuring Educational Quality by Means of Indicators. In Perspectives on Educational Quality; Springer: Dordrecht, The Netherlands, 2011; pp. 35–50. [Google Scholar]
  29. Cunha, M.; Rocha, V. On the Efficiency of Public Higher Education Institutions in Portugal: An Exploratory Study. Univ. Porto FEP Work. Pap. 2012, 468, 1–30. [Google Scholar]
  30. Ramzi, S.; Ayadi, M. Assessment of Universities Efficiency Using Data Envelopment Analysis: Weights Restrictions and Super-Efficiency Measure. J. Appl. Manag. Investig. 2016, 5, 40–58. [Google Scholar]
  31. Agasisti, T.; Pérez-Esparrells, C. Comparing Efficiency in a Cross-country Perspective: The Case of Italian and Spanish State Universities. High. Educ. 2010, 59, 85–103. [Google Scholar] [CrossRef] [Green Version]
  32. Matosas-López, L.; Leguey-Galán, S.; Doncel-Pedrera, L.M. Converting Likert scales into Behavioral Anchored Rating Scales(Bars) for the evaluation of teaching effectiveness for formative purposes. J. Univ. Teach. Learn. Pract. 2019, 16, 1–24. [Google Scholar]
  33. Panaretos, J.; Malesios, C. Assessing a Researcher’s Scientific Productivity and Scholarly Impact. In A Guide to the Scientific Career; Wiley: Hoboken, NJ, USA, 2019; pp. 69–79. [Google Scholar] [CrossRef]
  34. Paura, L.; Arhipova, I. Cause Analysis of Students’ Dropout Rate in Higher Education Study Program. Procedia Soc. Behav. Sci. 2014, 109, 1282–1286. [Google Scholar] [CrossRef] [Green Version]
  35. Korent, D.; Detelj, K.; Vuković, K. Evaluating the Efficiency of Croatian Counties in Entrepreneurship Using Data Envelopment Analysis. In Proceedings of the 5th South-East European (SEE) Meeting & Scientific Conference of Management Departments, Entrepreneurial Society: Current Trends and Future Prospects in Entrepreneurship, Organization and Management, Varaždin, Croatia, 25–26 September 2015. [Google Scholar]
  36. Bogović, T. Assessment of the Efficiency of Croatian Cities Using Data Envelopment Analysis (DEA). Ph.D. Thesis, University of Zagreb, Varaždin, Croatia, 2014. [Google Scholar]
  37. Brint, S.; Clotfelter, C.T. US Higher Education Effectiveness. RSF Russell Sage Found. J. Soc. Sci. 2016, 2, 2–37. [Google Scholar]
  38. Hrvatske, V.R. Hrvatski Kvalifikacijski Okvir: Uvod u Kvalifikacije; Ministarstvo Znanosti, Obrazovanja i Športa: Zagreb, Croatia, 2009.
  39. Lončar-Vicković, S.; Dolaček-Alduk, Z. Learning Outcomes—Ishodi Učenja-Priručnik za Sveučilišne Nastavnike; Josip Juraj Strossmayer University of Osijek: Osijek, Croatia, 2009. [Google Scholar]
  40. What is the Student—Teacher Ratio and How Big are Classes? Indicator D2. What is the Student—Teacher Ratio and How Big are Classes? Education at the Glance, OECD. 2019. Available online: https://www.oecd-ilibrary.org/docserver/a1ef3bfe-en.pdf?expires=1602074454&id=id&accname=guest&checksum=DDD99CF2C4AB721730F8333436C7A59F (accessed on 25 September 2020).
  41. Povećanje Mobilnosti Hrvatske Ekonomske Zajednice: Ulazak Hrvatske u Program Erasmus, Institut Za Razvoj Obrazovanja. 2008. Available online: https://iro.hr/wp-content/uploads/2018/02/4.IRO_MOBIL_prirucnik_HR.pdf (accessed on 25 August 2020).
  42. Mobility for Better Learning. Mobility Strategy 2020 for the European Higher Education Area. 2012. Available online: https://www.cmepius.si/wp-content/uploads/2014/02/2012-EHEA-Mobility-Strategy.pdf (accessed on 25 September 2020).
  43. Sánchez-Barrioluengo, M.; Flisi, S. Student Mobility in Tertiary Education: Institutional Factors and Regional Attractiveness; No. JRC108895; Joint Research Centre (Seville Site): Seville, Spain, 2017. [Google Scholar]
  44. EuroDesk, Kako Mobilnost Mladih u Svrhu UčEnja MožE Povećati Njihovu ZapošLjivost? European Youth Week. 2015. Available online: https://www.mobilnost.hr/cms_files/2017/01/1483369017_hr-learning-mobility.pdf (accessed on 27 September 2020).
  45. Government of the Republic of Croatia. Act on the Agency for Vocational Education and Training and Adult Education (Official Gazette, no. 24/10); Government of the Republic of Croatia: Zagreb, Croatia, 2010.
  46. Agencija za Znanost i Visoko Obrazovanje (AZVO). Produktivnost Znanstvenog Istraživanja, Dostupno na. Available online: https://www.azvo.hr/hr/component/content/category/55-vrednovanja (accessed on 27 September 2020).
  47. González-Sala, F.; Osca-Lluch, J.; Haba-Osca, J. Information Resources: Differential Characteristics between Ibero-American and Dutch JCR Psychology Journals from 1998 to 2017. Resources 2019, 8, 111. [Google Scholar] [CrossRef] [Green Version]
  48. Eurostat. Tertiary Education Statistics. 2020. Available online: https://ec.europa.eu/eurostat/statistics-explained/pdfscache/63642.pdf (accessed on 27 September 2020).
  49. European Council, Council of the European Union, Europa 2020. Available online: https://www.consilium.europa.eu/en/policies/education-economic-growth/ (accessed on 21 August 2020).
  50. Živčić-Bećirević, I.; Smojver-Ažić, S.; Kukić, M.; Jasprica, S. Akademska, socijalna i emocionalna prilagodba na studij s obzirom na spol, godinu studija i promjenu mjesta boravka. Psihol. Teme 2007, 16, 121–140. [Google Scholar]
  51. Obadić, A. Nezaposlenost mladih i usklađenost obrazovnog sustava s potrebama tržišta rada. Ekonomska Misao i Praksa 2017, 1, 129–150. [Google Scholar]
  52. Eurostat. Employment Rates of Recent Graduates. 2017. Available online: http://ec.europa.eu/eurostat/statistics-explained/index.php/Employment_rates_of_recent_graduates (accessed on 21 August 2020).
  53. Zlatović, S. Čemu suradnja između visokog obrazovanja i gospodarstva? Polytech. Des. 2013, 1, 70–74. [Google Scholar]
  54. Roth, D.M.; Scherer, A.S. Science Popularization: Interdiscursivity among Science, Pedagogy, and Journalism. Bakhtiniana 2016, 11, 171–194. [Google Scholar]
  55. Sveučilište u Zadru. Available online: www.unizd.hr (accessed on 21 August 2020).
Figure 1. Educational efficiency. Source: Authors’ own work.
Education 10 00385 g001
Figure 2. Hierarchical presentation of internal efficiency variables. Source: Authors’ own work.
Education 10 00385 g002
Figure 3. Hierarchical presentation of external efficiency variables. Source: Authors’ own work.
Education 10 00385 g003
Table 1. Input and output criteria used to measure efficiency.
Input CriteriaOutput Criteria
Number of teaching staff [21,22,23,24,25,26,27]Number of graduates [21,22,23,25,27,28,29,30,31]
Number of non-teaching staff [21,23,24,27]Total amount of external grants and number of research contracts [21,23,31]
Teachers’ competences [28,32]Number of PhD degrees awarded [29]
Non-operating expenditures [21,23,24]Number of courses [29]
Number of students [21,25,27]Number of publications [22,24,25,26,27]
Teaching staff per student [29]Ratio of total number of students to the number of graduates [26,28]
Operating expenditures [22]Students employability [26]
Government funding [23]Number of research units and laboratories [30]
Scientific productivity [27,33]
Dropout rate [28,34]
Publisher’s Note: MDPI stays neutral with regard to jurisdictional claims in published maps and institutional affiliations.

