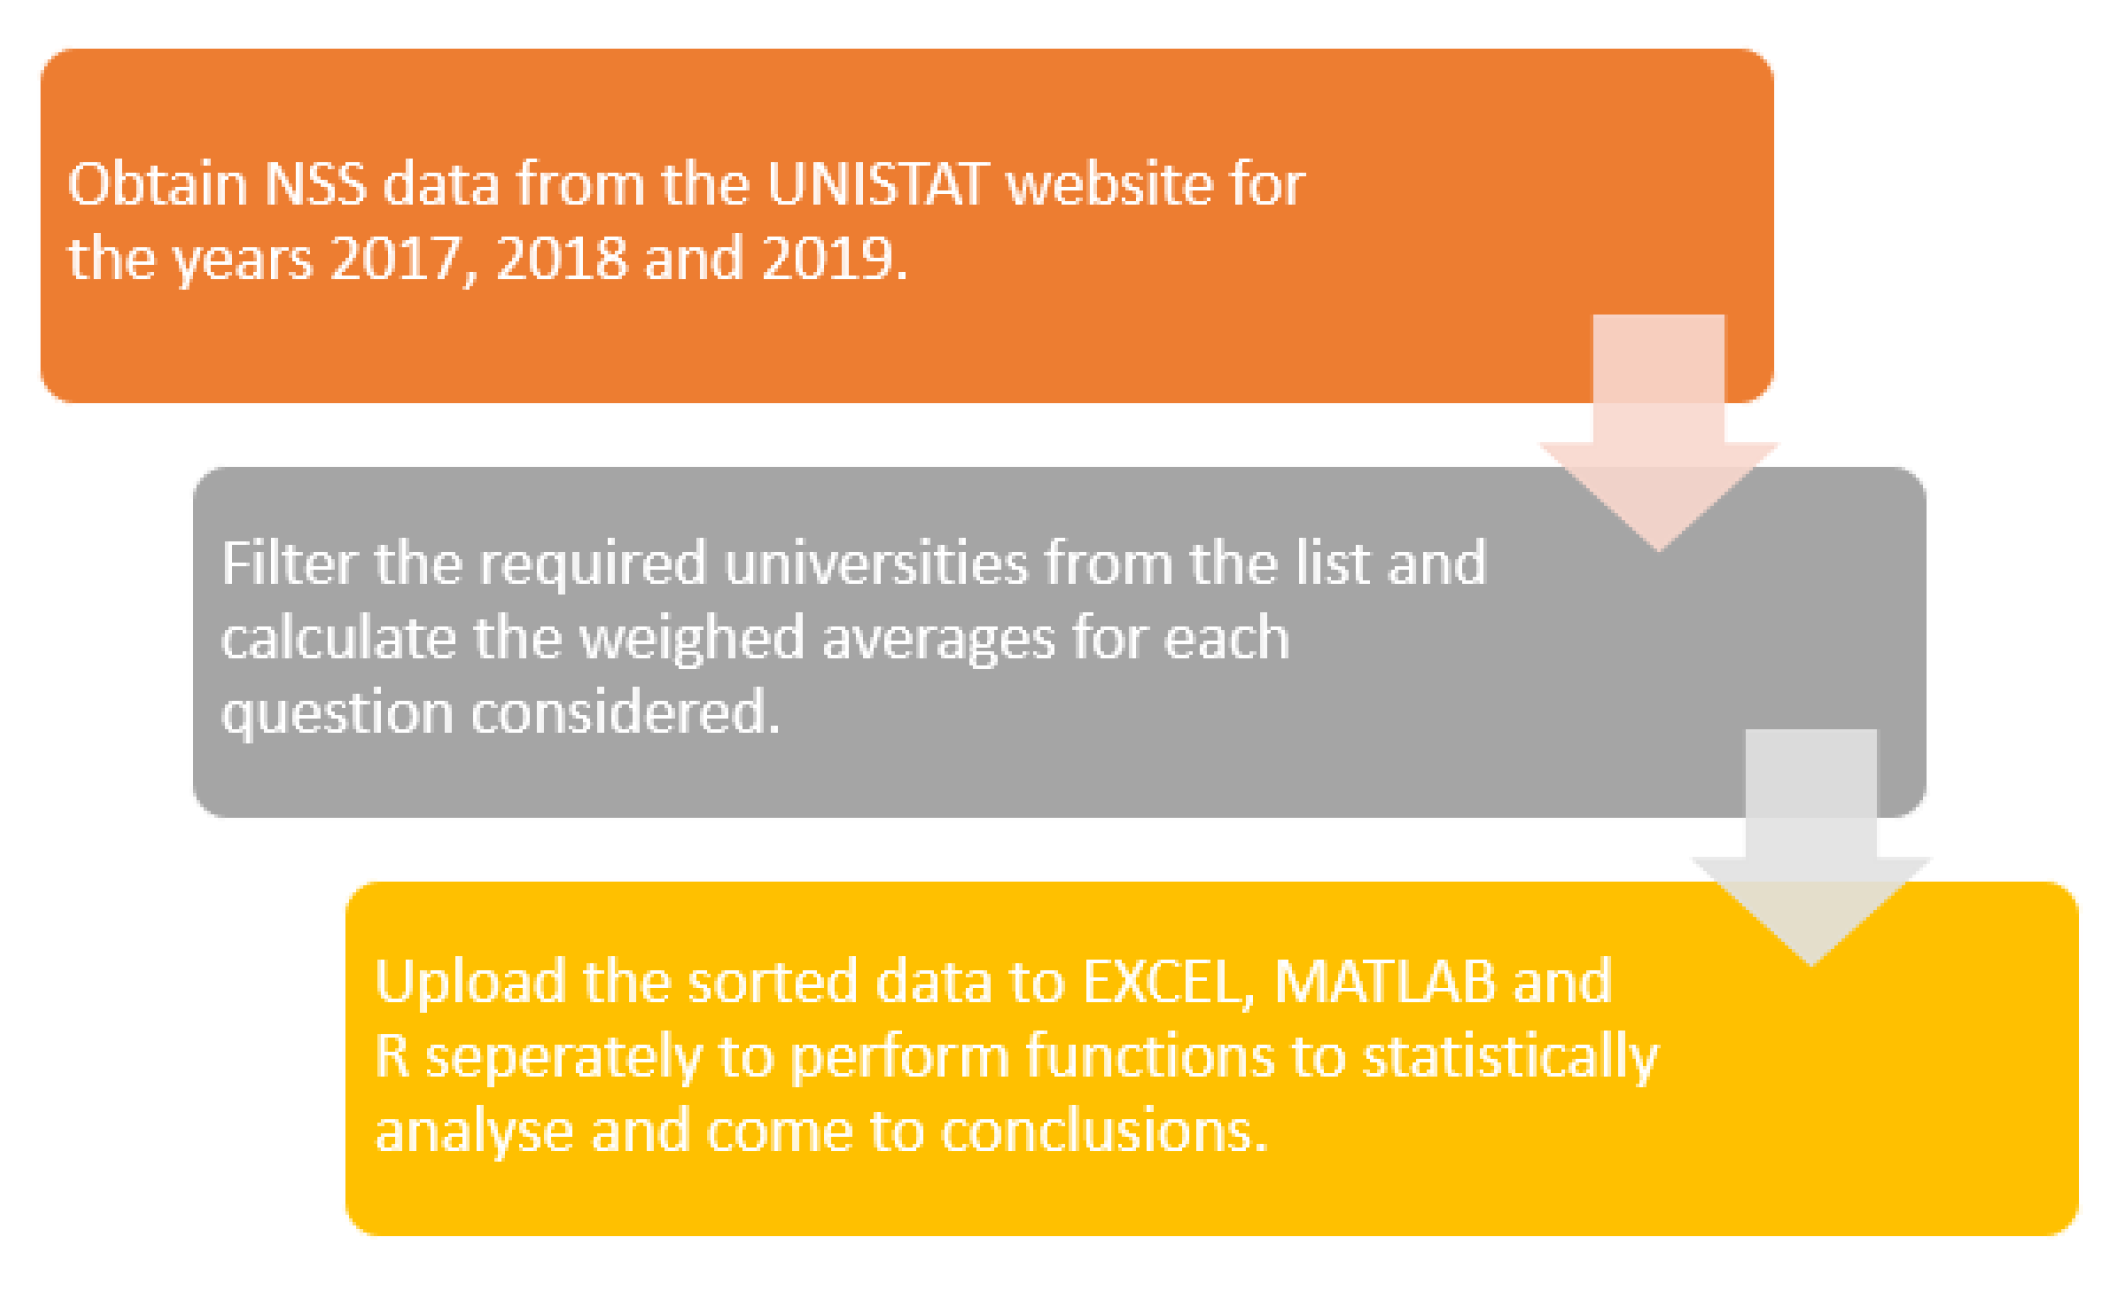
This study mainly focused on The National Student Survey conducted for the final year bachelor’s degree students in the UK to find the most influential factor for the students’ overall satisfaction studying STEM subjects. This survey plays a vital role in helping higher education organisations to improve the satisfaction rate and increase the number of students in their respective institutions. Only a few Redbrick and non-Redbrick Universities were considered as a sample out of the population to analyse the trend and find relationships between the important Question 27 (Overall Satisfaction) for 2019, 2018 and 2017. A small sample of universities was considered for this study yet still producing an idea of the trend that universities as a whole follow relative to students’ satisfaction. Large correlation coefficients and low p values were initially used to find numerical evidence between the questions. Furthermore, the questions which obeyed these conditions were analysed in greater depth with effect size and the coefficient of variation as parameters. Out of the 27 questions, only 13 were considered as directly impacting the students’ satisfaction rate and the other questions being already connected to the university environment and facilities. The main factors considered in this study are teaching, assessment and feedback, academic support and organization and management.
4.2. Statistical Analysis
In this section, the statistical analysis adopted is graphically represented by bar charts and by tabulating the correlation coefficients, p values and effect sizes for every year for the two university type categories.
Modern Universities
- (1)
Civil Engineering
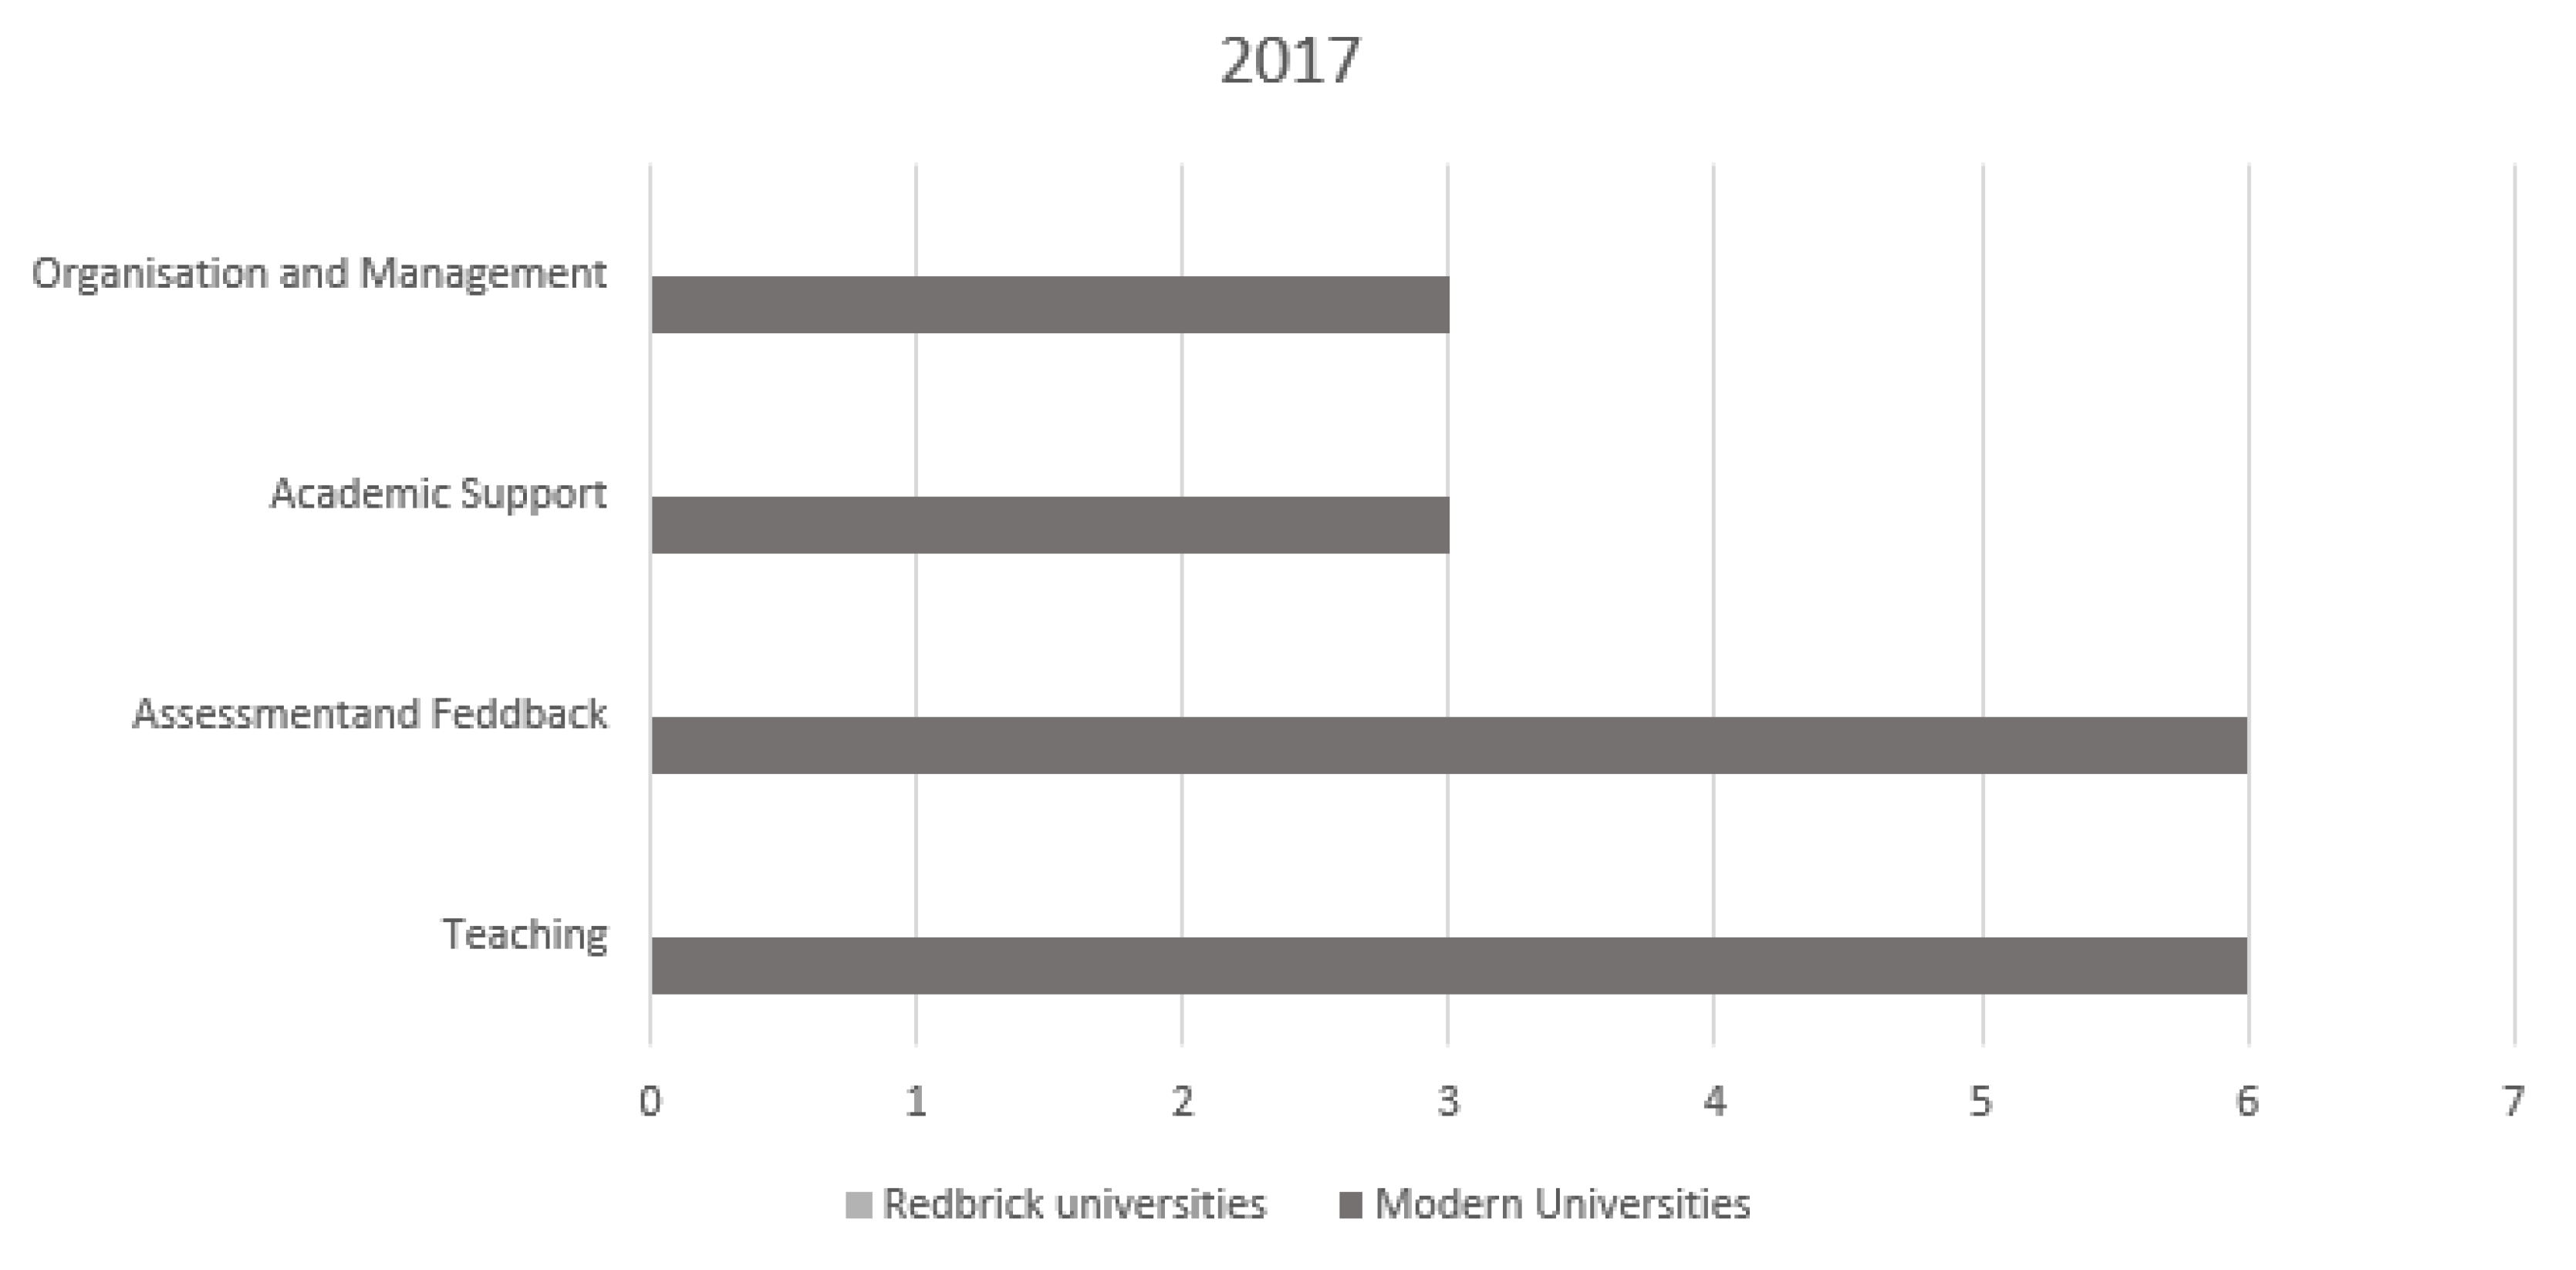
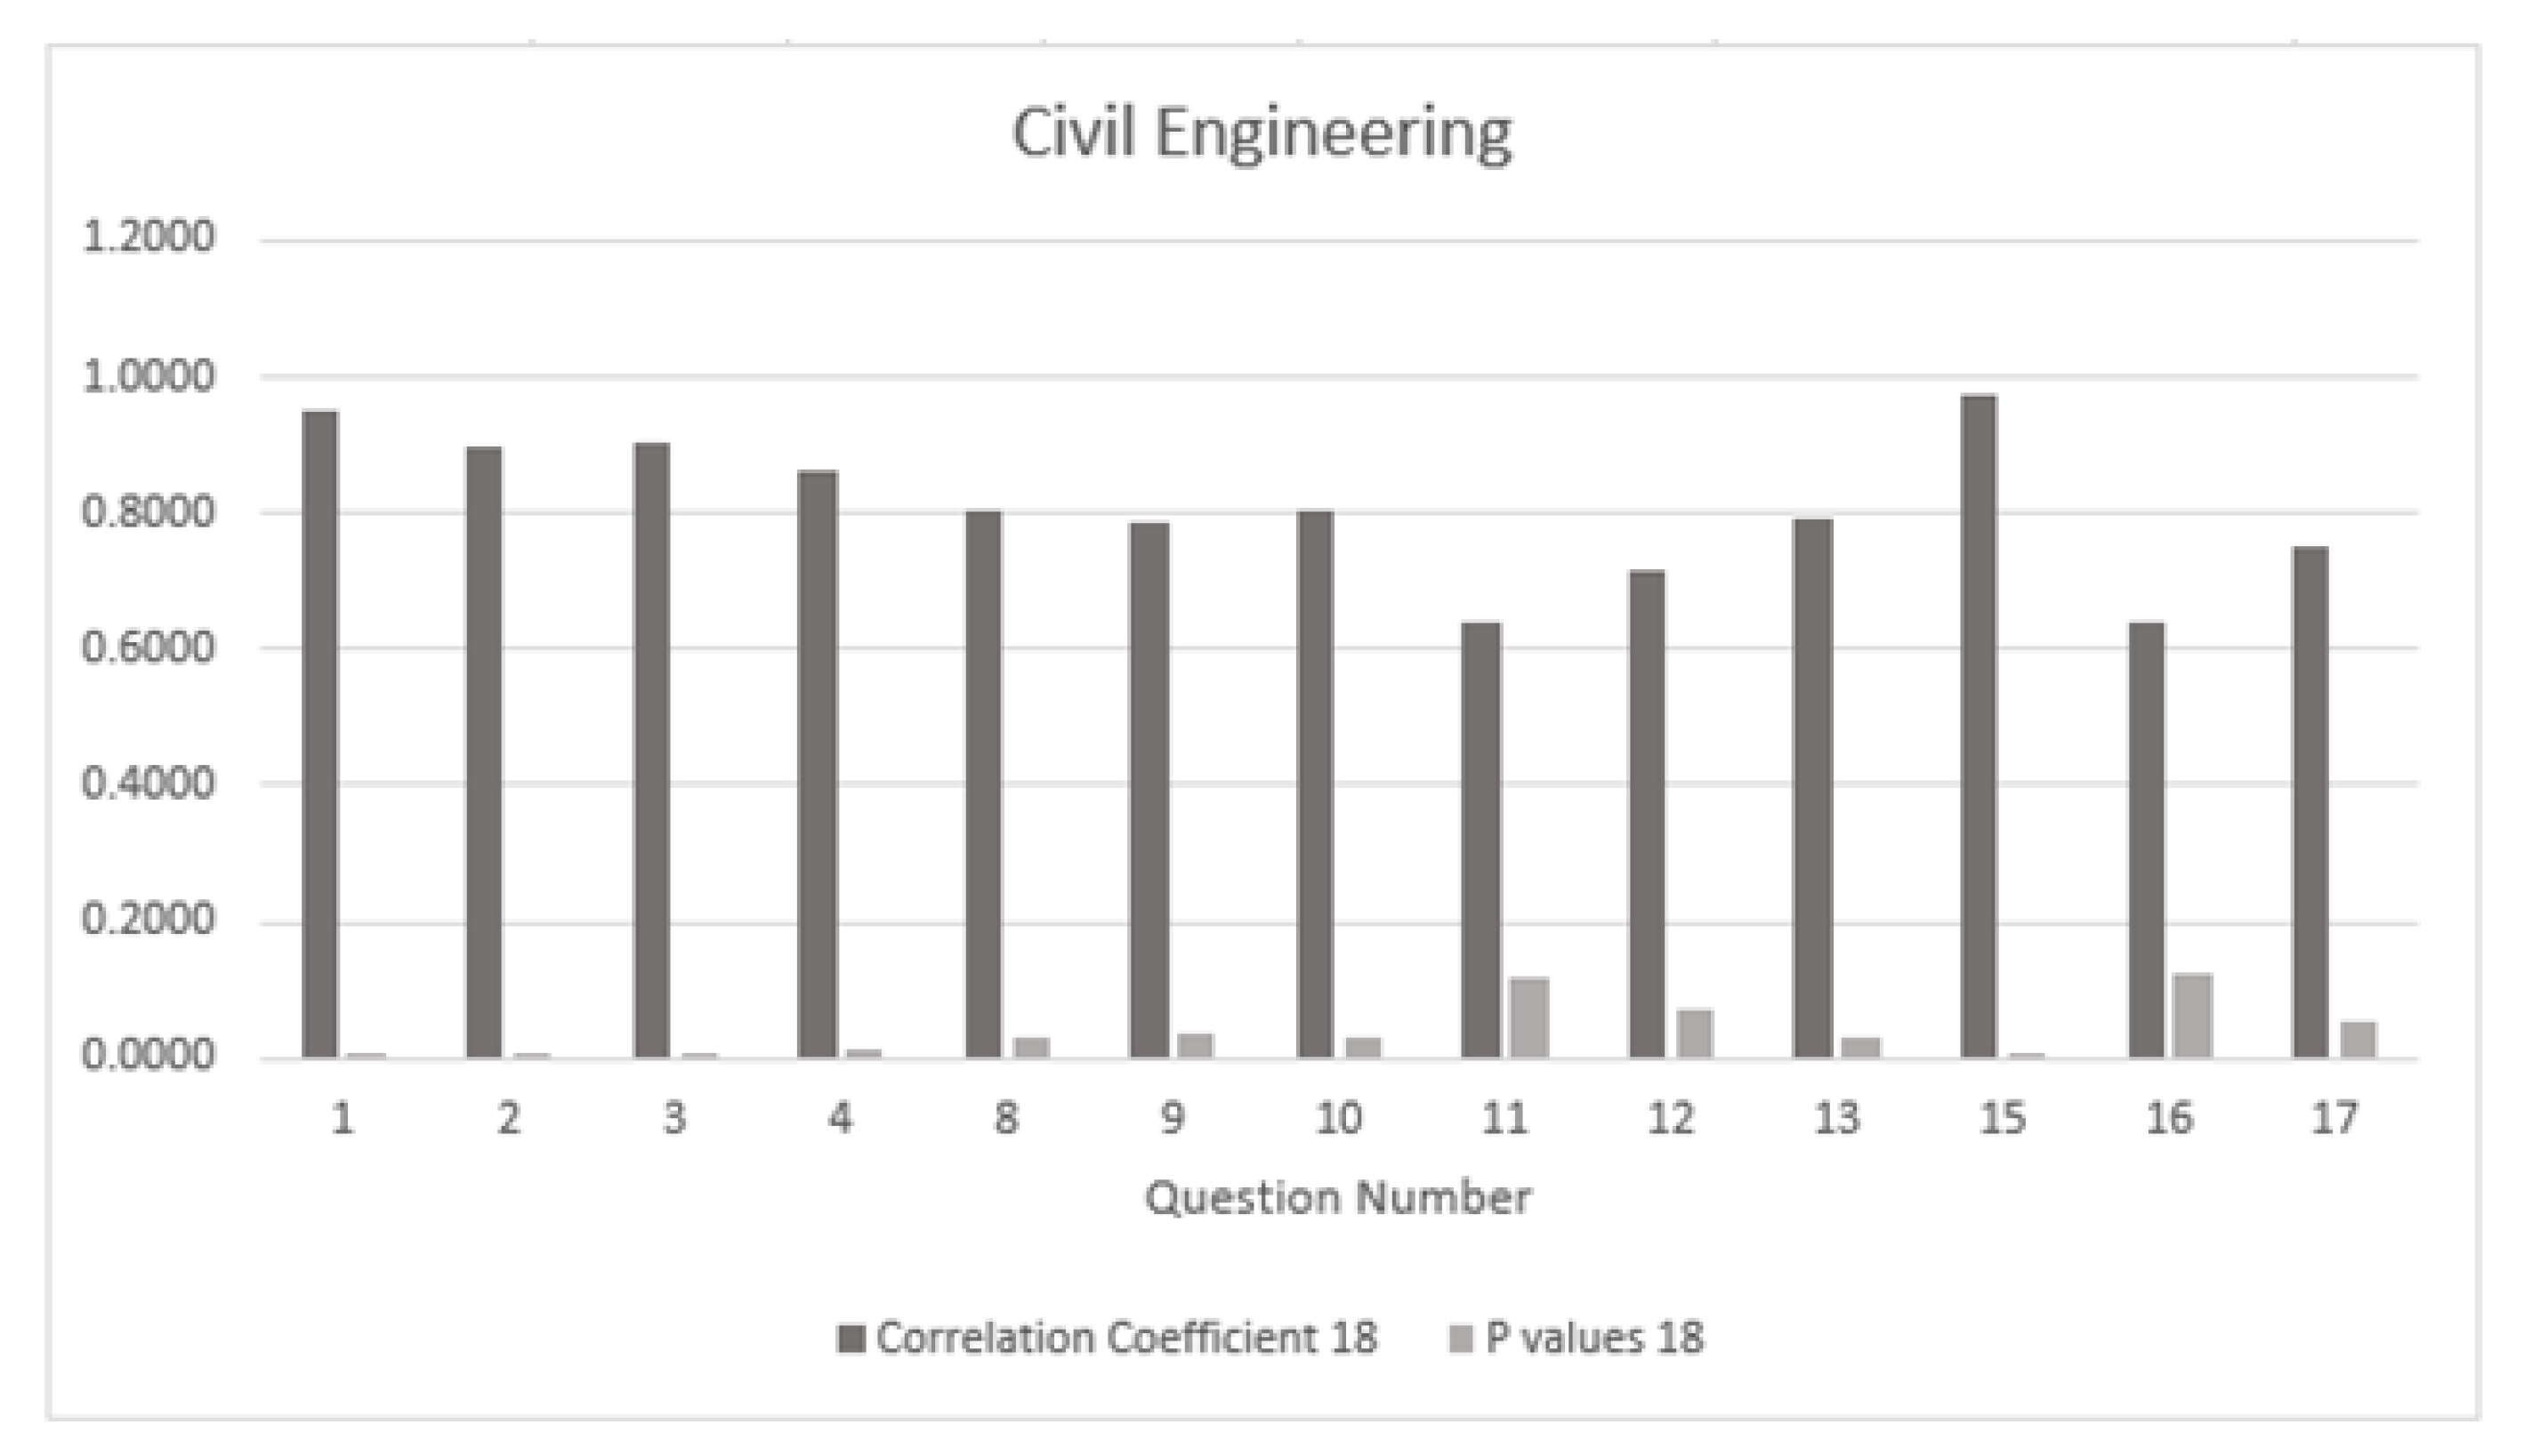
The presentation of these results begins with the focus on the civil engineering subject group in Modern Universities. Statistical analysis was performed and the results are as shown below.
The questions with high correlation coefficients and very small
p values are clearly visible in
Table 3, these showing the influence on the student satisfaction rate. Questions 2, 3, 09, 11, 13 and 15 have therefore an impact on satisfaction.
Question 2 (Staff have made the subject interesting) under the teaching factor has an effect size of magnitude 0.41. Post the correcting factor, the effect size becomes 0.291, thus this is a small effect on the means. The coefficient of variation is 0.056 (5.6%). The confidence interval for this question is (−1.47, 0.651), where the true effect size lies within this range.
For Q03 (The course is intellectually stimulating), which again is part of the teaching factor, the effect size is calculated as 0.335, and after the correction it becomes 0.238. This is considered as a small effect size. The Coefficient of variation is 0.043 (4.3%) and the confidence interval is (−0.72, 1.39). This interval shows where the true effect size lies.
The same analysis is performed for Q09 (Marking and assessment has been fair), which is under the assessment and feedback factor, bringing an effect size of 1.014, whilst, with the correction factor, it becomes 0.721, revealing a large effect size. The coefficient of variation is 0.081 (8.1%) and the confidence interval at 5% significance level is (−2.127, 0.099).
On the other hand, Q11 (I have received helpful comments on my work) under the assessment and feedback factor has an effect size of 0.92, yielding a value of 0.65 after the correction factor is imposed. This is a large effect size on the means. The coefficient of variation is 0.087 (8.7%) and with a 95% confidence, it is said that the true effect size lies within the confidence interval (−2.03, 0.179).
Focusing on Q13 (I have received sufficient advice and guidance in relation to my course) under the academic support feedback factor, the effect size is calculated as having a magnitude of 0.35. Incorporating the correction factor, this value changes to 0.249, representing a small effect size. The CV is 0.061 (6.1%) and the confidence interval from the table above is (−1.41, 0.7), where the true effect size lies within this range.
Finally, in view of Q15 (The course is well organised and is running smoothly), which is a question under the organisation and management factor, the effect size after the correction factor possesses a value of 0.2683, which again shows a small effect size based upon Cohen’s criteria. The coefficient of variation is found to be 0.043 (4.3%) and the confidence interval is (−1.434, 0.68), where the true effect size lies within. This metric shows the influence that Q15 has on Q27. All questions have a small effect size after the correction factor is applied, hence with certainty it is concluded that the findings are true.
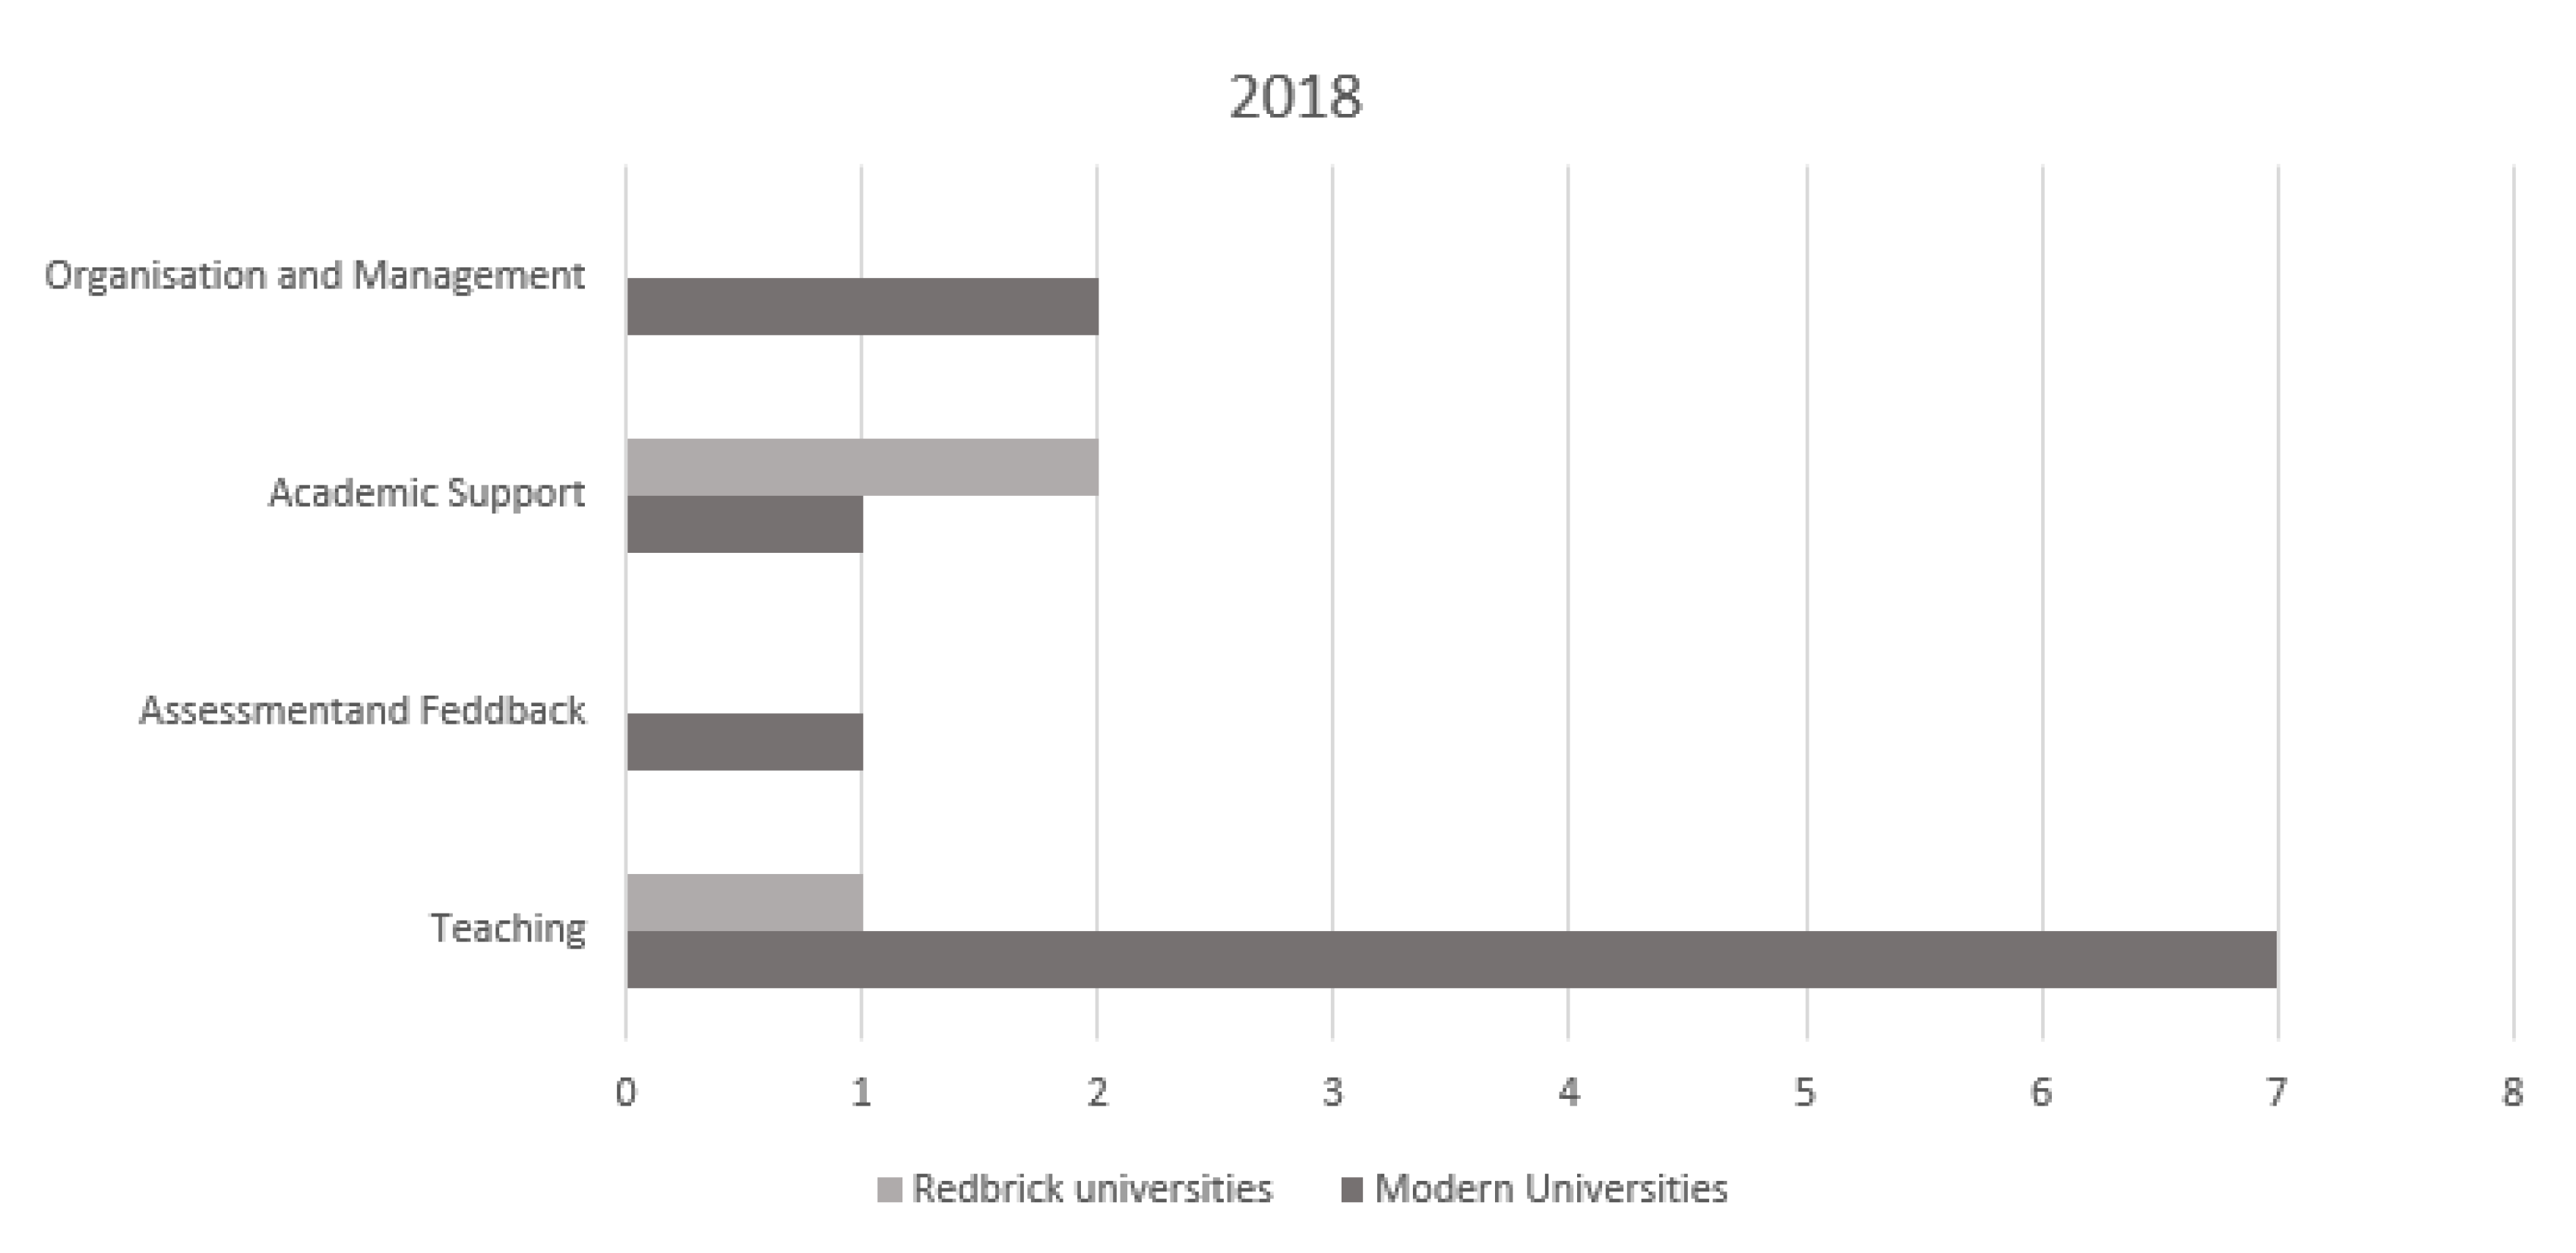
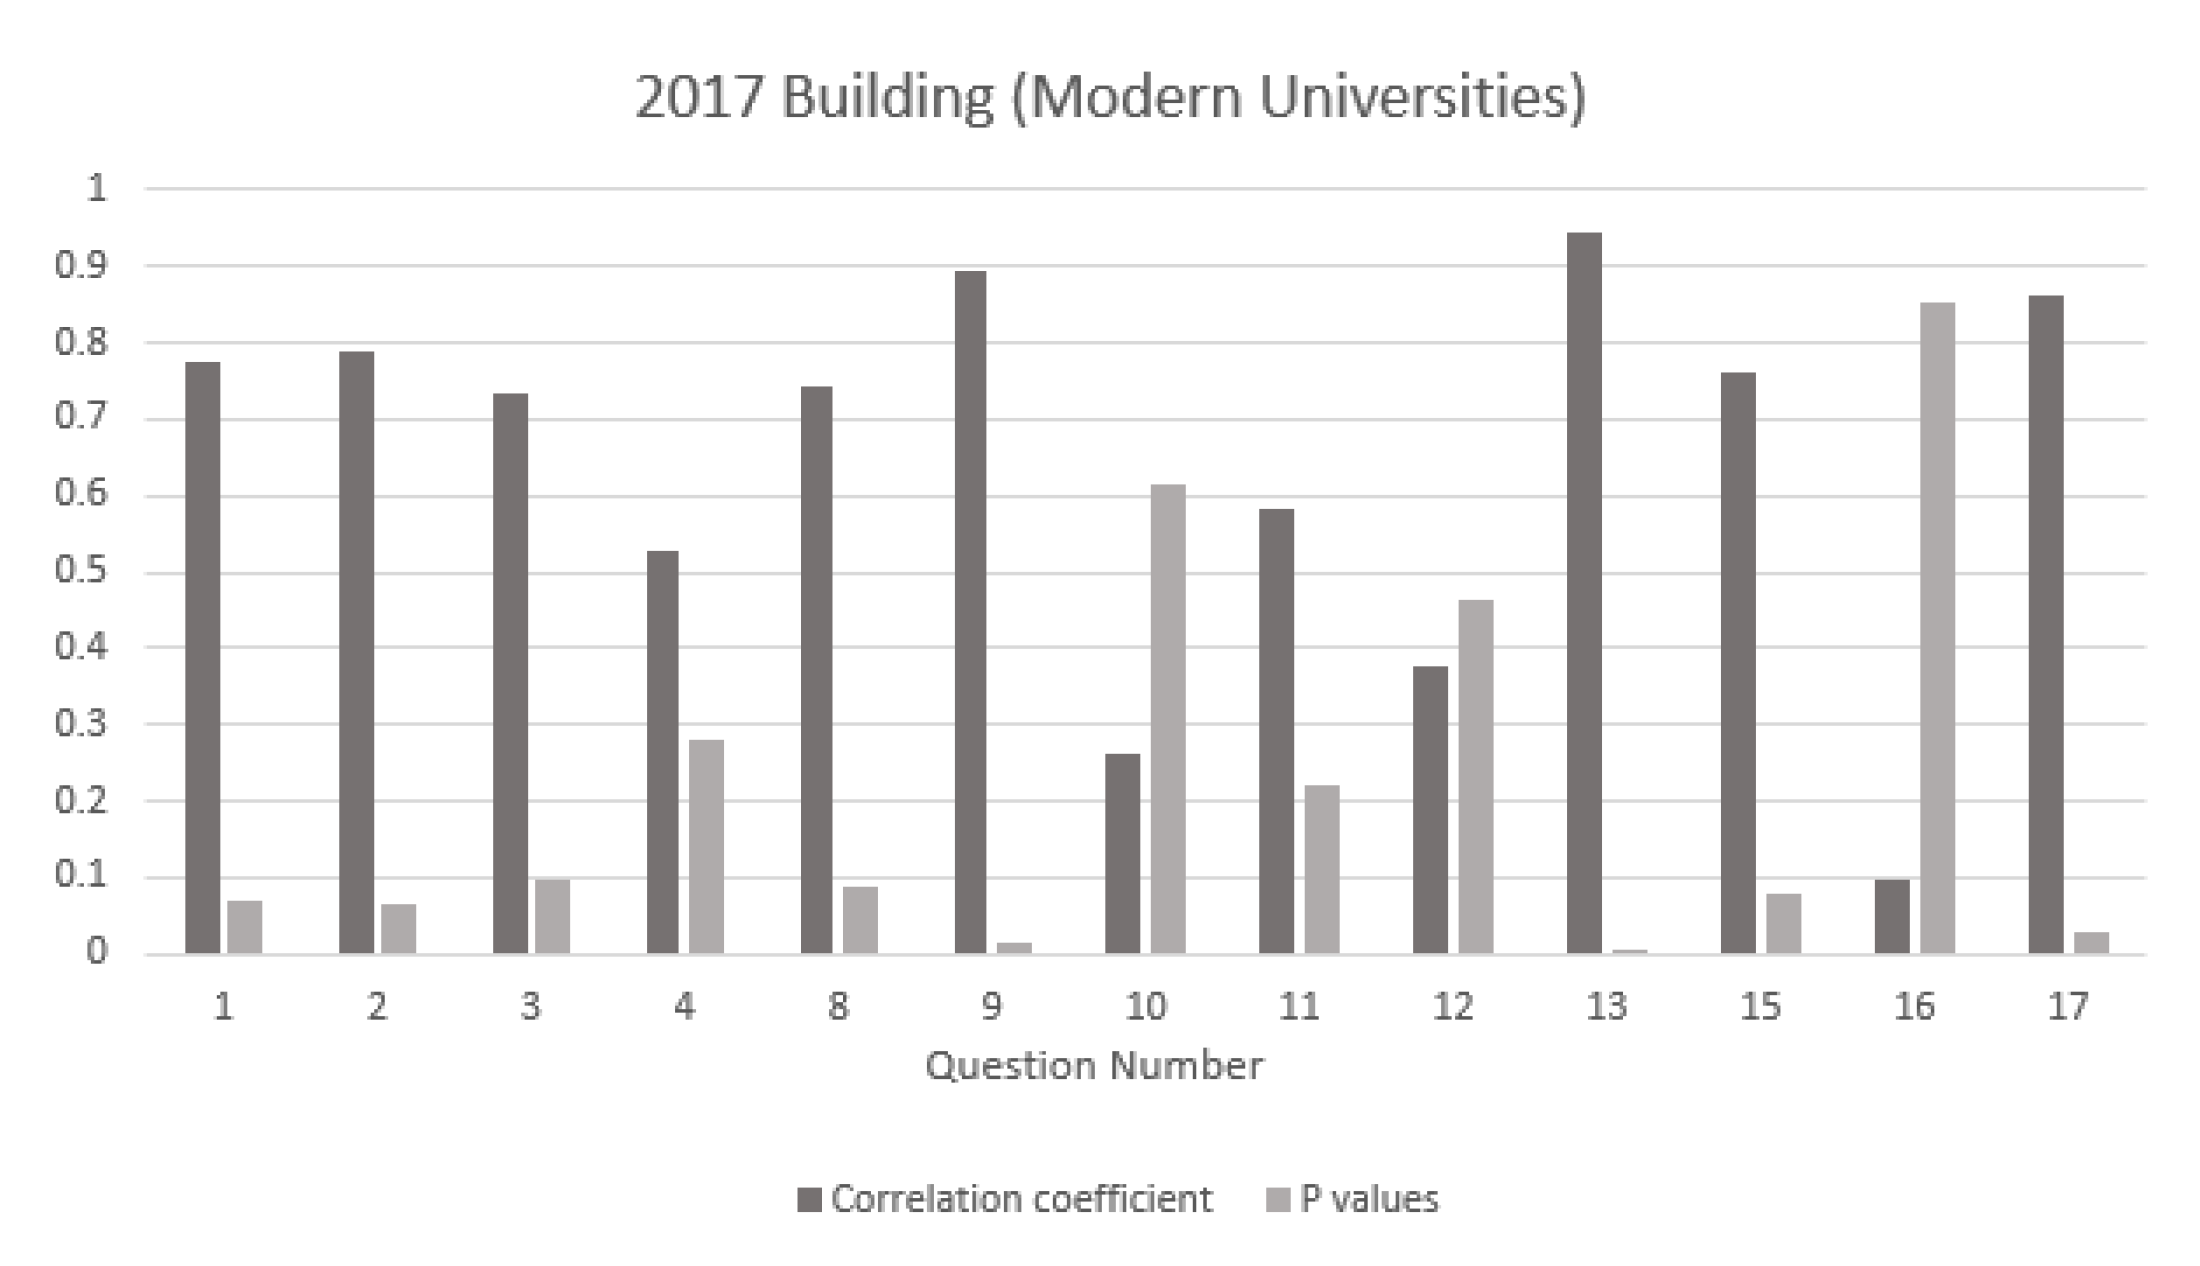
For the same subject group within Modern Universities, but for 2018, the analysis shows that Questions 1–3 and 15 have an influence on the student satisfaction as they posses large correlation coefficients and very small
p values. This can be clearly seen through the bar chart below,
Figure 5.
Q01 (Staff are good at explaining things) has an effect size of 0.1679. After the correction factor, it is 0.119. This is a small effect size and has a small effect between the means. The coefficient of variation is 0.080 (8%). The confidence interval at significance level 0.05 is (−0.882, 1.2174), where the true effect size lies. That is this effect size shows the influence of Q01 on Q27. This interval shows where the true effect size for this question’s influence on Q27 lies on.
Q02 (Staff have made the subject interesting) is with an effect size is 0.189. After applying correction factor, Cohen’s d is 0.134. Thus, it has a small effect size. The CV is 0.081 (8.1%). The confidence interval from the table is (−1.239, 0.861), where the true effect size lies.
The Q03 (The course is intellectually stimulating) has a Cohen’s d (effect size) of 0.493. After correction factor it is 0.3508. This is also a small effect size. The coefficient of variation is 0.049 (4.9%). The confidence interval is (−0.57, 1.557), where the true effect size lies which shows the effect on Q27 by Q03.
Finally, Q15 (The course is well organised and is running smoothly) has an effect size of 0.599. After the correction factor, it is 0.426. This is still a small effect. The CV is 0.1698 (16.9%). The confidence interval at 5% significance is (−1.67, 0.472), where the true effect size lies.
All the considered questions have a small effect size which shows that the findings done are true.
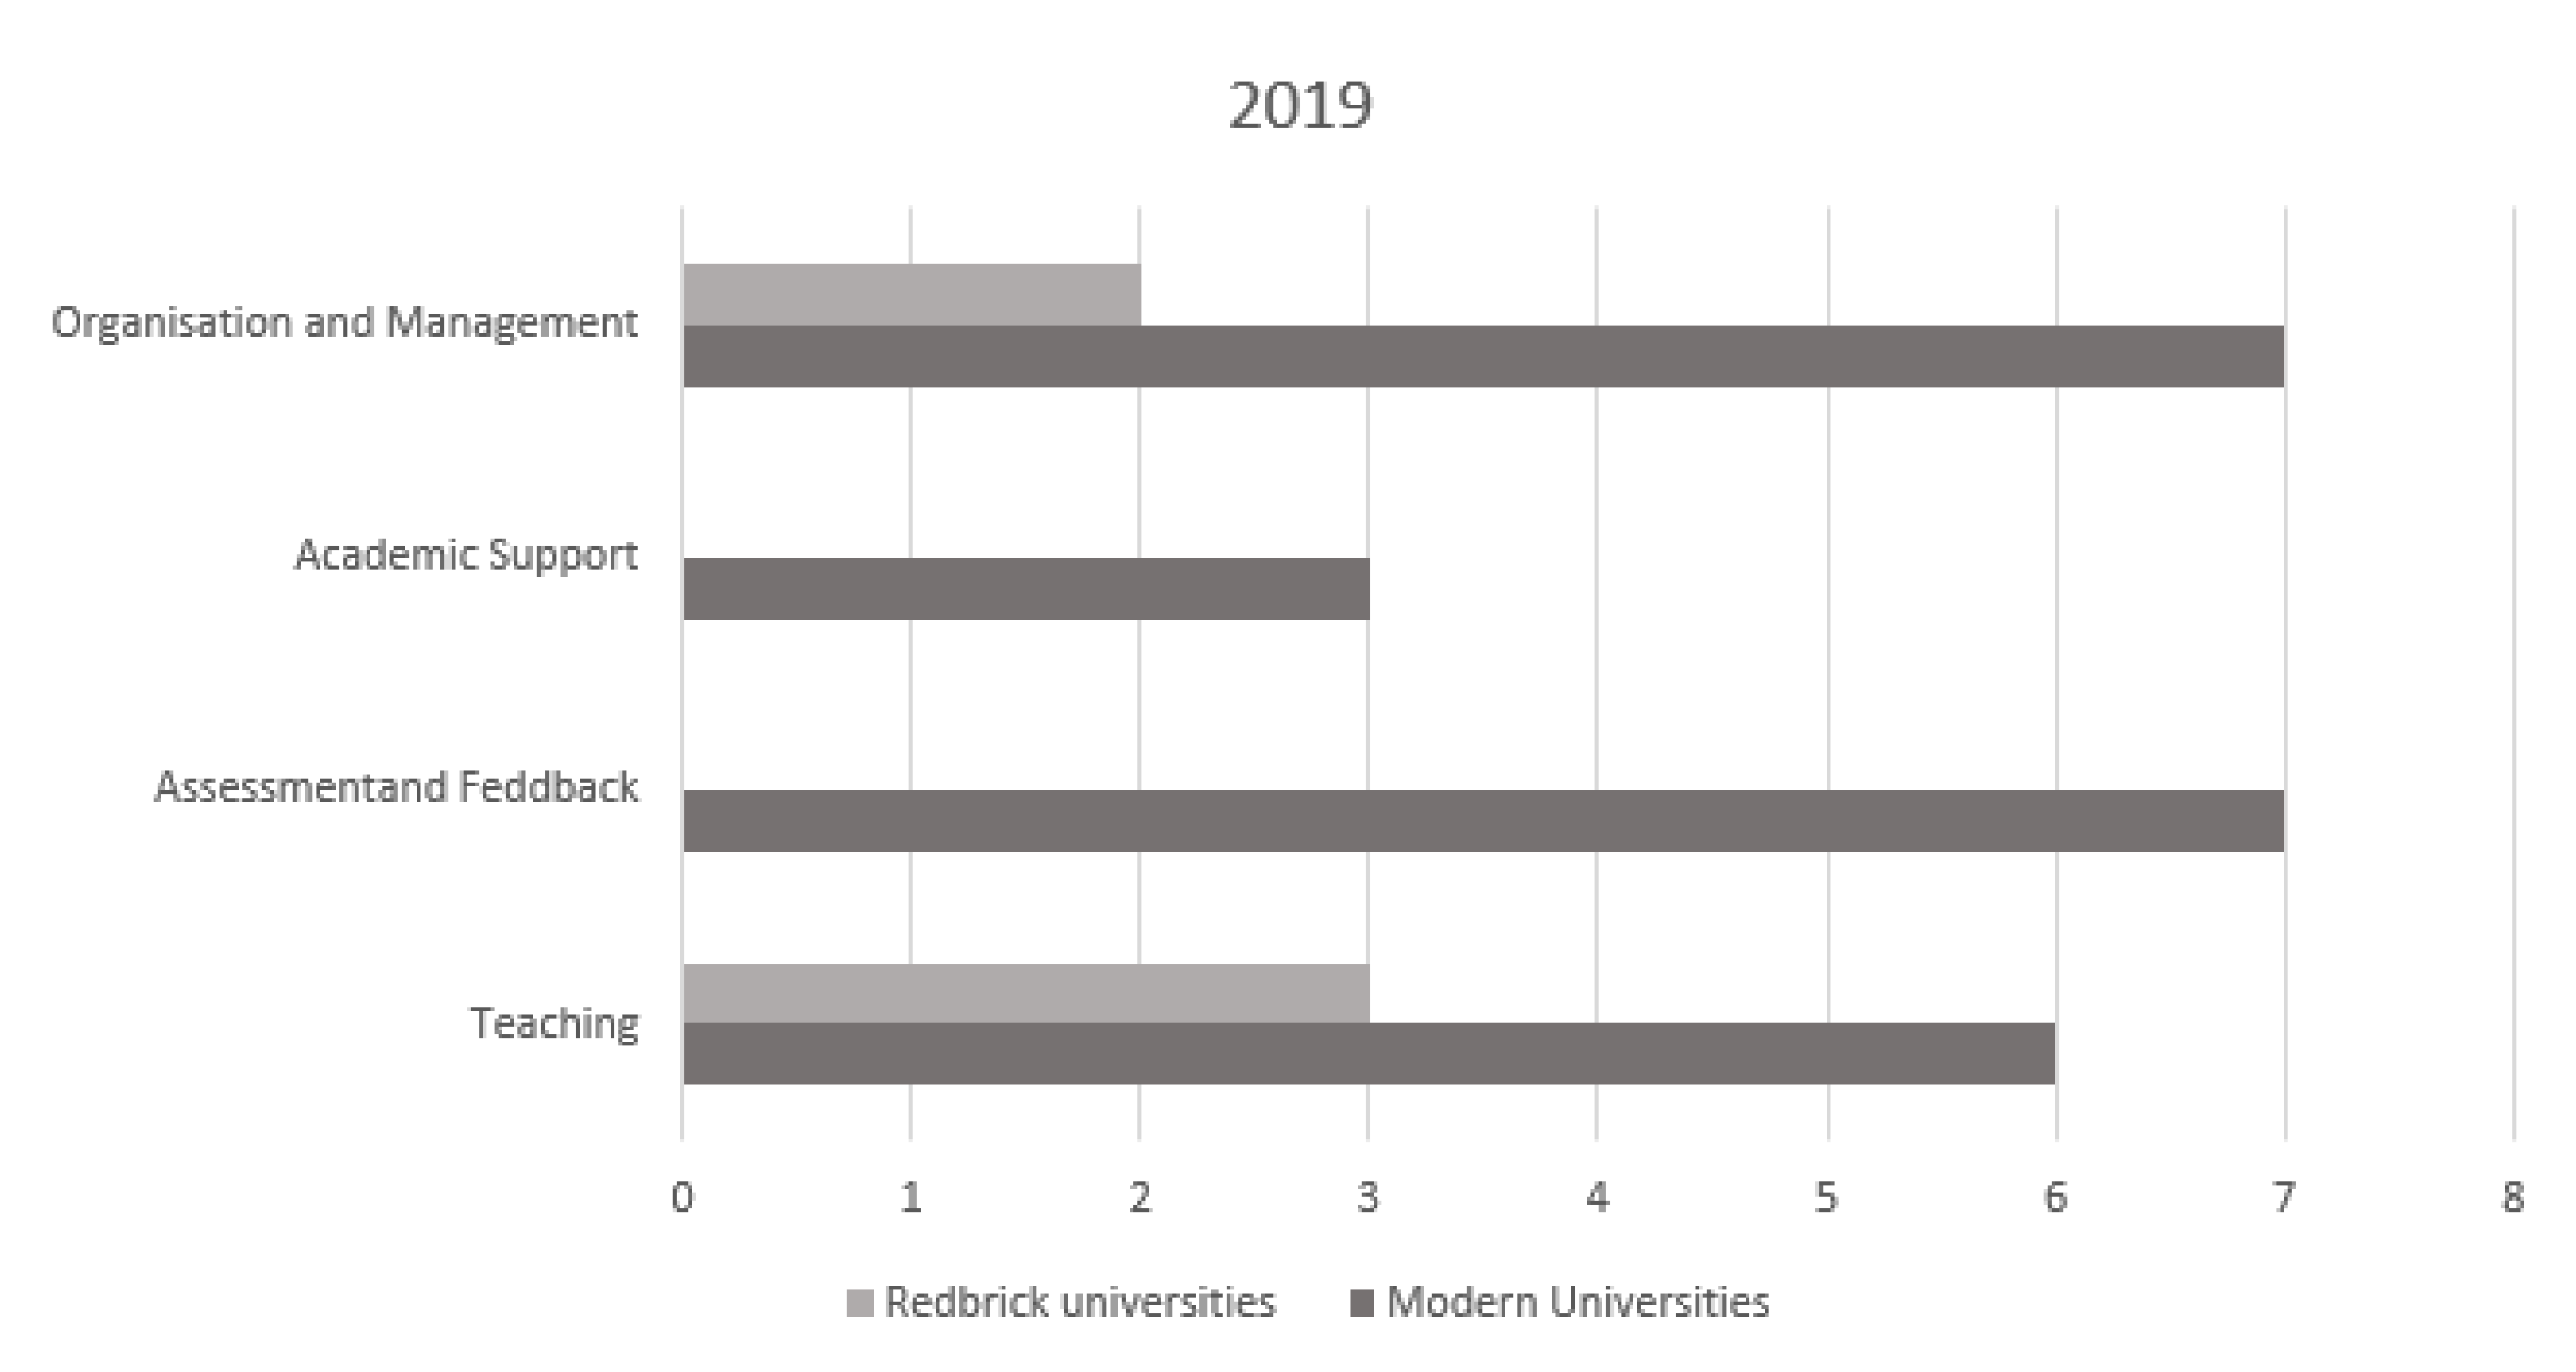
For 2019,
Table 4, it is evident that Questions 4, 13, 15 and 17 are the ones that have an impact on the student satisfaction. To distinguish between the questions with an influence on student satisfaction, the analytics behind Question 4 is considered as a start.
The effect size of this question (My course has challenged me to achieve my best work) has an effect size of 0.246 (small effect), which suggests that the means of Q04 and Q27 do not differ by 0.2 standard deviation and thus have a trivial difference. That is, Q04 has a small effect to Q27. The coefficient of variation is low compared to other questions, 0.068 (6.8%), hence this group is less variable. In addition, at 0.05 significance, the confidence interval is found to be (−0.81, 1.298), where the true effect size lies within this range. After applying the correction factor, Cohen’s d is 0.175, which is still a small effect size.
For Q13 (I have received sufficient advice and guidance in relation to my course), the effect size is −0.03, but the absolute of this is considered so as to see simply the magnitude of the effect size. A very small effect (0.03) exemplifies a very small difference. Further, the coefficient of variation is calculated as 0.079 (7.9%) and the 95% confidence interval level as (−1.08, 1.016), showing that true effect size (the influence on Q27) lies within the range. Upon including the correction factor, the effect size for Q13 is 0.021, which is again a very small effect size.
For Q15 (The course is well organised and is running smoothly), the absolute of the effect size of value 0.743 is considered. This shows that it has a large effect size and the difference between means are also large. The CV for Q15 is 0.158 (15.8%). This shows that the CV is large in comparison to the questions considered, thus this group is more variable and less uniform. The confidence interval found is (−1.827, 0.34), showing that the effect size lies between this range. Including the correction factor, Cohen’s d is now 0.528799, representing a medium effect size.
For Q17 (Any changes in the course or teaching have been communicated effectively), the absolute value is 0.22, which implies that it has a small effect between the two groups considered. The CV is 0.141 (14.1%). The confidence interval at 5% significance is (−1.27, 0.836), where the true effect size lies. The effect size post applying the correction factor is 0.1565, and it is a small effect.
- (2)
Building
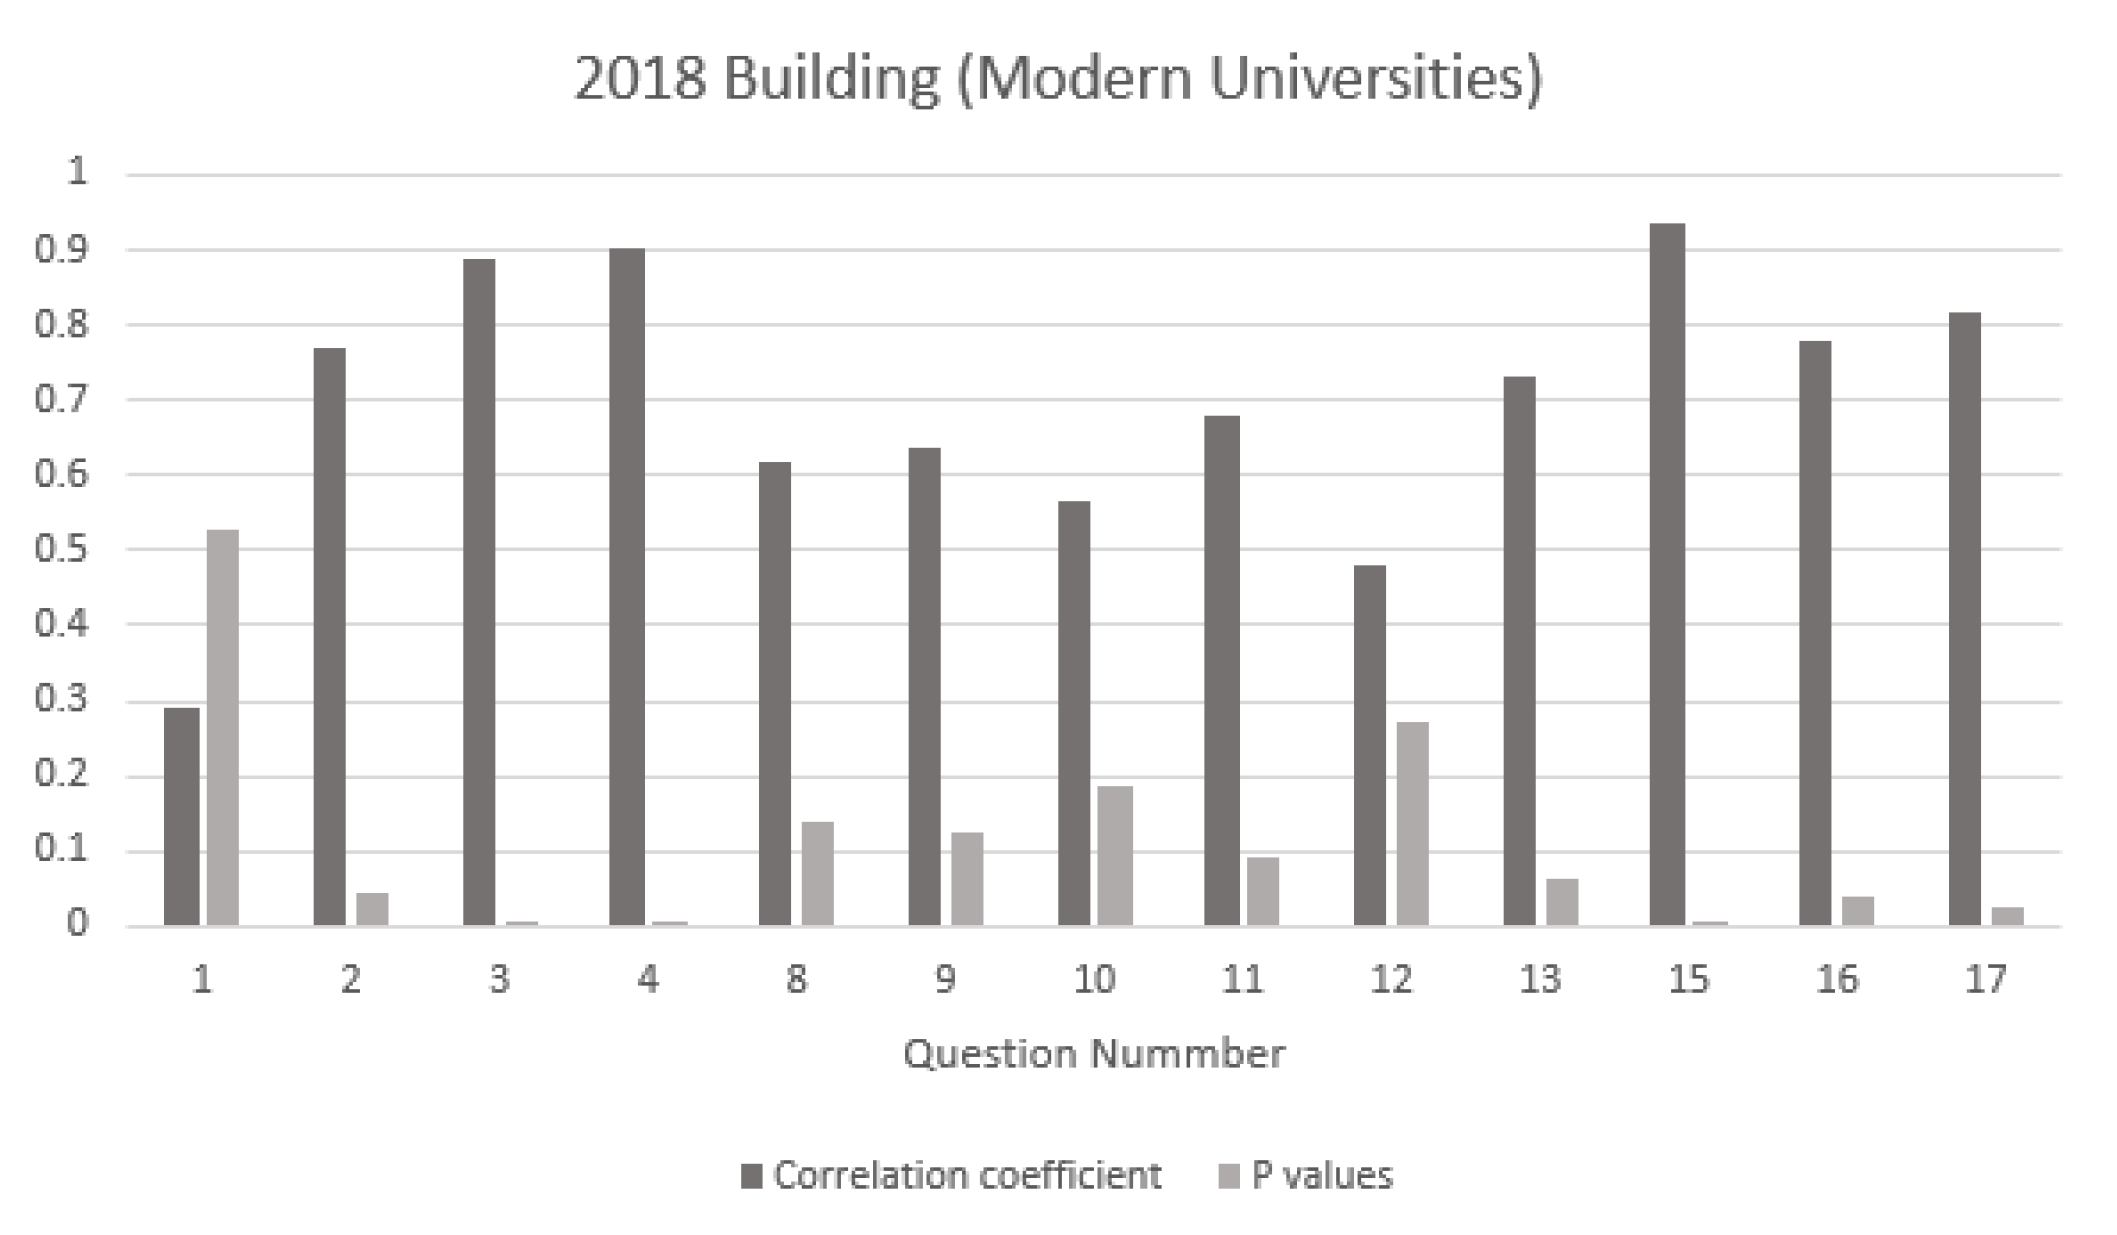
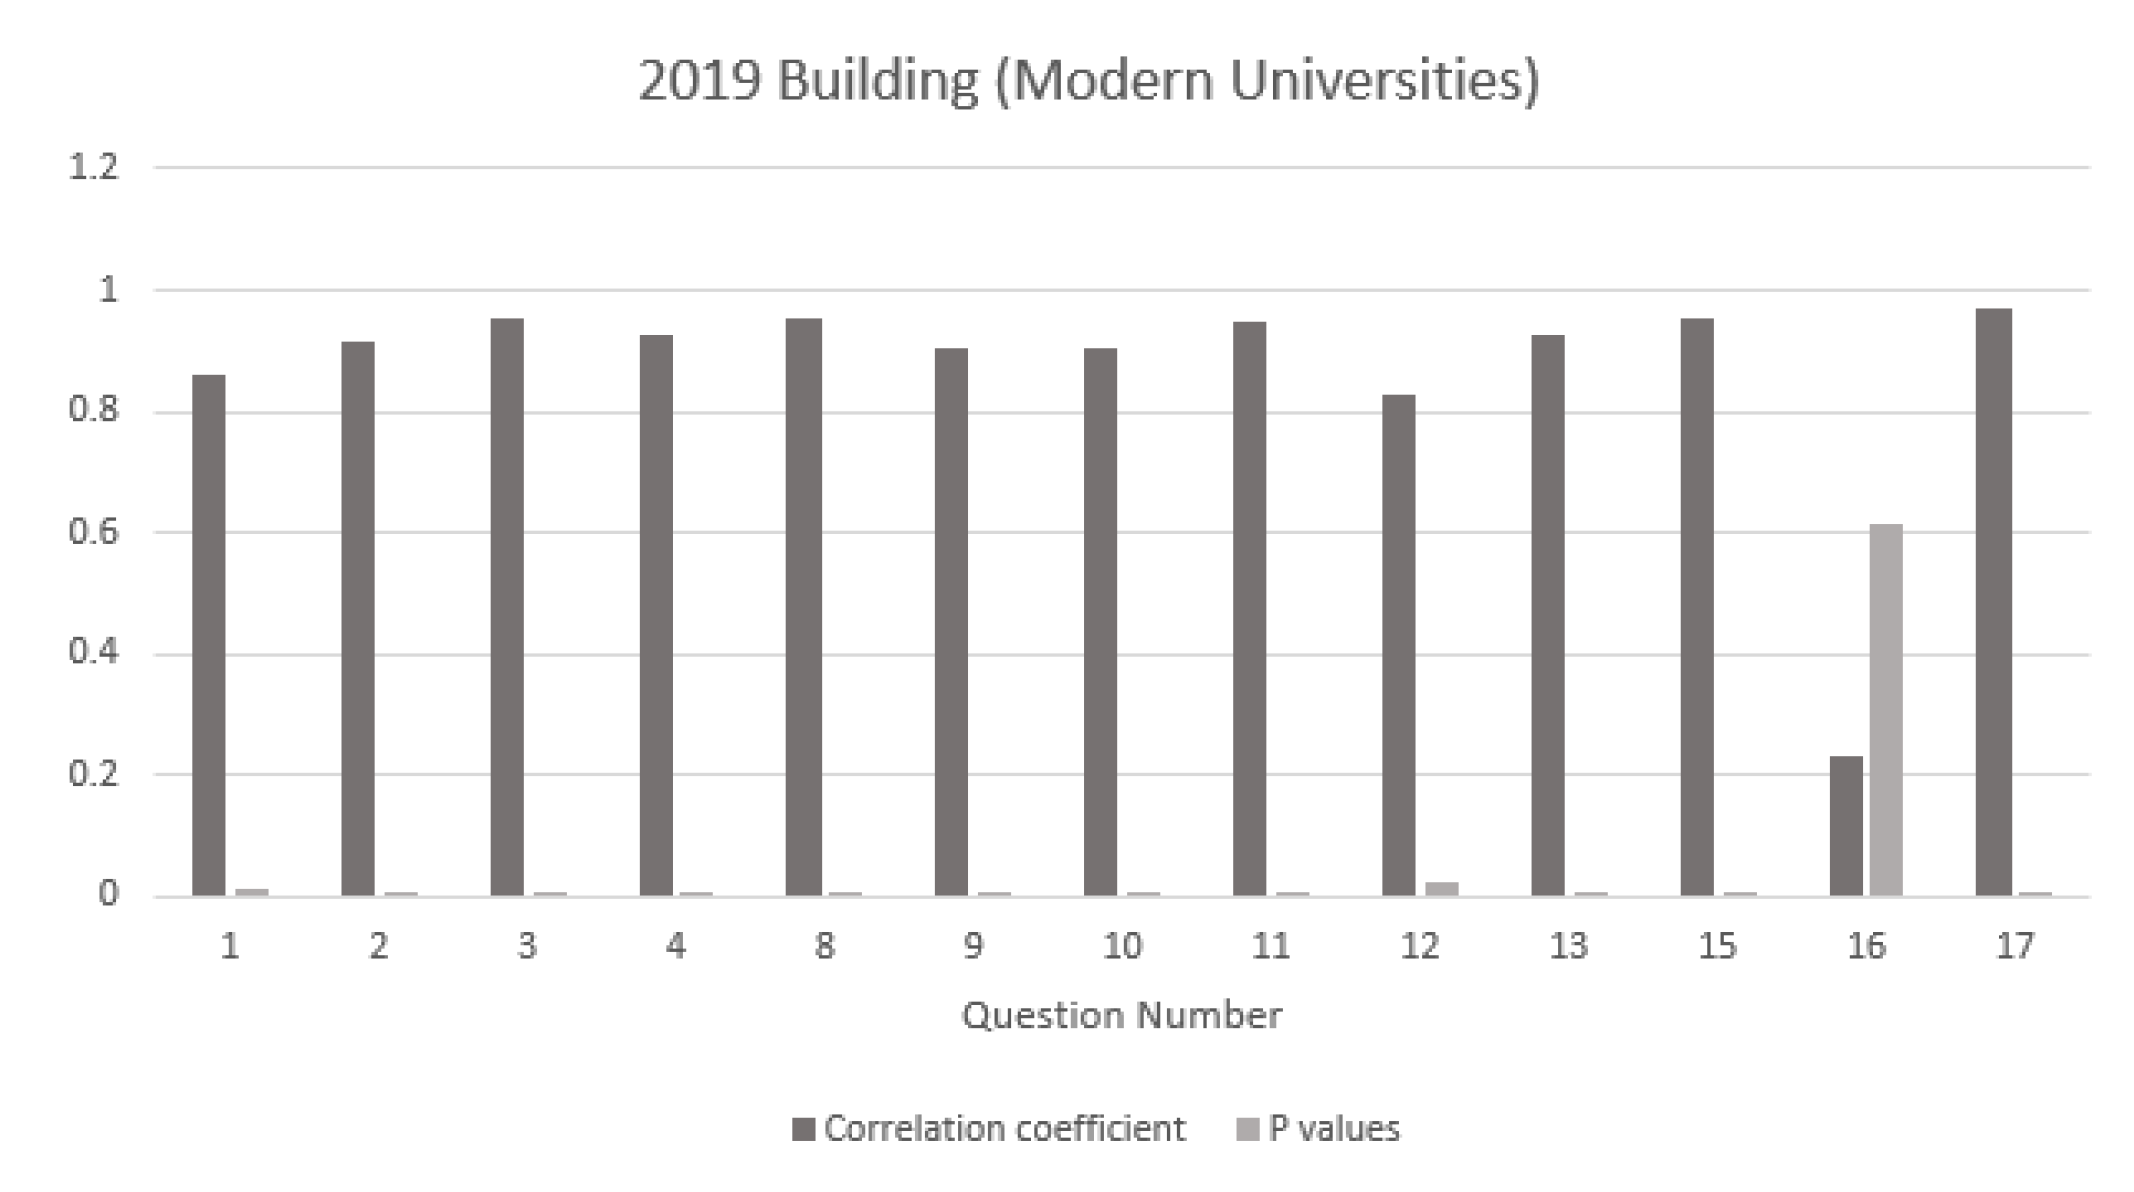
The next subject group to be considered within this paper is the Building subject group for the Modern University type category. This includes the general building courses delivered by all universities at hand. Filtering from the large available data, statistical analysis was performed, and
Figure 6,
Figure 7 and
Figure 8 summarise the correlation coefficients and
p values for the Building subject group for 2017, 2018 and 2019, respectively.
- (3)
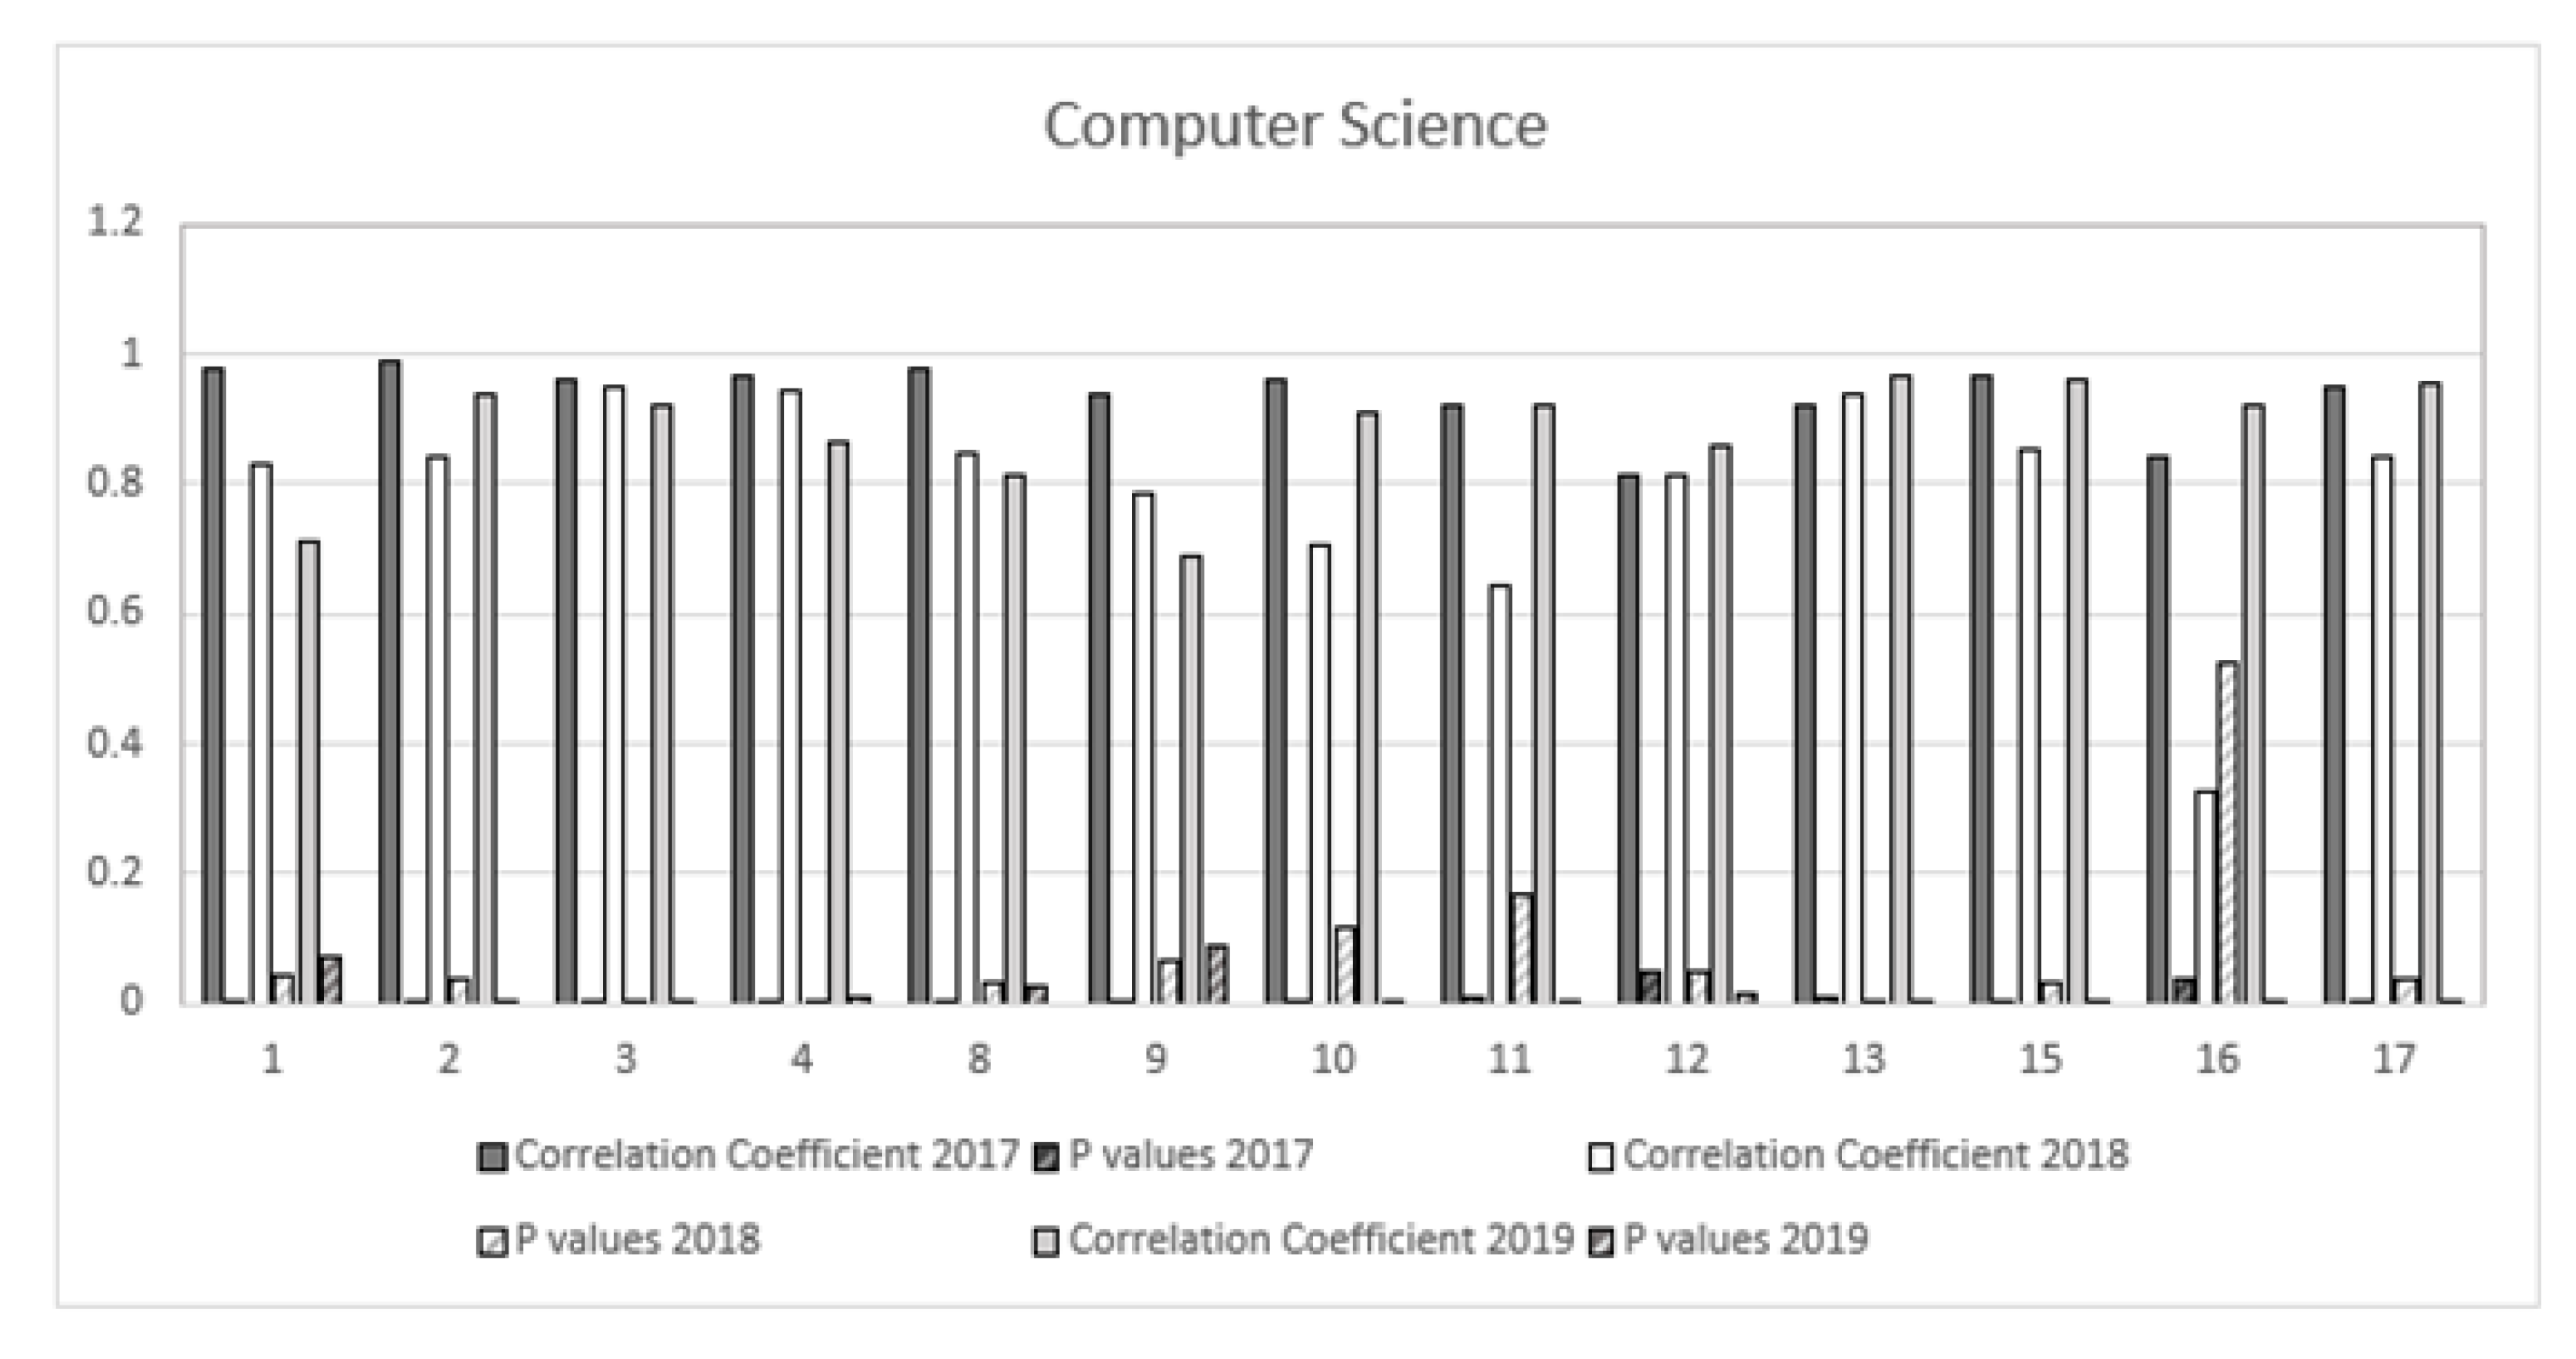
Computer Science
Figure 9 represents a summary of the statistical analysis findings for the computer science subject group for Modern Universities in 2017, 2018 and 2019, respectively.
- (4)
Mathematics
The results of the statistical analysis tools employed within this paper, for the last STEM subject group, Mathematics, for the Modern University category and for the respective years of interest, are tabulated and presented in
Table 5.
For 2017, the results indicate that no question agreed with having both high correlation coefficients and very low p values (at both significance levels 0.01 and 0.05).
Gradually, in 2018, the mathematics group showed signs of improvement where it appears that Question 8 has evidence of having an influence on the overall satisfaction.
In 2019, only Question 9 has an impact on the student satisfaction analysis, as shown in the table with the high correlation coefficient near to unity and the very low p value.
Redbrick Universities
This section comprises a similar analysis but implemented on Redbrick Universities, for all four group subjects. Moreover, the final results accumulated are explained below.
- (1)
Civil Engineering
Comparative yearly analysis of the data showed that only in 2019 two specific questions showed evidence of influence, whereas, in 2017 and 2018, no questions had influence for the civil engineering subject group for Redbrick Universities. This can be seen by the low values of the correlation coefficient and the
p values depicted in
Figure 10. These values and hence deductions are also supported by the effect size that accompany each question for the stated years.
- (2)
Building
Out of the list of Redbrick Universities considered, only two of the universities provide Building as a course. Thus, it is very difficult to analyse only two universities as the number is not enough to calculate the correlation coefficients and the p values for all three years of 2019, 2018 and 2017.
- (3)
Computer Science
For this subject group, only for 2018 and 2019, there is clear evidence of strong relationships between some of the questions considered. The questions that are influential towards the students’ overall satisfaction can be seen in
Table 6, whereby high correlation coefficient values and low
p values are evident for the above stated years.
- (4)
Mathematics
Performing the statistical analysis adopted throughout the study, it is deduced that, for Redbrick Universities under this subject group, only one question i 2018 and one question in 2019 show an influence on the overall satisfaction of students.
Figure 11 portrays the questions with the high peaked correlation coefficient value and simultaneously the low
p values.


