1. Introduction
The use of large-scale tests in educational, psychological, and decision-making contexts has become part of the ongoing activities of many school districts, provinces/states, and countries. Often, important decisions regarding accountability and placement of students in performance categories (e.g., below basic, basic, proficient, excellent) are made on the basis of test scores generated from tests. Therefore, it is important to evaluate the validity of the inferences derived from test results, which depends on the measurement model used in the design, construction of items, scoring of the students’ responses, and analyses of the scored responses. When the measurement model fails to accurately reflect the real aspects of student responses, the validity of test scores may be compromised.
One example of this failure can be found when unusual or unexpected response patterns are produced by some students. For example, if some students produce correct answers to the more difficult items but fail to answer the easier items successfully, the students’ responses are considered “unexpected”, “aberrant”, “unpredictable”, or “misfitting” [
1]. “Misfitting” refers to the mismatch between observed and expected response patterns of students derived from a given measurement model. Meijer (1997) and Schmitt, Cortina, and Whitney (1993) suggested that validity and reliability of a test might be compromised because of the existence of misfitting responses in test data [
2,
3]. This is mainly due to the effect misfitting response patterns on the estimation of student’s ability. For example, in the context of the item response theory (IRT), the existence of misfitting response patterns might distort the shape of likelihood function and result in incorrect ability estimates.
Misfitting response patterns may lead to an overestimate or underestimate of students’ ability regardless of the kind of educational or psychological test. The effect of misfit on ability can be illustrated by its effect on the likelihood function. In item response theory (IRT), estimation of ability measured by a test can be achieved by maximizing the likelihood function for given model and observed response pattern. The likelihood function for the
ith student can be computed using the formula:
where
is the binary (0, 1) response to item
(
) by student
,
is the latent trait or ability for student
, and
is the probability of a correct answer to item
by persons
i computed based on an IRT model. The maximum likelihood estimate (MLE) of
,
, occurs at the maximum of likelihood function where the first derivative of likelihood function equals zero.
The following example shows how a response pattern contributes to ability estimation. In this example, two different students (i.e., with the ability to answer the first five items) take a ten-item test in which items are sorted in ascending difficulty order. Item parameters and response patterns are shown in
Table 1.
As can be seen in
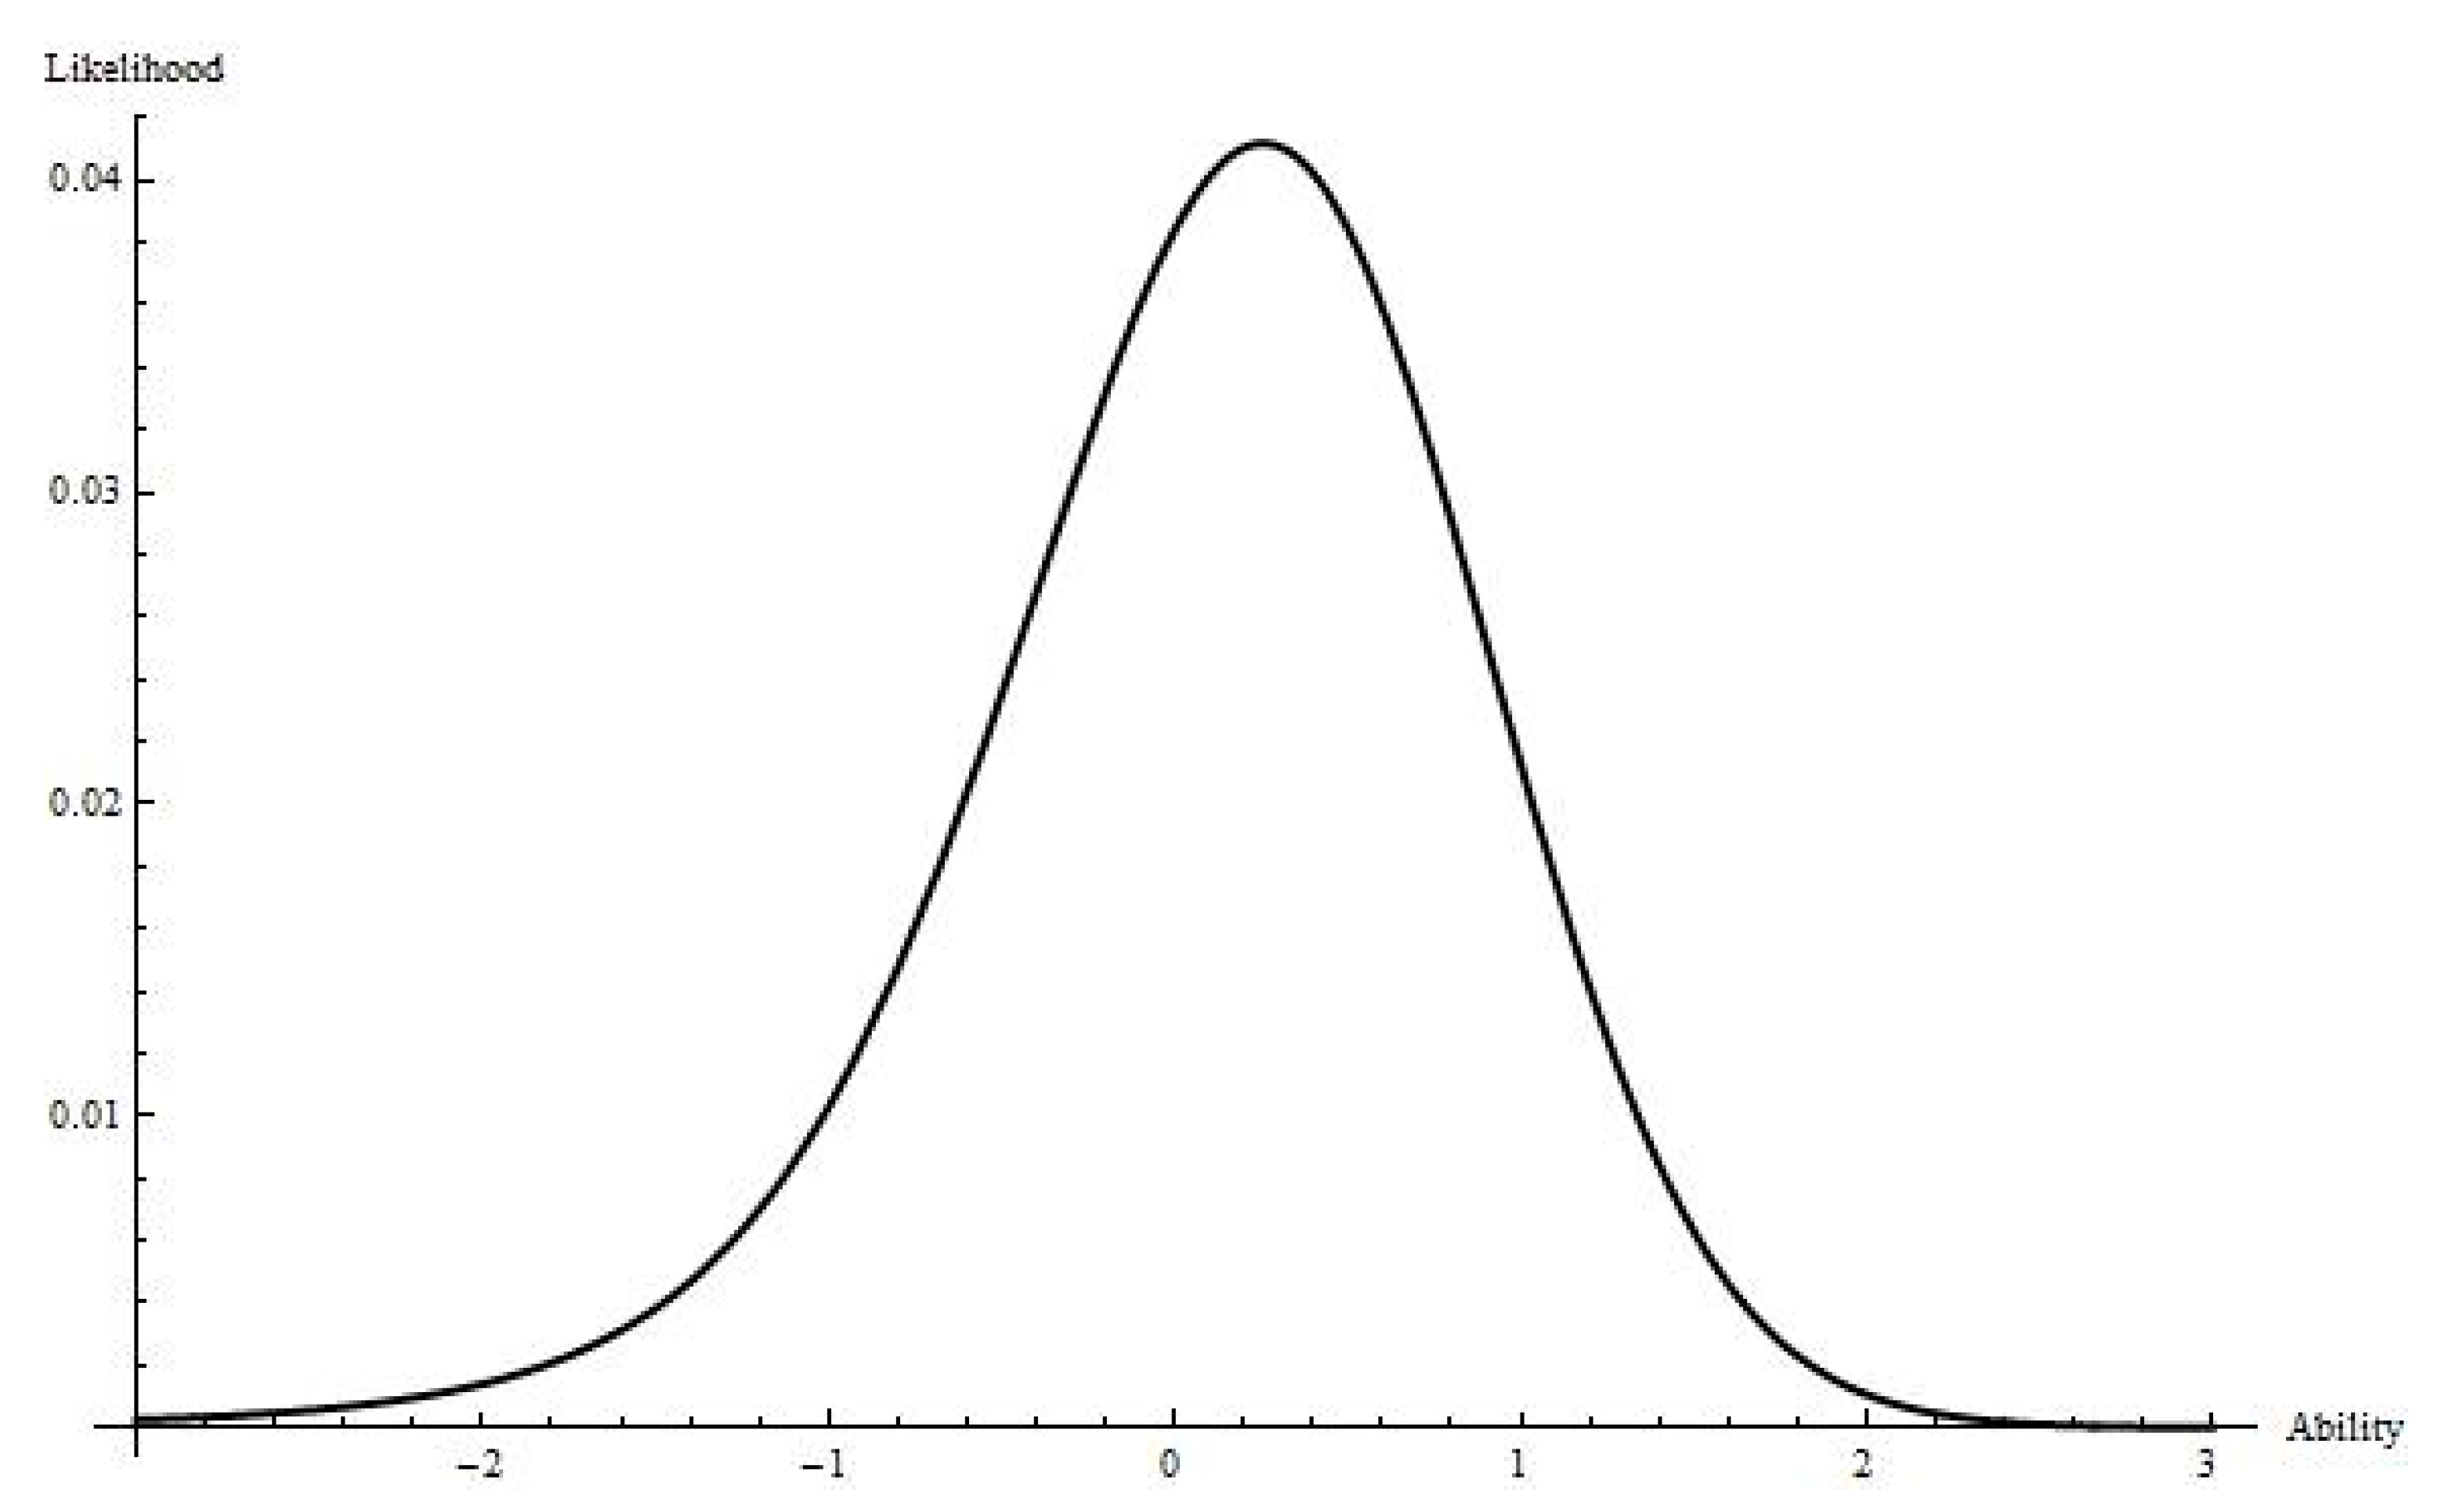
Table 1, Student 1 answered the first five items correctly and the last five items incorrectly, which means that they failed to answer the five most difficult items. In contrast, Student 2 answered the last five items correctly and the first five items incorrectly, which means they answered the five most difficult items but failed to answer the five easiest items. The first student is an example of fitting response pattern and the second student is an example of misfitting response pattern. The likelihood function for Student 1 is presented in
Figure 1. As showed in
Figure 1, a fitting response pattern results in a likelihood function with a clear maximum at the estimated trait level and sharp drop-offs at other values on the ability scale.
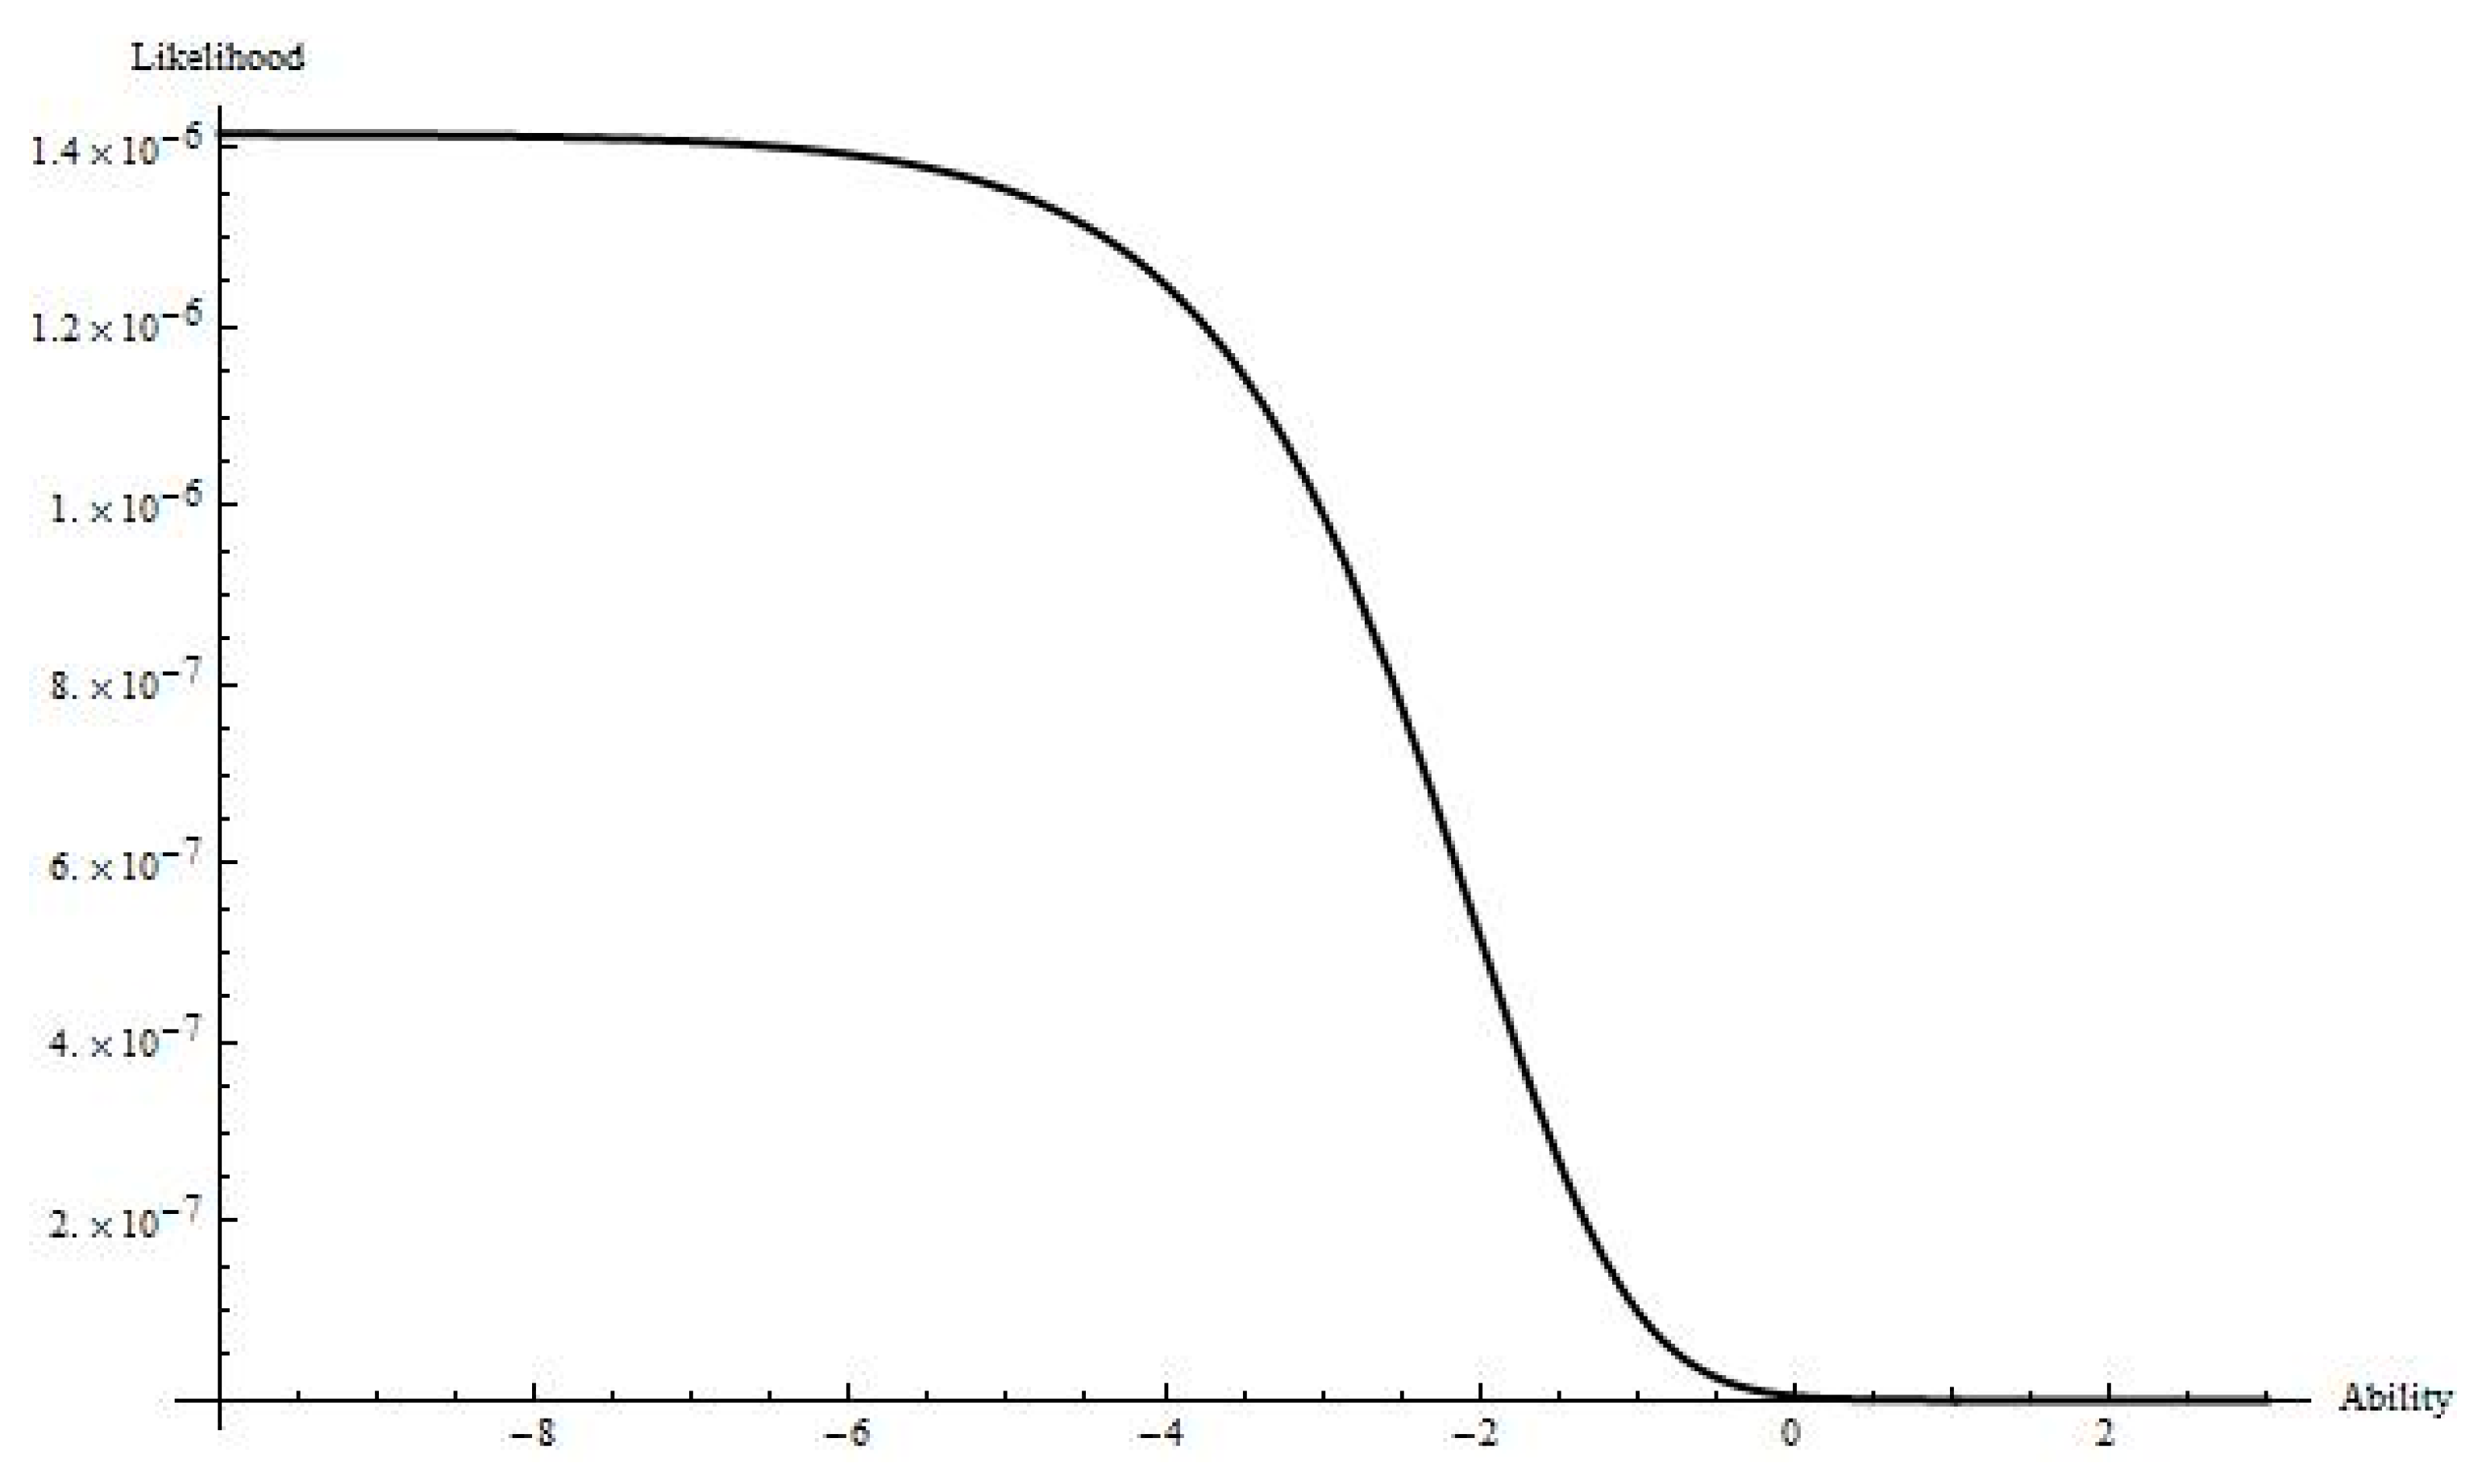
The likelihood function for Student 2 is presented in
Figure 2. As demonstrated in
Figure 2, a misfitting response pattern results in a likelihood function without a clear maximum and that is mainly flat for lower values of ability, and then tails down similar to the right tail shown in
Figure 1. Although both students achieved the same number-correct score of five, they have different response patterns (i.e., fitting versus misfitting) and their ability estimates are different. While the estimated ability for Student 1 is approximately 0.5, there is no obvious estimate of Student 2′s ability. So, any decision-making for Student 2 based on their ability estimate is questionable, as their ability estimate may not be accurate. This example demonstrates the need for assessing fit of individual response patterns for the IRT model used.
1.1. Overview on Person Fit Statistics
To assess the fit of a student’s response pattern to the measurement model a “person fit statistic” (PFS) is used. Generally, PFSs classify students into two groups: students with fitting response vectors and students with misfitting response vectors. One advantage of PFSs is that they analyze response patterns of each individual student tested. Analyzing specific patterns of item responses can disclose more information than simply analyzing test scores at the group level, because students may differ in response strategies that they use for answering items on a test. Emons, Meijer, and Sijtsma (2001) suggested that misfitting responses may serve as an indication that a student’s response behavior may have been influenced by factors that were not intended to be measured by the test [
1].
The different PFSs can be classified into are two main categories: group-based and IRT-based person fit statistics. In the group-based, PFSs are computed irrespective of a particular measurement model and use observed response patterns without considering, for example, item parameters. Group-based PFSs classify an observed response pattern as misfitting if easy items are answered incorrectly and hard items are answered correctly by a student [
1]. Examples of group-based person-fit statistics include Harnisch and Linn’s (1981) modified caution index
C [
4], van der Flier’s (1982)
U3 index [
5], Tatsuoka and Tatsuoka’s (1983) norm conformity index
NCI [
6], and Sijtsma’s (1986)
HT coefficient [
7].
In the IRT-based approach, PFSs assess the fit of a response pattern relative to a given IRT model such as the three-parameter logistic (3-PL) model. Model based PFSs use estimated item and ability parameters for calculating person fit indices and then classify responses as misfitting or fitting. IRT-based person fit statistics are specifically designed to evaluate the misfit of an observed response pattern with an IRT model by calculating the response probabilities using student ability and item parameters. If, according to the IRT model, the probability of a correct response from a student is high, the hypothesis is posited that the student should answer that item correctly, and vice versa. A misfit is found when the hypothesis is not supported by the observed data. Examples of IRT-based person fit statistics include Wright and Stone’s (1979)
U statistic [
8], Wright and Masters’s
W statistic (1982) [
9], Smith’s
UB and
UW statistics (1985) [
10], and Drasgow, Levine, and Williams’
lz statistic (1985) [
11].
1.2. Research on Person Fit Statistics
To date, the majority of the person fit literature has been focused on creating and evaluating new indices [
12]. Such efforts have led to more than 40 person fit indices. Some person fit indices may be used under specific conditions (e.g., only for the Rasch model); some are sensitive to specific types of misfitting response patterns (e.g., local versus global); and some are designed only for dichotomous items [
1]. Furthermore, the effect of person misfit has been studied on ability estimation, equating, and classification accuracy [
13,
14,
15]. In addition, there are studies that have attempted to provide explanations for why and how person misfit occurs (e.g., [
16,
17]).
The studies conducted by Levine and Drasgow (1982) [
18], Philips (1986) [
19], Rudner, Bracey, and Skaggs (1996) [
20], Hendrawan, Glas, and Meijer (2005) [
14], Sotaridona, Choi, and Meijer (2005) [
15] are the only studies in the literature that (directly or indirectly) considered the effect of misfitting response patterns on item parameter estimation. Taken together, these five studies provide limited and mixed information on how misfitting response patterns affect item parameters. Levine and Drasgow (1982) found no significant effect of person misfit on the estimated item parameter estimates and argued that different misfitting response patterns would have opposing effects on estimated item parameters [
18]. Philips (1986) investigated the effect of misfitting response vectors using the Rasch model [
19]. He found that deletion of misfitting response patterns can improve the model-data fit, but have only small effect on estimated item difficulty parameter. Rudner, Bracey, and Skaggs (1996) analyzed the 1990 NAEP data and found almost no misfitting response vectors. Consequently, removing misfitting patterns did not result in a significant difference in the mean of the test before and after deleting misfits [
20]. Sotaridona et al. (2005), who conducted a study most related to the focus of the present study, found that the estimated item difficulty and discrimination parameters were consistently larger in the presence of person misfit and the standard error of estimation was higher for the data with misfitting response patterns. They concluded that inclusion of misfitting response patterns had reduced the accuracy of parameter estimation, but at the test level the effect was minimal [
15]. While Hendrawan et al.’s (2005) study was more comprehensive, the focus of their study was on the effect of person misfit on classification decisions. A small portion of the study was dedicated to the effect of person misfit on estimated parameters. Their results showed that the presence of misfitting response patterns resulted in biased estimates of item parameters and inaccurate mastery classification decisions, especially for guessing behavior, which lowered the mean of distribution of estimated abilities [
14]. In a recent study, Cui and Mousavi (2015) studied the effect of removing misfitting response patterns on estimated item parameters in a data set from a large-scale Grade 9 mathematics test. The
lz statistic was used. Their results showed that the changes in item parameter estimates before and after removing misfitting response patterns were noticeable for some items [
16]. Cui and Mousavi argued that for a better understanding of how misfitting response patterns affect item parameter estimates a comprehensive simulation study is needed. If misfitting response patterns do affect the estimates of the item parameters, then the scores of all the students could be comprised. Consequently, the scores may not be validly interpreted.
Therefore, the purpose of the present study is to investigate the effect of inclusion and exclusion of misfitting response patterns on the item difficulty (b) and item discrimination (a) parameters in the 2-Parameter Logistic IRT model using simulation procedures. Four factors—test length, item parameter estimation method, percentage of misfitting response vectors in the sample, and procedure for identifying and removing misfitting responses—are considered.
2. Materials and Methods
2.1. Simulation Design
Tests with 20, 40, and 60 multiple-choice items were chosen to mimic test lengths used in real testing situations. The item parameter estimation methods included Marginal Maximum Likelihood estimation and Bayes Model estimation, the two most often used methods of estimation in IRT. The percentage of misfitting response patterns in the samples were 10%, 20%, and 30%, which were the most frequently studied in previous research studies [
12]. The
[
21], an IRT-based index, and the
HT, a group-based index, were used to identify and remove misfitting response patterns. The
was used because it is the modified version of the
index, which is one of the most studied IRT-based person fit statistics. Likewise,
HT was used because it is one of the most referenced and used group-based statistics in previous research (e.g., [
22,
23,
24,
25]). Given these factors are fully crossed, the design of this study is a 3 × 2 × 3 × 2 (test length-by-item estimator-by-percentage of students susceptible to producing misfitting response patterns-by person fit statistic) fully crossed design. Each of the conditions was replicated 100 times. A sample size of 5000 students was used for all conditions. All computational procedures were done using a written program in the R software [
26].
2.2. Data Generation
The 2-PL IRT model was used for analyzing the sample test data. A normal distribution with a mean of 0 and standard deviation of 1 was used for generating students’ abilities. Item difficulty parameters were generated using a uniform distribution on the closed interval [−2.7, 2.7]. Item discrimination parameters were generated using a uniform distribution on the closed interval [0.5, 2.5]. These two distributions were used by other researchers (e.g., [
1,
25,
27,
28]) and cover the values of item difficulty and item discrimination usually found in practice.
Four types of data sets were considered. Fitting response data sets (Fitting), which had no misfitting responses, were generated for each of the three test lengths. The procedure involved the following steps: First, the true theta () values for respondents were drawn from a standard normal distribution. Next, the 2-PL IRT model was used with corresponding item parameters to calculate the probability of a correct answer (i.e., ) for each student. Then, a random number y from a uniform distribution on the closed interval [0, 1] was generated to assign 1 (as correct response) and 0 (as incorrect response) to the student responses. If y <, then the response to the selected item was set to 1. If y ≥, the response was set to 0. The generated data sets were analyzed to calibrate items and determine ability parameters using Marginal Maximum Likelihood (MML) and Bayes Modal (BM) estimation methods for the item parameter estimation and the Maximum Likelihood (ML) method for ability estimation.
Data sets with misfitting response patterns (Misfitting) were generated by manipulating Fitting data sets for each of the three test lengths and percentage of misfitting response patterns. Rupp (2013) argued that there are many labels utilized by researchers to distinguish different types of misfitting response behaviors [
12]. While most labels are attributed to possible underlying causes of misfitting responding, each label results in, generally, spuriously high or spuriously low responding. Spuriously low responses occur when a student obtains a lower score than what would be expected. Spuriously high responses occur when a student obtains a higher score than what would be expected. For generating misfitting response patterns, a method originally purposed by Drasgow (1982) was applied [
29]. To generate responses leading to spuriously low responding, responses of high-ability students (i.e., students with
) were selected and their responses to the randomly selected items were changed to be incorrect with a probability of 0.8. For generating responses resulting in spuriously high responding, responses of low ability students (
were selected and their responses to the randomly selected items were set as correct. By taking this approach, misfitting response patterns differed from one student to another one. Similar method for generating misfitting response patterns was used by other researchers (e.g., [
27]). For each level of percentage of misfitting responses in sample, a 50–50 percent allocation was used to generate spuriously high and spuriously low responding behavior. The 50–50 split was used because it is very rare to have only one type of misfitting response pattern in test data in real-world testing situations. The third and fourth types of data sets were, respectively, the data sets with only misfitting response patterns removed by
and by
HT for each condition. Hereafter, the last two data sets will be simply denoted as
and
HT datasets.
2.3. Procedure and Evaluation Criteria
To investigate the effect of exclusion of misfitting response patterns on item parameter estimates, estimated item parameters before and after deletion of misfitting response patterns were compared in terms of the magnitude and direction of change for each condition. Bias for each item parameter was computed as the difference between the mean of the estimated parameters and the true parameter value across the 1000 replications for each condition. The formula for the bias in the estimated
b parameter is:
where
is the generated true item parameter for item
j and
is the estimated item parameter for item
j for the
kth replication. The bias in the estimated a parameter was computed from the same formula with
a in place of
b. Unfortunately, there were no determined criteria on how large item parameter estimation bias should be considered severe. Therefore, for the purpose of this study, three ranges of bias were used: equal to or between −0.10 and 0.10, −0.20 to −0.10, or 0.10 to 0.20, and biases that are either smaller than −0.20 or larger than 0.20.
In order to assess the effect of inclusion and exclusion of misfitting response patterns on the variability of the estimated parameters at the test level, the value of mean absolute deviation (MAD) was calculated for each condition and then the mean of the MADs for the 100 replications was computed using the following formula:
where
J is the test length (i.e., 20, 40, or 60). Again, the MAD for
a was computed by replacing
b in the formula with
a.
To investigate to what extent bias in the estimated b and a parameters influenced the estimate of examinees’ ability, the classification accuracy of placing students in one of two classes was examined. Students with true θ < 1.00 were classified as “low”-performing and students with true θ ≥ 1.00 were classified as “high”-performing. For the Fitting, Misfitting, , and HT data sets, students with estimated < 1.00 were classified as low-performing and students with estimated ≥ 1.00 were classified as high-performing for each of the 1000 replications and a 2 × 2 classification contingency table was developed with the frequency of students in each cell for each replication. The mean number of students in each cell was then calculated across replications. The values were then rounded to the nearest whole number using scientific rounding to compute the decision accuracy for the four data sets.
As note by Armstrong et al. (2007), there are no tabulated critical values for the
, and consequently for the
and also for the
HT a bootstrap method was used to set the cutoff values for person fit indices [
27]. For the bootstrap method, a data set comprising of 5000 fitting response patterns was generated using the item parameters estimated from the full data set with fitting and misfitting response patterns (i.e., Misfitting) for each condition. The rational for using estimated item parameters is that in practice, true item parameters are unknown and only estimated item parameters are available. Therefore, using estimated parameters in order to set the cutoff value leads to estimates that are closer to the reality. This simulated fitting data set was then used to determine the cutoff score as follows:
- 1.
The value of each person fit index (i.e., and HT) was calculated for each of the simulated fitting data responses;
- 2.
A random sample of 5000 person fit values (i.e., equal to the sample size of the data sets), was selected with replacement, from the calculated person fit values in step 1 and the 5th percentile rank of this random sample was found. This is because both the and HT consider the lower 5% of person fit values as misfitting response pattern with α = 0.05;
- 3.
Step 2 was replicated 1000 times to have a data set comprising of 1000 estimates of the 5th percentile rank which forms an empirical distribution of the cutoff score;
- 4.
The median of the 1000 estimates was used as the final cut score to differentiate fitting response patterns from misfitting response patterns for the corresponding person fit index.
Therefore, for each condition, the following six steps were followed: (a) generate 100 fitting data sets based on the test length (i.e., Fitting), (b) manipulate the fitting data sets in order to create 100 misfitting data sets with misfitting response patterns based on given percentage (i.e., Misfitting), (c) estimate item and ability parameters of the Fitting and Misfitting data sets and classify students into low- and high-performing categories, (d) remove identified misfitting response patterns using and HT, (e) re-estimate item parameters and ability estimates for the and HT data sets and classify students into low- and high-performing categories, and (f) compute bias, MAD, and decision accuracy for each cell. The detection power and Type-I error rate of the two person fit indices were also monitored. The detection power was computed as the percentage of truly detected misfitting response patterns out of the manipulated response vectors and the Type-I error rate was calculated as the percentage of falsely detected response patterns as misfitting out of the fitting response vectors in Misfitting data sets.
3. Results
Result of the study are presented under two sub-sections pertaining to item parameter estimation and classification accuracy. The results revealed that the outcomes based on the MML and BM estimates of items parameters were comparable (i.e., in terms of estimated parameter and standard error of estimate) for each of the four types of data sets across all conditions. Therefore, the summaries and graphs presented below are based on the results for the MML estimator only. The detection power and Type-I error rates for both the
and
HT across all conditions are summarized in
Table 2:
Both the and HT showed quite comparable detection rates across all conditions and the detection rate increased alongside with the test length. In terms of Type-I error rate, both indices showed value smaller than 5% while the HT showed slightly better performance. Overall, the performance of both indices was not optimal.
3.1. Item Parameter Estimation
The b parameter: The bias in the b parameter occurred for items in the tails of the distribution; while there was no bias in the fitting data sets, large negative b values were underestimated and large positive b values were overestimated for all the conditions in the Misfitting data sets. The number of items with biased b parameter estimates in each tail increased as the percentage of misfitting response patterns increased.
The a parameter: The bias in the a parameter tended to occur for items with large a parameters. Like the b parameter, there was no bias in the a parameter in the Fitting data sets, but in contrast to the b parameter, the a parameter was consistently underestimated for all conditions in the Misfitting data sets. The number of items with bias in a and the size of the bias in a increased as the percentage of misfitting response patterns increased.
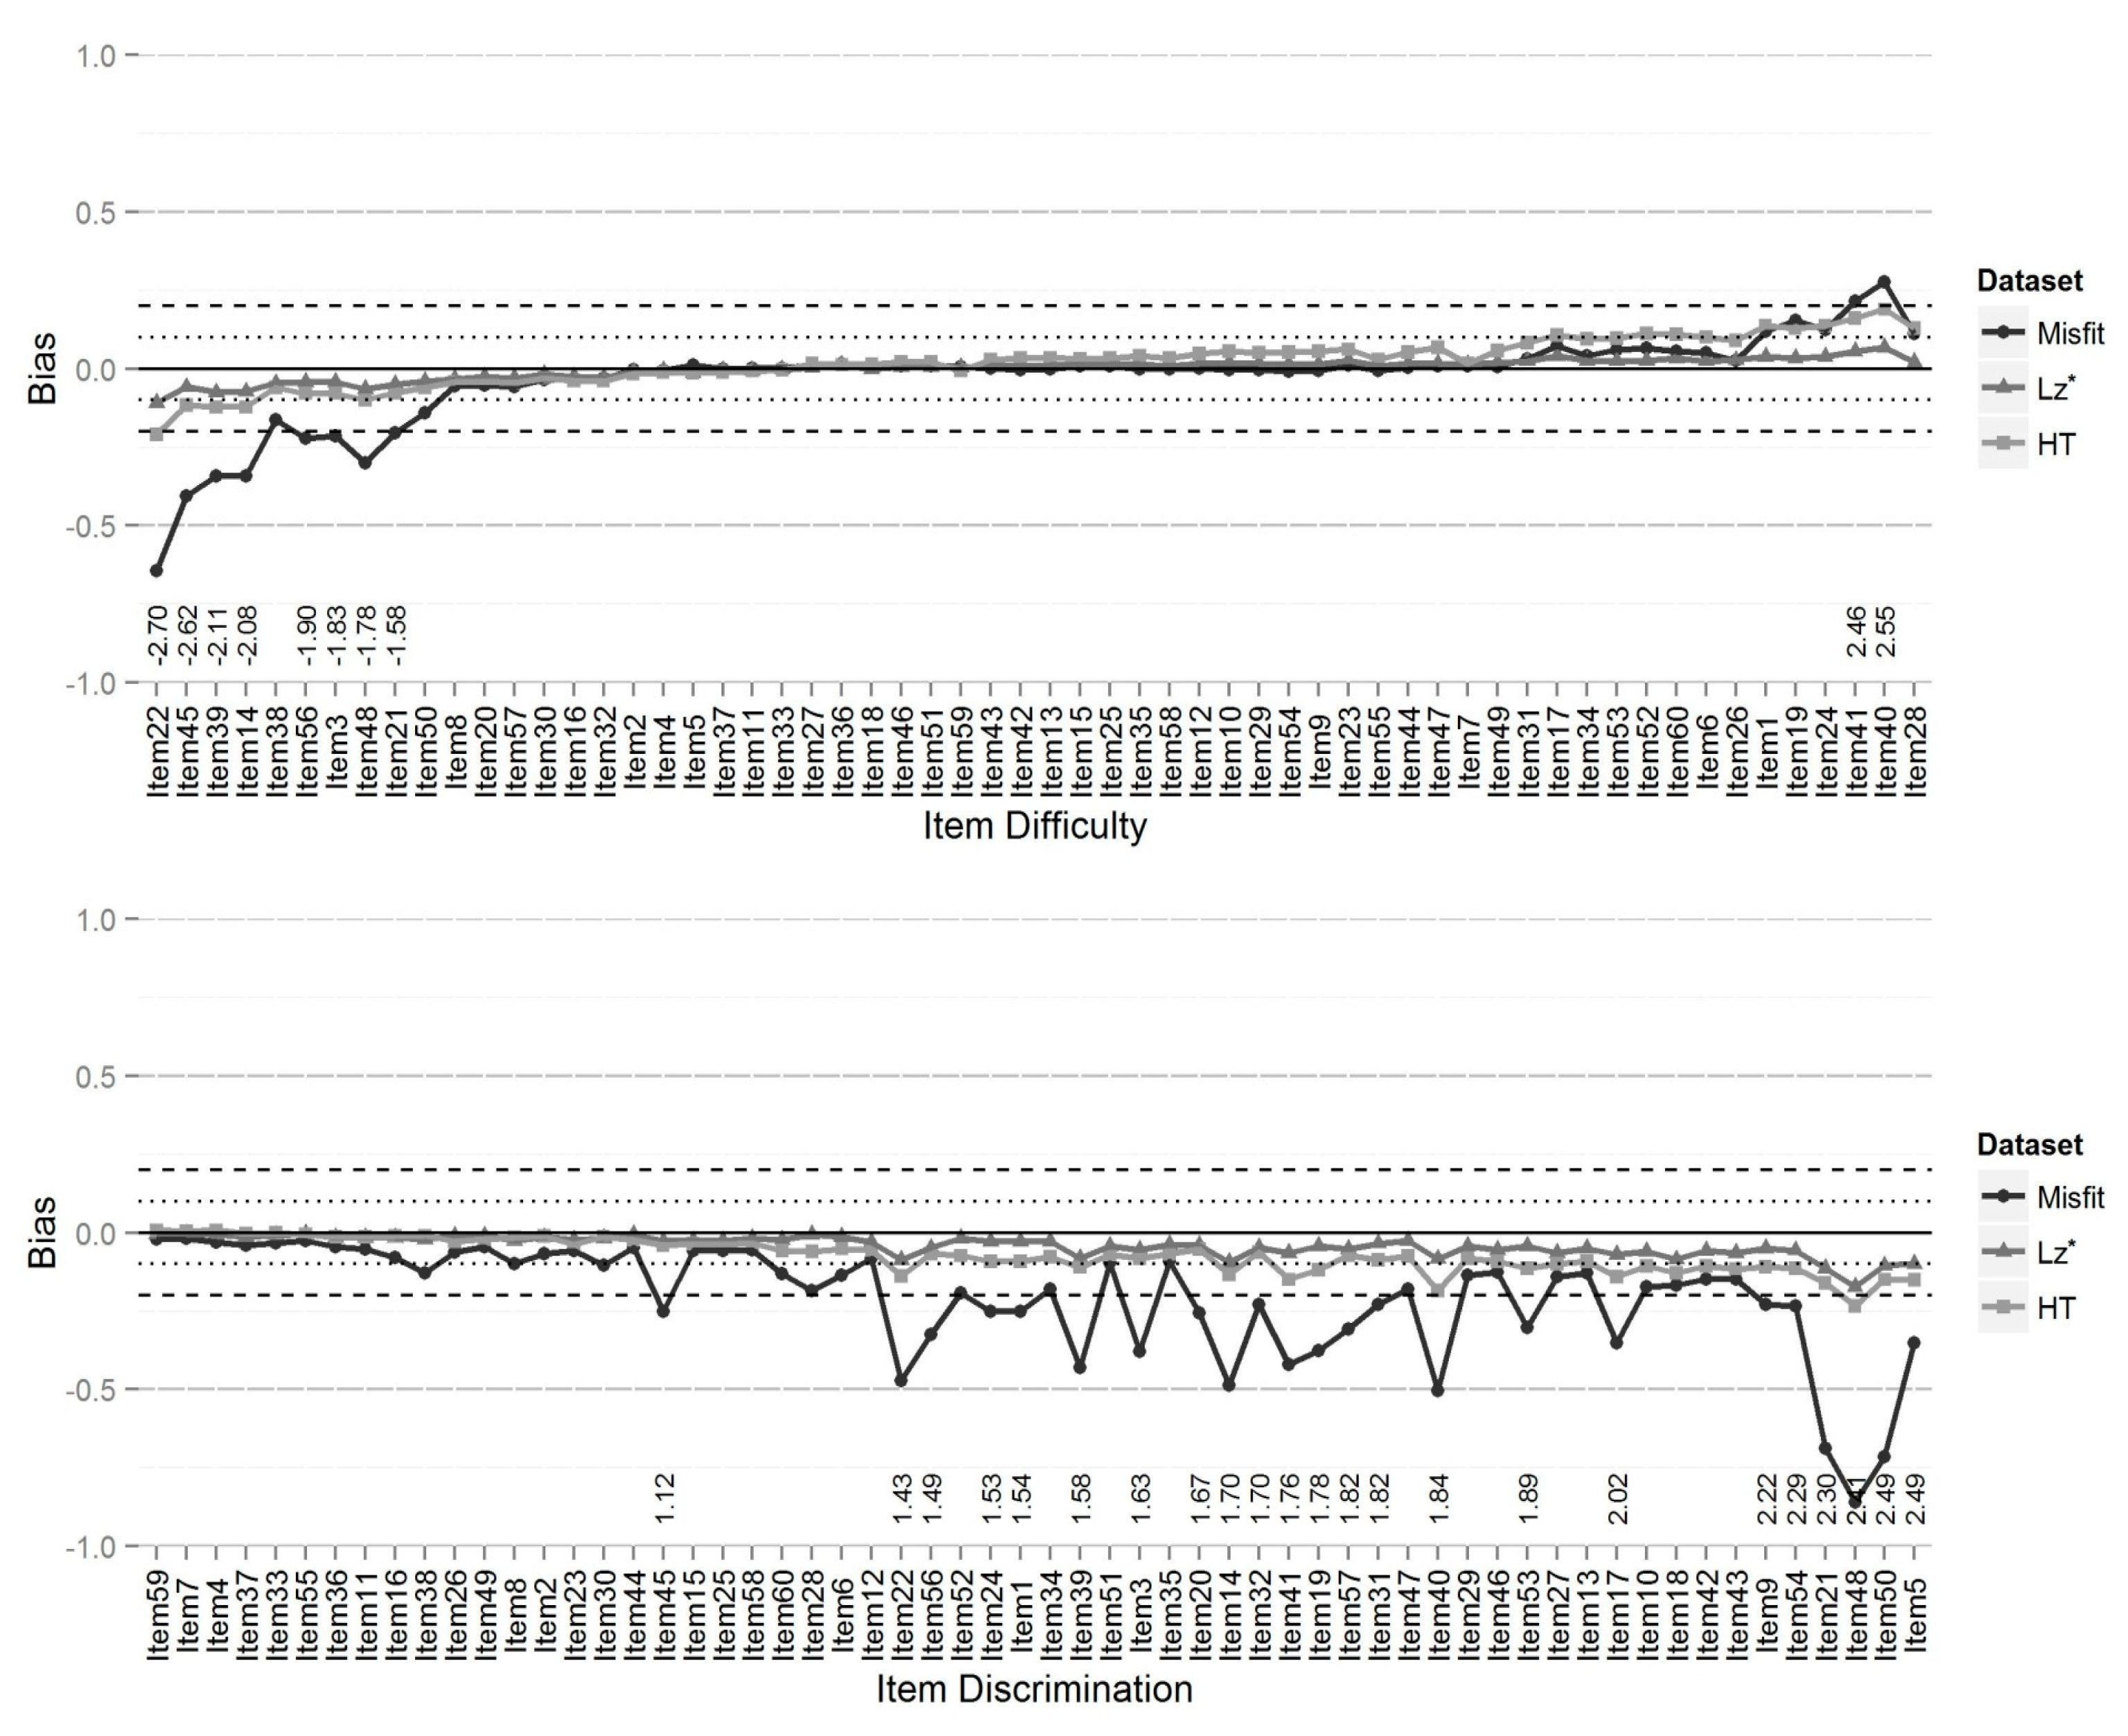
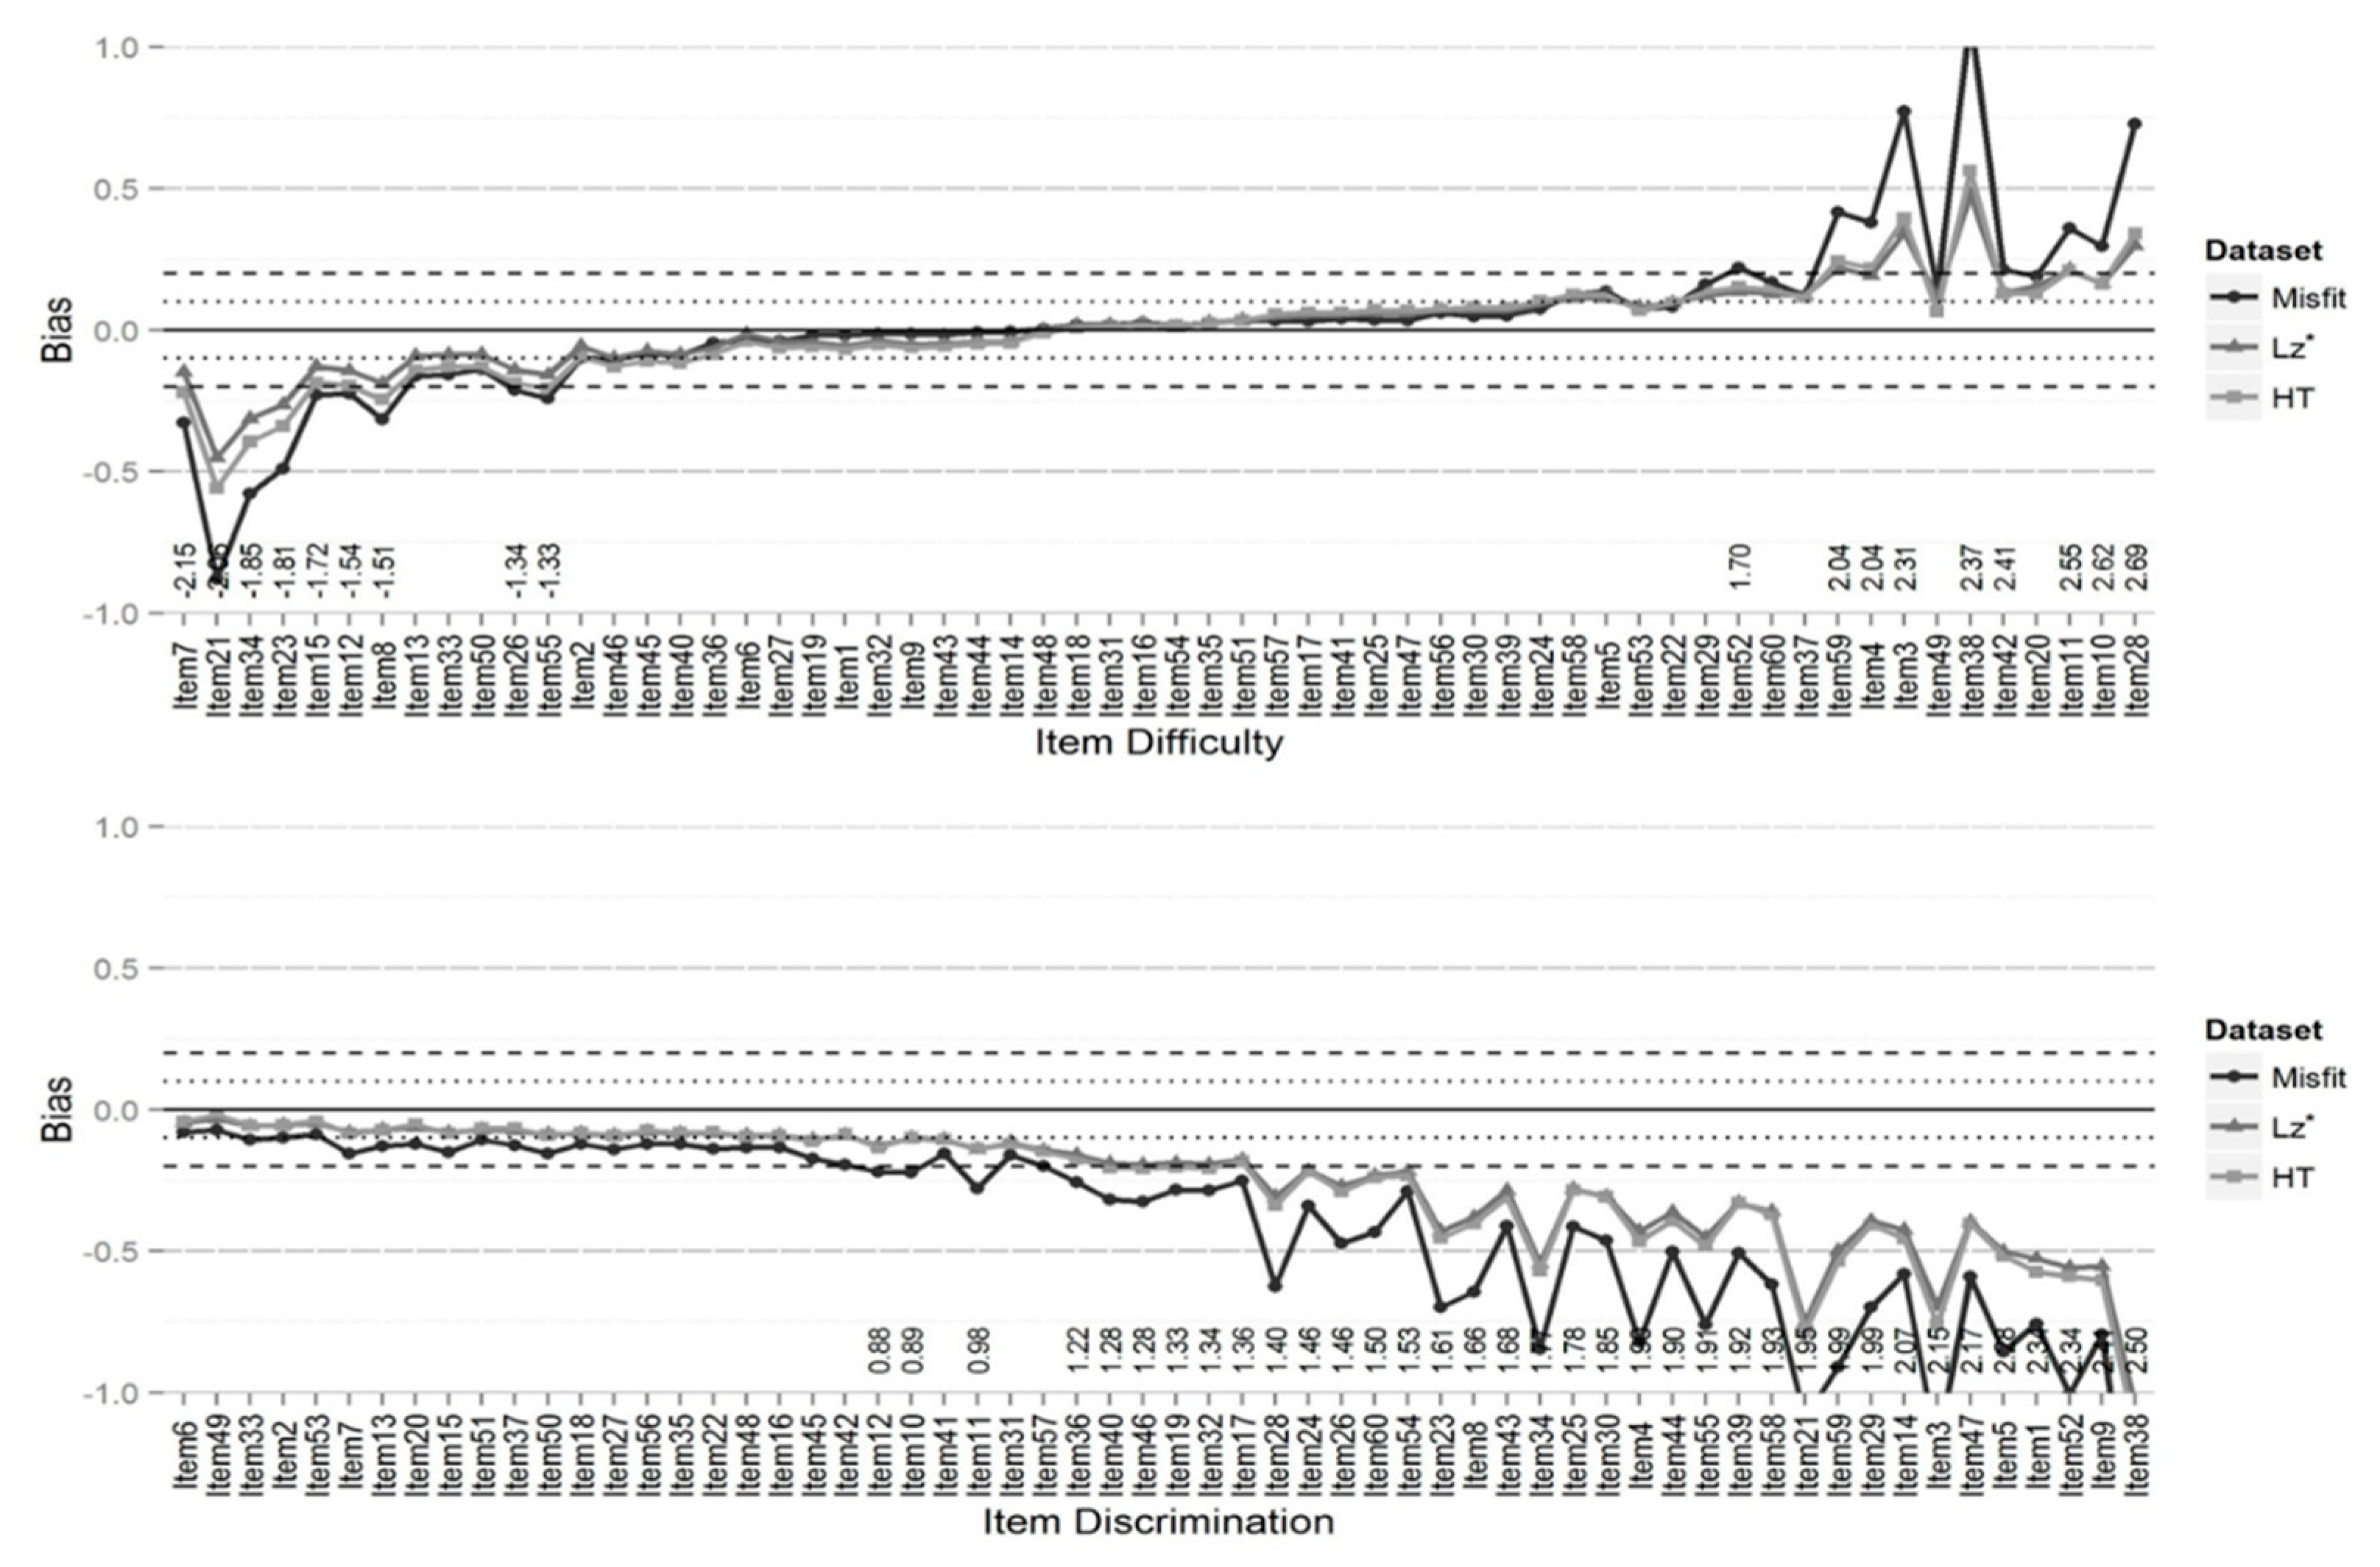
Figure 3 and
Figure 4 illustrate the bias in the
b and
a parameters for the conditions with 10% and 30% misfitting response patterns in the sample with a test of 60 items. The horizontal dotted line represents bias estimates in the range of ±0.10 and the dashed line represents bias estimates outside of ±0.10 and less than or equal to ±0.20. The upper graph represents results for the
b parameter and lower graph represents results for the
a parameter. Items on the x-axis are sorted ascendingly (i.e., left to right) in terms of the values of true
b and true
a parameters. Item bias values outside of ±0.20 are labeled on the x-axis with their corresponding true value.
As can be seen from
Figure 3 and
Figure 4, the
a parameter was more affected by presence of misfitting response patterns than the
b parameter, both in terms of the number of items and the size of the bias. This pattern was consistent for all conditions. Also, while using
to remove misfitting response patterns tended to result in less biased estimates for both the
b and
a parameters when the percentage of misfitting response patterns in sample were 10% or 20%, using
HT tended to result in less biased estimates when the percentage of misfitting response patterns was 30%.
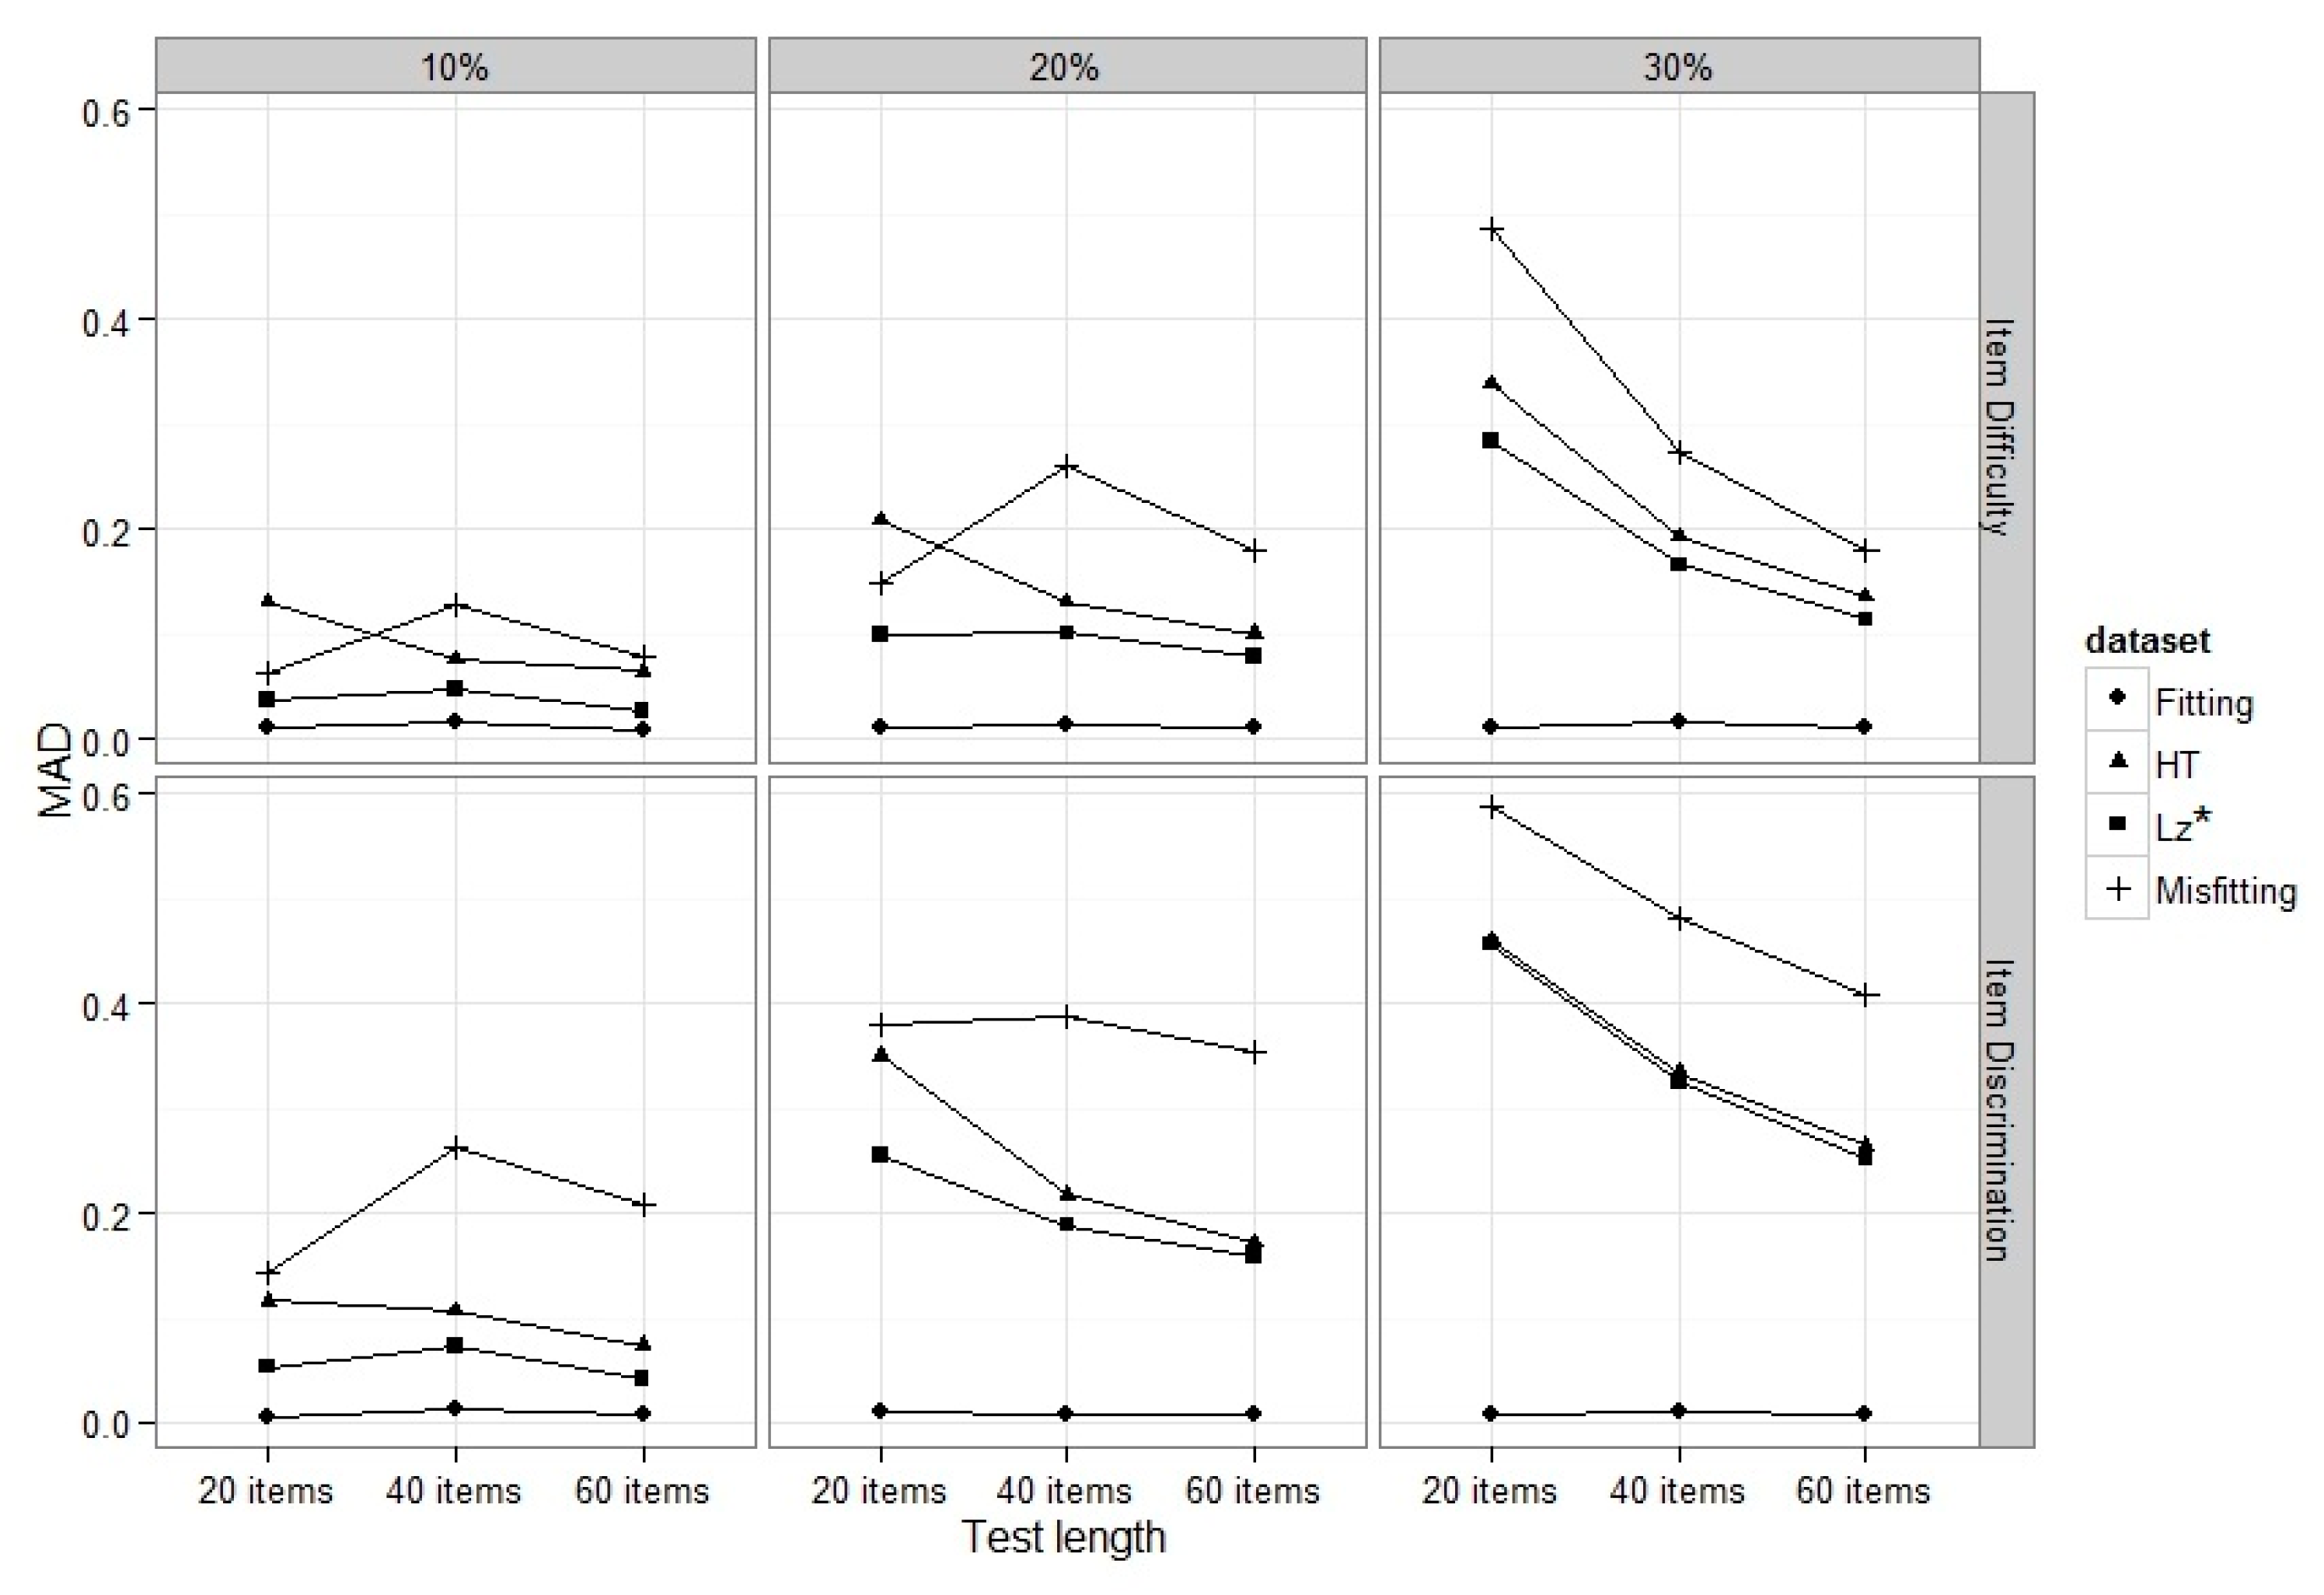
Figure 5 shows the distribution of MADs across test length, percentage of misfitting response patterns in the sample for the
b and
a parameters for Fitting, Misfitting,
, and
HT datasets.
As was expected, the MADs for the Fitting dataset were very close to zero across all conditions. For the other types of datasets, however, the values of MAD tended to increase as the number of items and percentage of misfitting responses increased, particularly for the test with 20 items and 30% misfitting responses. With two exceptions (b for the test with 20 items and 10% and 20% misfitting responses), the values of MAD were greatest for the Misfitting data set, followed by the HT and data sets, which tend to be more comparable.
Across almost all conditions, the presence of misfitting response patterns led to larger MAD values. The MAD increased when the percentage of misfitting response patterns in the sample increased and decreased when the test length increased. The use of resulted in less bias at the test level compared to HT and only for the condition where there were 30% of misfitting response patterns in the sample and HT performed very similar.
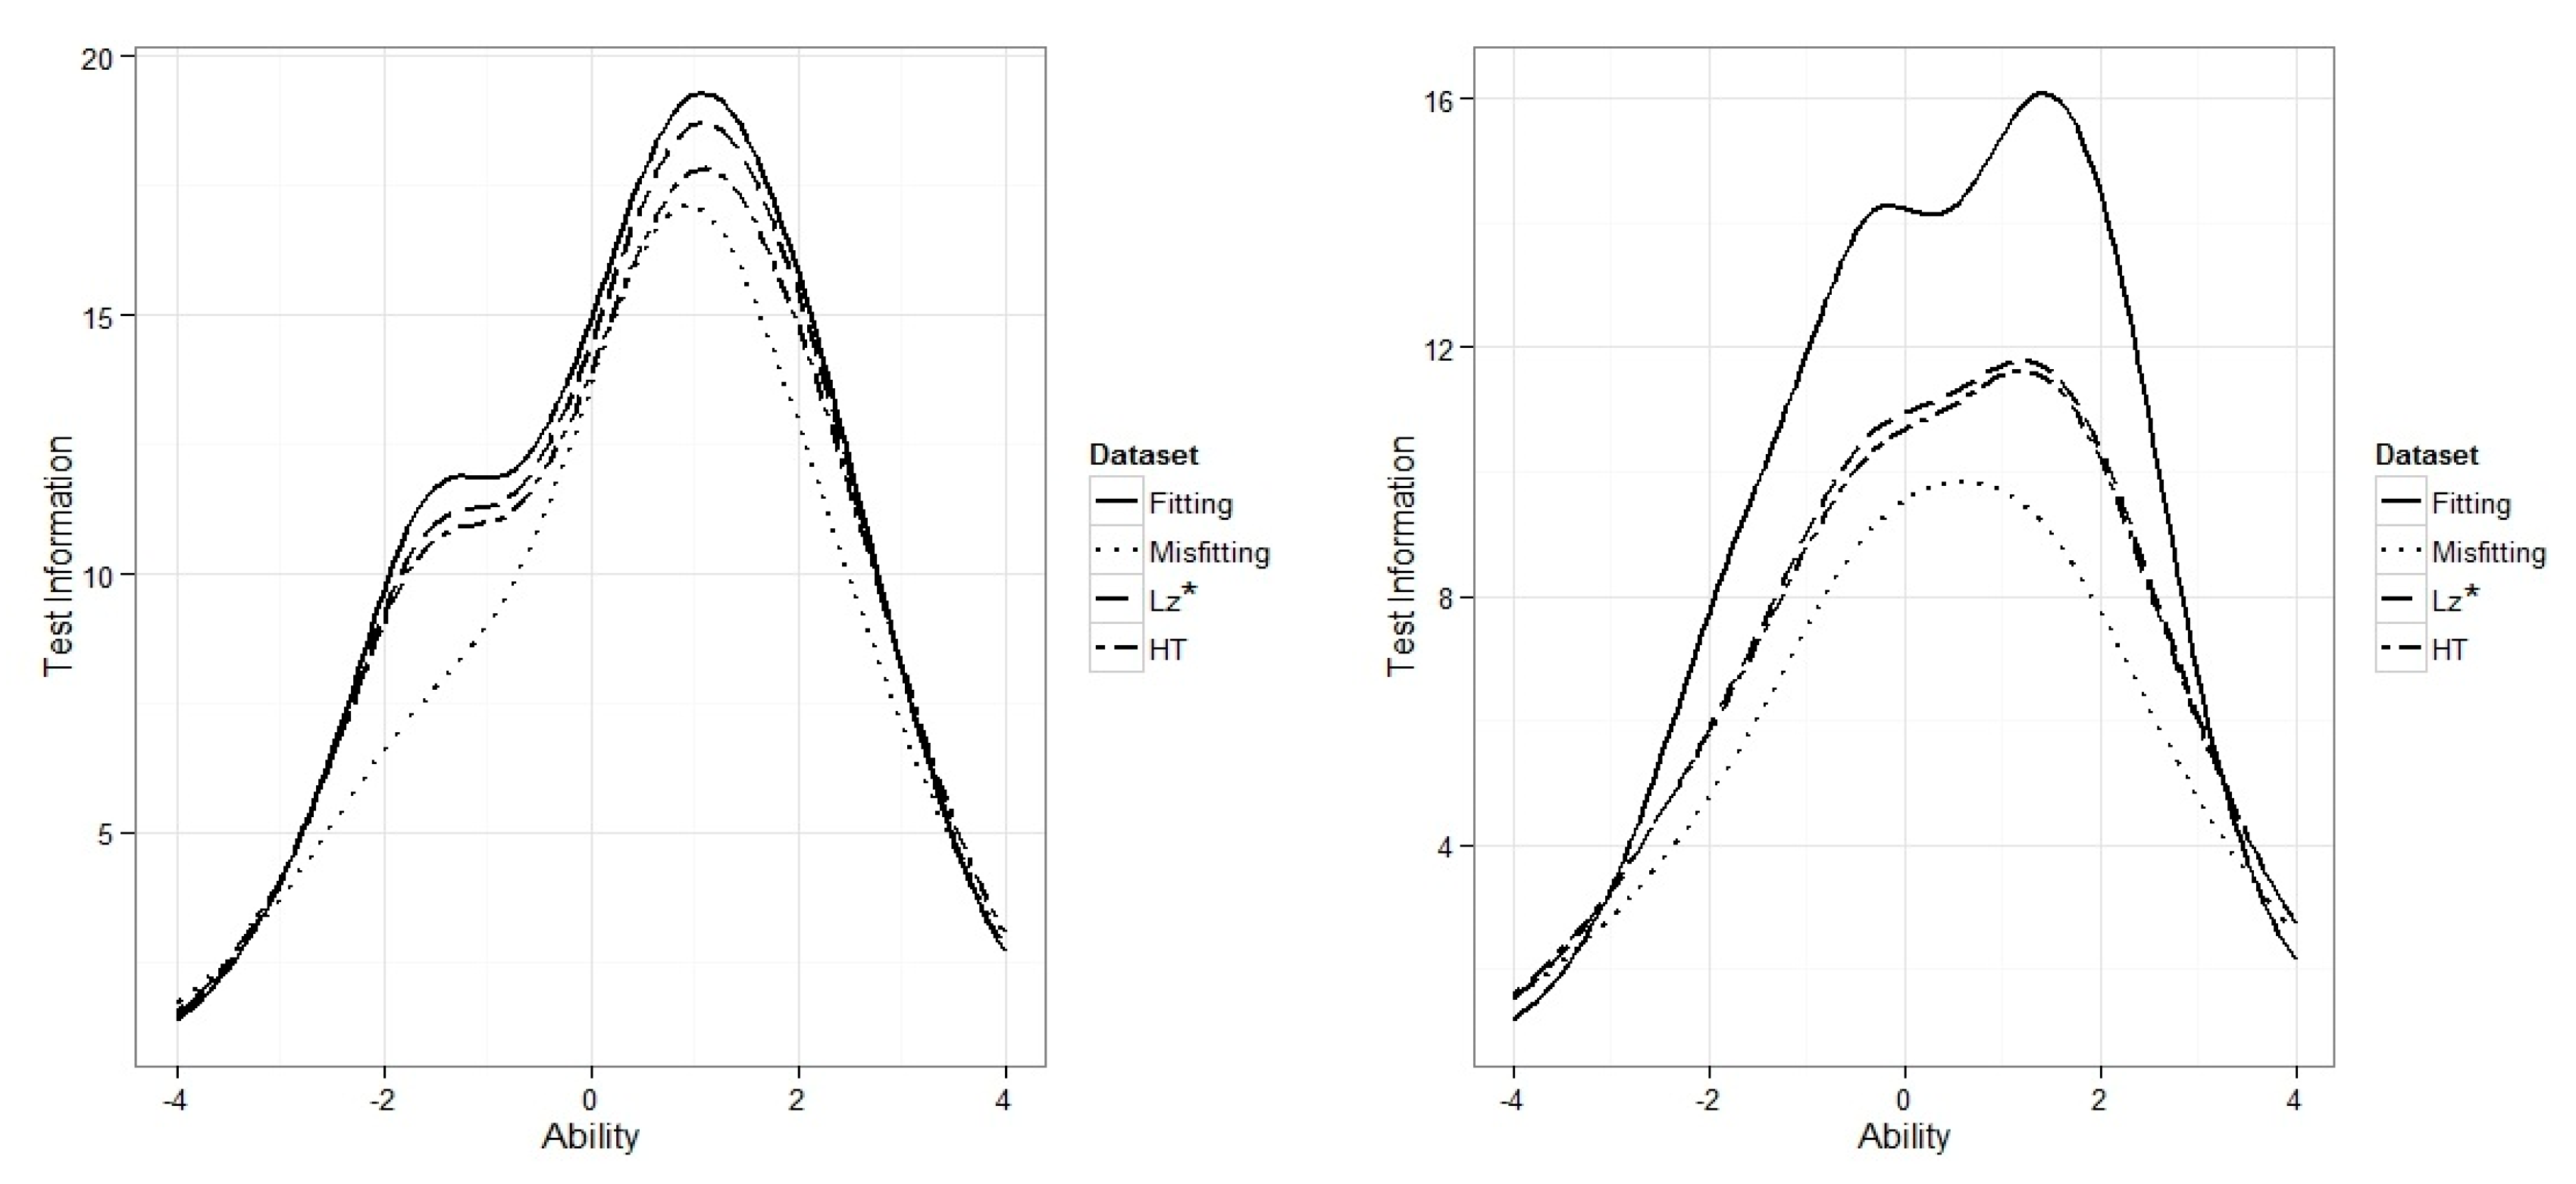
As another way of looking at the effect of misfitting response patterns at the test level,
Figure 6 illustrates the test information function calculated for the same estimated item parameters used to generate
Figure 3 and
Figure 4 in addition to the corresponding estimated item parameters from the fitting data set.
As can be seen in
Figure 6, an increase of misfitting response patterns in the data set was followed by a decrease in test information function. When there were only 10% misfitting response patterns in the data set (i.e., the graph on left), the total test information reduced by about 15.5% for data set with misfitting response patterns (i.e., dotted line) compared to the data set with fitting response patterns only (i.e., solid line) across all theta values. Additionally, when there were 30% misfitting response patterns in the data set (i.e., the graph on right), the total test information reduced by about 35% for data set with misfitting response patterns (i.e., dotted line) compared to the data set with fitting response patterns only (i.e., solid line). Using
and
HT to remove misfitting response patterns and re-estimating item parameters resulted in slight improvement in test information function mostly when the number of misfitting response patterns in data set was low.
3.2. The Classification Accuracy
The patterns of classification of students into two categories were similar for all conditions.
Table 3, corresponding to the test with 60 items and 30% of misfitting response patterns in the sample, shows an example of such pattern. As can be seen in
Table 3, for the Fitting of the 4208 students classified as low-performing using their true ability parameters, 97.0% were classified as low-performing using the item parameter estimates derived from the fitting data set and 3.0% were classified as high-performing (false positive misclassification). The percentage of high-performing students classified as high-performing, 78.7%, was lower than the percentage of low-performing students classified as low-performing, 97.0%. While the overall classification percentage for this data set was 94.1%, the accuracy was greater for the low-performing students than for the high-performing students.
The percentage of correct decisions for the students with true low ability was 97.0% for the Fitting, 95.5% for the Misfitting, and 96.3% for the and HT data sets. In contrast, the percentage of correct decisions for the students with true high ability dropped to 78.7%, 60.9%, 58.7%, and 58.5% for the Fitting, Misfitting, and HT data sets, respectively. Consequently, the percentage of classifying high-performing students as low-performing, false negative misclassification, was higher than the percentage of false positive misclassifications across all conditions. Lastly, the overall classification percentage was highest for the Fitting data set and essentially constant for Misfitting, and HT data sets (90.0% to 90.4%).
Overall, across all the simulation conditions, the classification accuracy was high (>0.90) for the low-performing students and essentially consistent across the Fitting, Misfitting, , and HT data sets. In contrast, the classification accuracy of high-performing students was lower (0.60 to 0.82) for the Fitting, and dropped (0.45 to 0.78) for the Misfitting, , and HT data sets, for which the classification accuracy was essentially the same. The use of the person fit indices and HT to remove misfitting response patterns did significantly not improve the classification accuracy.
4. Discussion
Levine and Drasgow (1982) used the 3-PL IRT model to study (1) the effect of using estimated item parameters versus true item parameters on the detection rate of and (2) the effect of misfitting response patterns on the detection rate of and item parameter estimation. Estimated item parameters from a previous calibration study of verbal section of the Scholastic Aptitude Test were used to generate simulated data. The spuriously low responding was simulated using about 7% of the sample, in which 20% of the item scores of the selected students were changed to be correct, with a probability of 0.20 and incorrect with a probability of 0.80. Levine and Drasgow concluded that the presence of misfitting response patterns had no effect on the detection rate of and item parameter estimation. They argued that different misfitting responses tended to have different incorrect response patterns and that, consequently, a large number of the misfitting response patterns would have opposing effects on estimated item parameters. Their findings are comparable with the findings of the present study: when the percentage of misfitting response patterns was low (e.g., 10%), the effect of misfitting response patterns on the estimated item parameters were small. However, the findings of the present study contradict the finding of Leven and Drasgow in that an increase in the percentage of misfitting response patterns led to a greater number of biased item parameters and a greater size of bias.
Philips (1986) investigated the effect of misfitting response vectors on the fit of the Rasch model, the value of the estimated b parameters, and the results of equipercentile equating using 1980 national standardization of the 3-R’s K-12 multilevel achievement test battery at 4th and 8th grades for reading and mathematics sub-tests. The percentages of misfitting response patterns varied from 1.9% to 11.3% across the two sub-tests. He found that deletion of misfitting response patterns can improve the model-data fit, had small effect on the estimated b parameters, and did not influence the equating results. His findings are partly consistent with the findings of the present study in that the effect of misfitting response patterns on the b parameter was less than on the a parameter. Runder, Bracey, and Skaggs (1996) analyzed the 1990 NAEP Trail State Assessment data and found almost no misfitting response vectors. Consequently, removing misfitting patterns did not result in significant difference in the mean of the test before and after deleting the misfitting response vectors.
Sotaridona et al. (2005) studied the effect of misfitting response patterns on item calibration and performance classification. In their study, they used (Snijders, 2001) and U3 (van der Flier, 1982) as the person fit measures and worked with a random sample of 10,000 students from a statewide assessment comprising three subject areas (i.e., Mathematics, Science, and Language Arts). Two types of misfitting responding (i.e., copying and guessing) were simulated by manipulating data of selected students (10% of students). The data sets were calibrated independently using the 3-PL IRT model. Results of their simulation study showed that the b and a parameters were, with one exception, overestimated in the presence of person misfit and the standard errors of estimation were higher for the data with misfitting response patterns. The exception was for the guessing data set, where the item parameters were underestimated on one occasion. Since the range of item parameter values was not reported by Sotaridona et al., it is hard to make a direct comparison with the present study. However, based on the graphs provided in Sotaridona et al. (2005), it seems that the differences between difficulty parameters estimated from the original data sets and manipulated data sets were much higher than the differences for the discrimination parameter. This finding is contradictory to the findings of the present study in that the a parameter was affected more by the presence of misfitting response patterns than the b parameter.
In addition to their original data set, Sotaridona et al. (2005) created two additional data sets: a data set comprising fitting responses flagged by and another data set containing fitting responses flagged by U3. Each data set was calibrated and equated and standardized scale scores were converted into three levels (below proficiency, proficient, and advanced). The total classification agreement between the original data set and fitting data set using varied from 96% to 100% and the total classification agreement between original data set and fitting data set using U3 varied from 94% to 100% across subject matters. Sotaridona et al. concluded that inclusion of misfitting response patterns reduced the accuracy of the parameter estimates, but at the test level the effect was minimal. This finding is consistent with the finding of the present study where the total classification agreement was essentially the same for data set with all misfitting response patterns and the data sets with misfitting response patterns removed by and by HT. However, the total agreement was lower for these three data sets and the data set with no misfitting responses had the highest total agreement.
Hendrawan et al. (2005) investigated the effect of misfitting response vectors on classification decisions. They used three true values of discrimination parameter—0.5, 1.0, and 1.5—crossed with true difficulty parameters that ranged from −2.0 to 1.6 for a test with 30 items and from −2.0 to 1.8 for a test with 60 items. They used three ability estimation methods—MLE, Expected A Posteriori (EAP), and Markov Chain Monte Carlo (MCMC)—with the three-parameter normal ogive model and marginal maximum likelihood (MML) and Bayes Modal to estimate the item parameters. Five person fit indices were utilized in the study, in addition to the . The simulation factors included two test lengths, two misfitting response types, three item discrimination values, two sample sizes, and three cutoff values for determining proficiency levels on the test. For generating misfitting response patterns, 10% of the samples were manipulated. Their results showed that the presence of misfitting response patterns resulted in biased estimates of item parameters and inaccurate mastery classification decisions, especially for guessing behavior, which lowered the mean of distribution of estimated abilities. However, the degree and direction of bias were not reported. The lower mean resulted in artificially higher classification accuracy for students with low ability. All person fit indices performed well and removal of students with misfitting response patterns resulted in increased classification decisions. As an overall conclusion, authors argued that person fit statistics are useful in finding fitting subsamples and are appropriate for using in mastery testing. The study by Hendrawan et al. (2005) was heavily focused on classification accuracy. They used three true values of the discrimination parameter and a restricted range of difficulty parameters and only mentioned that estimated parameters were biased but did not give the degree and direction of bias. Consequently, it is not possible to compare the findings for the estimated parameters of Hendrawan et al.’s study with the findings of the present study. However, the findings for classification accuracy are consistent with findings of classification accuracy in the present study.
The percentage of misfitting response patterns used in the previous study were essentially lower than or equal to 10% and this could be one of the reasons for not finding more and larger effects of removing misfitting response patterns on the estimated item parameters. Further, there was little information about details of the behavior of estimated item parameters before and after removing misfitting response patterns. The results of the present study revealed that the effect of misfitting response patterns on the estimation of b and a parameters is dependent on the number of items, percentage of students with misfitting response patterns, and the percentage of items susceptible to misfitting responses. However, despite the presence of the effects, which were complex, on the b and a parameters, removal of misfitting response patterns by lz and by HT did not change the results of classification from when all the misfitting response patterns were included.
5. Conclusions
The goal of this study was to examine the effect of misfitting response patterns on item parameter estimates using a simulation study with three manipulated factors, including test length (20, 40, and 60 items), percentage of misfitting response patterns in the sample (10%, 20%, and 30%) and item parameter estimator (MML and BM). The person fit indices and HT were used to detect misfitting response patterns. The effect of misfitting response patterns on estimated item parameters and classification accuracy of students was assessed based on the comparison of results before and after removing misfitting response patterns detected by person fit indices.
Results of this study showed that the presence of misfitting response patterns created bias in both the b and a parameters at the item level, which in turn affected the classification of students, particularly high-performing students, into performance categories regardless of whether students with misfitting response patterns were present in the data or were removed using or HT. The results differed by test length and the percentage of students with misfitting response patterns.
The fact that item parameter estimates were affected due to the presence of misfitting response patterns is of great importance. The estimated item parameters are used for several purposes in educational and psychological settings, such as classification or test equating, and misestimated item parameters can lead to invalid conclusions. The results showed that the item discrimination parameter was more affected by the presence of misfitting response patterns compared to the item difficulty parameter under the same conditions. The presence of misfitting response patterns tended to underestimate the item discrimination parameter, which in turn decreases test information function, and consequently increases the standard error of measurement.
This result implies that if the difference between estimated item parameters before and after removing misfitting response patterns is considerable, then the test should be investigated by test developers and psychometricians for potential causes. The effect of misfitting response patterns should be considered at the item level, especially when it is suspected that the percentage of misfitting response patterns in the sample is high. If bias is found, then the students with misfitting response patterns should be removed from the data set using person fit indices. One good strategy for utilizing person fit indices for refining item parameter estimates could be employing an iterative process of removal. Only one round of removing misfitting response patterns was applied in this study. The process of removal of misfitting response patterns and re-estimation of item parameters can be continued until evidence of item parameter estimation stability is seen.
One concerning result from this study is that although the presence of misfitting responses affects the accuracy of item parameter estimate, the use of
and
HT to remove misfitting responses and then re-estimate item parameters did not lead to improved classification accuracy. Such outcome could be expected due to the limited power of existing person fit indices for detecting misfitting response patterns, as shown in
Table 2. When the detection power is not optimal only a few misfitting response patterns would be detected. Considering the possibility of flagging some fitting response patterns as false alarms, it would be hard to say that what percentage of flagged response patterns as misfitting are really misfitting response patterns. Therefore, removing flagged response patterns from the data set may not always improve the item parameter estimates. This suggests that without powerful statistical tools as the first step of person fit analysis, the potential value of person fit research in improving measurement practice is questionable. We need more efforts to design more powerful person fit statistics that could be used more efficiently in flagging misfitting responses so as to better understand and interpret students’ performance on tests.
Limitations
The findings of the present study are bounded by the factors and design considered. This restricts generalization of the findings to similar conditions. For example, in many testing conditions more than two categories are usually used (e.g., below basic, basic, proficient, excellent), but we only used two categories of performance resembling situations like Pass/Fail tests. Further, some of the conditions simulated may not be realistic. For example, it is unlikely that 30% of the students will produce misfitting response patterns or that 50% of items in a test will be susceptible to misfitting responses. Additionally, given the factors and associated levels considered in this study, any claim about the effect of factors on the estimation bias, standard error of estimation, and classification accuracy is limited to the design of this study.
It was assumed that the data fit the 2-PL IRT model across all simulation conditions. However, the assumption of data fit with the 2-PL IRT model may not be met, especially in the presence of misfitting response patterns in the data. Furthermore, simulation studies are based on some presumed assumptions that may not completely reflect the real-world situations and this study is not an exception. Thus, generalizability of results of this study to real-world conditions is constrained.


