Article

A Meta-Analysis of Graduate School Enrollment from Students in the Ronald E. McNair Post-Baccalaureate Program

by
Rachel Renbarger
1,* and
Alexander Beaujean
2
1
Educational Psychology, Baylor University, Waco, TX 76706, USA
2
Psychology and Neuroscience, Baylor University, Waco, TX 76706, USA
*
Author to whom correspondence should be addressed.
Educ. Sci. 2020, 10(1), 16; https://doi.org/10.3390/educsci10010016
Submission received: 11 November 2019 / Revised: 12 December 2019 / Accepted: 26 December 2019 / Published: 6 January 2020

Abstract

:
The Ronald E. McNair Post-Baccalaureate Achievement Program provides higher education institutions with federal funds to increase the doctoral attainment for students from disadvantaged backgrounds. We conducted a meta-analysis of the impact of the McNair program on graduate program enrollment. After an exhaustive literature search, we found 7 publications containing 13 studies that met the inclusion criteria. From these studies, we found that McNair program students were almost six times as likely to enroll in a graduate program as the comparison group. Nonetheless, there was much unexplained variability in effects across studies.

1. Introduction

Historically, graduate students in the United States have not been a diverse group of individuals, largely favoring those with privileged backgrounds [1,2,3,4,5]. As an illustration, 10.5% of White students aged 25 to 59 years earned a master’s degree or above compared to 5.2% of Black and 4.1% of Hispanic students [6]. There are also disparities by income group; 14% of individuals from the lowest income group have obtained a bachelor’s degree or above while 60% of students from high-income households have achieved this level of education [7]. This inequity in graduate education is problematic because individuals who could succeed in post-graduate work are denied access because they are not provided the “rules of the game” for graduate admission and matriculation [8], such as knowing how to apply to graduate schools [9]. Students from these groups may also face issues with finances [10] or differences in cultural norms [11,12,13] that can hinder their ability to enter or succeed in graduate school. Students from certain backgrounds, such as those from low-income or racial/ethnic minority households, are thus not represented in graduate programs in the United States, demonstrating inequity in graduate degree attainment.
There have been various attempts to remedy the lack of representation in graduate education, with one of the most well-known being the Ronald E. McNair Post-Baccalaureate Achievement Program. The program began in 1986 to honor McNair, one of the astronauts who died in the Challenger explosion [14]. The goal of the program is “to increase the attainment of Ph.D. degrees by students from underrepresented segments of society” (i.e., low-income, first-generation, and racial/ethnic minority backgrounds) [15].
There are multiple McNair Scholars Programs (MSPs) throughout the country, all of which are primarily funded through the U.S. Department of Education (DoE). While there are some activities that each MSP must include, there is also substantial freedom to implement the program in a way that aligns with the goals and resources of their particular institution. One of those freedoms is the evaluation of their program. Some programs choose to study the effectiveness of their activities while other just report the minimum necessary outcome information to the federal government (e.g., number of students who complete research/scholarly activities, earn baccalaureate or doctoral degrees) [6].
While the DoE reports aggregate data from the MSPs, these reports largely focus on process evaluation/program monitoring (i.e., how well the program is operating) [16]. What is lacking is a synthesis of outcome/impact evaluations—that is, studies of whether the MSPs are increasing the number of students from underrepresented backgrounds who succeed in graduate school.
Such a synthesis is needed for the McNair program because there is confusion about the program’s effects. For example, the National Academies selected the McNair program as a “promising intervention” for providing opportunities to support underrepresented students [17], and the Council for Opportunity in Education [18] reported that it has increased the odds of obtaining a doctoral degree for underserved students six-fold. On the other hand, a recent interview with a member of the Office of Management and Budget indicated that the administration did not have evidence for the program’s effectiveness [19]. This confusion has likely been part of the reason why the federal government has provided inconsistent funding for this program over the last 15 years [20,21], and the White House proposed to further decrease funding for the program in 2017 [18,22].
To date, there has not been a quantitative synthesis (i.e., meta-analysis) of the McNair program’s impact. Meta-analyses are important for understanding a program’s impact [16]. They provide a systematic method for organizing multiple studies and statistically synthesizing the results (i.e., average effects and effect variability). Consequently, the aim of this study was to conduct a meta-analysis of the MSP’s outcomes.

2. Overview of McNair Scholars Program

The MSP is a DoE outreach program that provides educational support and opportunities for underrepresented students (e.g., low-income, first-generation, racial or ethnic minority) [23]. To have an MSP, institutions apply for a grant in which they describe a plan on preparing admitted junior and senior undergraduate students for research-oriented doctoral programs. Each program has autonomy to determine how it implements their activities [6] although these activities include providing opportunities for research, internships, tutors, academic counseling, and faculty mentorship, along with preparing graduate school applications. Programs may also provide other educational and cultural seminars to help students gain a better understanding of what is required to succeed in graduate school.
To be admitted, students must come from a disadvantaged background as well as demonstrate high achievement, high motivation, and a desire to attain a doctoral degree. Disadvantaged background is defined as: (a) Coming from a low-income household (i.e., family income ≤ 150% of the federal poverty level); (b) being a first-generation college attendee; or (c) belonging to a racial/ethnic minority group [23]. At least two-thirds of these students must be both a first-generation student and come from low-income families.

2.1. Previous Research on Effectiveness of McNair Scholars Program

Past federal reports have indicated that 99% of MSPs had met or exceeded their program objectives (e.g., students obtained acceptance into graduate school, received funding for graduate school, graduated from graduate school) [23,24]. Outside of meeting mandated federal objectives, some have argued that MSPs are effective because they provide services to underserved populations [25,26]. More specifically, MSPs provide positive personal, social, and academic supports for those admitted to the program, which are crucial for success in both undergraduate and graduate programs [27,28,29].
Social and personal benefits. The MSP’s research requirements not only can aid in developing technical skills but can also provide students access to positive social environments. Students in MSPs reported that the McNair community was encouraging and confidence building [30,31,32], as well as gave them a chance to network with other professionals [33,34]. Moreover, students appreciated the McNair faculty/staff’s support [35,36,37] and mentorship [38,39]. In addition to providing advice on graduate school and career matters [33,40], working one on one with faculty taught students how to create positive relationships with other professionals in their discipline [34,35,41]. In other words, the MSP provided them with models for how to be successful in their field [33,42].
These social environments are important because they provide additional opportunities to learn [43]. For example, they help students form positive competency beliefs (i.e., self-efficacy) and expectations about the graduate school process [35,44] and skill development in a particular academic area [41,45,46]. In addition, it provides opportunities to form an academic identity [47,48,49] and help combat “imposter syndrome” (i.e., a belief that they do not belong in a graduate program) [35,44,50]. Such social learning is important because it is related to both academic achievement and persistence [51], and can also aid in helping others through leadership [32,44], becoming a role model [41], and advocating for other students [34].
Academic benefits. As the primary goal of the MSPs is academic preparation, it is not surprising that students in the program reported that it helped them with a variety of academic endeavors, such as tutoring, preparation for graduate school, and even completing their undergraduate requirements on time [33,52,53]. Because this program gives students the opportunity and encouragement to explore academic areas of interest, it can also strengthen their curiosity and motivation [34,54,55] and develop a variety of research interests [44].
All MSPs require students to complete and present a research project, a process that directly helps them develop skills to be successful in graduate school [34,35,37]. Because of the high expectations for the research requirement, students learn the research process (e.g., using libraries effectively, presenting research to different audiences, obtaining summer internships) [56,57,58]. In addition, it helps students learn the language and culture of the academy, which helps in both their approach to graduate applications and later in graduate work [31,35,44]. For many students, the knowledge that they have completed their own independent research provides them confidence that they can succeed in graduate school [30,34,37,54].
In addition to research activities, MSPs also have activities directly related to the process of applying to graduate programs [34,37,57]. The MSP application is similar to many graduate school applications, so this first step gives students an initial understanding of what is to come when they apply to graduate school [34,44]. Once students are in the program, many MSPs provide seminars about graduate school, graduate school visits, and GRE preparation [34,37].
Obstacles. While there is a body of research showing MSPs benefit students, other research has indicated that students face obstacles with participating in the program, which can contribute to unsuccessful outcomes. For example, not all MSPs offer specialized programs, give students enough time to adequately accomplish all of its objectives, or allow students to gain proper access to faculty within their discipline [59]. In addition, some programs have not adequately handled their students’ lack of financial stability or provided enough flexibility for students who have to fulfill the program’s requirements in addition to other existing responsibilities outside of the program [60,61]. Furthermore, even though many programs have provided a community and support, some students have reported still feeling isolated [44].
MSPs rely on faculty mentors, but students do not equally benefit from their mentor relationship. Not all faculty involved have had the skills needed to be effective mentors [38,39]. Moreover, some mentors have not been able to invite students into their own research because the students were either not fully prepared or the faculty member’s work was inaccessible to undergraduate students [62]. Thus, if the MSP does not have proper faculty recruitment and selection, some students involved in the program might not receive the quality mentorship and research skills that the program is designed to provide [60].

2.2. Current Study

While past research on the MSP has noted some social, personal, and academic gains for participants, these studies are not unanimous in indicating that the MSP is effective. Other research has indicated that MSP participants may not all have positive experiences or even derive benefit from their involvement. These discrepancies in the literature on the effectiveness of MSPs in helping students from low-income, first-generation, and racial or ethnic minority groups enroll in graduate school reveal the need to examine the collective evidence of this program.
The purpose of this study was to conduct a meta-analysis of the MSP. Although the program has multiple objectives, its primary goal is to “increase the attainment of Ph.D. degrees by students from underrepresented segments of society” [6]. Consequently, we focused on the relation between MSP participation and graduate school enrollment. The major hypothesis for this study was that MSPs will be positively related to graduate school enrollment, demonstrated by MSP participants enrolling in graduate school at higher rates than demographically similar peers who did not participate in an MSP. Given the autonomy in how MSPs operate and the offerings they provide, however, we expected there to be substantial variability (i.e., heterogeneity) in the size of the effect across studies.

3. Methods

3.1. Study Selection

To find information on the effects of MSPs, we searched the following databases: Academic Search Complete, American Doctoral Dissertations, Education Research Complete, E-Journals, ERIC, Humanities Source, MAS Ultra-School Edition, MasterFile Premier, PsycArticles, Psychology and Behavior Sciences Collection, PsycInfo, TOPICSearch, and Google Scholar. We used these terms in each search: “McNair,” “McNair program,” “McNair Scholars Program,” “McNair program effectiveness”, and “trio program”.
In addition to searching the databases, we also used supplementary methods to find possible sources. First, we examined the reference lists from found articles about MSPs for additional studies (i.e., snowball method). Second, we contacted the DoE and authors of studies with McNair samples. Third, we conducted an Internet search to see if MSP institutions had conducted evaluations and self-published them (i.e., posted them on their website, but not submitted them for peer-review).
From this initial search, we found 129 publications, published between 1994 to 2017. We kept publications if they met the following criteria: (a) Reported information specifically from MSP students, and (b) provided quantitative information about the total number of students in the MSP and the number of students who enrolled in graduate school. The DoE publishes annual reports on the number of students from each MSP that enroll in graduate school, but these reports do not include the total number of students in an MSP cohort. This precludes us from calculating the percentage enrolled in graduate school per MSP; we excluded these reports from this study.
Only 7 of the 129 publications (5%) met our inclusion criteria. These are listed in Table 1. A majority of publications were excluded because the authors used qualitative methods (k = 40, 31%), did not collect any empirical information (k = 17, 13%), measured something other than enrollment in graduate school (e.g., willingness to enroll in graduate school; k = 15, 12%), or grouped MSP students with students from similar groups (e.g., other campus research groups, minority scholars; k = 6, 5%).

3.2. Extracted Information

For all publications that met the inclusion criteria, we coded the following information: publication information (i.e., author, title, year), descriptive statistics on McNair samples and comparison groups, and possible moderators. Due to the inconsistency in information reported in the publications, we could only include one possible moderator: Type of sample used in the study (i.e., whether the study’s sample used students from multiple MSPs or a single institution’s MSP). For studies that compared the MSP to multiple groups (e.g., racial/ethnic minority groups, highly motivated juniors), we kept all group comparisons. All coding was completed by the first author, with any questions resolved with the second author as needed.
For publications that did not include a comparison group, we used data for racial/ethnic minority enrollment from the Integrated Postsecondary Enrollment Data System (IPEDS) [63] to provide comparison group enrollment rates. When the information was not available for racial/ethnic minority graduate enrollment for that year in IPEDS, we obtained graduate enrollment from the Statistical Abstract of the United States [64]. Information from these sources included total graduate enrollment and graduate enrollment for racial/ethnic minority groups.
Using the total and racial/ethnic minority graduate enrollment values, we calculated the percent of enrolled students who were a racial/ethnic minority. For studies that used multiple cohorts (e.g., 1997–1999), we calculated the average of the total enrollment and percent enrolled in graduate school to use for the comparison group. We acknowledge that belonging to a racial/ethnic minority group, alone, does fully map onto the criteria for inclusion in an MSP. Nonetheless, this information was available in all datasets while first-generation and low-income status were not.
Our outcome of interest is dichotomous, so our approach is akin to a logistic regression model. We converted the enrollment data to the odds ratio (OR) effect size (ES). The OR is often the best choice for ES when conducting a meta-analysis of binary data [65]. The OR was calculated as:
O R = p M S P   / ( 1 p M S P   ) p C / ( 1 p c ) ,
where pMSP is the proportion of MSP students enrolled in graduate school, pc is the proportion of the comparison group enrolled in graduate school, and 1 − p is the proportion not enrolled in graduate school. ORs > 1 indicate that the MSP students are more likely to enroll in graduate school than the comparison students.
ORs are not symmetrical (i.e., negative effects between 0.01 and 0.99 and positive effects between 1.01 and ∞). Consequently, we took the logarithm (log) of the ORs for all analyses. Taking the log of the OR makes negative effects have negative values, positive effects have positive values, and a lack of effect have a value close to zero.

3.3. Data Analysis

We approached the analysis from a model fitting perspective. That is, we fitted models representing different hypotheses and compared how well they fitted the data. The models we fitted were the (a) null model (i.e., no moderators), and (b) the type of MSP group as a moderator. In addition, as a check on the data quality, we also fitted a model with a variable indicating whether or not we created the comparison group. We did this to see if using our post-hoc comparison groups influenced the ES values. For all models, we used the Paule–Mandel (PM) [66] estimator. We used it because it does not require distributional assumptions, is efficient, and does well in estimating between-study variance [67].
To compare models, we used the corrected Akaike’s information criterion (AICc) and Bayesian information criterion (BIC). Both examine model complexity as well as how accurate the model can represent the data [68]. When comparing values across models, smaller values indicate better models. If the difference is minimal, however, the models are likely functionally equivalent.
For all analyses, we used random-effects models [69] as implemented by the metafor package [70] in the R statistical program [71]. Conceptually, these models assume the ESs are sampled from a universe of possible effects and randomly vary from study to study. This means there are two measures of variability: Variability within a sample (i.e., sampling error) and variability among the different samples (τ2) [72].
In addition to τ2, we calculated two measures of ES heterogeneity: Q and I2. The Q statistic is the weighted sum of squares and is used to determine if all studies share a common ES [65]. When moderators are in the model, Q can be partitioned into heterogeneity within groups (Qw) and between groups (QB). All the Q statistics follow a χ2 distribution under the null hypothesis. I2 is related to Q but is an estimate of the percent of ES variability due to variability in the population of studies [73].

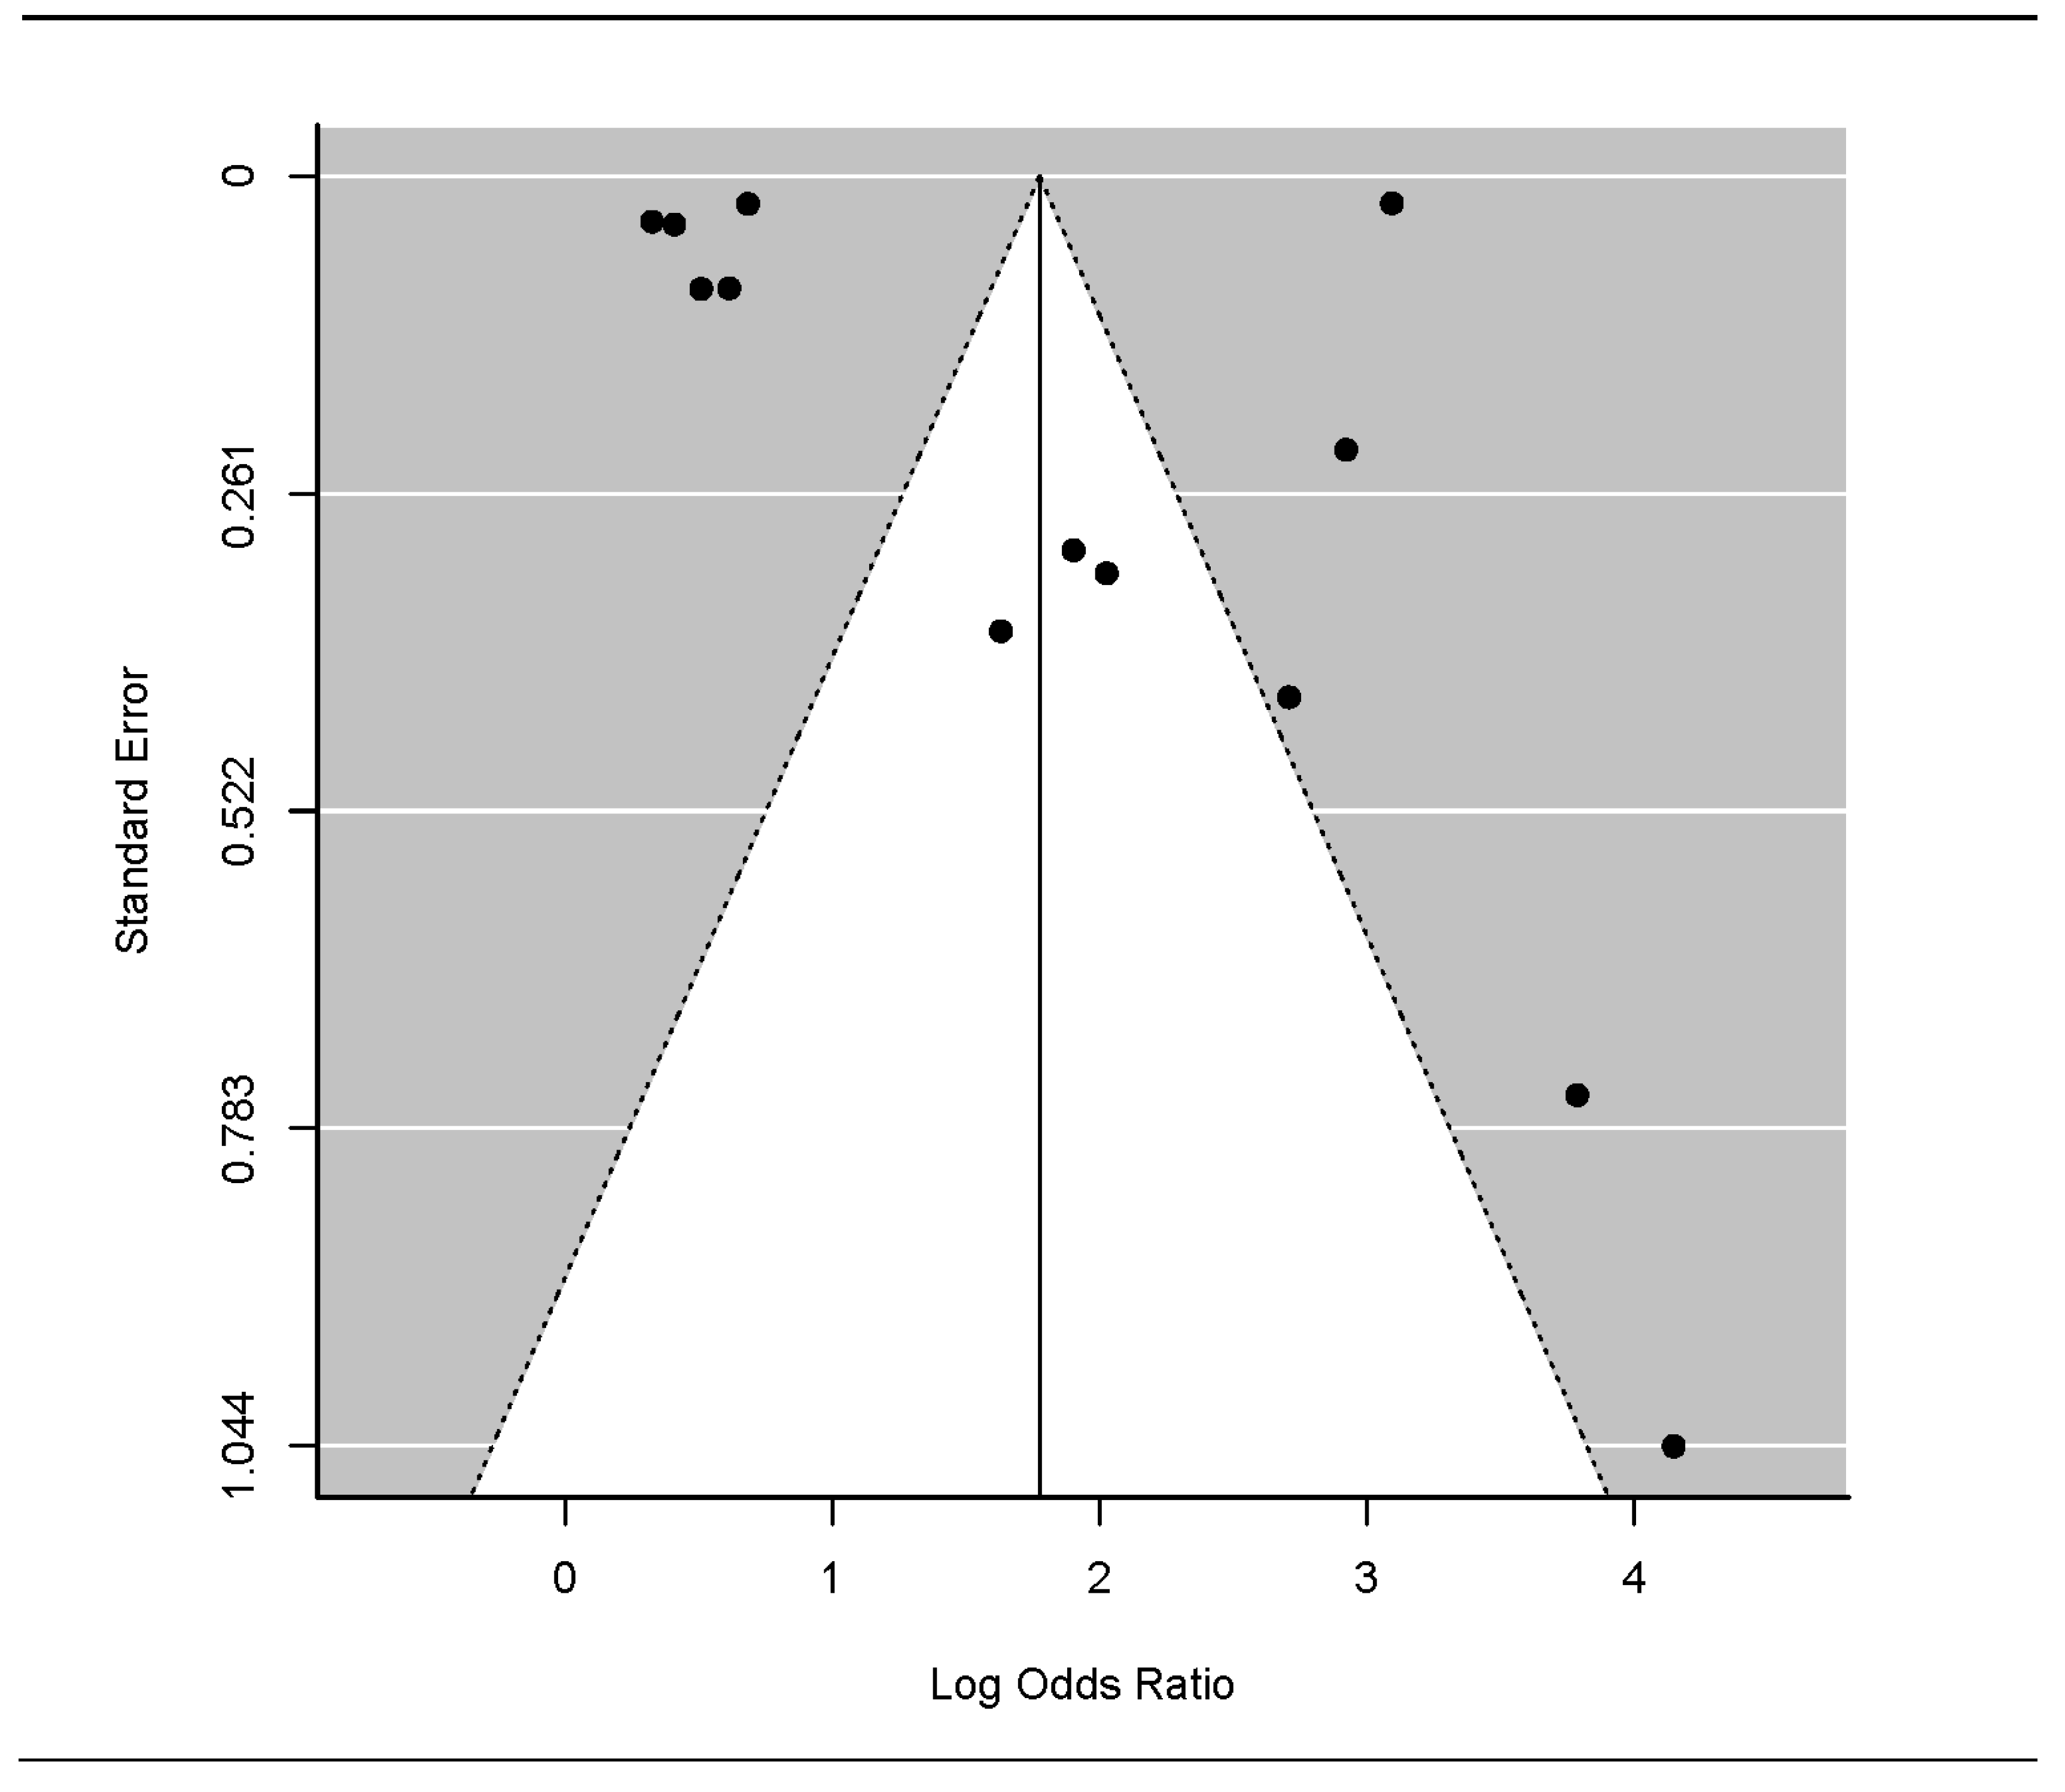
3.4. Publication Bias
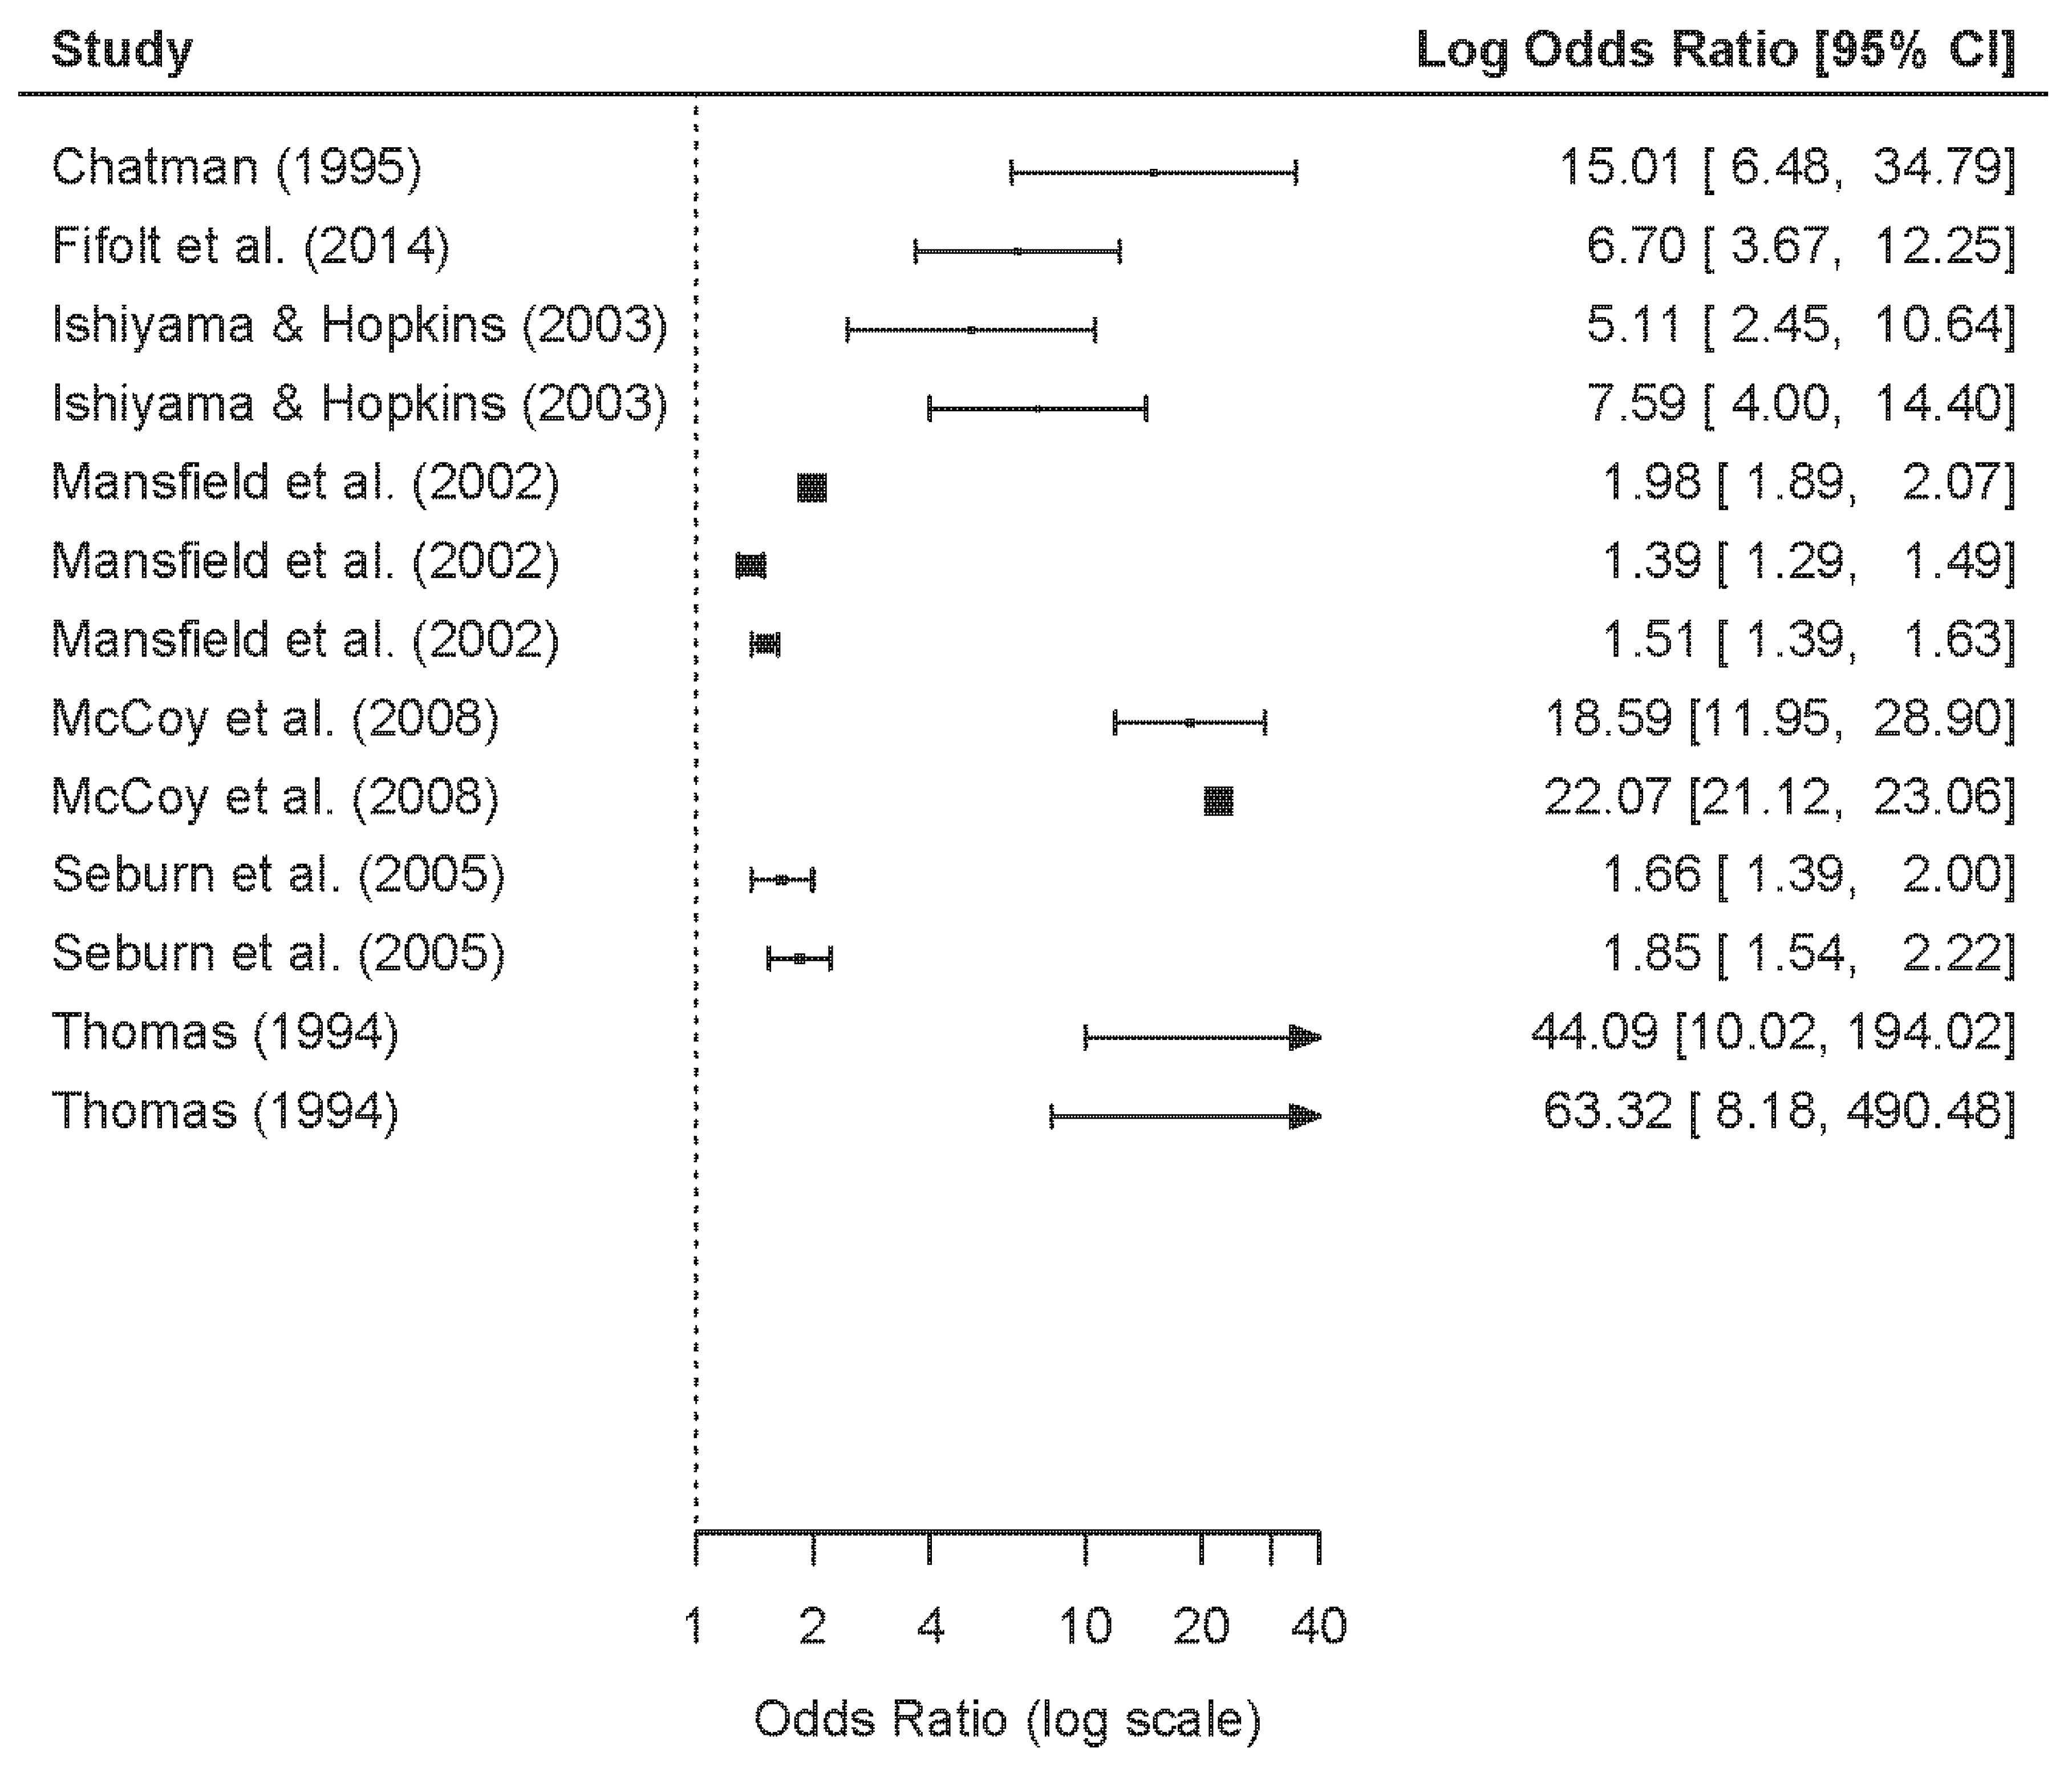
Meta-analyses can only be as accurate as the studies included. To examine the possible effects of missing studies (i.e., publication bias), we examined a funnel plot, the correlation between ES and standard error, and two fail-safe Ns. A funnel plot is a scatterplot of ESs against their standard errors. Studies with large ns have smaller standard errors so appear toward the top of the graph. The absence of publication bias tends to produce plots where ESs are distributed symmetrically about the mean effect size. Similarly, an absence of publication bias should produce an ES–standard error correlation close to zero. A fail-safe N is the number of studies in which the intervention ES was zero that would be needed to be added to the dataset to change the overall ES noticeably. We examined the number of studies we would have to add to reduce either (a) the average ES by half [74] or (b) reduce the significance level to 0.05 [75].

4. Results

4.1. Search Results

Some of the publications reported results from multiple cohorts or groups, which allowed for more than one effect size per publication in some instances. Of the 7 publications that fit the inclusion criteria, 5 had multiple cohorts or groups within, which thus resulted in a total of 13 studies and ESs. For example, the Mansfield publication [24] included results from three different cohorts which allowed for three calculations rather than one. These 13 studies and their results are detailed in Table 1 and Figure 1. Table 1 provides the ORs and sampling variances for each study, as well as sample sizes and values on potential moderators. Figure 1 contains a forest plot of the studies.
Some of the publications contained more than one study (i.e., multiple comparisons). There are a variety of ways to analyze the data when publications report ESs for multiple comparisons [76]. We chose to ignore possible ES dependency by treating each study within a publication independently. We chose this option for two reasons. First, two of the publications with multiple studies [24,34] used different samples for each comparison, so represented no overlap in student data from within the publications. Second, the comparisons that did have overlap in the data did so because they used different comparison groups, not different treatments. As a validity check, however, we did a separate analysis where we chose a single ES from a publication that reported the results from overlapping samples. For this analysis, we chose the study with the largest overall n. The studies we chose are indicated with an asterisk in Table 1.

4.2. Model Results

The model results are given in Table 2. For the unconditional (baseline) model, the average ES was 5.91 (95% CI: 2.93–11.87). Thus, on average, the odds of enrolling in graduate school were 5.91 times higher for students in an MSP than for students not in an MSP. Moreover, all the ORs were >1 (i.e., log OR > 0 in Figure 1), indicating that none of the MSPs in this study had an iatrogenic effect. Nonetheless, there was significant heterogeneity in the ESs (Q = 8303.90, df = 12, p < 0.01), however, indicating that the average ES was likely not a representative estimate of the of the MSP effects.
The model with the MSP type as a moderator showed a slightly better performance than the model with no moderators (i.e., lower AICc and BIC values), and QB indicated that the type of study explains some of the variability in graduate enrollment. That is, accounting for the type of MSP a study examined provided additional information to explain differences in MSP effects. The intercept of 3.37 indicates that, on average, the odds of enrolling in graduate school were 3.37 (95% CI: 1.52–7.47) times higher for MSP students in studies that examined multiple MSPs. The odds of attending graduate school increased 3.71 (95% CI: 1.07–12.95) times in studies that examined a single institution’s MSPs.
Nonetheless, the difference between models was functionally indistinguishable. The QW and τ 2 values were still large, indicating that the studies in either group did not share a common effect size and there was substantial unexplained heterogeneity in the model. The I2 value indicated that 99.76% of the observed variance reflected real differences in effect sizes; this was basically the same as the baseline model.
The model with the IPEDS classification moderator showed worse performance than both the baseline and MSP type models. Moreover, the QB indicated that this variable did not account for any additional variance in ESs. Thus, it appears that there was no functional difference in ESs for studies that included comparison data and those for which we used the IPEDS data.
When we reduced the data to only include studies with no overlap in the samples, the average ES was 6.18 (95% CI: 2.63–14.50). These results were functionally indistinguishable from the analysis using all the studies since the CI for the reduced sample fully envelops the CI for the full sample. Moreover, there was still significant heterogeneity in the ESs (Q = 8150.82, df = 9, p < 0.01), again indicating that the average ES was likely not a very representative estimate of the MSP effects. We did not report AICc and BIC values for the reduced data since those values should only be compared when the samples are the same [68].

4.3. Publication Bias

The funnel plot for the MSP studies is shown in Figure 2. While the top of the plot is somewhat symmetrical, there are few studies at the bottom. Moreover, there is a gap in the bottom left part of plot, where the “non-significant” studies would be if they existed and we could not locate them. The rank correlation between ES and the standard error was 0.41 (p = 0.06). Thus, it appears that publication bias may be present in our ES estimates.
The number of studies averaging no effect that we would have to add to our data to reduce the average ES by half is 13, while we would have to add 41,276 additional studies to reduce the significance level of the average effect to 0.05. Thus, is it likely that the McNair program is having a positive effect, but the size of the effect we estimated from the studies we analyzed is likely overly large.

5. Discussion

This meta-analytic study examined the impact of being a part of the Ronald E. McNair Post-baccalaureate Achievement Program (MSP) on graduate school enrollment. There were two hypotheses: (a) MSP participation would be positively related to graduate school enrollment, and (b) that there would be substantial variability in the effect sizes (ESs) between the studies. Our results supported both hypotheses. First, the average odds ratio was 5.92 (95% CI: 2.93–11.87), indicating that the odds of students in the program enrolling in graduate school were somewhere between approximately 3 to 12 times the odds for students from racial/ethnic minority groups who were in the comparison group. These results did not substantially change when we accounted for our creation of the comparison groups or when we removed studies that had overlapping samples.
Second, there was a large degree of heterogeneity in ESs across studies. This heterogeneity indicates that the effectiveness of MSPs to help low-income, first-generation, and students from racial or ethnic minority groups enroll in graduate school varies substantially by program. Due to the small number of publications we found that met the inclusion criteria, compounded with the non-systematic way in which the results were reported in those publications, we were not able to find any moderators that explained this variance. Thus, there is a need to better understand the features of MSPs that make some more successful than others in getting their students to apply and enroll in graduate programs.

5.1. Implications

The first major implication from the study is that the MSP is effective in aiding low-income, first-generation, or racial/ethnic minority students in attending graduate school. While we are uncertain at this time what the magnitude of this effect is, we are confident that it is positive. We say this for two reasons. First, the confidence interval around the odds ratio ES did not encompass one. Second, all the studies in our analysis had positive effects (i.e., students in the MSP were more likely to go to graduate school than students in the comparison group).
Second, the results from this study seem to contradict a statement by Director of the Office of Management and Budget that the MSP is only “6 percent effective” [19]. While we are unsure exactly what he meant by that statement, based on the director’s other remarks we believe he meant that only 6% of the students in an MSP go to graduate school because of the program. In our study, there were 17,096,668 students across all the comparison groups, and 2,681,501 (15.68%) of them went to graduate school. This can roughly be thought of as the base rate. There were 32,236 students across all MSP groups, of whom 14,908 (46.25%) went to graduate school. This 30% difference is more than twice the base rate. Thus, based on the data from our study, the MSP is more effective than is being represented by the White House’s current Office of Management and Budget.
Third, these results have some general educational implications. For policymakers who have a large part in designating money for federal programs, these results can support their decisions regarding the MSP in future funding cycles. For policymakers and stakeholders at regional or state levels, they can be confident in their decisions to support universities with large numbers of low-income, first-generation, or racial/ethnic minority student groups that apply for and maintain an MSP. Without advocating for clear and open data regarding program effectiveness, however, federal programs can be difficult to justify. Therefore, those involved can work to ensure that programs have the support and structure in place to enable outside evaluations of programs.

5.2. Limitations

Despite the positive effects shown for MSPs, the results from this study should be interpreted with caution. First, few MSPs conduct their own impact evaluations, or at least make the results of these studies publicly available. Thus, our study results may not generalize well to the over 180 MSPs currently in existence. This caution is buttressed by the publication bias we found in our results. Not only did our analysis not include any study with a null or negative effect, 128 of the 129 (99%) of the original publications we found reported positive aspects about MSPs. Thus, either the McNair program is almost universally effective, MSPs are not evaluating their impact, or studies that show no or negative effects (at least concerning graduate enrollment) are being stored in a lot of file drawers.
Second, the amount of unexplained variance between studies’ ESs prevents the formation of any strong conclusions about the true size of the McNair program’s effects. While it appears that MSPs have a positive effect on graduate school enrollment, we are not sure how large this effect is or what it is about the MSPs that results in the effect.
Finally, the causal nature of these results is indeterminant. MSP participants self-select into the program; there is no random assignment for students to receive the treatment of MSP support. Those who do not choose to participate, such as those in the comparison group, likely exhibit important differences, such as motivation to pursue a graduate degree.

5.3. Future Research

If nothing else, our meta-analysis highlights the need for more evaluations of the impact of the McNair program, and for those evaluations to be made publicly available. Although the program has been around since the late 1980s, we could only find seven studies that reported information about graduate school enrollment, and only a fraction of those were actually impact evaluations.
Second, future studies need to include as much information as possible about the program enrollees and any comparisons groups. Although the McNair program is designed for low-income, first-generation, and/or racial/ethnic minority students, such information was not available from national databases. So, unless a study included a comparison group in its report, we could only compare MSP students to national data on graduate enrollment for racial minority students only. As such, we cannot tell for whom MSPs are having an effect. Previous MSP research has indicated that students from racial/ethnic minority groups enroll in graduate school at higher rates than low-income and first-generation students [23], so future studies need to examine if MSPs are more effective for some of its constituents than others.
Third, future research needs to examine outcomes in addition to graduate enrollment. While this outcome needs to be studied, it is not the same as completing a Ph.D. program. Thus, future impact studies would do well to include information about attaining a Ph.D., as well as other ancillary outcomes (e.g., bachelor’s degree completion, completion of any graduate program). Related to outcome variables, the studies should report more information about the characteristics of students (e.g., major, number of semesters in program) and MSPs (i.e., years since grant began, number of research projects students complete). Such information could help to better understand the some of the variability in effects between programs.

6. Conclusions

The results from this meta-analysis suggest that MSPs seem to aid in increasing the odds that traditionally disadvantaged students will enroll in graduate school. Nonetheless, the degree to which these programs succeed vary. More research is needed to examine what causes differences in not only graduate school enrollment but other outcomes (i.e., graduate degree attainment) of interest.

Author Contributions

R.R. conceived of the project and collected the data. Both R.R. and A.B. contributed to data analyses and writing of the manuscript. All authors have read and agreed to the published version of the manuscript.

Funding

This research received no external funding.

Conflicts of Interest

The authors declare no conflict of interest.

References

  1. Baum, S.; Steele, P. Who Goes to Graduate School and Who Succeeds? Access Group: Washington, DC, USA, 2017. [Google Scholar]
  2. Mullen, A.; Goyette, K.; Soares, J. Who goes to graduate school? Social and academic correlates of educational continuation after college. Sociol. Educ. 2003, 76, 143–169. [Google Scholar] [CrossRef] [Green Version]
  3. National Science Foundation. Doctorate Recipients from U.S. Universities: 2015; NSF Publication No. 17-306; National Science Foundation: Washington, DC, USA, 2017.
  4. Okahana, H.; Feaster, K.; Allum, J. Graduate Enrollment and Degrees: 2005 to 2015; Council of Graduate Schools: Washington, DC, USA, 2016. [Google Scholar]
  5. Sowell, R.; Allum, J.; Okahana, H. Doctoral Initiative on Minority Attrition and Completion; Council of Graduate Schools: Washington, DC, USA, 2015. [Google Scholar]
  6. U. S. Department of Education. The Condition of Education 2017; NCES 2017-144; National Center for Education Statistics: Washington, DC, USA, 2017.
  7. U. S. Department of Education. The Condition of Education 2015; NCES 2015-144; National Center for Education Statistics: Washington, DC, USA, 2015.
  8. Lord, C.G. A guide to PhD graduate school: How they keep score in the big leagues. In The Complete Academic: A Career Guide; Darley, J.M., Zanna, M.P., Roediger, H.L., III, Eds.; American Psychological Association: Washington, DC, USA, 2004; pp. 3–15. [Google Scholar]
  9. Ramirez, E. “No one taught me the steps”: Latinos’ experiences applying to graduate school. J. Lat. Educ. 2011, 10, 204–222. [Google Scholar] [CrossRef]
  10. Gardner, S.K.; Holley, K.A. “Those invisible barriers are real”: The progression of first-generation students through doctoral education. Equity Excell. Educ. 2011, 44, 77–92. [Google Scholar] [CrossRef]
  11. Holley, K.A.; Gardner, S. Navigating the pipeline: How socio-cultural influences impact first-generation doctoral students. J. Divers. High. Educ. 2012, 5, 112. [Google Scholar] [CrossRef]
  12. Jury, M.; Smeding, A.; Stephens, N.M.; Nelson, J.E.; Aelenei, C.; Darnon, C. The experience of low-SES students in higher education: Psychological barriers to success and interventions to reduce social-class inequality. J. Soc. Issues 2017, 73, 23–41. [Google Scholar] [CrossRef] [Green Version]
  13. Ramirez, E. Examining Latinos/as’ graduate school choice process: An intersectionality perspective. J. Hisp. High. Educ. 2013, 12, 23–36. [Google Scholar] [CrossRef]
  14. Dervarics, C. McNair/Harris: Two programs that live up to their namesakes. Black Issues High. Educ. 1994, 11, 26. [Google Scholar]
  15. U. S. Department of Education. Ronald E. McNair Postbaccalaureate Achievement Program. Available online: https://www2.ed.gov/programs/triomcnair/index.html (accessed on 20 September 2018).
  16. Rossi, P.H.; Lipsey, M.W.; Freeman, H.E. Evaluation: A Systematic Approach, 7th ed.; Sage: Thousand Oaks, CA, USA, 2004. [Google Scholar]
  17. National Academy of Sciences, National Academy of Engineering, Institute of Medicine. Expanding Underrepresented Minority Participation: America’s Science and Technology Talent at the Crossroads; The National Academies Press: Washington, DC, USA, 2011. [Google Scholar]
  18. Council for Opportunity in Education. COE statement on White House Proposal to Eliminate Ronald E. McNair Postbaccalaureate Achievement and Education Opportunity Centers TRIO Programs [Press Release]. 2017. Available online: http://www.coenet.org/press_releases_052317.shtml (accessed on 16 March 2017).
  19. U.S. Office of the Press Secretary. Off-Camera Briefing of the FY18 Budget by Office of Management and Budget Director Mick Mulvaney. Available online: https://www.whitehouse.gov/briefings-statements/off-camera-briefing-fy18-budget-office-management-budget-director-mick-mulvaney-052217/ (accessed on 22 May 2017).
  20. Abdul-Alim, J. Obama administration official touts’ critical role’ of TRIO amid funding cuts. Divers. Issues High. Educ. 2012, 29, 7. [Google Scholar]
  21. Jean, R. Bootstraps: Federal TRIO programs, if funded, could help close income gap. N. Engl. J. High. Educ. 2011. Available online: http://www.nebhe.org/thejournal/bootstraps-federal-trio-programs-if-funded-could-help-close-income-gap/ (accessed on 19 April 2017).
  22. Basken, P. What Trump’s budget outline would mean for higher Ed. Chron. High. Educ. Available online: https://www.chronicle.com/article/What-Trump-s-Budget-Outline/239511 (accessed on 16 March 2017).
  23. Seburn, M.; Chan, T.; Kirshstein, R. A Profile of the Ronald E. McNair Postbaccalaureate Achievement Program: 1997–1998 through 2001–2002; U.S. Department of Education: Washington, DC, USA, 2005. Available online: https://www2.ed.gov/programs/triomcnair/mcnairprofile1997-2002.pdf (accessed on 19 April 2017).
  24. Mansfield, W.; Sargent, K.D.; Cahalan, M.W.; Belle, R.L., Jr.; Bergeron, F. A Profile of the Ronald E. McNair Post-Baccalaureate Achievement Program: 1998–99 with Selected Data from 1997–98 and 1996–97; Mathematica Policy Research: Washington, DC, USA, 2002; Available online: https://ideas.repec.org/p/mpr/mprres/fd1c5b2f63fd437cae85f7382136959b.html (accessed on 19 April 2017).
  25. Kniffin, K.M. Accessibility to the PhD and professoriate for first-generation college graduates: Review and implications for students, faculty, and campus policies. Am. Acad. 2007, 3, 49–79. [Google Scholar]
  26. Parker, K.D. Achieving diversity in graduate education: Impact of the Ronald E. McNair Postbaccalaureate Achievement Program. Negro Educ. Rev. 2003, 54, 47–50. [Google Scholar]
  27. Ethington, C.A.; Smart, J.C. Persistence to graduate education. Res. High. Educ. 1986, 24, 287–303. [Google Scholar] [CrossRef]
  28. King, S.E.; Chepyator-Thomson, J.R. Factors affecting the enrollment and persistence of African-American doctoral students. Phys. Educ. 1996, 53, 170–180. [Google Scholar]
  29. Ong, M.; Wright, C.; Espinosa, L.; Orfield, G. Inside the double bind: A synthesis of empirical research on undergraduate and graduate women of color in science, technology, engineering, and mathematics. Harv. Educ. Rev. 2011, 81, 172–209. [Google Scholar] [CrossRef] [Green Version]
  30. Gittens, C.B. The McNair program as a socializing influence on doctoral degree attainment. Peabody J. Educ. 2014, 89, 368–379. [Google Scholar] [CrossRef]
  31. Huerta, A.L. First-Generation College Students and Undergraduate Research: Narrative Inquiry into the University of Arizona’s Ronald E. McNair Achievement Program and the Phenomenon of Student Transformation. Ph.D. Thesis, University of Arizona, Tucson, AZ, USA, 2013. [Google Scholar]
  32. Posselt, J.R.; Black, K.R. Developing the research identities and aspirations of first-generation college students. Int. J. Res. Dev. Leeds 2012, 3, 26–48. [Google Scholar] [CrossRef]
  33. Fifolt, M.; Engler, J.; Abbott, G. Bridging STEM professions for McNair Scholars through faculty mentoring and academic preparation. Coll. Univ. 2014, 89, 24–33. [Google Scholar]
  34. Thomas, E.P. Taking the First Steps toward Graduate Education: A Report on the Ronald E. McNair Postbaccalaureate Achievement Program; OCLC: New Brunswick, NJ, Canada, 1994. [Google Scholar]
  35. Baness King, D. Journey to the doctorate: Motivating factors for persistence and completion of doctoral programs among McNair scholars. Ph.D. Thesis, University of New Mexico, Albuquerque, NM, USA, 2011. [Google Scholar]
  36. Exstrom, B.K. A Case Study of McNair Program Participant Experiences. Ph.D. Thesis, University of Nebraska, Lincoln, NE, USA, 2003. [Google Scholar]
  37. Gallagher Trayhan, E.K. Sources of Resilience of Female Mexican American College Students Enrolled in the McNair Scholars Program. Ph.D. Thesis, Our Lady of the Lake University, San Antonio, TX, USA, 2010. Available from ProQuest Dissertations and Theses database. (UMI No. 3421741). [Google Scholar]
  38. Carrera, S.R. An Evaluation of the Mentoring Component in the Ronald E. McNair Post-Baccalaureate Achievement Program: A national Sample. Ph.D. Thesis, Texas Tech University, Lubbock, TX, USA, 2002. [Google Scholar]
  39. Wyre, D. Set Up for Success: An Examination of the Ronald E. McNair Postbaccalaureate Achievement Program’s Mentoring Component. Ph.D. Thesis, University of Southern Mississippi, Hattiesburg, MS, USA, 2011. [Google Scholar]
  40. Lewis, N. Developing and Testing a Model to Predict Underrepresented Students’ Plans for Graduate Study: Analysis of the 1988–2006 Cohorts of a Summer Research Program. Ph.D. Thesis, The University of North Carolina at Chapel Hill, Chapel Hill, NC, USA, 2007. Available from ProQuest Dissertations and Theses database. (UMI No. 3257547). [Google Scholar]
  41. Willison, S.; Gibson, E. Graduate school learning curves: McNair Scholars’ postbaccalaureate transitions. Equity Excell. Educ. 2011, 44, 153–168. [Google Scholar] [CrossRef]
  42. Derk, A. Highlighting Hope: An Exploration of the Experiences of West Virginia University McNair Scholars. Ph.D. Thesis, West Virginia University, Morgantown, WV, USA, 2007. Available from ProQuest Dissertations and Theses database. (UMI No. 3298546). [Google Scholar]
  43. Schunk, D.H. Social cognitive theory. In APA Educational Psychology Handbook, Vol 1: Theories, Constructs, and Critical Issues; Harris, K.R., Graham, S., Urdan, T., McCormick, C.B., Sinatra, G.M., Sweller, J., Eds.; American Psychological Association: Washington, DC, USA, 2012; pp. 101–123. [Google Scholar]
  44. Restad, C. Beyond the McNair Program: A Comparative Study of McNair Scholars’ Understandings of the Impacts of Program Participation on Their Graduate School Experiences. Master’s Thesis, Portland State University, Portland, OR, USA, 2014. [Google Scholar]
  45. Beal, R.Y. “You mean they’ll pay me to think?” How low income, first generation and underrepresented minority McNair students construct an academic identity as scholar. Ph.D. Thesis, University of Colorado at Boulder, Boulder, CO, USA, 2007. [Google Scholar]
  46. Simpson, M.T. Exploring the Academic and Social Transititon Experiences of Ethnic Minority Graduate Students. Ph.D. Thesis, Virginia Tech, Blacksburg, VA, USA, 2003. [Google Scholar]
  47. Farro, S.A. Achievements and Challenges of Undergraduates in Science, Technology, Engineering, and Mathematics Fields in the Ronald E. McNair Program. Ph.D. Thesis, Colorado State University, Fort Collins, CO, USA, 2009. Available from ProQuest Dissertations and Theses database. (UMI No. 3385152). [Google Scholar]
  48. Keopuhiwa, T. Under the Surface: An Examination of Voice, Space, and Identity in West Virginia University McNair Scholars. Ph.D. Thesis, West Virginia University, Morgantown, WV, USA, 2012. Available from ProQuest Dissertations and Theses database. (UMI No. 3530314). [Google Scholar]
  49. Olivas, B. Supporting First-Generation Writers in the Composition Classroom: Exploring the Practices of the Boise State University McNair Scholars Program. Ph.D. Thesis, University of Nebraska, Lincoln, NE, USA, 2016. [Google Scholar]
  50. Williams, E.G. Academic, Research, and Social Self-Efficacy among African American Pre-McNair Scholar Participants and African American Post-McNair Scholar Participants. Ph.D. Thesis, Virginia Tech, Blacksburg, VA, USA, 2004. [Google Scholar]
  51. Brown, S.D.; Tramayne, S.; Hoxha, D.; Telander, K.; Fan, X.; Lent, R.W. Social cognitive predictors of college students’ academic performance and persistence: A meta-analytic path analysis. J. Vocat. Behav. 2008, 72, 298–308. [Google Scholar] [CrossRef]
  52. Ford, L. A Phenomenological Study Exploring the Undergraduate McNair Program Experience of Program Alumni Currently Serving as College Faculty. Ph.D. Thesis, Loyola University, Chicago, IL, USA, 2011. [Google Scholar]
  53. Ishiyama, J.T.; Hopkins, V.M. Assessing the impact of the McNair Program on students at a public liberal arts university. Oppor. Outlook 2001, 20, 20–24. [Google Scholar]
  54. Graham, L. Learning a new world: Reflections on being a first-generation college student and the influence of TRIO programs. New Dir. Teach. Learn. 2011, 2011, 33–38. [Google Scholar] [CrossRef]
  55. Olive, T. Desire for higher education in first-generation Hispanic college students. Int. J. Interdiscip. Soc. Sci. 2010, 5, 377–389. [Google Scholar] [CrossRef]
  56. Love, E. A simple step: Integrating library reference and instruction into previously established academic programs for minority students. Ref. Libr. 2009, 50, 4–13. [Google Scholar] [CrossRef]
  57. Nnadozie, E.; Ishiyama, J.; Chon, J. Undergraduate research internships and graduate school success. J. Coll. Stud. Dev. 2001, 42, 145. [Google Scholar]
  58. Scripa, A.J.; Lener, E.F.; Gittens, C.B.; Stovall, C. The McNair Scholars Program at Virginia Tech: A unique model of librarian mentoring. Va. Libr. 2012, 58. Available online: https://ejournals.lib.vt.edu/valib/article/view/1224/1624 (accessed on 19 April 2017). [CrossRef]
  59. Cruz, I. Reimagining the Ronald E. McNair Scholars Program through the lens of intellectual entrepreneurship. Plan. High. Educ. 2015, 43, 33–39. [Google Scholar]
  60. Greene, K. Alumni Perceptions of the McNair Scholars Program at Kansas Universities. Ph.D. Thesis, Kansas State University, Manhattan, KS, USA, 2007. Available from ProQuest Dissertations and Theses database. (UMI No. 3274485). [Google Scholar]
  61. Smell, A. McNair Scholars: Overcoming the obstacles of underrepresented students. Ursidae Undergrad. Res. J. Univ. North. Colo. 2015, 5, 19. Available online: https://digscholarship.unco.edu/urj/vol5/iss1/19/ (accessed on 1 March 2017).
  62. Grimmett, M.A.S.; Bliss, J.R. Assessing federal TRIO McNair program participants’ expectations and satisfaction with projects. J. Negro Educ. 1998, 67, 404–415. [Google Scholar] [CrossRef]
  63. National Center for Educational Statistics. Integrated Postsecondary Education Data System. [Data File]. Available online: https://nces.ed.gov/ipeds/ (accessed on 1 May 2017).
  64. U. S. Census Bureau. Statistical Abstract of the United States, 119th ed.; U. S. Census Bureau: Suitland, MD, USA, 1999. Available online: https://www.census.gov/library/publications/1999/compendia/statab/119ed.html (accessed on 20 April 2017).
  65. Borenstein, M.; Hedges, L.V.; Higgins, J.P.T.; Rothstein, H.R. Introduction to Meta-Analysis; Wiley: Hoboken, NJ, USA, 2009. [Google Scholar]
  66. Paule, R.C.; Mandel, J. Consensus values and weighting factors. J. Res. Natl. Bur. Stand. 1982, 87, 377–385. [Google Scholar] [CrossRef]
  67. Veroniki, A.A.; Jackson, D.; Viechtbauer, W.; Bender, R.; Bowden, J.; Knapp, G.; Salanti, G. Methods to estimate the between-study variance and its uncertainty in meta-analysis. Res. Synth. Methods 2016, 7, 55–79. [Google Scholar] [CrossRef] [PubMed] [Green Version]
  68. Burnham, K.P.; Anderson, D.R. Multimodel inference: Understanding AIC and BIC in model selection. Sociol. Methods Res. 2004, 33, 261–304. [Google Scholar] [CrossRef]
  69. Stijnen, T.; Hamza, T.H.; Özdemir, P. Random effects meta-analysis of event outcome in the framework of the generalized linear mixed model with applications in sparse data. Stat. Med. 2010, 29, 3046–3067. [Google Scholar] [CrossRef] [PubMed]
  70. Viechtbauer, W. Conducting meta-analyses in R with the metafor package. J. Stat. Softw. 2010, 36, 1–48. Available online: https://www.jstatsoft.org/article/view/v036i03 (accessed on 20 April 2017). [CrossRef] [Green Version]
  71. R Core Team. R: A Language and Environment for Statistical Computing; R Foundation for Statistical Computing: Vienna, Austria, 2018; Available online: https://www.R-project.org/ (accessed on 1 May 2017).
  72. Hedges, L.V. Meta-analysis. J. Educ. Stat. 1992, 17, 279–296. [Google Scholar] [CrossRef]
  73. Higgins, J.P.T.; Thompson, S.G. Quantifying heterogeneity in a meta-analysis. Stat. Med. 2002, 21, 1539–1558. [Google Scholar] [CrossRef] [PubMed]
  74. Orwin, R.G. A fail-safe N for effect size in meta-analysis. J. Educ. Stat. 1983, 8, 157–159. [Google Scholar] [CrossRef]
  75. Rosenberg, M.S. The file-drawer problem revisited: A general weighted method for calculating fail-safe numbers in meta-analysis. Evolution 2005, 59, 464–468. [Google Scholar] [CrossRef]
  76. Borenstein, M.; Hedges, L.V.; Higgins, J.P.T.; Rothstein, H.R. A basic introduction to fixed-effect and random-effects models for meta-analysis. Res. Synth. Methods 2010, 1, 97–111. [Google Scholar] [CrossRef]
Figure 1. Forest plot for studies in the meta-analysis. Log odds ratios are represented by a square, with the area of the square representing the study’s sample size. Bands from each square indicate the 95% confidence interval. Log odds ratio values > 0 (as seen in all 13 studies) indicate the McNair program students had a higher rate of graduate school enrollment than the comparison group. Studies are listed alphabetical by author last name.
Education 10 00016 g001
Figure 2. Funnel plot for the 13 included studies. The X-axis indicates the ES for the study and the Y-axis indicates the standard error, a function of the sample size. An asymmetrical funnel plot may indicate publication bias.
Education 10 00016 g002
Table 1. Odds ratios, sampling variances, and moderator values for studies in the meta-analysis.
StudyOdds RatioSampling VarianceMcNair TypeCreated ComparisonnMcNairncomparison
Chatman (1995)15.011.20SingleYes251,668,700
Fifolt, Engler, and Abbott (2014)6.711.10SingleYes472,607,801
Ishiyama & Hopkins (2001)
First-generation, low-income, ambitious, and high academic ability5.081.15SingleYes47118
First-generation and low-income *7.601.11SingleYes47399
Mansfield et al. (2002)
Finished McNair in 19991.981.00MultipleYes90901,743,411
Finished McNair in 1998 1.391.00MultipleYes41401,720,320
Finished McNair in 1997 1.511.00MultipleYes36181,706,661
McCoy, Wilkinson, and Jackson (2008)
McNair 89–93 cohorts18.581.05MultipleNo1001,679,162
McNair 89–00 cohorts *22.071.00MultipleNo12,5301,742,196
Seburn, Chan, and Kirshstein (2005)
Nationally representative sample1.661.01MultipleNo1282118,000
Demographically similar sample * 1.841.01MultipleNo1282700,000
Thomas (1994)
McNair at Rutgers, 199346.201.81SingleYes881,688,400
McNair at Rutgers, 199458.212.77SingleYes911,721,500
Note. Created Comparison: Whether or not we used the Integrated Postsecondary Enrollment Data System or Statistical Abstract of the United States to form a comparison group. *: study used in.
Table 2. Model comparisons.
Modelka (SE)b (SE)AICcBICτ 2 (SE)QB (df)QW (df)I2
All Studies
Baseline135.91 (1.43)47.7347.661.51 (0.67)99.80
Single MSP133.37 (1.50)3.71 (1.89)46.9245.951.15 (0.54)4.24 (1)8288.12 (11)99.76
Created Comp.135.93 (1.92)1.01 (2.21)51.3950.421.67 (0.77)<0.01 (1)1521.86 (11)99.72
Studies with Non-Overlapping Samples
Baseline106.18 (1.55)1.73 (0.89)99.86
Note. k: number of studies; a: Intercept parameter estimate; b: slope; SE: standard error AICc: Akaike’s Information Criterion (corrected); BIC: Bayesian Information Criterion; τ2: effect variability; Qw: heterogeneity within groups; QB: heterogeneity between groups df: degrees of freedom; I2: % of variability in effect sizes attributed to study variation.

