Article

The Effects of the Strategy and Goal on Business Performance as Mediated by Management Accounting Systems

by
Nimnual Visedsun
and
Kanitsorn Terdpaopong
*
Faculty of Accountancy, Rangsit University, Pathum Thani 12000, Thailand
*
Author to whom correspondence should be addressed.
Economies 2021, 9(4), 149; https://doi.org/10.3390/economies9040149
Submission received: 29 June 2021 / Revised: 16 September 2021 / Accepted: 24 September 2021 / Published: 11 October 2021
(This article belongs to the Special Issue Determinants of Firm Performance in Developing Countries)

Abstract

:
Previous research in the literature often investigated the associations between management accounting systems and the success of organizations. However, little has been done in regard to the association of business strategies, goals, and firms’ performance while having management accounting tools as mediators. Management accounting systems are classified as traditional and strategic management accounting themes. Each theme, of course, implements different accounting tools. This article explores the degree to which, as mediated by management accounting systems, the business strategies and business goals of large Thai manufacturing companies influence their financial and non-financial performance. To gather the data, a survey questionnaire was developed. Of the 1500 companies selected for inclusion in the survey, 205 provided completed and usable responses for a response rate of 13.67%. Structural equation modeling (SEM) was used to analyze the relationships among the variables. The findings shed some light on what the management of a firm could expect concerning organizational performance from their business strategies, business goals, and the implementation of specific management accounting systems. Corporate strategies and corporate goals had a statistical influence on both the financial and non-financial performance of the large corporations in Thailand when mediated via strategic management accounting systems, while there was no influence when mediated by traditional management accounting systems. A greater understanding of the relationships and effects of which mediators should have been employed in organizations to bring forth business strategies and business goals and generate productive results for organizational performance is provided by this research. Choosing the appropriate performance mediators can help achieve corporate strategies and goals.

1. Introduction

Businesses reap a range of advantages by adopting financial and non-financial initiatives in their organizations. In evaluating a company’s efficiency, financial indicators are normally used, while some non-financial metrics, including customer loyalty and employee satisfaction, need to be weighed and cannot be ignored. The organizational climate, such as leadership, culture, and organizational structure, can affect an organization’s success, and it is necessary to consider its impact (Odongo et al. 2019). The primary explanation of why companies are paying attention to non-financial metrics is that metrics enable firms to measure their productivity and success from a different perspective. As Kaplan and Norton (1996) suggested, the measurements of intangible asset strength are more predictive indicators of potential financial success than historical accounting statistics.
Strong performance is an important element in determining a company’s success or failure (Ittner and Larcker 1998, 2002). Accounting tools implemented by a company can potentially indicate the strategic focus of a company and help a company to achieve their business goals. Firms with dissimilar competitive environments may employ different management accounting tools. For example, firms in a slow or less competitive environment are likely to use a different set of management accounting tools than firms in a global or highly competitive environment. However, firms undergoing rapid technological changes may require a more sophisticated management set of accounting tools. New management accounting tools have been designed to link a firm’s operations to its business strategies and goals. Among these new tools are the following: the just-in-time inventory method, activity-based costing, total quality management, activity-based management, the balanced scorecard, benchmarking, re-engineering methods, and non-financial measurements of customer satisfaction. Such tools are employed in large, innovative firms which are located in highly competitive environments.
Several researchers have investigated the efficacy of various management accounting tools in general. The following papers have focused on financial accounting tools: Abdel-Kader and Luther (2008), Abdel-Kader (2011), Banker et al. (2000), Chenhall and Langfield-Smith (1998a, 1998b), Chow et al. (1988), Drury et al. (1993), Drury and Tayles (1994), Hopper et al. (1999), Phadoongsitthi (2003, 2005), Scarbrough et al. (1991), Wu et al. (2007), and Yoshikawa et al. (1994). A similar number of papers have studied non-financial performance (NFP) tools. These include the works of Banker et al. (2004), Berraies and Hamoud (2018), Dotson and Allenby (2010), Wegmann and Poincelot (2012), Lukason et al. (2019), Melián-González et al. (2015), Musi et al. (2018), Silveira (2019), Simon and Gómez (2014), Towler et al. (2011), and Watkins (2000). The findings from those papers present contradictory evidence. However, this may be as a result of employing different factors in their research. The different factors are, for example, different firm sizes, different sectors, different variables used, or different statistical methods employed in analyzing the data. Some research supported the theory that management accounting tools influence firm performance, whereas others had mixed findings.
The vast majority of research has investigated the associations between management accounting tools and the success of organizations. The research has shown a range of successful outcomes with the various management methods used. Though some of the other research works explored the relationship between business strategies and efficiency, none did so simultaneously. A discrepancy exists in the previous research on the relationships between the independent variables (business strategies and business goals) and the dependent variables (financial performance (FP) and non-financial performance (NFP)), with management accounting systems as the mediators.

2. Literature Review and Research Hypotheses

Both firms and entrepreneurs select business strategies that enforce which activities satisfy the goals of the company. Business strategies are concerned with how a company plans to operate their business under some strategies, typically concerning clients, staff, markets, and rivals. Miles and Snow (1978, 1984) defined various forms of market tactics, broken down into whether they were a “defender”, a “prospector”, or an “analyst”. Many studies have discussed Porter (1985), distinction (Schuler and Jackson 1987), or even cost leaders and differentiation (Schuler and Jackson 1987). Porter’s generic strategy approach has been the most commonly adopted approach in manufacturing and trading industries (Allen and Helms 2006; Beaumont 1993; Dowling and Schuler 1990; Huang 2001) or in a service industry such as the healthcare business (e.g., Hlavacka et al. 2001; Kumar et al. 1997; Lamont et al. 1993) or the hotel industry (e.g., Jogaratnam and Ching-Yick 2006; Tavitiyaman et al. 2011). It incorporates various trends and a combination of the competitive advantage, investment strategies, and competitive positioning objectives (Hofer and Schendel 1978). However, Poster’s generic strategies take the view that cost leadership and product differentiation can only be pursued together under extreme circumstances. It is also unclear if those approaches can be implemented. The generic strategies of Porter are linked to external requirements (Murray 1988). The generic strategies are therefore not mutually exclusive, and various strategic means can be added to each strategy (Murray 1988).
Several papers have identified the positive effect of business strategies on organizational performance. A study by Chepchirchir et al. (2018) showed that superior accounting metrics used in logistics sectors increased business performance and that cost leadership had a substantial positive impact on firm performance through increased volume in revenues and company net income. Furthermore, using superior accounting metrics helped the organizations reduce the cost of production and other related activities. Such cost reductions associated with operations resulted in an even larger profit margin (Chepchirchir et al. 2018).
A differentiation strategy involves designing innovative goods or services that have outstanding and superior value. This strategy is costly. The organization can charge a greater premium than its rivals to make sufficient profits over the market average. Miller (1988) introduced four general principles. The concepts of the strategy should be tailored to this situation and vice versa. The second theme links Porter’s business strategies to an organization in the form of the coordination of technological and control activities in running a company (Allen et al. 2007). Neither tactics nor systems alone are sufficient for superior performance, and Porter is not mutually exclusive. The structure model depends heavily on its context, but the environment would have little impact on the structure (Miller 1988).
However, the execution of corporate practices with control tools (in this case, management accounting tools) can affect the efficiency of a business. Porter’s generic tactics and themes, along with the results in Allen et al.’s report, indicate that competitive Japanese companies use cost leadership and distinction strategies. One study showed that Porter’s generic strategies enable a firm to outperform its rivals (Olwande 2012). Another study indicated that Porter`s generic tactics are favorably linked to the firm’s results (Pulaj et al. 2015). These reports describe the roles of cost leadership, differentiation, and focus strategies on organizational efficiency, and these strategies have a substantial impact.
Nine business goals are discussed in this study. The respondents were asked which business goals they were most concerned about in their organizations. The most frequently chosen answer to this question was “business sustainability”, with a mean of 4.48 out of 5 (standard deviation and coefficient variance of 0.66 and 0.15, respectively). The second business goal selected was to achieve “greater profitability”, with a mean of 4.10 (standard deviation and coefficient variance of 0.91 and 0.22, respectively). The third-ranked business goal was “competitive advantage”, with a mean of 4.03 (standard deviation of 0.77, and a coefficient variance of 0.19). Given the current business strategies and goals as well as the effects when using a certain management system implemented by management, firms’ performance can be seen as a result of these relations. Therefore, firms’ management groups are to decide which management accounting system should be deliberately used or which management accounting system fits well and can be used as a tool to truly and effectively assess the firm’s performance. The following hypotheses are proposed:
Hypothesis 1.
Business strategies affect traditional management accounting systems of large Thai manufacturing firms.
Hypothesis 2.
Business strategies affect strategic management accounting systems of large Thai manufacturing firms.
Hypothesis 3.
Business goals affect traditional management accounting systems of large Thai manufacturing firms.
Hypothesis 4.
Business goals affect strategic management accounting systems of large Thai manufacturing firms.
Management accounting systems are used for various reasons and are also deliberately categorized (e.g., traditional management accounting or strategic management accounting). Traditional management accounting systems (TMASs) include costing systems, budgeting, performance evaluation, and information for decision making. Strategic management accounting systems (SMASs), the other main theme, are modern tools set to achieve the strategic business purposes of a firm. Theoretically and practically, accounting information systems need to be adapted to the specific needs of the firms. Accounting information systems must be designed within an adaptive framework. Furthermore, firm managers often desire additional external, non-financial, and ex ante information in addition to internal, financial, and ex post information (Gordon and Miller 1976).
Xydias-Lobo et al. (2004) highlighted the role of environmental and organizational factors in the implementation of management accounting systems in organizations. First, concerning environmental factors, market globalization contributes to intensified competitiveness, which can impact product and service costs and pricing, target markets, technical adaptation, quick reactions, and rapid development to name a few of the more evident factors. Second, evidence-producing methods make it easier for decision makers to access knowledge about where and how they want to use these innovations. These technical advancements in particular have contributed to the intensified competition. Workers, staff, administrators, and managers are now more highly trained and experienced players than ever in the business world. Aside from that, other systemic variables lead to shifts in management accounting systems, such as organizations that rely more on their core competencies, enhancing client and consumer relationships, downsizing companies, outsourcing, and flattening organizational structures. In today’s technological environment, the way management uses management accounting systems is evolving and simultaneously influenced by various internal and external factors.
In this paper, traditional management accounting systems (TMASs) consist of the following tools: the costing system (7 tools with an average use of 3.05); budgeting (7 tools with an average use of 3.23); performance evaluation (8 tools with an average use of 3.22); and information for decision making (9 tools with an average use of 3.42).
Concerning strategic management accounting systems (SMASs), 14 tools are available with an average use of 3.07. In the study, respondents reported that their use was not extensive. The statistics illustrate means within a range of 2.51–3.50. The standard deviation is small, and the coefficient of variation is less than 0.30. These management accounting systems contribute to some benefits such as influencing the staff and the management to perform well, improving overall efficiency, and ultimately affecting the performance of the whole organization.
In this paper, six financial ratios were chosen as being representatives of financial performance (FP). The ratios were (1) the return on assets (ROA), (2) return on equity (ROE), (3) assets turnover (AT), (4) profit margin (PM), (5) debt to equity (DE), and (6) debt to asset (DA). These six ratios are deemed reliable indicators of financial performance (FP) and have been the focus of several other research papers. Among these are the following: Abdel-Kader and Luther (2008), Banker et al. (2000), Chenhall and Langfield-Smith (1998a, 1998b), Delen et al. (2013), Drury and Tayles (1994), Nurazi and Usman (2015), Phadoongsitthi (2003, 2005), Saidat et al. (2019), Scarbrough et al. (1991), and Wu et al. (2007). The FP varied among our sample of firms. The highest variation was found in the DE ratio; the second-highest variation was in the PM ratio.
In previous research, the extensive use of non-financial ratios as indicators of firm success was illustrated. These include Berraies and Hamoud (2018), Dotson and Allenby (2010), Lukason et al. (2019), Melián-González et al. (2015), Musi et al. (2018), Silveira (2019), Simon and Gómez (2014), Towler et al. (2011), and Watkins (2000). The seven non-financial performance (NFP) indicators used in this present study were (1) customer satisfaction, (2) employee satisfaction, (3) policy implementation, (4) communication among divisions, (5) employee efficiency, (6) internal control efficiency, and (7) regulatory compliance. The results indicate that after the management accounting systems had been implemented in the respondents’ organizations, the firms’ managers were most satisfied with regulatory compliance (86.06%), followed by customer satisfaction (83.13%) and improved communication between divisions (82.75%). However, communication among the divisions of those sample companies was found to have a higher coefficient of variance of 0.76. This indicates that there were different satisfaction levels regarding the communication between divisions or departments within the same organizations.
The expectation was that there were positive effects on the firm performance. Four additional hypotheses were therefore proposed:
Hypothesis 5.
Traditional management accounting systems affect the financial performance of large Thai manufacturing firms.
Hypothesis 6.
Traditional management accounting systems affect the non-financial performance of large Thai manufacturing firms.
Hypothesis 7.
Strategic management accounting systems affect the financial performance of large Thai manufacturing firms.
Hypothesis 8.
Strategic management accounting systems affect the non-financial performance of large Thai manufacturing firms.
Eight hypotheses are displayed in Figure 1 and serve as the framework for the present research.

3. Methodology

3.1. Samples

The population used in this study was drawn from the business data warehouse of the Department of Business Development of the Ministry of Commerce in Thailand. The study used purposive sampling. Based on the data from the data warehouse, 15 provinces were chosen, all of which are in Thailand’s central industrial cluster. These 15 provinces are the bases of manufacturing production and have a relatively high economic impact on the country’s economy. Only large companies with total assets greater than THB 500 million (USD 15.625 million) as of 31 December 2015 with continuous operation in 2015–2020 were included in the study.
A total of 2848 companies met the selection criteria. The study used a quota sampling method by taking proportions of the total companies in those provinces. Therefore, 1500 was chosen as the sample number for this study. Additionally, the selected firms consisted only of the manufacturing sector to prevent variability between other sectors. In Thailand, as of December 2020, the manufacturing sector had a value contribution of 3.96% to the Thai gross domestic product (GDP), or approximately THB 4 trillion. This sector has the highest contribution among all other sectors (Statista Research Department 2020) and is a significant part of the overall Thailand economy. Therefore, it was worthwhile to concentrate on this sector as the key target population.
A postal survey was employed in this study. This approach has been successfully used in many social science and humanities research works, such as Al-Omiri and Drury (2007), Chenhall and Langfield-Smith (1998a, 1998b), Chenhall and Moers (2007), Drury et al. (1993), Firth (1996), Haldma and Lääts (2002), O’Connor et al. (2004), Phadoongsitthi (2003), Ping (2004), and Sulaiman et al. (2008). Questionnaires were delivered to the 1500 companies in the sample during September 2017 using a purposive sampling method in selecting the samples. Those 1500 samples were taken from the list of the Department of Business Development of the Ministry of Commerce in Thailand. Only companies classified as being in the manufacturing sector—both listed and unlisted companies—were selected. From the 1500 postal questionnaires, 220 responses were received, of which 205 were usable for a 13.67% response rate, representing 7.19% of the selected population. Where appropriate in the questionnaires, the respondents were asked questions about the level of use of the management accounting system employed in their organizations. A 5-point Likert-type scale was employed, where a score of 4.51–5.00 was interpreted as “most often used”; 3.51–4.50 was “often used”; 2.51–3.50 was “sometimes used”; 1.51–2.50 was “rarely used”; and 1.00–1.50 was “never used”. A response bias may occur in survey research, where the quality of the survey deteriorates depending on the increasing of biases and survey errors (Toepoel and Schonlau 2017). It was almost impossible to eliminate the nonresponses. The questionnaire of this research was designed to avoid as much as possible the presence of nonresponses by earning a professional opinion and testing the reliability of the questionnaire prior to launching in order to minimize errors and biases. This research performed a nonresponse bias test to ensure the reliability of the collected data. The validation approach (Nathan 2005) was employed to deal with non-response biases. The main problem of this survey research is its low response rate. The unanswered respondents received a courtesy reminder a second time. Seventy-two responses were received and classified as a late response group. To investigate the statistically significant differences in the on-time responses and late responses, a mean and t-test were performed on the variables. We found insignificant differences in those key variables.
This study based its findings on 205 samples from manufacturing companies. Firms were asked to identify the business strategies they employed, followed by the business goals (the primary objectives of the firm). About 60% of the respondents described the cost leadership strategy as the primary strategy for their organizations. This percentage was high, and it was consistent with previous studies, where cost leadership was a common strategy employed by manufacturing companies. The second approach common among the respondents was the focus strategy, with 47% of companies stating that they had adopted the strategy. A total of 150 respondents, or 73.17%, of the total answered with a mixture of strategies used in their organizations.

3.2. Statistical Method

This research employed quantitative data for descriptive purposes. Empirical statistics were used, including means, standard deviation, a coefficient of variation, and percentages. Factor analysis was conducted with the use of the varimax rotation process. In addition, several parameters have been simplified to a smaller collection of summary variables.
The Structural Equation Modeling (SEM) method was used in this study. SEM is a general mathematical modeling methodology that is commonly used in the behavioral sciences (Joop and Bechger 1999) and has become a common tool for analyzing impacts on firm efficiency (Berraies and Hamoud 2018). This method was developed for validating instruments and evaluating a model in science, especially in marketing and organizational behavior (Chau 1997). SEM has proved to be popular among many scholars, including Byrne (1998), Hu and Bentler (1999), and the Division of Statistics and Scientific Computation (2012). It is also now used in ecological studies, such as Fan et al. (2016). SEM is referred to as a combination of factor analysis and path analysis (Weston and Gore 2006). Two typical primary components of SEM—the model of measurement and the structural model—are employed. The relationship between the measured variables and the observed variables is assessed to form a measurement model. This is performed to determine the adequacy of each measurement model (model-to-data fit and parameter estimates). The constructed variables are then hypothesized. The SEM model evaluates the complete adequacy and the hypotheses suggested between and among the constructs. The essential pathways between the paired constructs in the model indicate the simultaneous emergence of relationships and the corresponding compilation of strategic responses to the perceived market environment. The structure model illustrates the interrelationships between the constructions (Weston and Gore 2006).

3.3. Scale Assessment Process

In quantitative research, the reliability and validity of the methods and measurements are vital to a research work’s findings. To have accurate methods and measurements, the material, unidimensionality, discriminant validity, convergence validity, and predictive validity are of concern to researchers (Boateng et al. 2018; Green and Phillip 1976). Cronbach and Meehl (1955) proposed using Cronbach’s coefficient alpha and average variance extracted (AVE) tests to determine the reliability of a metric. This study showed that the alpha and item reliability values were above 0.70, and there was an average variance rate of less than 0.50, displaying adequate reliability. All measurements used in this analysis were above the prescribed thresholds. Therefore, all analysis scales had relatively high reliability. Ahire et al. (1996) proposed assessing the convergent validity, while Garver and Mentzer (1999) added that individual measurement objects should be checked to assess convergent validity. The value exceeded 0.7 in this analysis, which was assumed to be sound for convergent validity. Both scales possess ample predictive validity. The discriminant validity was tested using Fornell’s criteria.

3.4. Variables Used in This Paper

This study examines the relationships between and among the independent variables (business strategies and business goals) and dependent variables (the firm’s performance). The independent variables of this study were the employed business strategies (BS) and business goals (BG) of the firms, while the dependent variables were classified into financial performance (FP) and non-financial performance (NFP). The mediators of the study were the management accounting systems implemented in the firms, classified as (1) traditional (TMASs), an external, forward-looking orientation that focuses on financial, internal, and historical information (e.g., the costing system, budgeting, performance evaluation, and information for decision making), and (2) strategic management accounting systems (SMASs), an outward-looking orientation that focuses on the formulation, implementation, strategy control, marketing, and other managerial functions. All 10 latent variables (represented by ovals in Figure 1) used in this study were unobserved variables. The latent variables that formed the first-order structural model were derived from 66 reflective indicators in the questionnaire. A latent variable was posited as the common cause of the indicator. A reflective model through structural equation modeling was formed in this study (see Figure 1 and Table 1).

4. Results

4.1. Descriptive Characteristics of the Survey Respondents

The first section of the questionnaire inquired about the characteristics of the sampled companies. A firm’s characteristic factors, such as the asset size, number of employees, and establishment’s years in the business, theoretically affect the implementation of organizational systems (Firth 1996; O’Connor et al. 2004; Premkumar and Ramamurthy 1995). The sampled companies’ ownership structures provided some vital information. Of the 205 respondents, most were family-owned entities (40.98%); the second-largest ownership structure (39.02%) was foreign-owned entities, meaning most shareholders were not Thai citizens. In terms of business structures, most of the surveyed companies were subsidiaries under the control of their parent companies, which were located either overseas or in Thailand (53.65%), and the second-largest group was parent companies that had subsidiaries either in Thailand or in foreign countries (31.22%). The remainder (15.13%) were stand-alone businesses, being neither a subsidiary nor a parent company. Most of the companies (56.1% of the respondents) had been in business for more than two decades.
Table 2 displays the descriptive information for the variables used in this study. Over 60% of the respondents used a cost leadership strategy as the main strategy in their organizations. This percentage is high and aligns with previous research which mentioned that cost leadership was a popular strategy in Porter’s generic strategy approach. The second strategy that was popular among the respondents was a focus strategy, which 47% of the respondents stated they implemented. However, the combination of the mixed strategies was selected by the 150 respondents, or 73.17% of the total respondents.
From the questionnaire, each respondent was asked to specify the business goals that their firms focused on. Later, the level of usage of each management accounting tool was to be identified. The study employed a five-point Likert scale, ranging from 5 (“Most often used”) to 1 (“least used or never used”). Each of the management accounting tools was presented based on their categories, being either traditional management accounting systems (TMASs) or strategic management accounting systems (SMASs). Table 2 illustrates the business goals identified by the respondents. A ranking order from the highest mean to the lowest is presented. The most frequent business goal selected by the respondents was “business sustainability”, with a mean of 4.48 out of 5 and low standard deviation and coefficient variance of 0.66 and 0.15, respectively. The second business goal selected was “increase profitability”, with a mean of 4.10, standard deviation of 0.91, and coefficient variance of 0.22. The third most frequent business goal was “competitive advantage”, with a mean of 4.03, standard deviation of 0.77, and coefficient variance of 0.19.
In this study, both the business strategies and business goals were used as independent variables to examine the relationships between them and the dependent variables (which were financial and non-financial performance) mediated by management accounting systems.

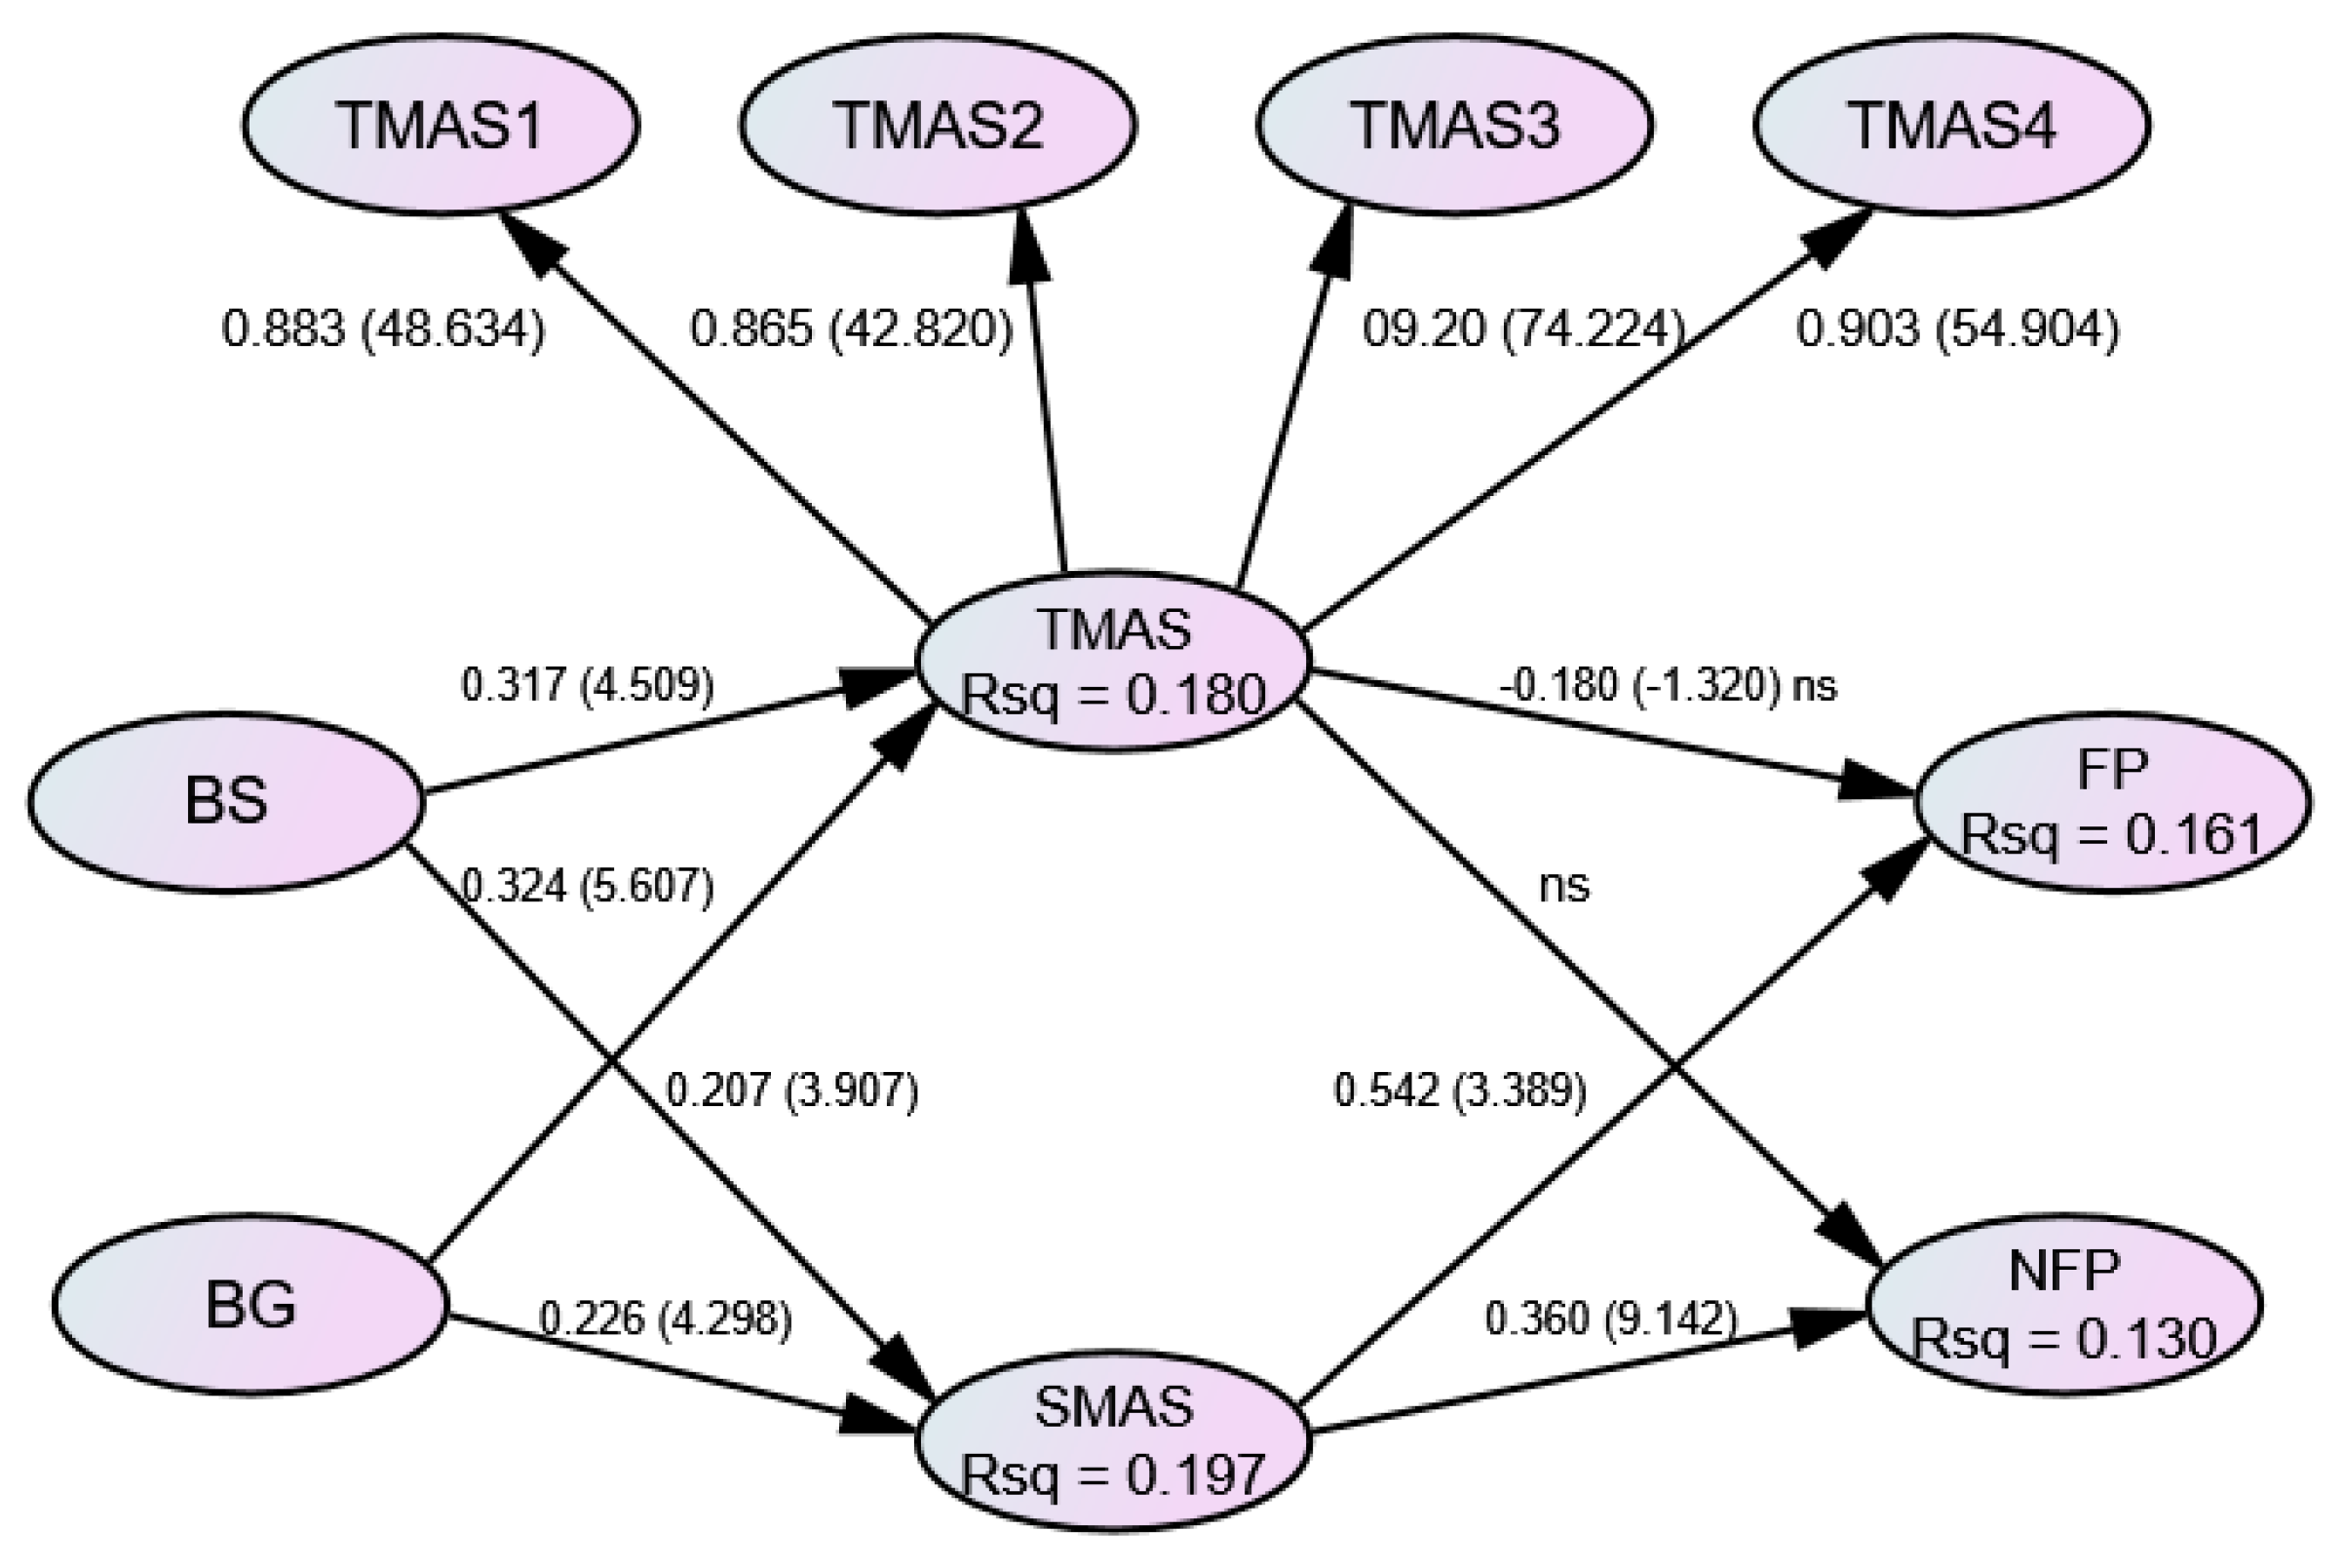
4.2. Structural Equation Modeling Results

The path coefficients are presented with their t-values in round brackets. Business strategies affected the TMAS and SMAS by 0.317 (t = 4.509) and 0.324 (t = 5.607), respectively. A beta of at least 0.20 was considered to be demonstrating minimal high impact. Note that the business strategies consisted of cost leadership, differentiation, focus strategies, and a combination of these strategies. The data confirmed that the more strategies large firms had, the greater their influence on the TMAS and SMAS were. However, business strategies appeared to have a higher impact on the way a firm implemented management accounting systems. Thus, from these statistical results, Hypotheses 1–4 were supported.
The path analysis of the TMAS to FP and NFP presented interesting findings. When the firms implemented a TMAS, the findings indicated a negative impact on the FP of the firms of −0.180 (t = −1.326). However, the TMAS impact was neither statistically significant to the FP of the firms nor to the NFP. These results indicate that neither the FP nor the NFP were affected by the TMAS. In contrast, the implementation of an SMAS showed an impact on both the FP and the NFP of 0.542 (t = 3.389) and 0.360 (t = 9.142), respectively (higher impact from the SMAS on the FP). It is now possible to conclude that hypotheses 5–6 were not supported (lines from the TMAS to the FP and NFP), whereas Hypotheses 7–8 were statistically supported (see Figure 2).
Figure 2 shows that when a TMAS and SMAS were used as the mediated variables to link the business strategies and business goals to organizational performance, the SMAS had a more significant impact on both types of organizational performance—FP and NFP—whereas the TMAS had a null effect on both types of organizational performance.
However, to analyze the impacts of the business strategies and business goals, it was important to consider both direct and indirect effects when investigating the holistic impacts on organizational performance. Table 3 illustrates the direct and indirect effects of the observed variables on the dependent variables of both FP and NFP.
The effects of the business strategies and the business goals of large industries were somehow passed on via both traditional management accounting systems (TMASs) and strategic management accounting systems (SMASs). In other words, the strategies and goals of the firms determined, to some extent, which implementation of the management accounting systems should be employed in organizations to be able to conduct the strategies and goals and be able to assess both the firms’ financial and non-financial performance effectively. As Table 3 indicates, the TMAS did not statistically impact the FP (financial performance) of the sample organizations and had no effect on the NFP (non-financial performance), while the SMAS directly and statistically impact both the FP and the NFP.
These findings did not support null Hypotheses 5–6 but did support Hypotheses 7–8. The data indicated that the FP and NFP were both indirectly affected by business strategies and business goals. It can thus be interpreted that the business strategies had an indirect effect on both the FP and NFP, with beta values of 0.119 and 0.117, respectively. The business goals had an indirect impact on the FP and NFP, with beta values of 0.085 and 0.081, respectively. Although these beta values were not very high, they still showed a significant impact that could not be overlooked.
The findings of this paper can be compared to previous research in that both the strategies and goals of the firms indirectly affected the firms’ performance in terms of the financial metrics, non-financial metrics, or both. However, the relationship of the strategies and goals as independent variables and performance as independent variables with having management accounting systems as mediators are not well researched. In this research, all business strategies (either cost leadership, differentiation, or focus) and business goals had direct effects on how management accounting systems (either TMAS or SMAS) were being used in the organizations. However, only the SMAS had direct effects on the performance of the firms. In other words, SMASs are the better system to be used to mediate the strategies and goals of the firms. This finding is not in line with some previous research, which revealed their findings that the cost leadership strategy was the only one that influenced organizational performance (Chepchirchir et al. (2018), Hunjra et al. (2017), Huang (2001), Hunjra et al. (2017), and Pulaj et al. (2015)). Some of the findings of this paper can then be compared only at some points and not as a whole. The findings of this research agree with the findings of Fullerton and McWatters (2002, 2004) and Škrinjar et al. (2008), which supported the effects of business process orientations on both the FP and NFP, while only financial performance was confirmed from the findings of Epstein (2002), Hyvönen (2007), and Scapens and Jazayeri (2003), which revealed that it was the firms’ business strategies and goals that had a direct effect on only the FP of the organizations. In contrast, several research works, such as Banker et al. (2000), Wegmann and Poincelot (2012), Hyvönen (2007), and Low and Siesfield (1998), support the effect of only the NFP.

5. Conclusions and Recommendations

There have been considerable debates surrounding whether business strategies and business goals, with management accounting systems, have any impact on firms’ performance. This study fills the research void by investigating the relationships and impacts that some of the most essential and commonly implemented management accounting systems have on business performance. This study explores the interaction and impact that some of the most important and widely applied management accounting systems have on the company efficiency. The SEM method was employed. The results indicate that the business strategies, business goals, and path management accounting systems implemented by the firms influenced the manufacturing firms’ performance, both financial and non-financial. Even though traditional management accounting systems do not directly affect both financial and non-financial performance, the indirect effects of business strategies and business goals were seen, with the management accounting systems as mediators. They displayed indirect effects on performance. These findings offered support for Hypotheses 1–4 and 7–8, while Hypotheses 5 and 6 were not supported. These results hypothetically bring the interpretation that the traditional accounting system has little (if there is, it is negative) to no influence on the financial and non-financial performance of the firms. The traditional management accounting system is not a good system to mediate firms’ goals and strategies.
This present research determined that business strategies and business goals statistically influenced the management accounting systems used in organizations. This statement was loud and clear in the case of business strategies. Business goals had a statistically lower level of influence. There was no direct impact from the traditional management accounting system on the financial and non-financial performance, whereas the strategic management accounting system had a statistically significant effect on both the financial and non-financial performance. This message was voiced, and managers of manufacturing firms should pay considerably more attention to implementing strategic management accounting systems and minimizing the use of traditional systems when attempting to enhance the performance of their firms. The findings of this research support the implementation of strategic management accounting systems more in manufacturing firms, as they have a direct impact and statistically contribute to both financial and non-financial indicators. As a result, they can be used as key mediators to conduct firms’ business goals and strategies. While the traditional accounting system is commonly used by many firms, they are merely used or implemented as common practices which have no or little effects on either the financial or non-financial performance of the firms.
Comparatively speaking, these findings are important, especially when markets change rapidly. In a rapidly evolving landscape where multinational enterprises and new markets are increasingly prevalent, businesses need to adapt and evolve to survive or remain in a leading position. Organizational success is all the more vulnerable to uncertainty, despite intense competition and risks (Lee et al. 2010). Either to remain as market leaders or to survive, organizations must be able to adapt quickly to developments in their industries. The contributions of this research work’s findings provide a deeper explanation of the relationships and impacts of mediators which should be used in organizations to bring forth the business strategies and business goals and produce fruitful and satisfactory results for organizational performance. Using the right mediators to measure the performance of the firms will facilitate the business goals and business strategies successfully.

6. Research Limitations and Further Research

Several limitations admittedly reduce the generalizability of this work’s findings. As with all survey research, the respondents are supposed to be the eligible persons to answer the questionnaire on behalf of the organizations. This is the requisite assumption when it comes to collecting information via questionnaires. The respondents should have adequate information to respond to the items being asked, and they are hypothetically answering them conscientiously and truthfully. In this study, even though the questionnaire was accompanied by a glossary and necessary explanations, the interpretations of the respondents regarding the terminology and items being asked may have differed from that which was intended. Second, the findings were based on the answers received from 205 respondents, all of whom were large manufacturing companies in Thailand. A small number of respondents may have affected the reliability of the results and led to a bias. The typical case of bias is a result of non-responders who did not have the opportunity to participate in the survey. When considering the size and sectors more, as well as the universal nature of large organizations, especially in the manufacturing sector, they are more likely to have implemented various management accounting systems, with some having traditional systems and others using strategic systems. In addition, management accounting systems can be influenced by national cultures (Ringov and Zollo 2007; Wei et al. 2014). Culture differences may affect the way management accounting systems are employed. This study also included only the large manufacturing sector, while other business sizes and sectors were excluded. Future research may consider expanding the research scope to cover other new factors of influence, new mediators, other sizes (small or medium) and sectors (e.g., trading or service), and increase the number of respondents. The variety of business strategies should be investigated more. This study utilized Porter’s strategy, as it is the strategy most commonly used and supported by researchers. Future research may consider different types of business strategies, such as that suggested by Miles and Snow (1978, 1984), which links the framework of human resource management (HRM) practices in corporations and business strategies. Management accounting systems could contribute to the performance of companies. Nevertheless, other factors might have influence and be used to conduct the business strategies and business goals effectively, bringing forth better performance.

Author Contributions

Conceptualization, N.V. and K.T.; methodology, K.T.; software, K.T.; validation, K.T.; formal analysis, N.V. and K.T.; investigation, N.V. and K.T.; resources, N.V.; data curation, N.V.; writing—original draft preparation, K.T.; writing—review and editing, K.T.; visualization, K.T.; supervision, N.V.; project administration, K.T.; funding acquisition, N.V. Both authors have read and agreed to the published version of the manuscript.

Funding

This research was funded by Rangsit Research Institute, Rangsit University, Thailand, the grant number 74/2559. The authors acknowledge with great gratitude and appreciation.

Institutional Review Board Statement

Not applicable.

Informed Consent Statement

Not applicable.

Data Availability Statement

The data presented in this study are available on request from the corresponding author.

Conflicts of Interest
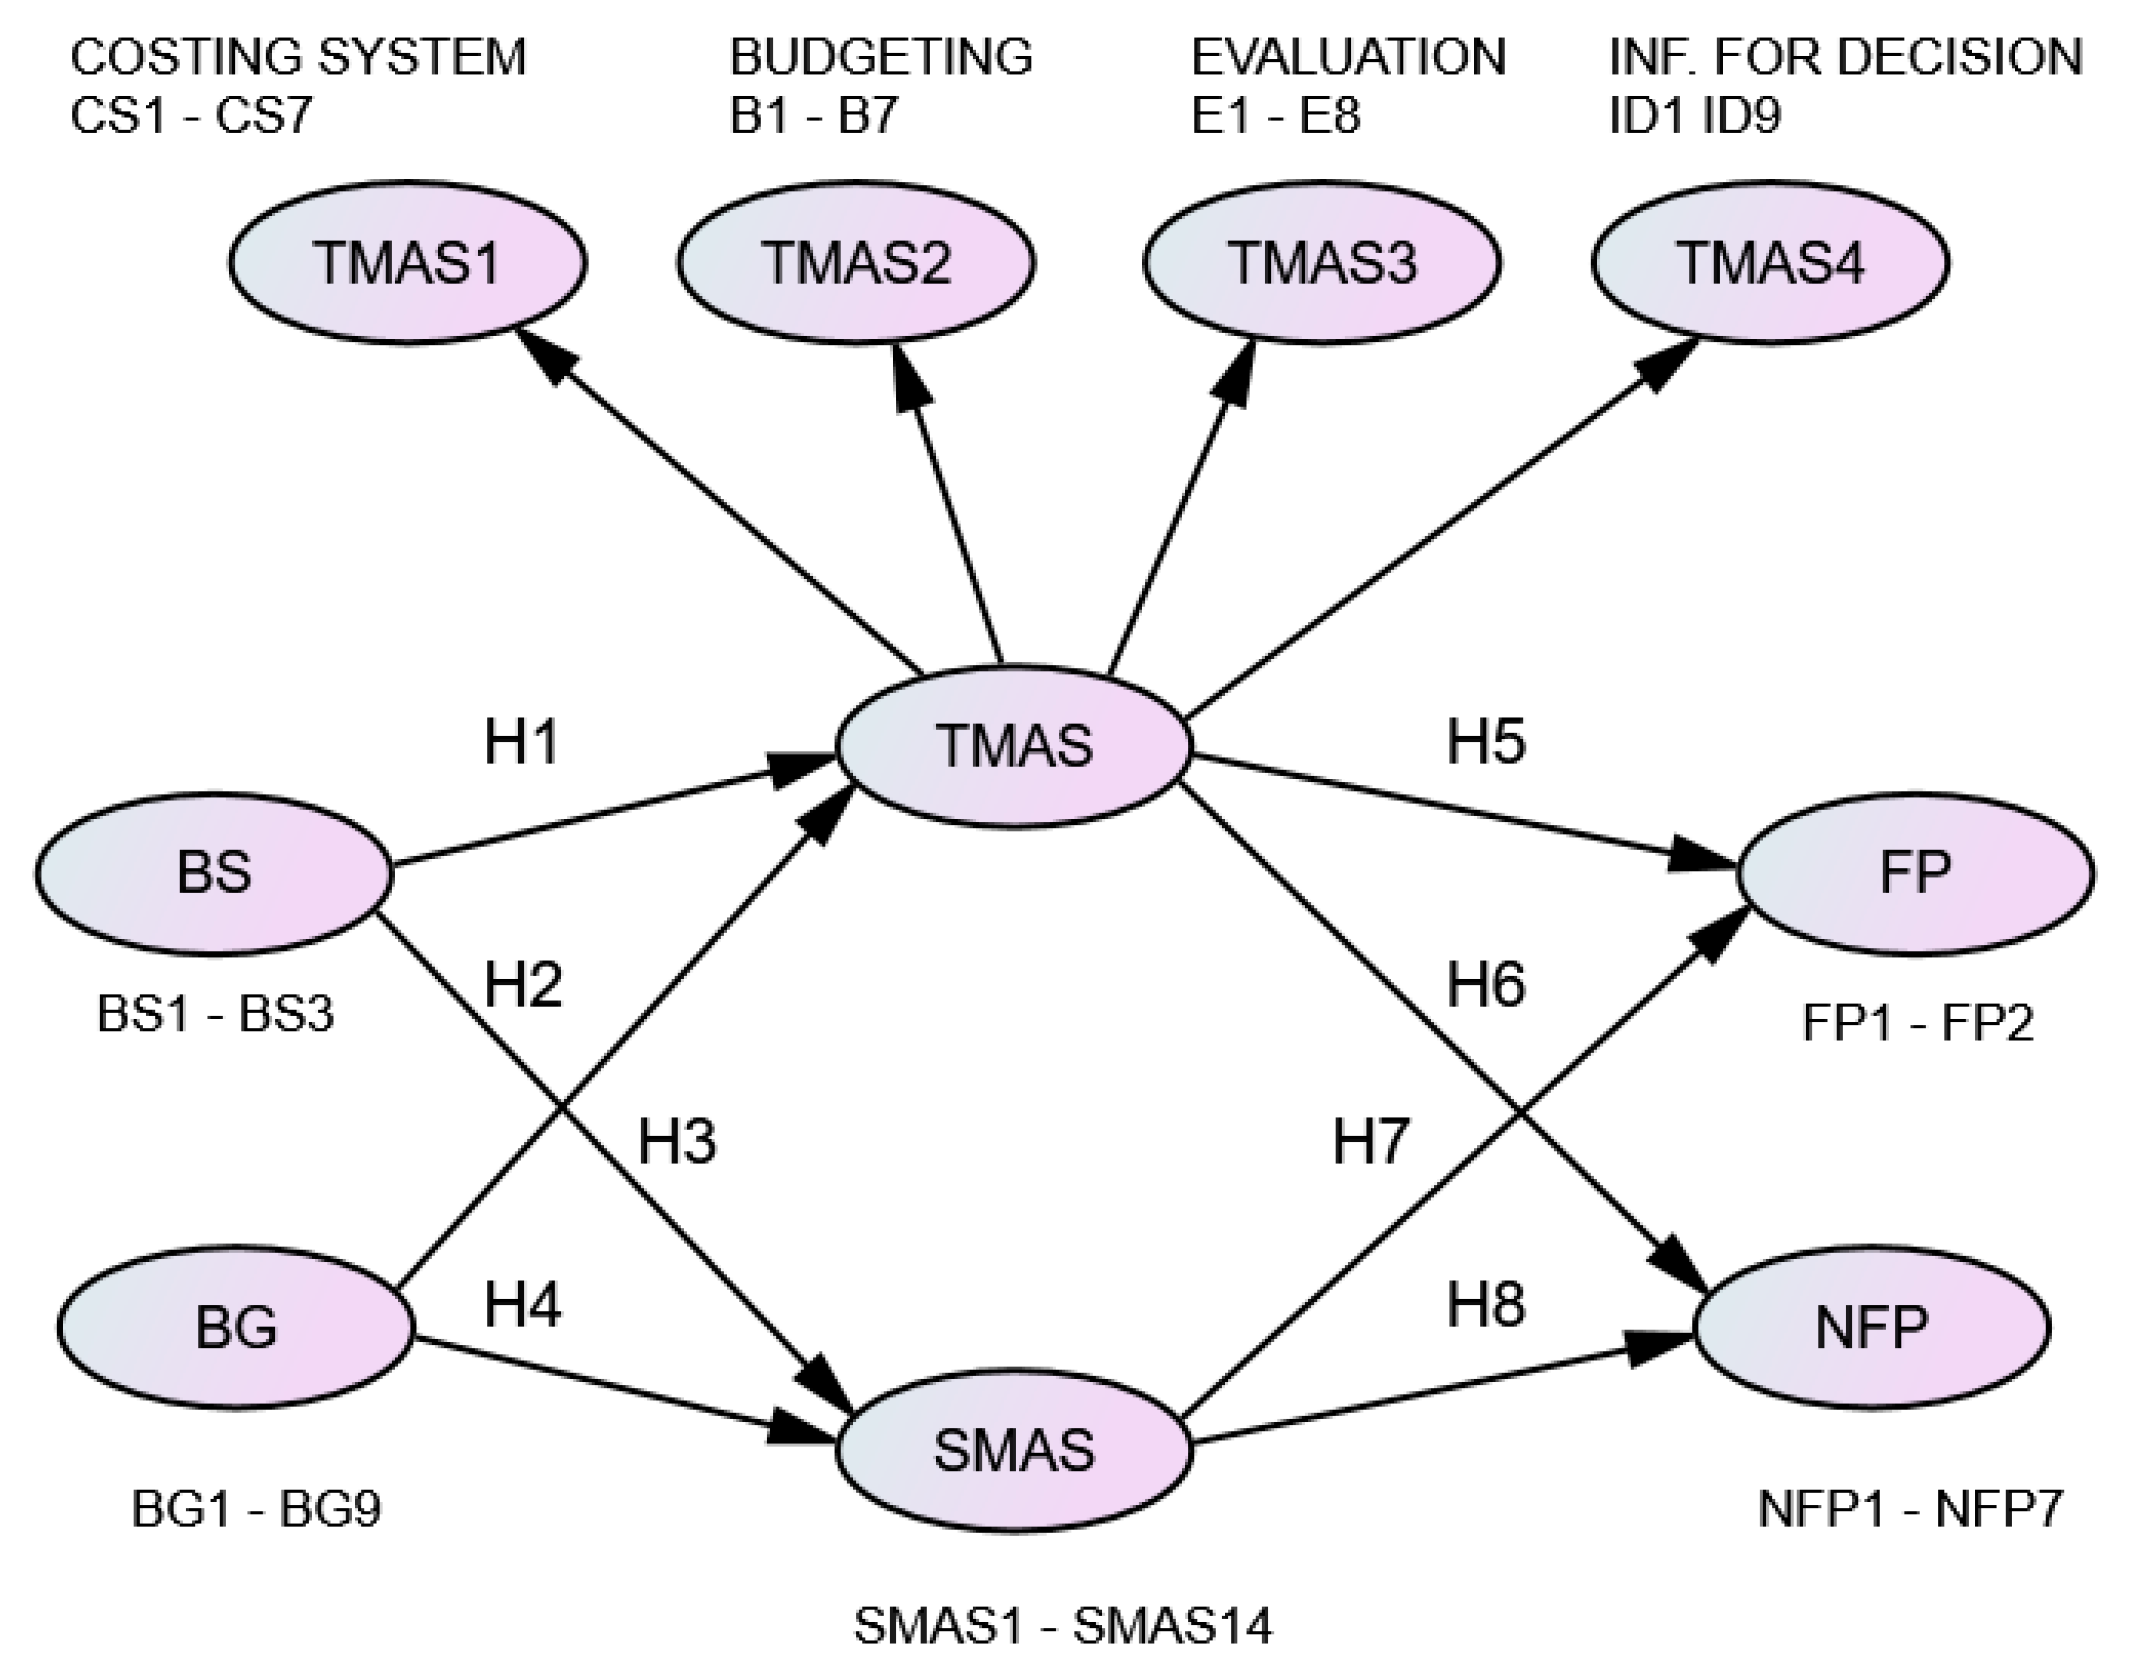
The authors declare no conflict of interest. The funders had no role in the design of the study; in the collection, analyses, or interpretation of data; in the writing of the manuscript, or in the decision to publish the results.

Notes

1
The costing system (CS) includes job process or job order techniques, cost behavior, activity-based costing, plant-wide overhead cost pr departmental overhead cost rate, standard costing, quality cost analysis, and the learning curve technique (seven variables).
2
Budgeting (B) includes budgeting for product cost controlling, budgeting for cash flow planning, activity-based budgeting, performing a financial statement, flexible budgeting, sensitivity analysis of cost, and zero-based budgeting (seven variables).
3
Performance evaluation (E) includes a balanced scorecard, financial measurements, non-financial measurements of customer satisfaction, non-financial measurements related to operation and innovation (e.g., patent certificates and awards), and non-financial measures related to employees (e.g., employee satisfaction, staff turnover, benchmarking, residual income, and economic value added) (eight variables).
4
Information for decision making (ID) includes break-even point analysis, stock control models, the evaluation of significant capital investment based on the discounted cash flow method, the evaluation of capital investment based on a payback period or the accounting rate of return, sensitivity analysis of the cost model, incremental analysis, profitability analysis, and customer profitability analysis (nine variables).

References

  1. Abdel-Kader, Magdy G. 2011. Review of Management Accounting Research–2011. Macmillan: Palgrave. [Google Scholar]
  2. Abdel-Kader, Magdy G., and Robert G. Luther. 2008. The impact of firm characteristics on management accounting practices: A UK-based empirical analysis. British Accounting Review 40: 2–27. [Google Scholar] [CrossRef]
  3. Ahire, Sanjay L., Damodar Y. Golhar, and Matthew A. Waller. 1996. Development and validation of TQM implementation constructs. Decision Sciences 27: 23–56. [Google Scholar] [CrossRef]
  4. Allen, Richard S., and Marilyn M. Helms. 2006. Linking strategic practices and organizational performance to Porter’s generic strategies. Business Process Management Journal 12: 433–54. [Google Scholar] [CrossRef]
  5. Allen, Richard S., Marilyn M. Helms, Holly Jones, Margaret B. Takeda, and Charles S. White. 2007. Porter’s business strategies in Japan. Business Strategy Series 9: 37–44. [Google Scholar] [CrossRef]
  6. Al-Omiri, Mohammed, and Colin Drury. 2007. A survey of factors influencing the choice of product costing systems in UK organizations. Management Accounting Research 18: 399–424. [Google Scholar] [CrossRef]
  7. Banker, Rajiv D., Hsihui Chang, and Mina J. Pizzini. 2004. The balanced scorecard: Judgmental effects of performance measures linked to strategy. The Accounting Review 79: 1–23. [Google Scholar] [CrossRef]
  8. Banker, Rajiv D., Seok-Young Lee, Gordon Potter, and Dhinu Srinivasan. 2000. An empirical investigation of an incentive plan that includes nonfinancial performance measures. The Accounting Review 75: 65–92. [Google Scholar] [CrossRef]
  9. Beaumont, Phil B. 1993. Human Resource Management: Key Concepts and Skills’. London: Sage. [Google Scholar]
  10. Berraies, Sarra, and Manel Hamoud. 2018. Customer empowerment and firms’ performance: The mediating effects of innovation and customer satisfaction. International Journal of Bank Marketing 36: 336–56. [Google Scholar] [CrossRef]
  11. Boateng, Godfred O., Torsten B. Neilands, Edward A. Frongillo, Hugo R. Melgar-Quiñonez, and Sera L. Young. 2018. Best Practices for Developing and Validating Scales for Health. Social, and Behavioral Research: A Primer. Frontiers in Public Health 6: 149. [Google Scholar] [CrossRef] [PubMed]
  12. Byrne, Barbara M. 1998. Structural Equation Modeling with LISREL, PRELIS, & SIMPLIS: Basic Concepts, Applications, & Programming’. Mahwah: Lawrence Erlbaum Associates. [Google Scholar]
  13. Chau, Patrick Y. K. 1997. Reexamining a Model for Evaluating Information Center Success Using a Structural Equation Modeling Approach. Journal of the Decision Sciences Institute 28: 309–34. [Google Scholar] [CrossRef]
  14. Chenhall, Robert H., and Kim Langfield-Smith. 1998a. Adoption and Benefits of Management Accounting Practices: An Australian Study. Management Accounting Research 9: 1–19. [Google Scholar] [CrossRef]
  15. Chenhall, Robert H., and Kim Langfield-Smith. 1998b. The relationship between strategic priorities, management techniques and management accounting: An empirical investigation using a systems approach. Accounting, Organizations and Society 23: 243–64. [Google Scholar] [CrossRef]
  16. Chenhall, Robert, and Frank Moers. 2007. The issue of endogeneity within theory-based, quantitative management accounting research. European Accounting Review 16: 173–95. [Google Scholar] [CrossRef]
  17. Chepchirchir, Alice B., Francis Omillo, and Jennifer Munyua. 2018. Effect of Cost Leadership Strategy on Organizational Performance of Logistics Firms at Jomo Kenyatta International Airport, Kenya. European Journal of Management and Marketing Studies 3: 76–86. [Google Scholar] [CrossRef]
  18. Chow, Chee W., Jean C. Cooper, and William S. Waller. 1988. Participative Budgeting: Effects of a Truth-Inducing Pay Scheme and Information Asymmetry on Slack and Performance. The Accounting Review 63: 111–22. [Google Scholar]
  19. Cronbach, Lee J., and Paul E. Meehl. 1955. Construct validity in psychological tests. Psychological Bulletin 52: 281. [Google Scholar] [CrossRef] [Green Version]
  20. Delen, Dursun, Cemil Kuzey, and Ali Uyar. 2013. Measuring firm performance using financial ratios: A decision tree approach. Expert Systems with Applications 40: 3970–83. [Google Scholar] [CrossRef]
  21. Division of Statistics and Scientific Computation. 2012. The University of Texas at Austin. ‘Structural Equation Modeling Using AMOS an Introduction. Available online: https://stat.utexas.edu/images/SSC/Site/AMOS_Tutorial.pdf (accessed on 15 January 2021).
  22. Dotson, Jeffrey P., and Greg M. Allenby. 2010. Investigating the Strategic Influence of Customer and Employee Satisfaction on Firm Financial Performance. Marketing Science 29: 895. [Google Scholar] [CrossRef]
  23. Dowling, Peter J., and Randall S. Schuler. 1990. Human resource management. In Comparative Labor Law and Industrial Relations. Edited by R. Blanpain. Boston: Kluwer Law and Taxation Publishers. [Google Scholar]
  24. Drury, Colin, and Mike Tayles. 1994. Product costing in UK manufacturing organizations. European Accounting Review 3: 443–69. [Google Scholar] [CrossRef]
  25. Drury, Colin, S. Braund, P. Osborne, and Mike Tayles. 1993. A Survey of Management Accounting Practices in UK Manufacturing Companies. London: Chartered Association of Certified Accountants. [Google Scholar]
  26. Epstein, Marc J. 2002. Measuring the Payoffs of Corporate Actions: The Use of Financial and Non-Financial Indicators. Performance Measurement and Management Control 12: 3–13. [Google Scholar]
  27. Fan, Yi, Jiquan Chen, Gabriela Shirkey, Ranjeet John, Susie R. Wu, Hogeun Park, and Changliang Shao. 2016. Applications of structural equation modeling (SEM) in ecological studies: An updated review. Ecological Processes 5: 19. [Google Scholar] [CrossRef] [Green Version]
  28. Firth, Michael. 1996. The diffusion of managerial accounting procedures in the People’s Republic of China and the influence of foreign partnered joint ventures. Accounting, Organizations and Society 21: 629–54. [Google Scholar] [CrossRef]
  29. Fullerton, Rosemary R., and Cheryl S. McWatters. 2002. The role of performance measures and incentive systems in relation to the degree of JIT implementation. Accounting, Organizations and Society 27: 711–35. [Google Scholar] [CrossRef]
  30. Fullerton, Rosemary R., and Cheryl S. McWatters. 2004. An empirical examination of cost accounting practices used in advanced manufacturing environments. Advances in Management Accounting 12: 85–113. [Google Scholar]
  31. Garver, Michael S., and John T. Mentzer. 1999. Logistics Research Methods: Employing Structural Equation Modeling to Test for Construct Validity. Journal of Business Logistics 20: 33–57. [Google Scholar]
  32. Gordon, Lawrence A., and Danny Miller. 1976. A Contingency Framework for the Design of Accounting Information Systems. Accounting, Organizations and Society 1: 59–69. [Google Scholar] [CrossRef]
  33. Green, Robert T., and White. D. Phillip. 1976. Methodological Considerations in Cross-National Consumer Research. Journal of International Business Studies 7: 81–87. [Google Scholar] [CrossRef]
  34. Haldma, Toomas, and Kertu Lääts. 2002. Contingencies influencing the management accounting practices of Estonian manufacturing companies. Management Accounting Research 13: 379–400. [Google Scholar] [CrossRef]
  35. Hlavacka, Svatopluk, Ljuba Bacharova, Viera Rusnakova, and Robert Wagner. 2001. Performance implications of Porter’s generic strategies in Slovak hospitals. Journal of Management in Medicine 15: 44–66. [Google Scholar] [CrossRef]
  36. Hofer, Charles W., and Dan E. Schendel. 1978. Strategy Formulation: Analytical Concepts. St. Paul: West Publishing. [Google Scholar]
  37. Hopper, Trevor, Tsutomu Koga, and Jitsuo Goto. 1999. Cost accounting in small and medium sized Japanese companies: An exploratory study. Accounting and Business Research 30: 73–86. [Google Scholar] [CrossRef]
  38. Hu, Li-tze, and Peter M. Bentler. 1999. Cutoff criteria for fit indexes in covariance structure analysis: Conventional criteria versus new alternatives. Structural Equation Modeling 6: 1–55. [Google Scholar] [CrossRef]
  39. Huang, Tung-Chun. 2001. The effects of linkage between business and human resource management strategies. Personnel Review 30: 132–45. [Google Scholar] [CrossRef]
  40. Hunjra, Ahmed Imran, Farida Faisal, and Faiza Gulshion. 2017. The Impact of Cost Leadership Strategy and Financial Management Control Systems on Organizational Performance in Pakistan’s Services Sector. Lahore Journal of Business 6: 1–19. Available online: http://search.ebscohost.com/login.aspx?direct=true&db=bsu&AN=132768389&site=eds-live (accessed on 20 March 2020). [CrossRef]
  41. Hyvönen, Johanna. 2007. Strategy, performance measurement techniques and information technology of the firm and their links to organizational performance. Management Accounting Research 18: 343–66. [Google Scholar] [CrossRef]
  42. Ittner, Christopher D., and David F. Larcker. 1998. Innovations in performance measurement: Trends and research implications. Journal of Management Accounting Research 10: 205–38. [Google Scholar]
  43. Ittner, Christopher D., and David F. Larcker. 2002. Empirical managerial accounting research: Are we just describing management consulting practice? European Accounting Review 11: 787–94. [Google Scholar] [CrossRef]
  44. Jogaratnam, Giri, and Eliza Tse Ching-Yick. 2006. Entrepreneurial orientation and the structuring of organizations: Performance evidence from the Asian hotel industry. International Journal of Contemporary Hospitality Management 18: 454–68. [Google Scholar] [CrossRef]
  45. Joop, Hox, and Timo Bechger. 1999. An Introduction to Structural Equation Modeling. Family Science Review 11: 354–373. [Google Scholar]
  46. Kaplan, Robert S., and David P. Norton. 1996. The Balanced Scorecard: Translating Strategy into Action. Boston: Harvard Business School Press. [Google Scholar]
  47. Kumar, Kamalesh, Ram Subramanian, and Charles Yauger. 1997. Pure Versus Hybrid: Performance Implications of Porter’s Generic Strategies. Health Care Management Review 22: 47–60. [Google Scholar] [CrossRef]
  48. Lamont, Bruce T., Dan Marlin, and James J. Hoffman. 1993. Porter’s generic strategies, discontinuous environments, and performance: A longitudinal study of changing strategies in the hospital industry. Health Services Research 28: 623–40. [Google Scholar]
  49. Lee, Feng-Hui, Tzai-Zang Lee, and Wann-Yih Wu. 2010. The relationship between human resource management practices, business strategy and firm performance: Evidence from steel industry in Taiwan. International Journal of Human Resource Management 21: 1351–72. [Google Scholar] [CrossRef]
  50. Low, Jonathan, and Tony Siesfield. 1998. Measures that matter: Wall Street considers nonfinancial performance measures more than you think. Strategy & Leadership 26: 24–30. [Google Scholar]
  51. Lukason, Oliver, Erkki K. Laitinen, and Arto Suvas. 2019. Growth patterns of small manufacturing firms before failure: Interconnections with financial ratios and nonfinancial variables. International Journal of Industrial Engineering and Management 6: 59–66. Available online: http://search.ebscohost.com/login.aspx?direct=true&db=edselc&AN=edselc.2-52.0-84937694615&site=eds-live (accessed on 20 December 2020).
  52. Melián-González, Santiago, Jacques Bulchand-Gidumal, and Beatriz González López-Valcárcel. 2015. New evidence of the relationship between employee satisfaction and firm economic performance. Personnel Review 44: 906–29. [Google Scholar] [CrossRef]
  53. Miles, Raymond E., and Charles C. Snow. 1978. Organizational Strategy, Structure, and Process. New York: McGraw-Hill. [Google Scholar]
  54. Miles, Raymond E., and Charles C. Snow. 1984. Fit, failure and the hall of fame. California Management Review 26: 10–28. [Google Scholar] [CrossRef]
  55. Miller, Danny. 1988. Relating Porter’s Business Strategies to Environment and Structure: Analysis and Performance Implications. The Academy of Management Journal 31: 280–308. Available online: http://www.jstor.org/stable/256549 (accessed on 25 November 2020).
  56. Murray, Alan I. 1988. A contingency view of Porter’s “Generic Strategies. Academy of Management Review 13. [Google Scholar] [CrossRef]
  57. Musi, Yusef W., E. Mukulu, and Margaret Oloko. 2018. Influence of Strategic Planning to Firm Performance in Agricultural Research Based Institutions of Kenya. Journal of Management and Sustainability 8: 83. Available online: http://search.ebscohost.com/login.aspx?direct=true&db=edshol&AN=edshol.hein.journals.jms8.41&site=eds-live (accessed on 15 January 2020). [CrossRef]
  58. Nathan, Berg. 2005. Non-response bias. In Encyclopedia of Social Measure. Edited by K. Kempf-Leonard. London: Academic Press, vol. 2, pp. 865–73. [Google Scholar]
  59. Nurazi, Ridwan, and Berto Usman. 2015. Public Attention and Financial Information as Determinants of Firms Performance in the Telecommunication Sector. Journal Keuangan Dan Perbankan 19: 235–51. Available online: http://search.ebscohost.com/login.aspx?direct=true&db=edsdoj&AN=edsdoj.3a1f395d524847349a6ffedc8cda985c&site=eds-live (accessed on 10 October 2020).
  60. O’Connor, Neale Gilbert, Chee W. Chow, and Anne Wu. 2004. The adoption of “Western” management accounting/controls in China’s state-owned enterprises during economic transition. Accounting, Organizations and Society 29: 349–75. [Google Scholar] [CrossRef]
  61. Odongo, Nickson Herbert, Daoping Wang, Shaldon Suntu Leparan, and Obadia Bishoge Kyetuza. 2019. Dimensions of organisational performance: A review. International Journal Manufacturing Technology and Management 33: 114–29. [Google Scholar] [CrossRef]
  62. Olwande, Pauline. 2012. The Application of Porter’s Generic Business Strategies and Performance of Pharmaceutical Wholesalers in Kenya. Master’s thesis, Master of Business Administration, School of Business, University of Nairobi, Nairobi, Kenya. [Google Scholar]
  63. Phadoongsitthi, Monvika. 2003. The Role of Management Accounting in Emerging Economies: An Empirical Study of Thailand’. Ph.D. thesis, University of Maryland, College Park, MD, USA. [Google Scholar]
  64. Phadoongsitthi, Monvika. 2005. Management Accounting Practices, Concepts, and Cultures. Journal of Accounting Profession 1: 20–31. [Google Scholar]
  65. Ping, Robert, Jr. 2004. On assuring valid measures for theoretical models using survey data. Journal of Business Research 57: 125–41. [Google Scholar] [CrossRef]
  66. Porter, Michael E. 1985. Competitive Advantage: Creating and Sustaining Superior Performance. New York: Free Press. [Google Scholar]
  67. Premkumar, G., and Katikireddy Ramamurthy. 1995. The Role of Inter-organizational and Organizational Factors on the Decision Mode for the Adoption of Inter-organizational Systems. Decision Sciences 26: 303–36. [Google Scholar] [CrossRef]
  68. Pulaj, Enida, Vasilika Kume, and Amali Cipi. 2015. The impact of generic competitive strategies on organizational performance: The evidence from Albanian context. European Scientific Journal 11: 273–84. [Google Scholar]
  69. Ringov, Dimo, and Maurizio Zollo. 2007. The impact of national culture on corporate social performance. Corporate Governance 7: 476–85. [Google Scholar] [CrossRef]
  70. Saidat, Zaid, Mauricio Silva, and Claire Seaman. 2019. The relationship between corporate governance and financial performance: Evidence from Jordanian family and nonfamily firms. Journal of Family Business Management 9: 54–78. [Google Scholar] [CrossRef]
  71. Scapens, Robert W., and Mostafa Jazayeri. 2003. ERP Systems and Management Accounting Change: Opportunities or Impacts? A Research Note. European Accounting Review 12: 201–33. [Google Scholar] [CrossRef]
  72. Scarbrough, Paul, Alfred J. Nanni, and Michiharu Sakurai. 1991. Japanese management accounting practices and the effects of assembly and process automation. Management Accounting Research 2: 27–46. [Google Scholar] [CrossRef]
  73. Schuler, Randall S., and Susan E. Jackson. 1987. Linking Competitive Strategies with Human Resource Management Practices. The Academy of Management Executive (1987–1989) 1: 207–19. Available online: http://www.jstor.org/stable/4164753 (accessed on 15 September 2020). [CrossRef]
  74. Silveira, Alexandre Di Miceli. 2019. The Employee Is Always Right: Employee Satisfaction and Corporate Performance in Brazil. Revista de Administração Contemporânea 23: 739–64. [Google Scholar] [CrossRef]
  75. Simon, Daniel H., and Miguel I. Gómez. 2014. Customer satisfaction, competition, and firm performance: An empirical investigation. Managerial and Decision Economics 35: 371–86. [Google Scholar] [CrossRef]
  76. Škrinjar, Rok, Vesna Bosilj-Vukšić, and Mojca Indihar-Štemberger. 2008. The impact of business process orientation on financial and non-financial performance. Business Process Management Journal 14: 738–54. [Google Scholar] [CrossRef]
  77. Statista Research Department. 2020. Gross Domestic Product (GDP) Contribution in Thailand in 2020, by Sector. Available online: https://www.statista.com/statistics/1023315/thailand-gdp-value-contribution-by-sector (accessed on 15 September 2021).
  78. Sulaiman, Suzana, Aliza Ramli, and Falconer Mitchell. 2008. What Factors Drive Change in Management Accounting in Malaysian Organisations? Malaysian Accounting Review 7: 61–76. [Google Scholar]
  79. Tavitiyaman, Pimtong, Hailin Qu, and Hanqin Zhang Qiu. 2011. The impact of industry force factors on resource competitive strategies and hotel performance. International Journal of Hospitality Management 30: 648–57. [Google Scholar] [CrossRef]
  80. Toepoel, Vera, and Matthias Schonlau. 2017. Dealing with nonresponse: Strategies to increase participation and methods for postsurvey adjustments. Mathematical Population Studies 24: 79–83. [Google Scholar] [CrossRef] [Green Version]
  81. Towler, Annette, Daniel V. Lezotte, and Michael J. Burke. 2011. The service climate-firm performance chain: The role of customer retention. Human Resource Management 50: 391–406. [Google Scholar] [CrossRef]
  82. Watkins, Ann L. 2000. Hospital financial ratio classification patterns revisited: Upon considering nonfinancial information. Journal of Accounting and Public Policy 19: 73–95. Available online: http://search.ebscohost.com/login.aspx?direct=true&db=edsbl&AN=RN077117398&site=eds-live (accessed on 20 August 2020). [CrossRef]
  83. Wegmann, Grégory, and Evelyne Poincelot. 2012. Non-Financial Indicators and Strategic Management Accounting in Best Practices in Management Accounting. Macmillan: Palgrave. [Google Scholar] [CrossRef]
  84. Wei, Yinghong Susan, Saeed Samiee, and Ruby P. Lee. 2014. The influence of organic organizational cultures, market responsiveness, and product strategy on firm performance in an emerging market. Journal of the Academy of Marketing Science 42: 49–70. [Google Scholar] [CrossRef]
  85. Weston, Rebecca, and Paul A. Gore. 2006. SEM 101: A brief guide to structural equation modeling. The Counseling Psychologist 34: 719–51. [Google Scholar] [CrossRef]
  86. Wu, Junjie, Agyenim Boateng, and Colin Drury. 2007. An analysis of the adoption, perceived benefits, and expected future emphasis of western management accounting practices in Chinese SOEs and JVs. The International Journal of Accounting 42: 171–85. [Google Scholar] [CrossRef]
  87. Xydias-Lobo, Maria, David Forsaith, and Carol Tilt. 2004. The future of management accounting: A South Australian perspective. Journal of Management Accounting Research 2: 55–70. [Google Scholar]
  88. Yoshikawa, Takeo, John Innes, and Falconer Mitchell. 1994. Applying functional cost analysis in a manufacturing environment. International Journal of Production Economics 36: 53–64. [Google Scholar] [CrossRef]
Figure 1. Theoretical framework and hypotheses (10 latent variables: BS = business strategy; BG = business goal; TMAS = traditional management accounting system; TMAS1 = costing system; TMAS2 = budgeting; TMAS3 = evaluation; TMAS4 = information for decision; SMAS = strategic management accounting system; FP = financial performance; NFP = non-financial performance). Source: Compiled by the authors.
Economies 09 00149 g001
Figure 2. Management accounting tool model. Source: Compiled by the authors. ns: non-significant.
Economies 09 00149 g002
Table 1. Key variables used in this study.
Independent VariablesMediated VariablesDependent Variables
  • Business strategies (BS)
2.
Business goals (BG)
3.
Traditional management accounting system (TMAS)
4.
Strategic management accounting system (SMAS)
5.
Financial performance (FP)
6.
Non-financial performance (NFP)
-
Cost leadership (BS1)
-
Differentiation (BS2)
-
Focus (BS3)
-
Increase profitability (BG1)
-
Competitive advantage (BG2)
-
Business sustainability (BG3)
-
Shareholders’ wealth (BG4)
-
Innovative leadership (BG5)
-
Industrial leadership (BG6)
-
Change leadership (BG7)
-
Technology leadership (BG8)
-
Stakeholder’s satisfaction (BG9)
-
Costing system1 (TMAS1)
-
Budgeting2 (TMAS2)
-
Performance evaluation3 (TMAS3)
-
Information for decision making4 (TMAS4)
-
Value chain (SMAS1)
-
Transfer pricing (SMAS2)
-
Shareholder value analysis (SMAS3)
-
Industry analysis (SMAS4)
-
Analysis of competitive (SMAS5)
-
Product life cycle (SMAS6)
-
Suppliers’ and/or customers’ value chains (SMAS7)
-
Competitor strengths and weaknesses (SMAS8)
-
Activity-based management (SMAS9)
-
TQM (SMAS10)
-
JIT (SMAS11)
-
Target costing (SMAS12)
-
Lean management (SMAS13)
-
Long-range forecasting (SMAS14)
-
Return on assets (FP1)
-
Return on equity (FP2)
-
Customer satisfaction (NFP1)
-
Employee satisfaction (NFP2)
-
Policy implementation (NFP3)
-
Communication among divisions (NFP4)
-
Employee efficiency (NFP5)
-
Internal control efficiency (NFP6)
-
Regulatory compliance (NFP7)
Source: Compiled by the authors.
Table 2. Descriptive variables of the samples.
Independent VariablesMediated VariablesDependent Variables
BS: Business StrategyTMAS: Traditional Management Accounting SystemFP: Financial Performance
TMAS1TMAS2TMAS3TMAS4
Mean 3.05;
SD. 0.94
Mean 3.23;
SD. 0.90
Mean 3.22;
SD. 0.95
Mean 3.42;
SD. 1.05
Number of SamplesMeanRatio (SD.)
BS1n = 132 (64.39%)CS13.29B14.25E12.82ID13.64FP10.05 (0.10)
BS2n = 76 (37.07%)CS23.60B24.17E23.92ID23.01FP20.13 (0.55)
BS3n = 97 (47.32%)CS32.73B32.80E33.38ID33.55
CS43.33B43.73E43.43ID43.78
CS53.47B52.81E53.07ID52.83
CS62.79B62.68E63.21ID63.11
CS72.17B72.18E73.13ID74.14
E82.77ID83.71
ID93.02
BG: Business GoalSMAS: Strategic Management Accounting System
(Mean 3.07; SD. 1.38)
NFP: Non-Financial Performance
MeanMeanMean% (SD.)
BG14.48 (0.66) SMAS12.48SMAS83.27 NFP186.06% (14.28)
BG24.10 (0.91) SMAS22.49SMAS92.71 NFP283.13% (15.94)
BG34.03 (0.77) SMAS33.05SMAS103.43 NFP382.75% (63.04)
BG43.99 (0.84) SMAS43.03SMAS113.26 NFP478.55% (13.13)
BG53.97 (0.90) SMAS53.16SMAS123.51 NFP577.99% (12.22)
BG63.85 (0.86) SMAS62.79SMAS133.64 NFP677.91% (12.88)
BG73.78 (0.95) SMAS72.58SMAS143.58 NFP772.29% (15.84)
BG83.64 (0.88)
BG93.61 (0.85)
Source: Compiled by the authors.
Table 3. Direct and indirect effects of BS and BG on FP and NFP.
Exogenous VariableR-SquareEffectRegression Coefficients of Independent Studies
BSBGTMASSMAS
FP0.161Direct0.0000.000−0.180 ns0.542 **
Indirect0.1190.0850.0000.000
Total0.1190.085−0.1800.542
NFP0.130Direct0.0000.000N/A0.360 **
Indirect0.1170.081N/A0.000
Total0.1170.081N/A0.360
** Significant at the 0.05 level. BS = business strategies; BG = business goals; ns: non-significant.
Publisher’s Note: MDPI stays neutral with regard to jurisdictional claims in published maps and institutional affiliations.

