
The Response of Housing Construction to a Copper Price Shock in Chile (2009–2020)


Abstract
:1. Introduction
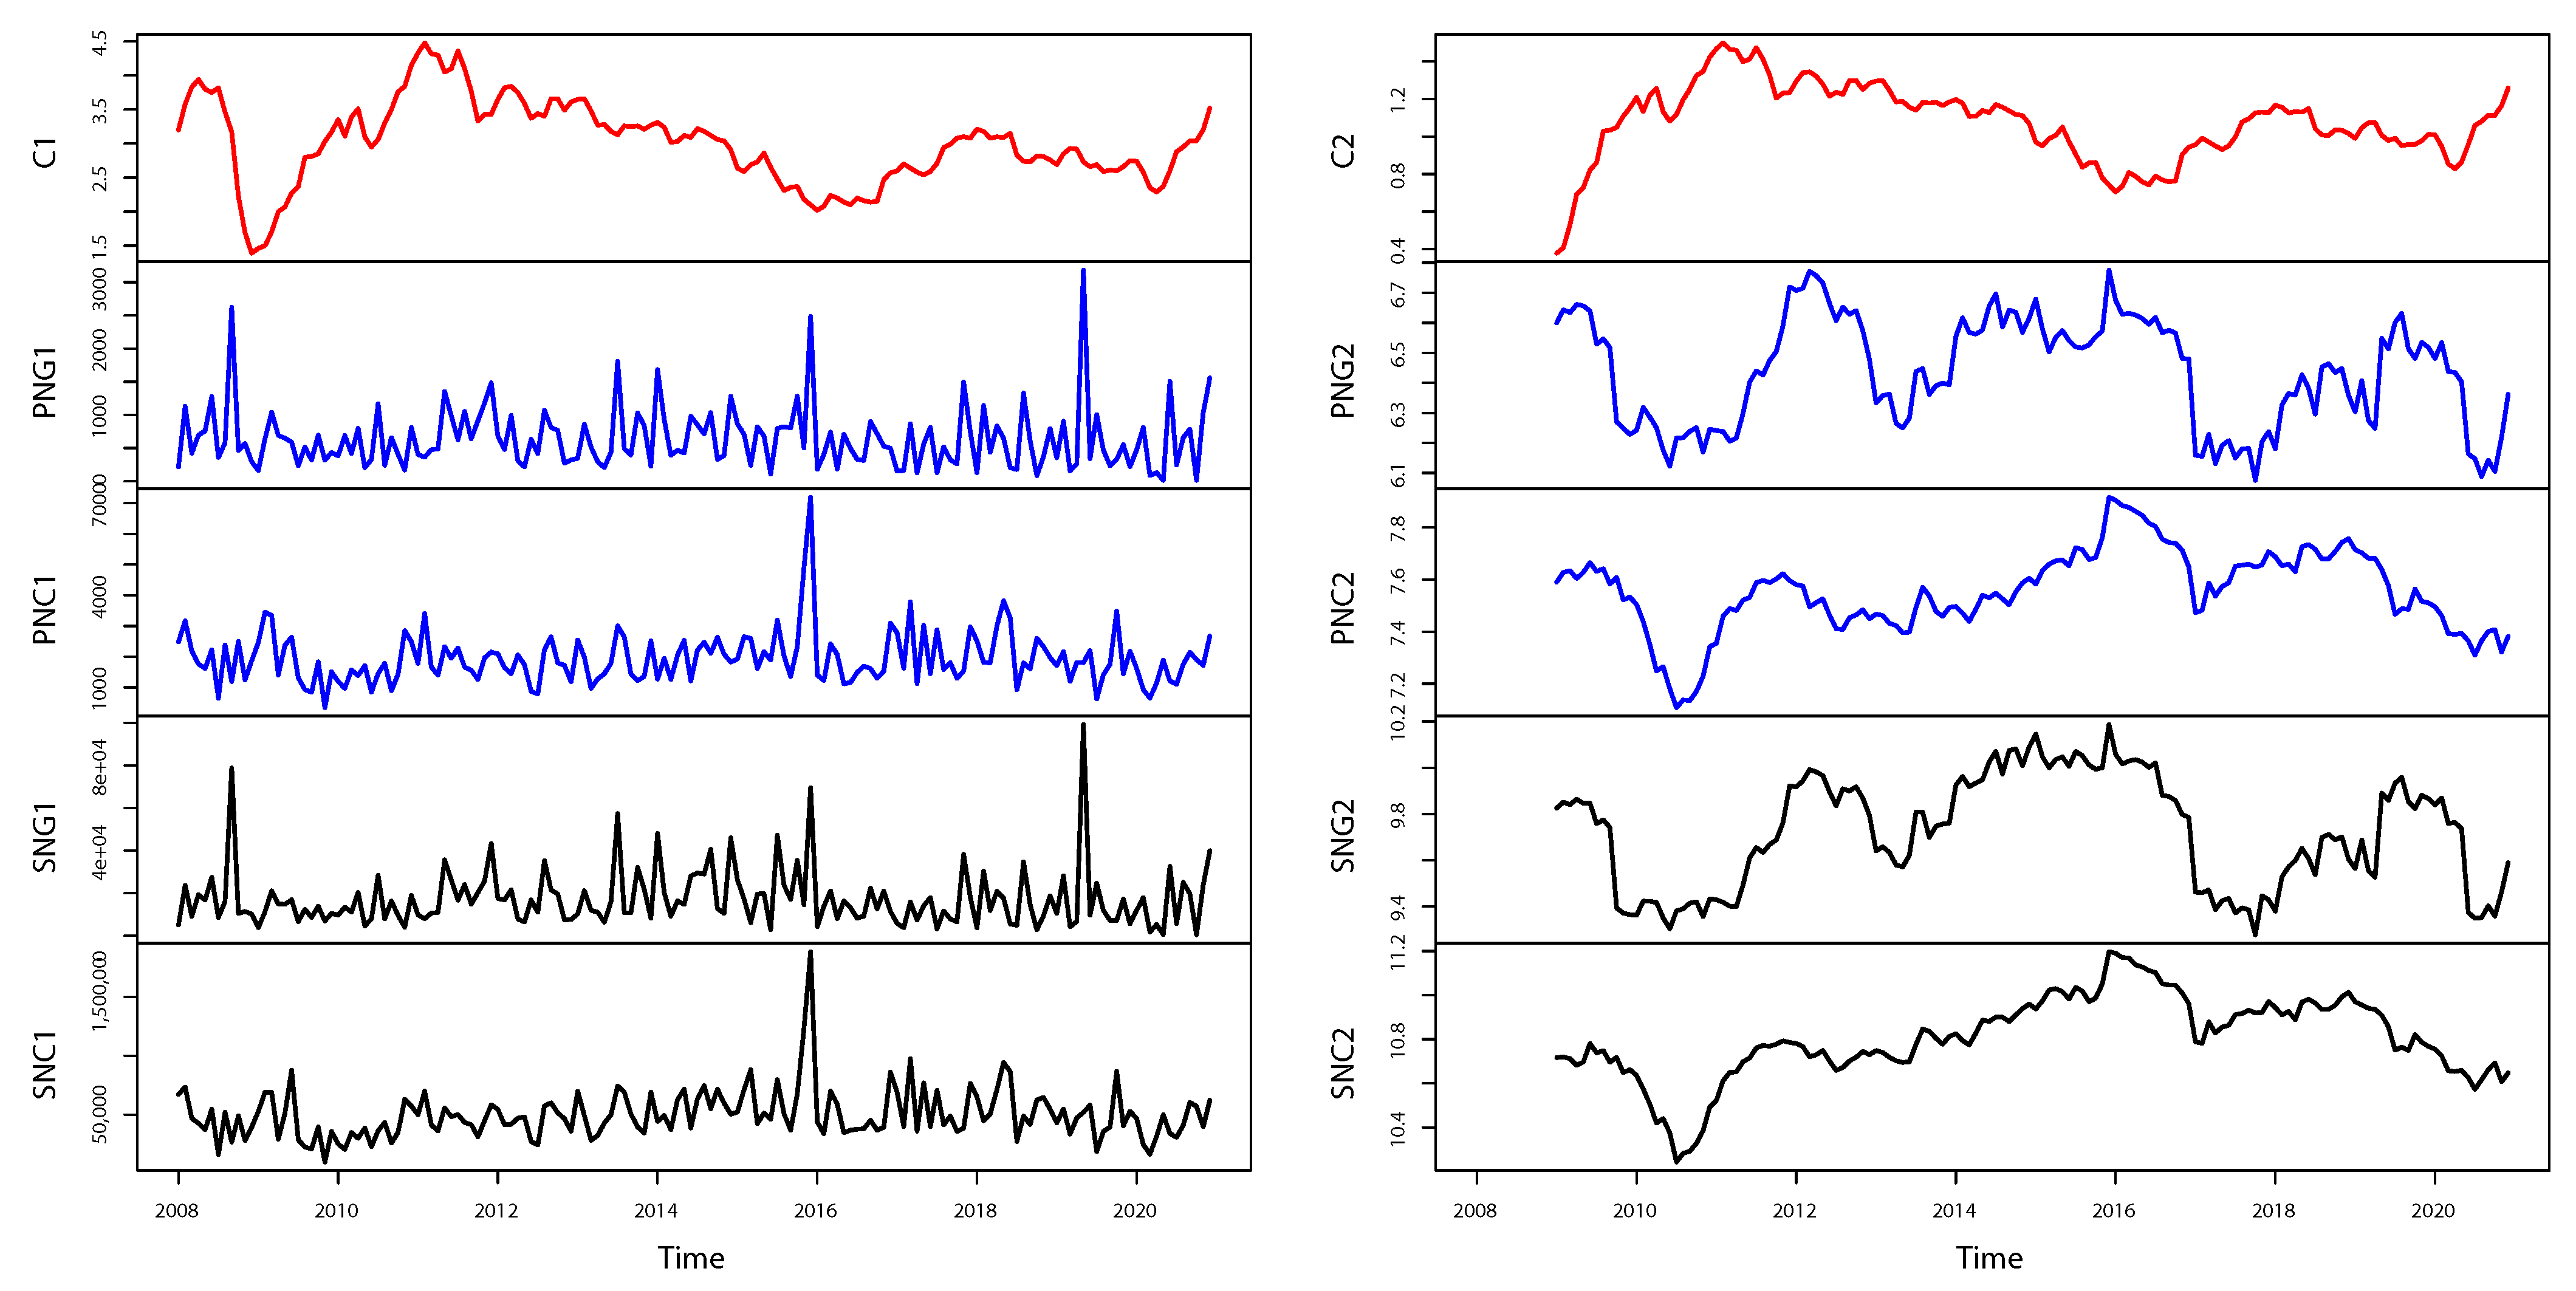
2. Data Description
- House building permit data are useful because permits precede real or effective real estate investment. Idrovo and Lozano (2018) showed statistically that the average time from permit granting until construction start (real or effective investment) is around 12 months for the regions that concentrate mining activity in Chile. For its part, the copper price is among the primary transmission channels of external shocks in the Chilean economy. Therefore, it functions as an early economic warning indicator.
- All public and private institutions involved in real estate activity in Chile can benefit from this database. In particular, the VAR model used here enables systematic measurement of how the copper price impacts housing construction progress in north Chile, which hosts the world’s main copper deposits. Therefore, higher mining activity could be related to potentially higher demand for real estate, resembling the scenario of the 2011 mining boom.
- An additional value of the data is that they are of high frequency, easily accessible, and provided by official sources. They are published monthly by local and international organizations of high technical prestige. This allows the impulse-response functions of the VAR model, estimated here, to be a source of additional information for policymakers who make decisions on housing.
3. Methods
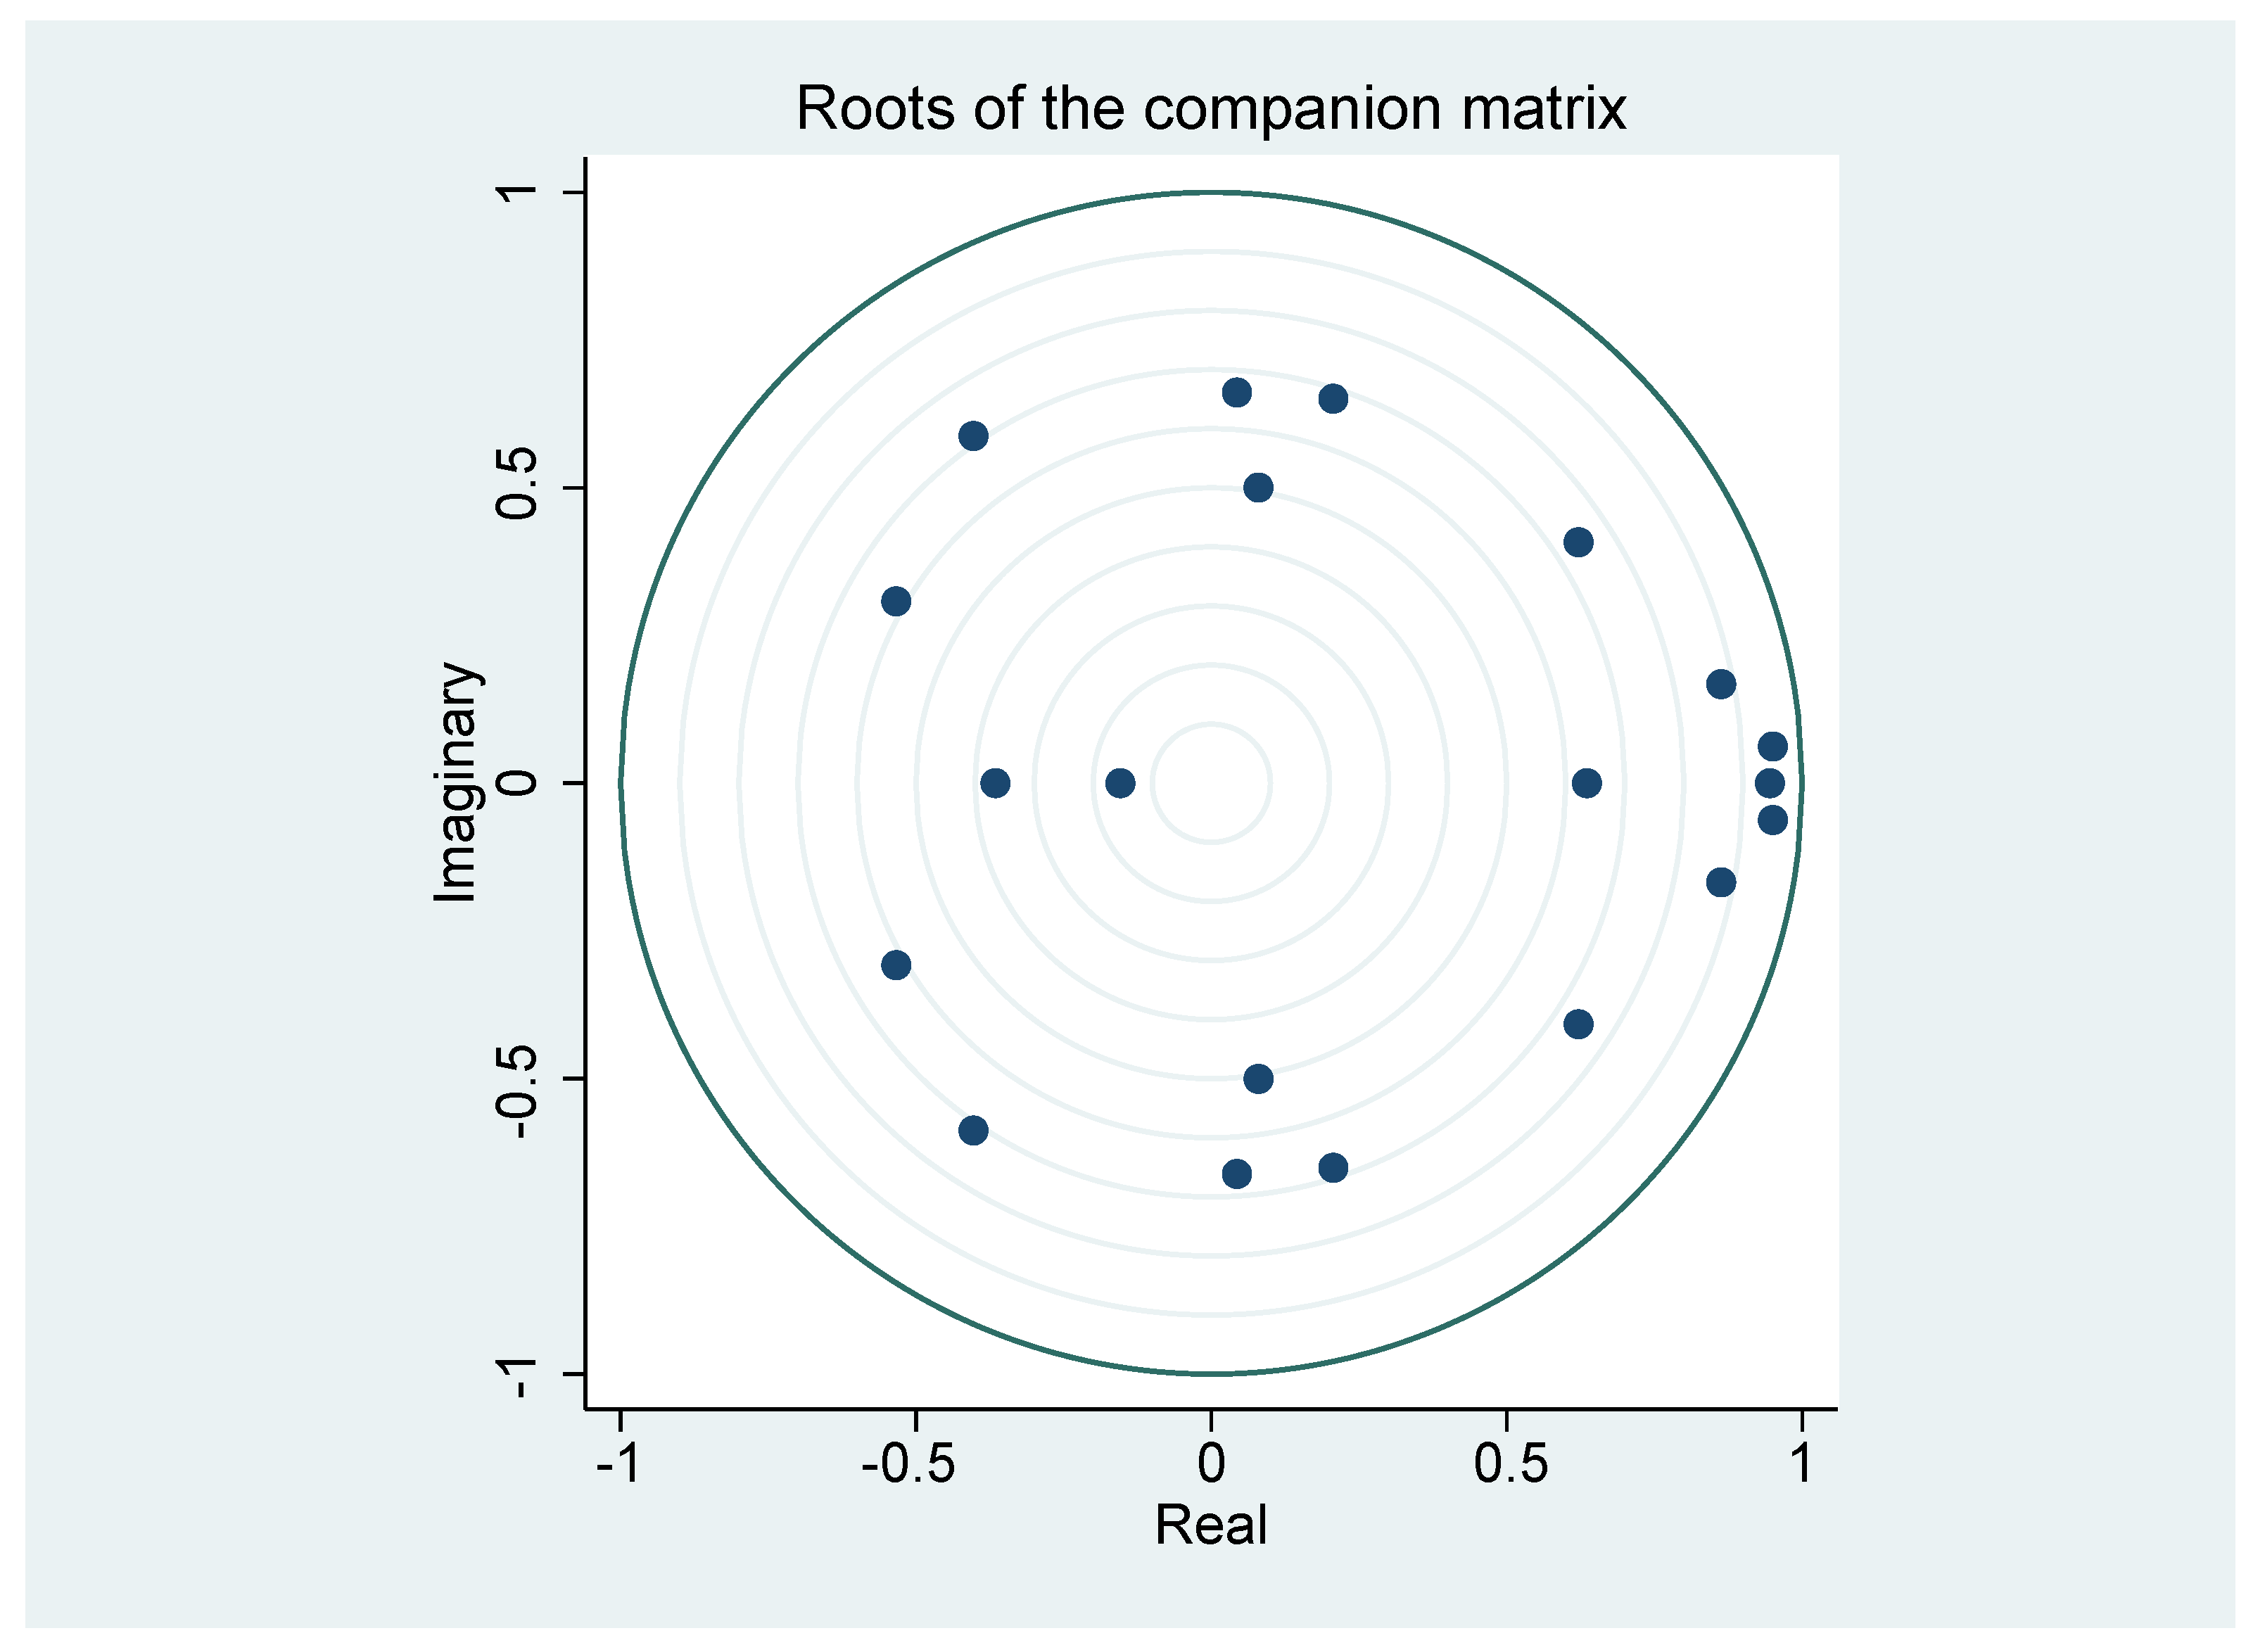
3.1. The VAR Model
3.2. Impulse-Response Function
4. Results
5. Conclusions
Supplementary Materials
Author Contributions
Funding
Institutional Review Board Statement
Informed Consent Statement
Data Availability Statement
Acknowledgments
Conflicts of Interest
References
- Akaike, Hirotugu. 1974. A new look at the statistical model identification. IEEE Transactions on Automatic Control 19: 716–23. [Google Scholar] [CrossRef]
- Astudillo, Gabriel, Raúl Carrasco, Christian Fernández-Campusano, and Máx Chacón. 2020. Copper Price Prediction Using Support Vector Regression Technique. Apply Science 10: 6648. [Google Scholar] [CrossRef]
- Banco Central de Chile. 2018. Recuadro III.2: Inversión Minera. Informe de Política Monetaria. Santiago, Chile. Available online: https://www.bcentral.cl/c/document_library/get_file?uuid=82f8c4f9-f92a-572e-a52e-5ecafdfc66f1&groupId=33528 (accessed on 4 June 2021).
- Banco Central de Chile. 2021. Cuentas Nacionales de Chile. Compilación de Referencia. Santiago, Chile. Available online: http://www.bcch.cl (accessed on 28 February 2021).
- Cámara Chilena de la Construcción. 2011. Informe de Macroeconomía y Construcción (MACh 34). Santiago, Chile. Available online: https://www.cchc.cl/centro-de-informacion/otros/publicaciones-mach/informe-mach-34-8 (accessed on 28 February 2021).
- Cámara Chilena de la Construcción. 2019. Informe de Caracterización de los Trabajadores de la Construcción. Santiago, Chile. Available online: https://extension.cchc.cl/datafiles/45342-2.pdf (accessed on 4 June 2021).
- Cámara Chilena de la Construcción. 2021. Informe de Macroeconomía y Construcción (No. 56). Santiago, Chile. Available online: https://cchc.cl/centro-de-informacion/publicaciones/publicaciones-mach/informe-mach-56 (accessed on 4 June 2021).
- Carrasco, Raúl, Christian Fernández-Campusano, Ismael Soto, Carolina Lagos, Nicolas Krommenacker, Leonardo Banguera, and Claudia Durán. 2020. Copper Price Variation Forecasts Using Genetic Algorithms. In International Conference on Applied Technologies. Cham: Springer, pp. 284–96. [Google Scholar]
- Centro de Sistema Públicos. 2019. El superciclo del cobre y sus efectos en la Región de Antofagasta. Santiago: Ingeniería Industrial, Universidad de Chile, Available online: https://consejominero.cl/wp-content/uploads/2019/08/El-superciclo-del-cobre-y-sus-efectos-en-la-Región-de-Antofagasta.pdf (accessed on 4 June 2021).
- Chen, Xiangyu, and Jittima Tongurai. 2021. The Relationship Between China’s Real Estate Market and Industrial Metals Futures Market: Evidence from Non-price Measures of the Real Estate Market. Asia-Pacific Financial Markets. in press. [Google Scholar] [CrossRef]
- Chung, Ching-Fan. 2001. Calculating and analyzing impulse responses for the vector ARFIMA model. Economics Letters 71: 17–25. [Google Scholar] [CrossRef]
- Comisión Chilena del Cobre. 2021. Ministerio de Minería, Gobierno de Chile. Santiago, Chile. Available online: https://www.cochilco.cl (accessed on 28 February 2021).
- Contreras-Reyes, Javier E. 2021. Mutual information matrix based on asymmetric Shannon entropy for nonlinear interactions of time series. Nonlinear Dynamics 104: 3913–24. [Google Scholar] [CrossRef]
- Contreras-Reyes, Javier E., and Byron J. Idrovo-Aguirre. 2020. Backcasting and forecasting time series using detrended cross-correlation analysis. Physica A 560: 125109. [Google Scholar] [CrossRef]
- Contreras-Reyes, Javier E., and Carola Hernández-Santoro. 2020. Assessing Granger-causality in the southern Humboldt current ecosystem using cross-spectral methods. Entropy 22: 1071. [Google Scholar] [CrossRef] [PubMed]
- Contreras-Reyes, Javier E., and Wilfredo Palma. 2013. Statistical analysis of autoregressive fractionally integrated moving average models in R. Computational Statistics 28: 2309–31. [Google Scholar] [CrossRef] [Green Version]
- Corporación de Fomento de la Producción (Corfo). 2021. División territorial de la Corporación de Fomento de la Producción. Santiago, Chile. Available online: https://www.corfo.cl (accessed on 28 February 2021).
- Devlin, James Francis. 2002. An analysis of choice criteria in the home loans market. International Journal of Bank Marketing 20: 212–26. [Google Scholar] [CrossRef]
- Dickey, D. A., and W. A. Fuller. 1979. Distribution of the estimates for autoregressive time series witha unit root. Journal of the American Statistical Association 74: 427–31. [Google Scholar]
- Hamilton, J. 1994. Time Series Analysis. Princeton: Princeton University Press. [Google Scholar]
- Idrovo, Byron, and Francisco Javier Lozano. 2018. ¿Cuánto Tardan los Permisos de Edificación habitacional en Iniciar Obras? Caso Chile. Documento de Trabajo No. 86. Santiago: Cámara Chilena de la Construcción. [Google Scholar]
- Idrovo-Aguirre, Byron J., and Javier E. Contreras-Reyes. 2019. Backcasting cement production and characterizing cement’s economic cycles for Chile 1991–2015. Empirical Economics 57: 1829–52. [Google Scholar] [CrossRef]
- Idrovo-Aguirre, Byron J., and Javier E. Contreras-Reyes. 2021. Bayesian monthly index for building activity based on mixed frequencies: The case of Chile. Journal of Economic Studies. in press. [Google Scholar] [CrossRef]
- Instituto Nacional de Estadísticas. 2021. Santiago, Chile. Available online: https://www.ine.cl (accessed on 28 February 2021).
- International Monetary Fund. 2021. World Economic Outlook Update. Washington, DC: International Monetary Fund, Available online: https://www.imf.org (accessed on 28 February 2021).
- Kirchner, Markus, Jorge Fornero, and Andrés Yany. 2016. Terms of Trade Shocks and Investment in Commodity-Exporting Economies. Working Papers No. 773. Santiago: Banco Central de Chile, Available online: https://ideas.repec.org/p/chb/bcchwp/773.html (accessed on 4 June 2021).
- Maleki, Mohsen, Darren Wraith, Mohammad R. Mahmoudi, and Javier E. Contreras-Reyes. 2020. Asymmetric heavy-tailed vector auto-regressive processes with application to financial data. Journal of Statistical Computation and Simulation 90: 324–40. [Google Scholar] [CrossRef]
- Medina, Juan Pablo, and Claudio Soto. 2007. Copper Price, Fiscal Policy and Business Cicle in Chile. Documento de Trabajo No. 458. Santiago: Banco Central de Chile. [Google Scholar]
- Oficina de Planificación Nacional. 2021. Ministerio de Desarrollo Social y Familia. Santiago, Chile. Available online: https://www.desarrollosocialyfamilia.gob.cl (accessed on 28 February 2021).
- Ozcelebi, Oguzhan. 2021. Assessing the impacts of global economic policy uncertainty and the long-term bond yields on oil prices. Apply Economics Analysis. in press. [Google Scholar] [CrossRef]
- Phillips, Peter C. B., and Pierre Perron. 1988. Testing for a unit root in time series regression. Biometrika 75: 335–46. [Google Scholar] [CrossRef]
- Zivot, Eric, and Donald W. K. Andrews. 2002. Further evidence on the great crash, the oil-price shock, and the unit-root hypothesis. The Journal of Business and Economic Statistics 20: 25–44. [Google Scholar] [CrossRef]


| Variables (VAR Model) | Abbreviation | Short Description | Resource |
|---|---|---|---|
| C2: Logarithm of the copper price. | The copper price is measured in USD per pound, and its value as listed on the London Metal Exchange. | BCCh | |
| PNG2: Logarithm of the 12-month moving average of the number of housing permits approved in the northern zone. | Number of permits approved by municipalities for residential construction (northern zone). | INE | |
| SNG2: Logarithm of the 12-month moving average of the area (m2) authorized for housing construction in the northern zone. | Area approved by municipalities for housing construction (northern zone). | INE | |
| PNC2: Logarithm of the 12-month moving average of the number of approved housing permits in the north-central zone. | Number of permits approved by municipalities for housing construction (north-central zone). | INE | |
| SNC2: Logarithm of the 12-month moving average of the area (m2) authorized for housing construction in the north-central zone. | Area approved by municipalities for housing construction (north-central zone). | INE |
| Levels (a) | Levels (b) | Difference (a) | ||||||
|---|---|---|---|---|---|---|---|---|
| Indicators | DFA | PP | ZA | DFA | PP | ZA | DFA | PP |
| −2.91 | −3.38 | −4.96 | −3.48 | −3.93 | −4.91 | −7.09 | −8.17 | |
| −2.88 | −2.88 | −4.68 | −2.86 | −2.89 | −4.63 | −4.84 | −12.02 | |
| −2.26 | −2.29 | −3.77 | −2.26 | −2.28 | −3.71 | −4.67 | −11.96 | |
| −2.07 | −1.90 | −3.23 | −2.11 | −1.87 | −3.41 | −7.70 | −9.84 | |
| −1.64 | −1.53 | −2.92 | −1.50 | −1.35 | −3.51 | −7.61 | −9.83 | |
| Critical Value | ||||||||
| 1% | −3.50 | −3.50 | −5.34 | −4.03 | −4.03 | −5.57 | −3.50 | −3.50 |
| 5% | −2.89 | −2.89 | −4.80 | −3.45 | −3.44 | −5.08 | −2.89 | −2.89 |
| Lag (p) | LL | LR | FPE | AIC | BIC |
|---|---|---|---|---|---|
| 0 | 603.475 | - | 1.3 × 10⁻¹⁰ | −8.61116 | −8.5056 |
| 1 | 1384.07 | 1561.2 | 2.4 × 10⁻¹⁵ | −19.4831 | −18.8497 * |
| 2 | 1410.6 | 53.059 | 2.3 × 10⁻¹⁵ | −19.5051 | −18.344 |
| 3 | 1440.3 | 59.395 | 2.2 × 10⁻¹⁵ | −19.5727 | −17.8838 |
| 4 | 1468.86 | 57.126 | 2.1 × 10⁻¹⁵ * | −19.6239 * | −17.4072 |
| 5 | 1491.97 | 46.213 * | 2.2 × 10⁻¹⁵ | −19.5967 | −16.8522 |
| Sample: May 2009–December 2020 | No. of Observations = 140 | ||||
|---|---|---|---|---|---|
| Log-likelihood = 1475.396 | AIC = −19.57708 | ||||
| FPE = 2.19 × 10⁻¹⁵ | BIC = −17.37085 | ||||
| = 4.83 × 10⁻¹⁶ | |||||
| Variable | No. Parameters | RMSE | R2 | χ2 | |
| 21 | 0.040717 | 0.9569 | 3109.384 | 0.0000 | |
| 21 | 0.074309 | 0.8555 | 829.0199 | 0.0000 | |
| 21 | 0.083274 | 0.9011 | 1275.525 | 0.0000 | |
| 21 | 0.043851 | 0.9346 | 2000.234 | 0.0000 | |
| 21 | 0.040084 | 0.9612 | 3471.823 | 0.0000 | |
Publisher’s Note: MDPI stays neutral with regard to jurisdictional claims in published maps and institutional affiliations. |
© 2021 by the authors. Licensee MDPI, Basel, Switzerland. This article is an open access article distributed under the terms and conditions of the Creative Commons Attribution (CC BY) license (https://creativecommons.org/licenses/by/4.0/).
Share and Cite
Idrovo-Aguirre, B.J.; Contreras-Reyes, J.E. The Response of Housing Construction to a Copper Price Shock in Chile (2009–2020). Economies 2021, 9, 98. https://doi.org/10.3390/economies9030098
Idrovo-Aguirre BJ, Contreras-Reyes JE. The Response of Housing Construction to a Copper Price Shock in Chile (2009–2020). Economies. 2021; 9(3):98. https://doi.org/10.3390/economies9030098
Chicago/Turabian StyleIdrovo-Aguirre, Byron J., and Javier E. Contreras-Reyes. 2021. "The Response of Housing Construction to a Copper Price Shock in Chile (2009–2020)" Economies 9, no. 3: 98. https://doi.org/10.3390/economies9030098
APA StyleIdrovo-Aguirre, B. J., & Contreras-Reyes, J. E. (2021). The Response of Housing Construction to a Copper Price Shock in Chile (2009–2020). Economies, 9(3), 98. https://doi.org/10.3390/economies9030098