Abstract
This study aims to assess the protection for Vietnamese agriculture under trade liberalization based on the input–output approach. From a theoretical perspective, the authors develop a general framework to estimate the effective rate of protection using an input–output table, taking into account tariffs, subsidies and value-added tax. Based on the data of 2012 and 2016, with a projection to 2020, the empirical results reveal that agricultural production, which is considered as Vietnam’s comparative advantage, is insignificantly protected. From the year 2012 to 2016, the effective rate of protection declined for primary agriculture and its supporting sectors, and would become negative by 2020. This implies that Vietnamese farmers are at a disadvantage due to the effect of trade liberalization. Furthermore, it is empirically revealed that the primary agricultural sector has a high value-added multiplier, which means a significant contribution to the domestic economy, is not protected by the government’s tax and tariff policies. Based on the study results, the authors suggest some policy recommendations to improve the situation, which are focused on the reduction of the value-added tax rate on inputs, while making industries with a high spillover effect to the domestic economy a key priority.
Keywords:
effective rate of protection; agriculture; trade liberalization; value-added multiplier; I-O table; Vietnam JEL Classification:
F14; Q17; Q18
1. Introduction
Vietnam has accelerated the process of economic integration and trade liberalization since 2007, when it became an official member of the World Trade Organization (WTO). Since then, Vietnam has continuously joined numerous bilateral and multilateral free trade agreements (FTAs) with other countries and regions, such as Vietnam–ASEAN–China, Vietnam–ASEAN–Japan, Vietnam–EU, Vietnam–Korea, Vietnam–EAEU, and the Comprehensive and Progressive Agreement for Trans-Pacific Partnership (CPTPP). This provides great export opportunities for Vietnamese goods, but at the same time, domestic production faces increasing competition pressure, and agriculture is a sector of high vulnerability because of trade liberalization. At present, nearly 40 percent of the labor force of Vietnam is engaged in agricultural activities; thus, agriculture requires special attention and protection from the government.
Bureau et al. (2005) have highlighted the contrasting interests of various types of developing countries faced with the perspective of trade liberalization in the agricultural sector. For most middle-income developing countries, liberalization can be a source of substantial growth in prospects and prices for a relatively high performing export sector. For poorer countries, trade liberalization could be harmful for agriculture, and rising import prices and the erosion of preferences have darkened the picture considerably.
Vietnam’s agricultural sector is not only at a disadvantage due to the effect of tariff reduction and elimination, but also faces great challenges of low labor productivity. Figure 1 shows that labor productivity in Vietnamese agriculture is very low compared to other countries in the region. By 2018, agriculture value added per worker in Vietnam was only 1212 USD (at a 2010 constant price), which is lower than the average level of lower-middle income countries, less than half of the world average level, and is much lower than the levels of the main trading partners in the region, such as China, Indonesia, and Thailand.
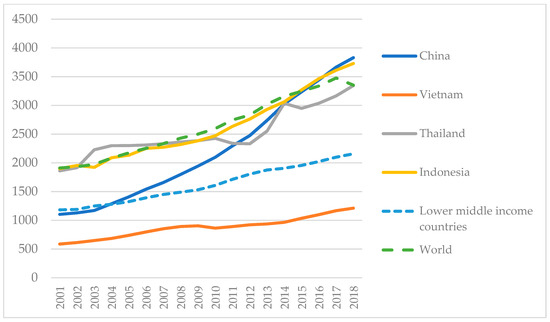
Figure 1.
Agriculture value added per worker in Vietnam and some other countries in the period of 2000–2018, constant price in 2010 USD. Source: compiled by the authors based on World Development Indicators data.
Moreover, Vietnam’s agricultural total factor productivity (TFP) has improved insignificantly and was unstable during the period of 2000–2015 (see Figure 2). By contrast, China, the major trading partner of Vietnam for agricultural products, has spiked its agricultural TFP for this period. Thus, the current state of the agricultural sector of Vietnam requires policymakers to offer solutions to increase its competitiveness. At the same time, reasonable trade protection measures are required, including tariff and tax policies, and other preferential treatments to the agricultural sector.
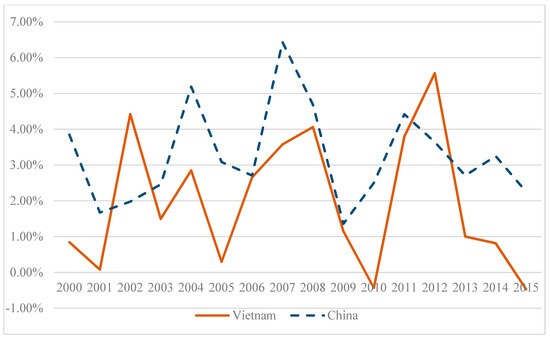
Figure 2.
Annual total factor productivity (TFP) growth in Vietnam and China in the period of 2000–2015. Source: compiled by the authors based on USDA ERS—International Agricultural Productivity data.
Economists have struggled with developing an efficient measure of protectionism due to the fact that value-weighted averages of tariffs have long been known to be theoretically unsound and usually plagued by serious bias (Rodriguez and Rodrik 1999; Chen et al. 2017). The level and effectiveness of protection are not simply determined by the nominal rate of protection (NRP), but instead by the effective rate of protection (ERP) for sectors in the economy (Corden 1966; Balassa 1965). The distinction between nominal and effective protection is that the former measures the extent to which the tariff raises the domestic price of a producer’s output, whereas the latter indicates the extent to which the producer’s value-added is enhanced, taking into account any tariff on importable intermediate inputs and the share of the industry’s value-added in the value of the final output (Anderson 2003).
The ERP concept is considered a practical way of indicating more appropriately the level of industry protection against import competition, not only in aggregate for a country, but also—and more importantly—between industries within a country.
In Vietnam, there are many empirical studies on the effective levels of trade protection, such as Bui (2010), Lam et al. (2013), Athukorala (2006) and Pham (2007). The results of these studies are quite consistent in concluding that Vietnam tends to protect any industrial sector but does not have a focused protection policy for the sectors that most influence the economy. Moreover, in these studies the measure of effective protection considers only the tax barrier but ignores other influencing factors.
In this study, we develop a theoretical framework for analyzing the impact of import duties at the same time as the impact of value-added tax (VAT) and subsidies policy on effective protection levels. In terms of empirical calculations, due to limited information, when calculating the effective protection level, we only include the impact of VAT. On that basis, we estimate the effective protection rates for Vietnamese agricultural industries using data from I–O tables in the years of 2012 and 2016, with a projection to 2020. Moreover, we use the concept of value-added multiplier to indicate the role of a given industry in the domestic economy. Based on the study results, we propose some policy recommendations.
This study is structured into four parts: (i) Introduction; (ii) Overview of Vietnamese agriculture in the process of trade liberalization; (iii) Theoretical framework and research methods; (iv) Empirical results; and (v) Conclusion and policy recommendations.
2. Overview of Vietnamese Agriculture in the Process of Trade Liberalization
2.1. Current State of Vietnamese Agriculture
Over the last 30 years, Vietnam’s agricultural sector has made great progress. With steady growth in crop yield, Vietnam has achieved successes in poverty reduction and national food security. The volume of agricultural production more than tripled between 1990 and 2018. The country has also achieved exponential growth in export of agricultural products like seafood, coffee, cashews, rice, and pepper. However, Vietnamese agriculture is experiencing a problem of value chain inefficiency. Vietnam’s agro-processing industry is small-scale and its value added contribution therefore is limited. Agricultural products are monotonous with low competitiveness, value, and export prices. Most of them are exported as semi-processed or preliminarily processed, and without well-known brands.
With the implementation of an industrialization strategy in the early 2000s, manufacturing industries have quickly overtaken agriculture as the main engine of growth as productivity gains in agriculture freed up some farm labor for other occupations. The rise in manufacturing wages relative to farm wages has contributed to the reallocation of labor out of agriculture (McCaig and Pavcnik 2013). In the period of 1990–2018 the employment share of agriculture shrunk drastically from 73 to 40 percent, with workers reallocating toward services and manufacturing. While the relative importance of agriculture in the economy has declined over time, agriculture remains an important sector, contributing 15 percent to Vietnam’s GDP. Thus, similar to other developing South East Asian countries, Vietnam still remains relatively dependent on agricultural production with its value as a percentage of the economy, which is about 2 times greater than the average level of middle-income countries.
2.2. Roadmap of Agricultural Trade Liberalization in Vietnam
Vietnam’s integration with the global economy was accelerated by numerous trade agreements signed over the past three decades. In 1995, the country firstly joined ASEAN, and at that time Vietnam’s total agricultural trade was less than 1 billion USD. By 2018, the agriculture trade value reached the level of 75 billion USD, with an 8 billion USD surplus.
Vietnam’s accession into the WTO in 2007 provided a further catalyst for growth and integration. Since then, the simple average MFN applied tariff on agricultural imports decreased from around 25 percent in the mid-2000s to 16.4 percent in 2017, compared with a simple average bound tariff on agricultural products of 19.1 percent (OECD 2019). Applied tariffs are much lower on imports originating from countries or regions with which Vietnam signed free trade agreements. For example, the average tariff is just 3.4 percent on agricultural imports from ASEAN members and 5.4 percent from China.
Vietnam has implemented trade liberalization through multilateral, regional, and bilateral trade agreements. Being a member of ASEAN, Vietnam supports trade liberalization between ASEAN and major trading partners in the region, including China, Japan, India, Korea, Australia, and New Zealand.
In November 2018, Vietnam ratified the Comprehensive and Progressive Agreement for a Trans-Pacific Partnership (CPTPP). The agreement took effect for Vietnam on 14 January 2019. In the CPTPP, Vietnam committed to immediately eliminate 21.64 percent of import tax lines of livestock products; 76.39 percent of tariff lines will be reduced to 0 percent after 2–16 years, leaving only a small number of poultry products at the rate of 80 percent.
In July 2018, the European Union and Vietnam agreed on final texts for the European Union–Vietnam Free Trade Agreement (EVFTA). The EVFTA is expected to be signed and take effect in July 2020. For EVFTA, Vietnam has committed to immediately eliminate 31.82 percent of tariff lines of livestock products; six tariff lines for applying quotas (poultry products); and the remaining tax lines will be reduced to 0 percent after 3–9 years. Overall, Vietnam is expected to fully open its domestic market for agricultural products by 2030. With such a roadmap, in general, the tariff commitments cause many difficulties for Vietnamese livestock producers, since both the EU and CPTPP countries are the most important import markets of Vietnam’s livestock products.
2.3. Domestic Support for Agriculture
Right from the beginning of the trade liberalization process, Vietnam has clearly pursued an export-promoting strategy. Before the WTO accession, Vietnam had employed various export subsidy programs to assist agricultural exports. Subsidized financing, export incentives, and other measures were used to promote the export of pork, rice, and coffee (Orden et al. 2007). However, after joining the WTO, Vietnam committed to end all direct export subsidy programs. Now Vietnam implements trade promotion programs for marketing assistance, and offers other forms of support for agricultural exporters.
In 2018, Vietnam proclaimed a number of policies to support agriculture and rural development and to restructure the agricultural production, aiming to improve competitiveness and increase value-added. Different policies offer a wide range of incentives to attract private investment into agriculture and rural areas, with an emphasis on the promotion of hi-tech agricultural production and on encouraging cooperation between farming households, cooperatives and enterprises. Vietnam aims to increase the scale of agricultural production by developing large-scale production areas. Vietnam has continuously improved credit policy for agricultural and rural development. Currently, farming households, co-operative groups, and other organizations that are not legal entities can access loans from credit institutions. Hi-tech agricultural firms, including firms without a hi-tech agribusiness certificate but having hi-tech agribusiness plans or projects, can access credit of up to 70 percent of the project value without providing collateral.
According to the OECD (2019), the overall level of support provided to Vietnam’s agriculture sector fluctuates at low and negative levels. In 2016–2018, Vietnam’s producer support estimate (PSE) was negative at −5.9 percent, significantly decreased from the level of positive 7 percent in 2010–2013. This means that the agricultural sector now has implicit overall taxation.
3. Theoretical Framework and Research Methods
3.1. Determination of Effective Rate of Protection
3.1.1. Formulation of Effective Rate of Protection
The ERP is measured as the difference between assisted value-added and unassisted value-added divided by the assisted value-added. The effective rate of protection is defined as follows (Anderson 1970; Corden 1971):
or
where is the effective rate of protection of industry j, is the value-added of sector j at domestic price (), and is the value-added of industry j at world price (.
where: is the nominal protection rate for industry/good j; is the nominal protection rate for industry/good i; is the value-added coefficient of industry j measured as a weighted average of tariffs and VAT rates; and is the ratio of imported input i to the after tax price of good j.
Assuming that the domestic price and world price are equal, we have:
In the case the domestic price and world price are different:
If α > 1 then the domestic price is higher than the world price.
If α < 1 then the domestic price is lower than the world price.
Equation (5) could be rewritten:
The above relationship shows that technological progress, expressed as a reduction of , would increase the effective rate of protection and is the best way to protect domestic production.
In fact, a nominal import duty is not the most important tool in implementing the government’s policy to protect domestic production; other tools such as production subsidy, quota, and preferential credit also play extremely significant roles. In the general case, the effective rate of protection could be calculated more accurately as follows:
where is the subsidy from the government for a unit of product j. Hence, in the case ti = 0, the government can make a subsidy to protect the production of good j.
If there are quotas on inputs, and could be reasonably adjusted. Another noteworthy point is that protection can be implemented right from the exchange rate adjustment. Therefore, determining which industries/goods to be protect should be carefully considered. In empirical calculation, we will ignore the effects of production subsidies, quotas, preferential incentives, or exchange rate to ERP. Instead, we focus only on the impact of import tariffs and VAT.
3.1.2. Determination of in an Input–Output System
In an Input–Output system, relationship for an economy can be expressed in matrix form as:
where: X is an (n × 1) vector of gross output, with Xj being the output of industry j; A is an (n × n) technical coefficient matrix; Y is an (n × 1) vector of final demand, where Yj is the final demand of industry j; I is an identity matrix; and is the Leontief inverse matrix, indicating output rises in each sector due to a unit increase of final demand.
We have , , in which Xij is determined at a basic price.
There are two types of input–output tables: (i) a competitive type and (ii) a noncompetitive type. In the competitive type of I–O table, inputs consist of domestic products and imported products. In the noncompetitive scheme, inputs are explicitly distinguished between domestically produced and imported. To calculate the ERP, the data from the competitive type of I–O table cannot fully reflect the economic nature of the issue, especially in the case of Vietnam (Bui 2010; Lam et al. 2013). Thus, in order to more accurately reflect the production process in the economy, we use the I–O table at a basic price (noncompetitive type); it indicates the input cost deducted for tax on a product, including tariff. Equation (9) could be rewritten in the following form:
where Ad is the coefficient matrix of intermediate costs from using domestic products, while Yd denotes the final demand of domestic products matrix.
X = (I − Ad)−1 × Yd
3.1.3. Determination of , and
Ideally, the determination of tj and ti should be based on nominal tariff rates, which could readily be obtained from the customs harmonized system (HS) of product classification. However, due to problems with Vietnam’s classification system, the product code in the HS could not be totally matched with the ISIC industry classification system, and more so with the I–O table product code. Thus, the calculations of tj and ti were based mainly on the import duty collected from import activities and total import value in accordance with the I–O table code. For this purpose, a concordance was developed to link I–O industries with HS tariff lines based on the industry descriptions.
3.1.4. Sign of ERP
A positive ERP shows that returns to capital and labor are higher than they would have been in the absence of state intervention. It suggests that tariff and other elements of the trade protection, if included, working through final product and input prices, have tended to expand the given industry (Corden 1966).
A negative ERP can be interpreted in two different ways (Johnson 1969; Diakantoni and Escaith 2012):
- (i)
- The industry can be harmed by intervention or it would be better off under a free trade regime.
- (ii)
- The industry would be worse off under a free trade or it is highly supported by state intervention.
3.1.5. Level of Effective Protection
The level of effective protection, depending on the structure of the ERP, can be described as follows (Feenstra 1992; Greenaway and Milner 2003; Diakantoni and Escaith 2014):
| 100 percent and above | = | extremely strongly protected |
| 50 percent to 99 percent | = | highly protected |
| 0 percent to 49 percent | = | protected |
| ≤0 percent | = | negative ERP |
In many cases, a high effective rate of protection of a sector can only make the industry more profitable, but that is why the productions of many other industries are not efficiently protected, especially if the products are inputs to those sectors (Santos-Paulino 2005).
3.2. Value-Added Multipliers
A value-added multiplier is a measure of a sector’s contribution; it captures the value that is added by the sector in engaging in production—the difference between a sector’s total output and the cost of its intermediate inputs. A value-added multiplier helps to highlight the role of a given sector in the economy.
Value-added multipliers were defined as follow (Miller 2009):
where: is a coefficient vector, with ; vector shows added value created by a unit of domestic final demand; and is a value-added vector created by domestic final demand.
4. Results
Table 1 shows that the primary agriculture, forestry, and fishery industries have relatively high value-added multipliers (7/10 of industries had a value greater than 1 in 2016), which indicates that these are important sectors of the economy. By contrast, levels of effective protection for these sectors were low, and have been decreasing from 2012 to 2016, when tariff barriers for them under the WTO and Vietnam–ASEAN–China FTA frameworks were gradually eased. Notably, most of the primary agriculture industries had negative effective rates of protection in 2016.

Table 1.
Value-added multiplier and effective rate of protection (ERP) of the primary agriculture, forestry, and fishery industries.
By contrast, trends in the processing industries were quite different from those of the primary agriculture, forestry, and fisheries industries. The results of many previous studies suggest that Vietnam tends to protect all industries but does not focus on any particular industry (Bui 2010; Lam et al. 2013). However, the results of empirical calculations presented in Table 2 show that the level of effective protection tended to increase for the processing industry, while these industries have low spillover effects of final demand to value-added.
Table 2.
Value-added multiplier and ERP of selected agriculture, forestry, and fishery related industries.
Thus, the paradox of trade protection in Vietnam is very clear through the comparison of empirical results in Table 1 and Table 2. In the period of 2012–2016, Vietnam protected more strongly the products that have a low multiplier effect of final demand to value-added, and in addition, this was the area where foreign-invested enterprises account for a larger proportion. On the contrary, less protection has been given to the industries that spread more value and play a greater role for the domestic economy.
By the year 2020, under the roadmap of tariff reduction under FTAs framework, import tariffs on agricultural products will continue to fall sharply. Table 3 shows the projection of ERP for the Vietnamese agricultural sector. We can see that all primary agriculture, forestry, and fishery industries would have negative effective protection. Moreover, unlike the period of 2012–2016, most of the processing and related industries would become unprotected by 2020.
Table 3.
Estimated ERP by 2020.
5. Conclusions and Policy Recommendations
The empirical results reveal a declining trend in trade protection for agriculture and related industries of Vietnam. This implies that tariff and value-added tax policies are not efficient to protect the Vietnamese agricultural sector. Although Vietnam is still considered a country with a comparative advantage in exporting agricultural products, with the erosion of protection barriers, this advantage would hardly be guaranteed in the future.
The most important factor to improve value-added is to maintain a sound economic structure and harmonized tax policy. Inadequate tax policy has made the Vietnamese economy structure more distorted, leaving out protection of the agricultural sector and focusing too much on protecting other manufacturing industries, such as automobiles and motorcycles production, which is not an advantage of Vietnam at present. Consequently, this hinders the agricultural productivity growth.
The government of Vietnam has implemented many measures aimed at improving agricultural productivity in the long run. However, the achieved results are limited, reflected in the low agricultural value added. The strategy of promoting exports is considered suitable for Vietnam at the current stage of development; however, with the agricultural sector continuing to play an important role in ensuring livelihoods and job creation for Vietnamese households, the import-substitution policy for some agricultural subindustries needs to be considered in the near future.
Based on the study results, we suggest the following policy recommendations:
First, in case the nominal tariff rates of some products decrease to 0 percent, but these products still need to be protected, the government should reduce the value-added tax rate on inputs for them.
Second, priority of supporting policy should be given to the industries with a high value-added multiplier, and in particular primary agricultural industries.
Third, the government should implement non-tariff barriers more widely and effectively to protect domestic agricultural products. Despite being a country with lower commodity standards, Vietnam needs to thoroughly apply quality standards to protect the domestic agricultural market.
Author Contributions
Conceptualization, B.H.D. and H.N.P.; methodology, B.H.D. and T.B.; data collection, H.N.P. and H.N.; analysis of results, H.N.P. and T.B.; writing—original draft preparation, T.B. and H.N.; writing—review and editing, B.H.D. and H.N.P.; supervision, H.N.P. All authors have read and agreed to the published version of the manuscript.
Funding
This research is funded by the National Economics University, Hanoi, Vietnam.
Conflicts of Interest
The authors declare no conflict of interest.
References
- Anderson, James E. 1970. General Equilibrium and the Effective Rate of Protection. Journal of Political Economy 78: 717–24. [Google Scholar] [CrossRef]
- Anderson, Kym. 2003. Measuring Effects of Trade Policy Distortions: How Far Have We Come? The World Economy 26: 413–40. [Google Scholar] [CrossRef]
- Athukorala, Prema-chandra. 2006. Trade Policy Reforms and the Structure of Protection in Vietnam. The World Economy 29: 161–87. [Google Scholar] [CrossRef][Green Version]
- Balassa, Bela. 1965. Tariff Protection in Industrial Countries: An Evaluation. Journal of Political Economy 73: 573–94. [Google Scholar] [CrossRef]
- Bui, Trinh. 2010. Measuring the Effective Rate of Protection in Vietnam’s Economy with Emphasis on the Manufacturing Industry: An Input-Output Approach (No. 12). Retrieved from Development and Policies Research Center (DEPOCEN), Vietnam. Available online: https://ideas.repec.org/p/dpc/wpaper/1210.html (accessed on 12 January 2020).
- Bureau, Jean-Christophe, Sebastien Jean, and Alan Matthews. 2005. The Consequences of Agricultural Trade Liberalisation for Developing Countries: Distinguishing between Genuine Benefits and False Hopes (SSRN Scholarly Paper No. ID 739751). Retrieved from Social Science Research Network Website. Available online: https://papers.ssrn.com/abstract=739751 (accessed on 15 January 2020).
- Chen, Bo, Hong Ma, and David S. Jacks. 2017. Revisiting the Effective Rate of Protection in the Late Stages of Chinese Industrialisation. The World Economy 40: 424–38. [Google Scholar] [CrossRef]
- Corden, Warner Max. 1966. The Structure of a Tariff System and the Effective Protective Rate. Journal of Political Economy 74: 221–37. [Google Scholar] [CrossRef]
- Corden, Warner Max. 1971. The Theory of Protection, 1st ed. Oxford: Oxford University Press. [Google Scholar]
- Diakantoni, Antonia, and Hubert Escaith. 2012. Reassessing Effective Protection Rates in a Trade in Tasks Perspective: Evolution of Trade Policy in “Factory Asia” [MPRA Paper]. Available online: https://mpra.ub.uni-muenchen.de/41723/ (accessed on 7 July 2019).
- Diakantoni, Antonia, and Hubert Escaith. 2014. Trade in Tasks, Tariff Policy and Effective Protection Rates. Available online: https://ssrn.com/abstract=2541676 (accessed on 14 January 2020).
- Feenstra, Robert C. 1992. How Costly is Protectionism? The Journal of Economic Perspectives 6: 159–78. [Google Scholar] [CrossRef]
- Greenaway, David, and Chris Milner. 2003. Effective Protection, Policy Appraisal and Trade Policy Reform. The World Economy 26: 441–56. [Google Scholar] [CrossRef]
- Johnson, Harry G. 1969. The Theory of Effective Protection and Preferences. Economica 36: 119–38. [Google Scholar] [CrossRef]
- Lam, Nguyen Bich, Bui Trinh, and Nguyen Viet Phong. 2013. Measuring the Effective Rate of Protection in Vietnam’s Economy after Five Years Joining WTO (An Input-Output Analysis Approach). Global Journal of Human-Social Science Research 13: 12–20. [Google Scholar]
- McCaig, Brian, and Nina Pavcnik. 2013. Moving out of Agriculture: Structural Change in Vietnam (No. w19616). Cambridge: National Bureau of Economic Research. [Google Scholar]
- Miller, Ronald E. 2009. Input-Output Analysis: Foundations and Extensions, 2nd ed. Cambridge and New York: Cambridge University Press. [Google Scholar]
- OECD. 2019. “Viet Nam”, in Agricultural Policy Monitoring and Evaluation 2019. Paris: OECD Publishing. [Google Scholar] [CrossRef]
- Orden, David, Fuzhi Cheng, Hoa Nguyen, Ulrike Grote, Marcelle Thomas, Kathleen Mullen, and Dongsheng Sun. 2007. Agricultural Producer Support Estimates for Developing Countries: Measurement Issues and Evidence from India, Indonesia, China, and Vietnam. Research Report No. 152. Washington, DC: International Food Policy Research Institute. [Google Scholar]
- Pham, Van Ha. 2007. An Assessment of Effective Rate of Protection in Vietnam in the Process of Economic Integration and Policy Implications. Journal of Finance 10: 49–52. (In Vietnamese). [Google Scholar]
- Rodriguez, Francisco, and Dani Rodrik. 1999. Trade Policy and Economic Growth: A Skeptic’s Guide to Cross-National Evidence. (Working Paper No. 7081). Cambridge: National Bureau of Economic Research. [Google Scholar] [CrossRef]
- Santos-Paulino, Amelia U. 2005. Trade Liberalisation and Economic Performance: Theory and Evidence for Developing Countries. The World Economy 28: 783–821. [Google Scholar] [CrossRef]
© 2020 by the authors. Licensee MDPI, Basel, Switzerland. This article is an open access article distributed under the terms and conditions of the Creative Commons Attribution (CC BY) license (http://creativecommons.org/licenses/by/4.0/).