Does the Source of Remittance Matter? Differentiated Effects of Earned and Unearned Remittances on Agricultural Productivity


1
Department of Economics & Decision Sciences, Western Illinois University, Macomb, IL 61455, USA
2
Department of Political Science & Economics, Rowan University, Glassboro, NJ 08028, USA
*
Author to whom correspondence should be addressed.
Economies 2020, 8(1), 8; https://doi.org/10.3390/economies8010008
Submission received: 15 October 2019
/
Revised: 8 January 2020
/
Accepted: 14 January 2020
/
Published: 23 January 2020
(This article belongs to the Special Issue Productivity and Efficiency Analysis)
Abstract
:This paper analyzes the effect of earned and unearned remittances on agricultural productivity in Nepal. This approach differs from the existing practice of studying the impact of total remittances on socio-economic outcomes. In particular, we disaggregate total remittances into earned and unearned remittances, and isolate their impacts on productivity—an individual household’s per labor-hour production of all agricultural output at the market value. Methodologically, we follow a three-stage least squares (3-SLS) approach to overcome the potential endogeneity concerns. We provide evidence that unearned remittances are more effective than earned remittances in increasing agricultural productivity. These results can be useful in understanding the migration-remittance-productivity nexus in Nepal as well as other similar socioeconomic societies from South Asia.
Keywords:
earned remittance; unearned remittance; agricultural productivity; migration; Nepal; 3-SLSJEL Classification:
O15; F24; Q101. Introduction
The notion of earned and unearned factors has been studied in various contexts in economics: income, revenue, premium, etc. Such notion, however, is under-researched in the remittance literature. To fill that gap, we investigate the effect of remittance by its sources on agricultural productivity in Nepal. Our innovation in this paper is, first, to disaggregate the total remittances into two categories by their sources: earned and unearned. Then, we test if an increase in the share of unearned remittances results in an increase in agricultural productivity. In doing so, we also isolate the impact of individual remittance by its source to show the differential impacts on agricultural productivity—an important contribution to the existing literature on the migration-remittance-productivity nexus.
We define earned remittance as money received on a regular basis by a household from a family member who participates in employment away from their home, either in the domestic or international market. The family members expect this remittance to be the main source of income. The family uses any leftover money for activities such as a loan repayment, small-scale business establishment, or agricultural investment – buying land, using improved seed, putting up the irrigation system, using a new technology, etc. These are characteristics of most remittance receiving Nepalese households who have someone working outside the home and sending money on a regular basis (Sapkota 2013). Alternatively, we define unearned remittance as money received by a household from their distant relatives, friends, or neighbors, consistent with the use of the term in the foreign income literature such as Smith (2008) and Ahmed (2012). This money is not obtained on a regular basis. The recipient typically requests/receives this money for a specific purpose and does not expect it to be their main source of income. Since agriculture remains the main profession for the majority of Nepalese households (Maharjan et al. 2012), which includes over 70% of the population (World Bank 2018), we assume that part of the unearned remittance is invested in the agricultural sector to buy farm equipment, seed, fertilizer, etc. With that background, it is meaningful to analyze the role of earned and unearned remittances in influencing agricultural productivity, which is an unknown a priori. This ambiguity results from the fact that the household receiving earned remittance has its member away from home and that person could otherwise be productive in their own farm. In contrast, the remitted funds could be used to offset the production loss due to migration through an increased investment in agricultural sector.
To explore the effect of remittances by their sources on agricultural productivity, we use the Nepal Living Standards Survey (NLSS) 2010/2011 dataset from the Central Bureau of Statistics (CBS) Nepal. This survey follows the World Bank’s Living Standards Measurement Survey (LSMS) methodology that adopts a two-stage stratified sampling method. It includes cross-sectional data from five developmental regions and three ecological belts, comprising both urban and rural residences. The nationwide dataset, conducted by the CBS with technical support from the World Bank, consists of 5988 households from 499 primary sampling units (PSUs). These data contain different aspects of household welfare such as demographic composition, migration, remittances, consumption, education, employment, landholding, agricultural investment and production, irrigation, distance to facilities, household head characteristics, and many others.
Methodologically, we use a three stage least squares (3-SLS) approach to address the potential endogeneity issue that could result due to simultaneity bias. Such bias may arise because of the situation that households with higher agricultural productivity may have fewer migrants and thus receive a low amount of remittances and vice-versa. Similarly, there are some household characteristics, such as the share of children in the household, which affect both the agricultural productivity and the amount of remittance received. In employing the 3-SLS method, first, we predict migration given the household characteristics and average migrants at the PSU. Then, we predict remittances based on the values of migrants estimated above, along with other household characteristics. Finally, we analyze the impact of predicted remittances by sources on agricultural productivity.
Our analyses show that an increase in the share of unearned remittances increases agricultural productivity. These results are robust to multiple econometric specifications. We compare the impact of earned and unearned remittances separately to show that unearned remittances indeed produce a bigger impact than do earned remittances. These results are consistent with existing theoretical arguments that highlight income fungibility issues (Friedman 1957; Thaler 1985; De and Ratha 2012, etc.). The results are important to understand the contribution of remittances by sources in economic performance of the remittance-receiving households in Nepal. These results can be useful in understanding the link between migration, remittance, and productivity in other societies from South Asia that have similar social, cultural, and economic practices, as suggested by Chakrabarti (2018).
Moving on, Section 2 of this paper provides a background on migration, remittance, and agricultural practices in Nepal along with a review of related literature; Section 3 presents a conceptual framework that explains how earned and unearned remittances may result in different outcomes on agricultural productivity; Section 4 provides a description of the data; Section 5 explains the econometric methodology; Section 6 presents the empirical results; and Section 7 concludes with a discussion.
2. Background: Migration, Remittance, and Agricultural Productivity in Nepal
International migration of the Nepalese people has significantly increased since the mid-1990s. Before this, migration was limited, occurring primarily within the country and to the neighboring states of India for seasonal and temporary employment. Nepal and India share a 1758 km long open border, which does not require any documents or approval to cross from either side. This has allowed for easy migration between the two countries. Having said that, the proportion of Nepalese migrants going to India out of the total migrants going abroad decreased from 93.1% in 1991 to 37.6% in 2011 (MLE 2018). Foreign employment outside India continues to be the most significant motivation for international migration from Nepal and it has increased dramatically over time: 3605 people migrated in 1993/1994 and that number jumped to more than 100,000 each year recently. Indeed, as of early 2018 about 1600 Nepalese left the country daily for foreign employment in Gulf countries and Malaysia (Shrestha 2018). According to the 2018 MLE report, 85% of the labor migration between 2008 and 2015 occurred in the seven countries of the Gulf Cooperation Council (Qatar, Saudi Arabia, UAE, Kuwait, Bahrain, Oman, and Yemen), mostly involving manufacturing and unspecified general labor (as high as 78%). A small portion migrates to countries such as Australia, Israel, South Korea as well as some European and North American countries.
The migration pattern described above have resulted in a scarcity of farm workers in Nepal, negatively affecting the agricultural sector. A majority of these migrants sends a portion of their income back to their families and the Nepalese economy depends on remittance; it accounts for as much as 30% of the GDP (World Bank 2018). Given a significant contribution to the national economy, we can ask many questions about how such remittance shapes individual household economics. How does the household use the remitted money? Is it spent in the consumption sector or is it invested in a productive sector? If invested, what sectors does it go to? Does remittance income offset the production loss due to migration through an improvement in agricultural productivity of the remittance-receiving households? If so, what could be the role of earned and unearned remittances? This paper focuses on the issue of crop income per labor-hour for a household, what we call individual agricultural productivity.
Existing literature on remittance analyze its impacts both at the macro level using country level data and the microeconomic issues using household level data. The existing literature on microeconomic impact of remittance use household data to study outcomes such as assets (Adams 1998), poverty (Adams 2005), education (Amuedo-Dorantes and Pozo 2010), health (Amuedo-Dorantes and Pozo 2011a), and income smoothing (Amuedo-Dorantes and Pozo 2011b). There is, however, limited research on the impact of remittance on agricultural productivity. In a broader context, a study by Atamanov and Van den Berg (2012) found a positive impact of remittances and negative impact of migration on crop income in the Kyrgyz Republic. In the particular case of Nepal, the limited analysis of the relationship between remittance and productivity uses the total (vis-a-vis disaggregated) remittance (Tuladhar et al. 2014; Khanal et al. 2015; Kapri and Ghimire 2020).
While it may be tempting to think that the source of remittance (earned vs. unearned) shouldn’t matter, literature shows that the source of income may have different impacts on consumption (Thomas 1990; Lundberg et al. 1997; Levin 1998; Imbens et al. 1999; Hawkins and Wallace 2006; Christiaensen and Pan 2010; Thaler 1985, 1990). Existing discussion on the relationship between remittance and agricultural productivity shows different impacts depending on the size of farm but not on the type of farming or ranching currently underway (Davis and Lopez-Carr 2014). A study by de Brauw (2010), however, shows that remittance changes the structure of farming from traditional to cash crops. In that context, we hypothesize that the source of remittance not only influences consumption decision, but also influences investment decisions that changes the farm structure. In the case of Nepal, the effect of remittance on a household’s investment in education, health, and durable goods is also a function of whether the remittance comes from abroad or urban-rural migration (Mohanty et al. 2014). We extend this analysis in the case of agricultural productivity by disaggregating total remittance into earned and unearned. We conceptualize this framework in the following section.
3. Conceptual Framework
Traditional economic theories, Friedman (1957) for instance, assume that income is fungible and the source of income does not matter. However, Christiaensen and Pan (2010) highlight the work of Thaler (1985, 1990) and argue that the fungibility assumption is increasingly challenged by behavioral economists. Building on insights from cognitive psychology, they argue that people compartmentalize their income into different mental accounts and decide on their consumption within each of these accounts. This creates a direct link between source of income and spending behavior and is in sharp contrast to the standard consumption model, where consumption decisions are integrated into one single optimization problem, and income is in effect treated as fungible.
Based on the fungibility argument, we postulate the following hypothesis as shown in Figure 1: earned income is fungible, unearned income is less so. That is, each unit of earned remittance is the same and is replaceable with another unit. Therefore, earned remittance that is meant for something else can be spent on household expenditure and vice versa. However, this is less likely to happen with unearned remittance, which are more likely targeted for a specific purpose. Literature shows that most monetary gifts come with strings attached—they are targeted for a specific purpose. Moreover, most loans, whether from banks or family, are made with a specific understanding of what the money will be used for. That specific purpose can be buying a piece of land, investing in agriculture, etc. In Nepal this has been a popular lending/borrowing practice, as the majority of such financial transactions (loans/grants) occur for land and agricultural purposes (Hatlebakk 2009). Unless someone is an extremely altruistic individual (who would give money for any reason or no reason), they are more likely to send money to a distant relative or friend for a productive use, or an investment that would yield some return in the end. De and Ratha (2012) argue that remittance income is targeted better and not as fungible as other sources of transfer income. They claim that the amount and the potential use of remittance income are often decided upon jointly by the sender and the recipient. We argue the specificity about expected use of the money being more pronounced with unearned remittance than earned remittance.
Our assumptions of unearned remittance being invested and earned remittance being consumed are guided by the permanent income hypothesis proponed by Friedman (1957). The permanent income hypothesis states that people spend money at a level consistent with their expected long-term average. In our case, unearned remittance would not be a part of the expected long-term average income indicated by the hypothesis; and hence, we argue that people may not consider it part of their regular consumption. Instead, the hypothesis predicts that people would save this money. Economic theories of savings and investment predict that such savings are invested. In the Nepalese context, these investments are more likely to go either towards establishing small business or improving agricultural practices1 (Pant 2011, p. 2). In this paper, we focus on the agricultural sector alone.
4. Data
This study uses the Nepal Living Standards Survey (NLSS) 2010/2011 dataset from Central Bureau of Statistics (CBS) Nepal, which follows the World Bank’s Living Standards Measurement Survey (LSMS) methodology that adopts a two-stage stratified sampling method. It includes cross-sectional data from five developmental regions, three ecological belts, and urban/rural residence.
These data contain different aspects of household welfare such as demographic composition, migration, remittances, consumption, education, employment, landholding, agricultural investment and production, irrigation, distance to facilities, household head characteristics and many others. For the purpose of this study, the analysis is limited to agricultural production and income, migration, and remittances (earned and unearned). The dataset consists of 5988 households from 499 primary sampling units (PSUs). Our sample is restricted to the 3996 households that are involved in some kind of agricultural activity, which is about 2/3rd of the 5988 sample2. However, we end up having about 1107–1460 households in the final regressions because of missing values for agricultural productivity, migration, remittances and/or other control variables. The summary statistics of variables that we use in the paper are reported in Table 1. We construct the variables required for our study as follows:
- Earned remittances inflows (only from household members): The survey provides the information on cash remittances and in-kind remittances received only from household members. We use this information to construct the variable earned remittances inflows. We take natural log of this variable in the regression analysis.
- Unearned remittances inflows (only from non-household members): The survey provides the information on cash remittances and in-kind remittances received only from non-household members. We use this information to construct the variable unearned remittances inflows. We take natural log of this variable in the regression analysis.
- Share of unearned remittances inflows: This is the ratio of unearned remittances to the total remittances inflows for each household3, i.e.,
- Number of migrants: If an individual is away from the household for more than 6 months out of the last 12 months or has recently left and is expected to be away for more than 6 months and will return to the same household in the future, they are considered as migrant. We use this information to calculate the total number of migrants in a household.
- Agricultural productivity: The survey provides the information on crops (such as paddy, wheat, maize, and other cereals) produced by households, price of crop, and number of labor hours used in farm activity. Crop production, price of crop, and labor man days (equivalent to eight hours of work per day) are used to construct the variable crop production (in monetary value) per labor hour for each household. We take natural log of this variable in the regression analysis.
- Other household characteristics: The survey provides rich information about the households. Some of the other characteristics we use in this study include household size, household landholding, investment in agricultural sector, irrigation dummy, urban dummy (urban = 1, rural = 0), ecological belt dummy, share of the children in various age groups, share of female, share of elders, and many others.
- Household head characteristics: The survey also provides household head characteristics. Some of those characteristics that we use in our study include household head sex, age, education, occupation, and marital status.
5. Econometric Method
5.1. Econometric Specification
To test the hypothesis that the impact of unearned remittances on agricultural productivity is higher than earned remittances, we apply the iterative three-stage least square approach. In the first stage, we estimate the number of migrants per household using following regression equation:
where stands for number of migrants for the household i, XMi stands for household human-capital measures such as household characteristics and household head characteristics. Similarly, Durban stands for urban dummy, Dbelt stands for ecological belt dummies (mountain dummy and hill dummy) and stands for error term. It is likely that households in the same locality have similar migration decisions. To identify this equation, we also use (the average of migrant population from other households within the PSU) as an exogenous control variable. In particular, for each PSU, the average of migrants not including household i itself is calculated. This is a standard practice in the literature (Rozelle et al. 1999).
In the second stage, we estimate remittances using the following regression equation:
where is remittances received by household i. We estimate this equation three times, one each for (i) the share of unearned remittances, (ii) earned remittances, and (iii) unearned remittances. is estimated number of migrants for household i from the first stage, XRi is household characteristics and household head characteristics that affect remittances, and is the error term. Here, we use two different kinds of remittances—earned and unearned. It is likely that the remittance inflows in a household increases with the remittance inflows in the same PSU. So, to identify this equation we also use (the average of remittances from other households within the PSU, a community-level variable that is a proxy for the local remittance flow) as an exogenous control variable as in Rozelle et al. (1999). In particular, for each PSU, the average of remittances not including household i itself is calculated.
The final equations of recursive systems are:
where stands for household level agricultural production per labor-hour (in monetary value, Nepalese rupees), stands for estimated share of unearned remittances, stands for estimated earned remittances, stands for estimated unearned remittances for household i from the second stage shown in Equation (2), stands for estimated number of migrants for household i from the first stage, and stands for household characteristics including household head characteristics that affect agricultural production. We take natural log of the variables that measure productivity and remittances. For this third stage regression equation, household characteristics include household size, share of children aged 0–15, share of elders aged 64 and above, share of number of females aged 16–64, land per person, and investment per person in the agricultural sector. Similarly, household head characteristics include sex, age, marital status, and education of household head. Finally, stands for classical error terms. , , and are the main coefficients of interest that we expect to be positive, based on the discussion in previous sections. We also expect that the impact of unearned remittance on agricultural productivity is stronger than the impact of earned remittance, i.e., > .
5.2. Endogeneity of Remittance
A remittance-receiving household is likely to be endogenous to the household agricultural productivity. For instance, migration is a function of household and household-head characteristics, remittance is a function of migration and household as well as household-head characteristics, and agricultural productivity is a function of remittance and migration. This implies that households with higher agricultural productivity may have fewer migrants, and as a result, lower remittance inflows. Similarly, there might be some variables that affect both agricultural productivity and remittance. To address the potential endogeneity issues, we use the iterative three-stage least square (3-SLS) approach with exogenous control variables as mentioned in a previous sub-section. In addition, we use urban dummy, mountain dummy, and hill dummy to capture the ecological and geographical differences.
6. Empirical Results
The 3-SLS results show that both earned and unearned remittances as well as the share of unearned remittances has a positive impact on agricultural productivity as reported in the first row of Table 2, Table 3 and Table 44. Moreover, the results also show that the impact of unearned remittance is stronger than the impact of earned remittance as explained below.
In Table 2, we analyze the impact of the share of unearned remittances on the agricultural productivity. All specifications include urban dummy, hill dummy, and mountain dummy. Columns (3) and (4) also include household and household head characteristics as control variables. Robust standard errors in all of these specifications are clustered at the PSU level5. Even though the coefficients of the share of unearned remittances to total remittances in columns (1) and (2) are statistically insignificant, those are positive in sign. In columns (3) and (4), with all control variables, the corresponding coefficients are statistically significant and positive. Looking at column (3), we can conclude that a one percent increase in the share of unearned remittances increases agricultural productivity by 1.924 percent6. When we evaluate economic significance of this result at the sample average, a ten percent increase in this share (for instance, from the average value of 67.44 percent to 74.24 percent) leads to a 19.24 percent increase in productivity (from Rs. 193 to Rs. 230)7. Similarly, coefficient in column (4) shows that a one percent increase in the share of unearned remittances increases the agricultural productivity by 1.646 percent. Hence, the results reveal a positive and significant impact of the share of unearned remittances on agricultural productivity. This is consistent with the theoretical predictions that unearned remittance is less fungible and is potentially invested.
Results in Table 3 and Table 4 show that the disaggregated measures of earned and unearned remittances separately influence agricultural productivity positively. In Table 3, we can see that the coefficients of log of remittances inflows only from household migrant members are positive and statistically significant, and range from 0.242 to 0.301. Similarly, in Table 4, we can see that the coefficients of log of remittances inflows only from non-household migrant members are positive and statistically significant, and range from 0.516 to 0.550. These coefficients exhibit that unearned remittances have a greater impact on agricultural productivity than earned remittances. Other covariates, including migration, have expected signs.
To get a deeper insight into the size of these coefficients, we perform multiple tests to check if the difference in the magnitude from two sources of remittance (unearned vs. earned) is statistically different. We test the following hypothesis using the seemingly unrelated estimation method8 to see if the difference is statistically significant:
The test rejects the null hypothesis and supports the claim that the effect from earned and unearned remittances on agricultural productivity are statistically different. We find that the value of chi-squared is 3.25 and that it is statistically significant at ten percent significance level. Although the results varied depending on the econometric specification, the results confirm that there is a difference in the magnitude of the coefficients, as expected, between the two measures: in the range of 0.241 to 0.301 for earned remittances vs. 0.516 to 0.550 for unearned remittances (See Table 3 and Table 4).
7. Conclusions and Discussion
This paper investigates the effect of remittance by sources on agricultural productivity in Nepal. Our innovation in this paper is to disaggregate the total remittances based on their sources into two categories: earned (received from immediate family member) and unearned (received from family friends and relatives) remittances. We test whether the impact of unearned remittances on agricultural productivity is greater than that of earned remittances. Although the results vary depending on the econometric specification, we find that a ten percent increase in the share of unearned remittances increases the agricultural productivity by as much as 19.24 percent, which is an increase of Rs. 37 per labor-hour (from Rs. 193 to Rs. 230). We also find evidence that the impact of unearned remittances is significantly greater than earned remittances in increasing agricultural productivity. This finding explains what happens in agricultural households of Nepal. People from farming families go work somewhere else and send money home and the family counts on this regular income, i.e., earned remittances. Some families also get unearned remittances (from non-household members such as family friends, relatives, neighbors, etc.). And, it’s the second category of funds that actually have the biggest impact on agricultural productivity. Our analysis stems mainly from the fact that source of income changes an individual’s decisions based on the fungibility argument. If one has to ask someone else for the money, or the money comes in as a surprise, people are more thoughtful about what they are going to do with it. Especially, if they have to humble themselves to ask a relative for a loan or gift to accomplish whatever it is they are trying to do. Our empirical results are consistent with the theoretical argument that unearned remittance is less fungible than earned remittance, and hence, the two categories have statistically different impacts on agricultural productivity.
In addition to the fungibility argument, the distinction between earned and unearned remittances are supported by the permanent income hypothesis of Friedman (1957) and the life-cycle hypothesis of Modigliani and Brumberg (1954). According to these hypotheses, households smooth their consumption over time. Their consumption level is thus determined by their permanent/anticipated income and is independent of their total current income, implying a large marginal propensity to consume out of permanent/anticipated income and a low marginal propensity to consume out of transitory/unanticipated income. Therefore, if earned remittance works as anticipated income and unearned remittance as unanticipated income, the first would be consumed and the second would be saved/invested, thus increasing agricultural productivity. Although our conclusions are based on the Nepalese household sample, these results could explain the migration-remittance-productivity nexus in other South Asian countries that have social, cultural, and economic similarities, according to the arguments presented by Chakrabarti (2018).
While these results are interesting, there are some caveats to this analysis: we assume that certain funds go to agriculture because that has been the main profession of people in Nepal. The question of whether families indeed use all of remittance income to improve agricultural productivity is not clear. In areas where children are expected to contribute to parent’s lifestyle, earned remittances may be just as likely to go for making the parent’s lives easier and happier instead of going towards improving the farm itself. In societies where it is unusual for family members to send money home, choices would be different. Also, imperfect/asymmetric information between remittance senders and recipients can possibly deviate the preferences of the recipients and this could alter the results pertaining to unearned remittance. Previous studies on remittance suggest that the majority of the money goes into buying land and buildings, but it’s not sure if they are buying agricultural land. A potential explanation for lower impact of the earned remittance could be that a family member is absent who might be very productive otherwise. But, are families at least as productive without the person as they were with the person? What if the remaining family members are bad farmers? Other than investments, people do have emergencies and need extra cash for personal reasons. Farmers may have to face a bad weather/poor harvest and need money for living expenses just until the next harvest. In addition, if people invest in sectors other than agriculture, how would earned and unearned remittances impact non-agricultural productivity? These would be interesting questions to address in future research.
Author Contributions
Both authors, S.G. and K.P.K., equally contributed in all sections of the paper. All authors have read and agreed to the published version of the manuscript.
Funding
This research received no external funding.
Acknowledgments
We would like to express special thanks to Carrie Meyer, Susan Pozo, two anonymous referees, and the academic editor for the journal for their helpful comments. This work was presented at the 2018 Canadian Economic Association and Illinois Economic Association conferences, and we would like to acknowledge the thoughtful insights, observations, and questions from the session participants.
Conflicts of Interest
The authors declare no conflict of interest.
Appendix A

Table A1.
Estimation of number of migrants and earned remittances inflows. Dependent Variables: log of migrants (Column 1) and log of earned remittances (Column 2).
Table A1.
Estimation of number of migrants and earned remittances inflows. Dependent Variables: log of migrants (Column 1) and log of earned remittances (Column 2).
| Variables | (1) | (2) |
|---|---|---|
| Ln (Number of Migrants) | Ln (Earned Remittances Inflows) | |
| Ln (estimated number of migrants) | - | 4.356 *** |
| (1.132) | ||
| Ln (household size) | 0.038 *** | - |
| (0.015) | ||
| Share of children age 15 under | −0.049 | 0.602 *** |
| (0.032) | (0.206) | |
| Share of elders age 64 above | −0.001 | −1.083 *** |
| (0.041) | (0.241) | |
| Share of female age16–64 | 0.051 | 0.029 |
| (0.039) | (0.262) | |
| Ln (distance to nearest facility) | 0.001 | −0.087 * |
| (0.006) | (0.048) | |
| Loan dummy | −0.010 | −0.001 |
| (0.010) | (0.065) | |
| Ln (average migrants by PSU) | 0.104 ** | - |
| (0.045) | ||
| Ln (average remittance inflows by PSU) | - | 0.360 *** |
| (0.050) | ||
| Constant | −0.875 * | 3.262 *** |
| (0.447) | (1.021) | |
| Observations | 1890 | 1888 |
| R-squared | 0.073 | 0.163 |
| Number of clusters | 422 | 421 |
All regressions include a constant, urban dummy and belt effects (hill and mountain dummies). Similarly, all regressions include household head characteristics (sex, age, marital status, education and occupation), and household head wage/self-employed status in agricultural sector/non-agricultural sector. The dependent variable is log of number of migrants in column 1 and log of remittances inflows only from household migrants in column 2. Variable Ln (number of migrants) is estimated values from the first stage. Robust standard errors in parentheses are clustered at the PSU level. *** p < 0.01, ** p < 0.05, * p < 0.1.
Table A2.
Estimation of number of migrants and unearned remittances inflows. Dependent Variables: log of migrants (Column 1) and log of unearned remittances inflows (Column 2).
Table A2.
Estimation of number of migrants and unearned remittances inflows. Dependent Variables: log of migrants (Column 1) and log of unearned remittances inflows (Column 2).
| Variables | (1) | (2) |
|---|---|---|
| Ln (Number of Migrants) | Ln (Unearned Remittances Inflows) | |
| Ln (estimated number of migrants) | - | −0.003 |
| (0.251) | ||
| Ln (household size) | 0.038 *** | - |
| (0.012) | ||
| Share of children age 15 under | −0.060 ** | −0.829 *** |
| (0.027) | (0.200) | |
| Share of elders age 64 above | −0.029 | −0.524 ** |
| (0.036) | (0.215) | |
| Share of female age16–64 | 0.022 | −0.629 ** |
| (0.032) | (0.281) | |
| Ln (distance to nearest facility) | −0.007 | −0.145 *** |
| (0.004) | (0.055) | |
| Loan dummy | −0.008 | −0.208 *** |
| (0.008) | (0.075) | |
| Ln (average migrants by PSU) | 0.832 *** | - |
| (0.019) | ||
| Ln (average remittance inflows by PSU) | - | 0.214 *** |
| (0.043) | ||
| Constant | −1.036 *** | 7.653 *** |
| (0.377) | (0.484) | |
| Observations | 1933 | 1661 |
| R-squared | 0.297 | 0.284 |
| Number of Clusters | 465 | 346 |
All regressions include a constant, urban dummy, and belt effects (hill and mountain dummies). Similarly, all regressions include household head characteristics (sex, age, marital status, education and occupation), and household head wage/self-employed status in agricultural sector/non-agricultural sector. The dependent variable is log of number of migrants in column 1 and log of remittances inflows only from non-household migrants in column 2. Variable Ln (number of migrants) is estimated values from the first stage. Robust standard errors in parentheses are clustered at the PSU level. *** p < 0.01, ** p < 0.05, * p < 0.1.
References
- Abadie, Alberto, Susan Athey, Guido Imbens, and Jeffrey Wooldridge. 2017. When Should you Adjust Standard Errors for Clustering? No. w24003. Cambridge: National Bureau of Economic Research. [Google Scholar]
- Adams, Richard. 1998. Remittances, investment and rural asset accumulation in Pakistan. Economic Development and Cultural Change 47: 155–73. [Google Scholar] [CrossRef]
- Adams, Richard. 2005. Do international migration and remittances reduce poverty in developing countries? World Development 33: 1645–69. [Google Scholar] [CrossRef]
- Ahmed, Faisal. 2012. The perils of unearned foreign income: Aid remittance, and government survival. The American Political Science Review 106: 146–65. [Google Scholar] [CrossRef]
- Amuedo-Dorantes, Catalina, and Susan Pozo. 2010. Accounting for remittance and migration effects on children’s schooling. World Development 38: 1747–59. [Google Scholar] [CrossRef]
- Amuedo-Dorantes, Catalina, and Susan Pozo. 2011a. New evidence on the role of remittances on healthcare expenditures by Mexican households. Review of Economics of the Household 9: 69–98. [Google Scholar] [CrossRef] [Green Version]
- Amuedo-Dorantes, Catalina, and Susan Pozo. 2011b. Remittances and income smoothing. The American Economic Review 101: 582–87. [Google Scholar] [CrossRef]
- Atamanov, Aziz, and Marrit Van den Berg. 2012. Heterogeneous effects of international migration and remittances on crop income: Evidence from the Kyrgyz Republic. World Development 40: 620–30. [Google Scholar] [CrossRef]
- CBS (Central Bureau of Statistics). 2018. Report on the Nepal Labour Force Survey 2017/2018. Available online: https://bit.ly/2LcZL38 (accessed on 1 December 2019).
- Chakrabarti, Averi. 2018. Female Land Ownership and Fertility in Nepal. The Journal of Development Studies 54: 1698–715. [Google Scholar] [CrossRef]
- Christiaensen, Luc, and Lei Pan. 2010. Transfers and Development: Easy Come, Easy Go? Working Paper No. 2010, 125. Helsinki: World Institute for Development Economics Research. [Google Scholar]
- Davis, Jason, and David Lopez-Carr. 2014. Migration, remittances and smallholder decision-making: implications for land use and livelihood change in central America. Land Use Policy 36: 319–29. [Google Scholar] [CrossRef] [Green Version]
- De, Prabal, and Dilip Ratha. 2012. Impact of remittance on household income, asset and human capital: Evidence from Sri Lanka. Migration and Development 1: 163–79. [Google Scholar] [CrossRef] [Green Version]
- de Brauw, Alan. 2010. Seasonal migration and agricultural production in Vietnam. The Journal of Development Studies 1: 114–39. [Google Scholar] [CrossRef]
- Friedman, Milton. 1957. A Theory of the Consumption Function. Princeton: Princeton University Press. [Google Scholar]
- Hatlebakk, Magnus. 2009. Capacity-constrained collusive price discrimination in the informal rural credit markets of Nepal. Review of Development Economics 13: 70–86. [Google Scholar] [CrossRef]
- Hawkins, Richard, and Sally Wallace. 2006. Source of income effects for demand decisions and taxable consumption. Applied Economics 38: 2371–79. [Google Scholar] [CrossRef]
- Imbens, Guido, Donald Rubin, and Bruce Sacerdote. 1999. Estimating the Effect of Unearned Income on Labor Supply, Earnings, Savings, and Consumption: Evidence from a Survey of Lottery Players. Cambridge: National Bureau of Economic Research. [Google Scholar]
- Kapri, Kul, and Shankar Ghimire. 2020. Migration, Remittance, and Agricultural Productivity: Evidence from the Nepal Living Standards Survey. Unpublished Manuscript. [Google Scholar]
- Khanal, Uttam, Khorshed Alam, Ramesh Khanal, and Punya Regmi. 2015. Implications of out-migration in rural agriculture: A case study of Manapang villege, Tanahun, Nepal. The Journal of Developing Areas 49: 331–52. [Google Scholar] [CrossRef]
- Levin, Laurence. 1998. Are assets fungible? Testing the behavioral theory of life-cycle savings. Journal of Economic Behavior and Organization 36: 59–83. [Google Scholar] [CrossRef]
- Lundberg, Shelly, Robert Pollak, and Terence Wales. 1997. Do husbands and wives pool their resources? Evidence from the United Kingdom child benefit. Journal of Human Resources 32: 463–80. [Google Scholar] [CrossRef] [Green Version]
- Maharjan, Amina, Siegfried Bauer, and Beatrice Knerr. 2012. International migration, remittances and subsistence farming: Evidence from Nepal. International Migration 51: e249–e263. [Google Scholar] [CrossRef]
- McKenzie, David. 2017. When Should You Cluster Standard Errors? New Wisdom from the Econometrics Oracle. [Blog post]. October 16. Available online: https://goo.gl/TrK69S (accessed on 26 June 2018).
- MLE (Ministry of Labour and Employment). 2018. Labour migration for Employment—A Status Report for Nepal: 2015/2016–2016/2017; Kathmandu: Ministry of Labour and Employment, Government of Nepal.
- Modigliani, Franco, and Richard Brumberg. 1954. Utility Analysis and the Consumption Function: An Interpretation of Cross-section Data. In Post Keynesian Economics. Edited by Kenneth K. Kurihara. New Brunswick: Rutgers University Press. [Google Scholar]
- Mohanty, Sanjay, Manisha Dubey, and Jajati Parida. 2014. Economic well-being and spending behavior of households in India: does remittances matter? Migration and Development 3: 38–53. [Google Scholar] [CrossRef]
- Pant, Bhubanesh. 2011. Harnessing remittances for productive use in Nepal. Nepal Rastra Bank Economic Review 23: 1–20. [Google Scholar]
- Rozelle, Scott, J. Edward Taylor, and Alan De Brauw. 1999. Migration, remittances, and agricultural productivity in China. American Economic Review 89: 287–91. [Google Scholar] [CrossRef]
- Sapkota, Chandan. 2013. Remittances in Nepal: boon or bane? The Journal of Development Studies 49: 1316–31. [Google Scholar] [CrossRef]
- Shrestha, Subina. 2018. The Plight of Nepal’s Migrant Workers. Aljazeera. February 5. Available online: https://www.aljazeera.com/blogs/asia/2018/02/plight-nepal-migrant-workers-180205084756399.html (accessed on 26 June 2018).
- Smith, Alastair. 2008. The perils of unearned income. The Journal of Politics 70: 780–93. [Google Scholar] [CrossRef] [Green Version]
- Thaler, Richard. 1985. Mental accounting and consumer choice. Marketing Science 4: 199–214. [Google Scholar] [CrossRef]
- Thaler, Richard. 1990. Anomalies: Saving, fungibility, and mental accounts. Journal of Economic Perspectives 4: 193–205. [Google Scholar] [CrossRef]
- Thomas, Duncan. 1990. Intra-household resource allocation: An inferential approach. Journal of Human Resources 25: 635–64. [Google Scholar] [CrossRef]
- Tuladhar, Raju, Chandan Sapkota, and Naveen Adhikari. 2014. Effects of Migration and Remittance Income on Nepal’s Agriculture Yield. ADB South Asia Working Paper Series. No. WPS146820–2; Manila: Asian Development Bank. [Google Scholar]
- World Bank. 2018. World Development Indicators Database. Washington, DC: World Bank. [Google Scholar]
- Zellner, Arnold. 1962. An efficient method of estimating seemingly unrelated regressions and tests for aggregation bias. Journal of the American Statistical Association 57: 348–68. [Google Scholar] [CrossRef]
| 1 | In the Nepal Living Standards Survey (2010/2011), 56% of the 5,988 households receive remittances. From Table 1, the average earned remittance is Rs. 49,084.57 (i.e., exp10.8013) or $672.48 (@ 1 USD = RS. 72.99 annual average in 2011) and unearned remittance is Rs. 3668.73 (i.e., exp8.2076) or $50.26. Those households that receive earned remittances on average invest Rs. 5562.23 (or $76.2) in agriculture. Those who receive unearned remittances invest Rs. 6696.55 (or $91.75). That is, the average investment to remittance ratio for households with earned remittances is 0.1133 whereas this ratio for households with unearned remittances is much higher at 1.8253. This supports the idea that unearned remittances help complement a household’s investment in agriculture. As a result, the higher investment in agriculture for those households with unearned remittances is consistent with our assumption. |
| 2 | We are thankful to an anonymous referee who pointed out this sample size to be inconsistent with the most recent Nepal Labor Force Survey (CBS 2018) which shows only 21.5% of the population being employed in agriculture. The discrepancy in employment rates by sectors between 2010/2011 (when the NLSS survey took place) to 2017/2018 (when the NLFS survey took place) is due to several structural changes in the Nepalese economy between the two periods: the political transformation of the country, dramatic increase in emigration, the devastating earthquake of 2015, the border blockade of 2016, etc. |
| 3 | In the NLSS data, there are certain households that receive both earned and unearned remittances and there are some that receive only one. Specifically, there are about 56% of the 5988 households in the sample that receive some sort of remittances. Out of them 1867 households receive unearned remittances and 2013 households receive earned remittances. Those who receive none or a minimal amount of earned remittances (from migrant household members) are likely to get a larger amount of unearned remittance (from non-household members such as family friends, relatives, neighbors, etc.) and vice versa in the context of Nepal due to cultural and social practices. |
| 4 | |
| 5 | McKenzie (2017) summarizes the work of Abadie et al. (2017) where they suggest that we cluster robust standard errors at the PSU level because there are other PSUs in the population of interest beyond those seen in the sample. |
| 6 | Note: exp1.073 − 1= 1.924. |
| 7 | Calculated at the average value of productivity for the sample at exp5.262 = 192.87 |
| 8 |
Figure 1.
Remittance Flow Chart.
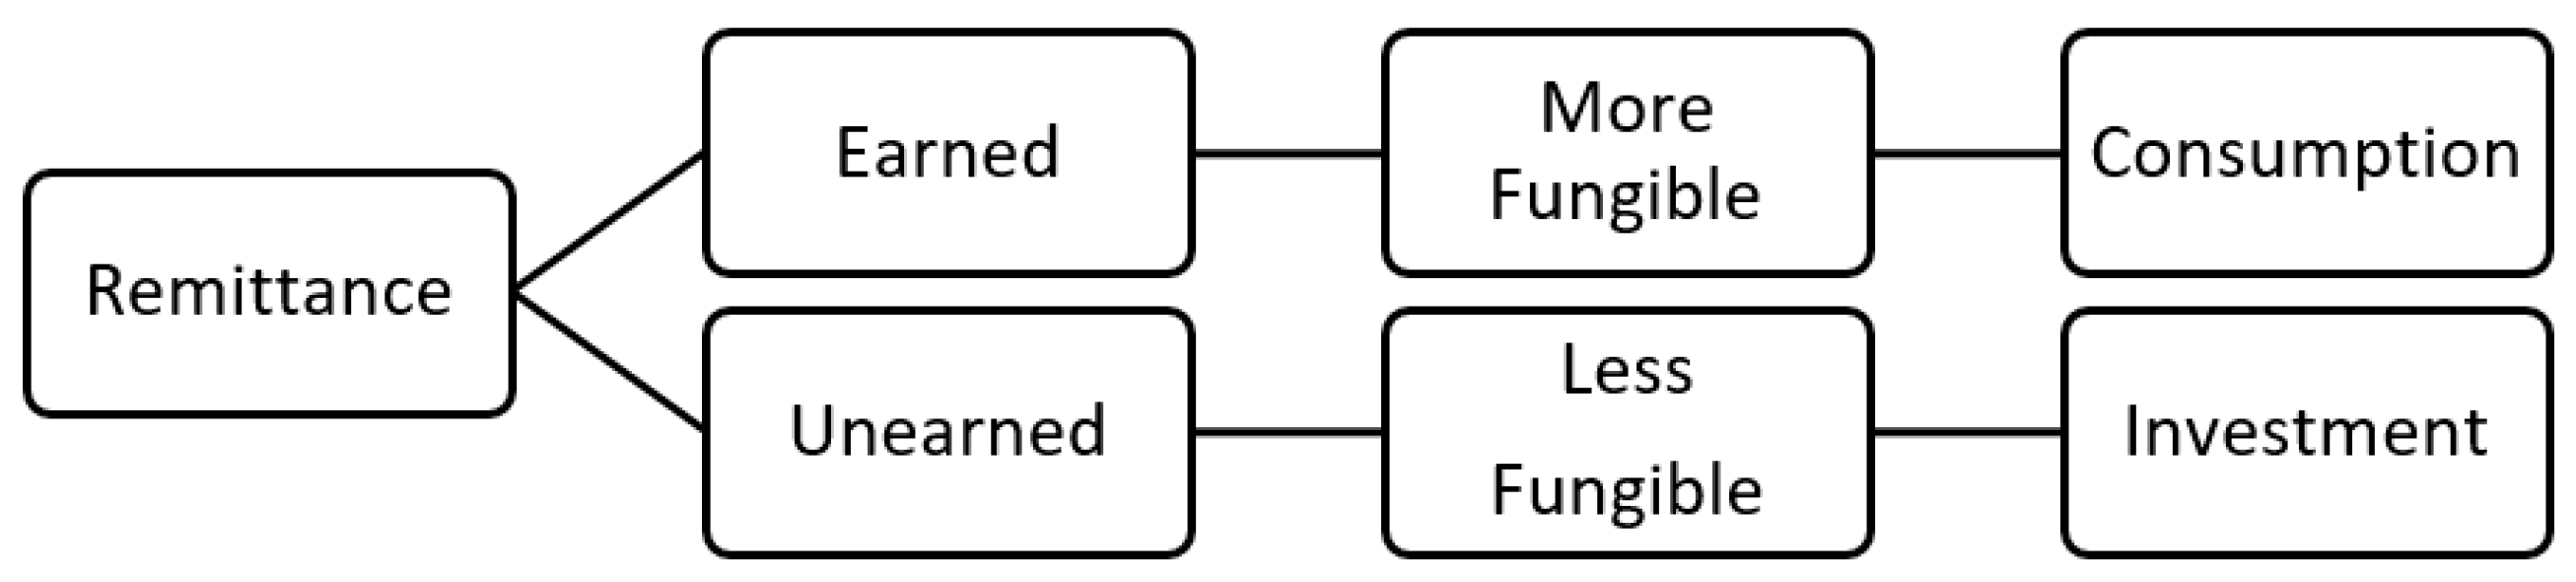
Table 1.
Summary Statistics.
| Variables | Obs | Mean | Std. Dev. | Min | Max |
|---|---|---|---|---|---|
| Ln (agricultural productivity) | 3996 | 5.26182 | 1.08326 | 0.12297 | 12.0509 |
| Ln (remittances inflows) | 5988 | 5.27303 | 5.15535 | 0 | 15.8034 |
| Ln (earned remittances inflows) | 2013 | 10.8013 | 1.42176 | 0 | 15.0965 |
| Ln (unearned remittances inflows) | 1867 | 8.2076 | 1.59156 | 0 | 15.8034 |
| Share of unearned remittances inflows | 1867 | 0.6744 | 0.43585 | 0 | 1 |
| Ln (number of migrants) | 2014 | 0.78368 | 0.19493 | 0.69315 | 2.07944 |
| Ln (distance to nearest facility) | 5832 | 1.17847 | 0.62973 | 0 | 6.68586 |
| Loan dummy (outstanding loan = 1) | 5988 | 0.62034 | 0.48534 | 0 | 1 |
| Ln (household size) | 5988 | 1.6793 | 0.39528 | 0.69315 | 3.09104 |
| Share of children age 15 under | 5988 | 0.33683 | 0.23729 | 0 | 1 |
| Share of female age16–64 | 5988 | 0.33774 | 0.18763 | 0 | 1 |
| Share of elders age 64 above | 5988 | 0.07194 | 0.1767 | 0 | 1 |
| HHH sex (male = 1) | 5988 | 0.73309 | 0.44238 | 0 | 1 |
| HHH age | 5988 | 45.9965 | 14.1329 | 11 | 95 |
| HHH age squared | 5988 | 2315.38 | 1383.17 | 121 | 9025 |
| HHH marital dummy (married = 1) | 5988 | 0.76115 | 0.42642 | 0 | 1 |
| HHH education | 5752 | 0.38456 | 0.75074 | 0 | 4 |
| HHH occupation wage in agriculture | 5988 | 0.02973 | 0.16986 | 0 | 1 |
| HHH occupation wage in non-agriculture | 5988 | 0.19258 | 0.39436 | 0 | 1 |
| HHH occupation self-employed in agriculture | 5988 | 0.50843 | 0.49997 | 0 | 1 |
| HHH occupation self-employed in non-agriculture | 5988 | 0.15868 | 0.36541 | 0 | 1 |
| Urban dummy (urban = 1) | 5988 | 0.33673 | 0.47263 | 0 | 1 |
| Mountain belt dummy | 5988 | 0.06815 | 0.25202 | 0 | 1 |
| Hill belt dummy | 5988 | 0.53516 | 0.4988 | 0 | 1 |
| Irrigation dummy (irrigated land = 1) | 4264 | 0.60718 | 0.48844 | 0 | 1 |
| Ln (land per person) | 4264 | 7.20761 | 1.42158 | 0 | 11.8435 |
| Ln (investment per person) | 4510 | 6.19227 | 1.71024 | 0 | 12.0867 |
Note: When we take natural log (Ln), we add 1 to the corresponding values; HHH denotes household head.
Table 2.
Effect of share of remittances from non-household migrant member on agricultural productivity. Dependent variable: Log of agricultural productivity (crop production per labor-hour).
Table 2.
Effect of share of remittances from non-household migrant member on agricultural productivity. Dependent variable: Log of agricultural productivity (crop production per labor-hour).
| Variables | (1) | (2) | (3) | (4) |
|---|---|---|---|---|
| Share of unearned remittances inflows | 0.051 | 0.043 | 1.073 *** | 0.973 ** |
| (0.187) | (0.191) | (0.405) | (0.416) | |
| Urban dummy (urban = 1) | 0.413 *** | 0.412 *** | 0.440 *** | 0.442 *** |
| (0.117) | (0.117) | (0.123) | (0.123) | |
| Mountain dummy | −0.221 ** | −0.216 * | −0.302 *** | −0.292 *** |
| (0.111) | (0.112) | (0.109) | (0.112) | |
| Hill dummy | −0.023 | −0.024 | −0.083 | −0.084 |
| (0.072) | (0.072) | (0.073) | (0.073) | |
| Household size | - | - | 0.021 * | 0.021 * |
| (0.012) | (0.012) | |||
| Share of children age 15 under | - | - | −0.008 | −0.048 |
| (0.250) | (0.248) | |||
| Share of elders age 64 above | - | - | 0.559 ** | 0.537 ** |
| (0.268) | (0.266) | |||
| Share of female age16–64 | - | - | 0.097 | 0.052 |
| (0.325) | (0.320) | |||
| Irrigation dummy (irrigated land = 1) | - | - | 0.146 ** | 0.148 ** |
| (0.072) | (0.072) | |||
| Ln (land per person) | - | - | 0.254 *** | 0.252 *** |
| (0.038) | (0.038) | |||
| Ln (invest per person) | - | - | 0.081 ** | 0.082 ** |
| (0.040) | (0.040) | |||
| Ln (average migrants PSU) | - | −0.123 | - | −0.233 |
| (0.351) | (0.367) | |||
| Constant | 5.282 *** | 5.388 *** | 2.632 *** | 2.914 *** |
| (0.123) | (0.333) | (0.584) | (0.658) | |
| Observations | 1153 | 1153 | 1107 | 1107 |
| R-squared | 0.022 | 0.022 | 0.202 | 0.202 |
| Number of clusters | 275 | 275 | 269 | 269 |
All regressions are estimated by three stage least squares (3-SLS). Columns 3 and 4 also include household head characteristics (sex, age, marital status, education and occupation). The dependent variable is log of agricultural productivity (crop value per labor-hour in Nepalese rupees). Share of unearned remittances is estimated in the second stage of the 3-SLS. Robust standard errors in parentheses are clustered at the PSU level. *** p < 0.01, ** p < 0.05, * p < 0.1.
Table 3.
Effect of remittances only from household migrant members on agricultural productivity. Dependent Variable: Log of agricultural productivity (crop production per labor-hour).
Table 3.
Effect of remittances only from household migrant members on agricultural productivity. Dependent Variable: Log of agricultural productivity (crop production per labor-hour).
| Variables | (1) | (2) | (3) | (4) |
|---|---|---|---|---|
| Ln (earned remittances inflows) | 0.242 *** | 0.241 *** | 0.263 ** | 0.301 *** |
| (0.080) | (0.081) | (0.108) | (0.112) | |
| Urban dummy (urban = 1) | 0.382 *** | 0.381 *** | 0.390 *** | 0.348 *** |
| (0.101) | (0.101) | (0.109) | (0.113) | |
| Mountain dummy | −0.139 | −0.137 | −0.169 | −0.123 |
| (0.134) | (0.133) | (0.128) | (0.125) | |
| Hill dummy | −0.149 ** | −0.155 ** | −0.189 *** | −0.265 *** |
| (0.072) | (0.076) | (0.072) | (0.076) | |
| Household size | - | - | −0.011 | 0.006 |
| (0.012) | (0.015) | |||
| Share of children age 15 under | - | - | 0.145 | −0.020 |
| (0.222) | (0.253) | |||
| Share of elders age 64 above | - | - | 0.520 * | 0.526 * |
| (0.304) | (0.300) | |||
| Share of female age 16–64 | - | - | −0.132 | 0.021 |
| (0.271) | (0.272) | |||
| Irrigation dummy (irrigated land = 1) | - | - | 0.162 ** | 0.163 ** |
| (0.065) | (0.065) | |||
| Ln (land per person) | - | - | 0.204 *** | 0.209 *** |
| (0.035) | (0.035) | |||
| Ln (invest per person) | - | - | 0.119 *** | 0.120 *** |
| (0.039) | (0.039) | |||
| Ln (number of migrants) | - | −0.244 | - | −3.331 * |
| (0.572) | (1.744) | |||
| Constant | 2.760 *** | 2.965 *** | 0.674 | 2.824 * |
| (0.879) | (1.067) | (1.183) | (1.557) | |
| Observations | 1460 | 1460 | 1413 | 1413 |
| R−squared | 0.045 | 0.045 | 0.186 | 0.190 |
| Number of clusters | 355 | 355 | 350 | 350 |
All regressions are estimated by 3-SLS. Columns 3 and 4 also include household head characteristics (sex, age, marital status, education and occupation). The dependent variable is log of agricultural productivity (crop value per labor-hour in Nepalese rupees). Variables Ln (number of migrants) and Ln (remittances inflows only from migrant members) are estimated values from the first and second stage of the 3-SLS, respectively. Robust standard errors in parentheses are clustered at the PSU level. *** p < 0.01, ** p < 0.05, * p < 0.1.
Table 4.
Effect of remittances from non-household migrant members on agricultural productivity. Dependent Variable: Log of agricultural productivity (crop production per labor-hour).
Table 4.
Effect of remittances from non-household migrant members on agricultural productivity. Dependent Variable: Log of agricultural productivity (crop production per labor-hour).
| Variables | (1) | (2) | (3) | (4) |
|---|---|---|---|---|
| Ln (unearned remittances inflows) | 0.516 *** | 0.523 *** | 0.550 *** | 0.550 *** |
| (0.083) | (0.085) | (0.120) | (0.119) | |
| Urban dummy | 0.033 | 0.023 | 0.154 | 0.148 |
| (0.128) | (0.129) | (0.132) | (0.133) | |
| Mountain dummy | −0.392 *** | −0.389 *** | −0.395 *** | −0.384 *** |
| (0.112) | (0.112) | (0.110) | (0.112) | |
| Hill dummy | −0.251 *** | −0.257 *** | −0.291 *** | −0.295 *** |
| (0.080) | (0.081) | (0.094) | (0.094) | |
| Household size | - | - | 0.024 ** | 0.026 ** |
| (0.012) | (0.013) | |||
| Share of children age 15 under | - | - | 0.184 | 0.146 |
| (0.229) | (0.224) | |||
| Share of elders age 64 above | - | - | 0.621 ** | 0.609 ** |
| (0.255) | (0.253) | |||
| Share of female age 16–64 | - | - | −0.030 | −0.017 |
| (0.262) | (0.261) | |||
| Irrigation dummy (irrigated land = 1) | - | - | 0.153 ** | 0.156 ** |
| (0.071) | (0.071) | |||
| Ln (land per person) | - | - | 0.246 *** | 0.245 *** |
| (0.036) | (0.036) | |||
| Ln (invest per person) | - | - | 0.081 ** | 0.082 ** |
| (0.038) | (0.038) | |||
| Ln (average migrants PSU) | - | −0.212 | - | −0.421 |
| (0.392) | (0.443) | |||
| Constant | 1.391 ** | 1.511 ** | −1.196 | −0.865 |
| (0.638) | (0.665) | (1.176) | (1.164) | |
| Observations | 1153 | 1153 | 1107 | 1107 |
| R−squared | 0.059 | 0.060 | 0.217 | 0.219 |
| Number of clusters | 275 | 275 | 269 | 269 |
All regressions are estimated by 3-SLS. Columns 3 and 4 also include household head characteristics (sex, age, marital status, education and occupation). The dependent variable is log of agricultural productivity (crop value per labor-hour in Nepalese rupees). Ln (remittances inflows only from non-household migrant members) variable is estimated in the second stage of the 3-SLS. Robust standard errors in parentheses are clustered at PSU level. *** p < 0.01, ** p < 0.05, * p < 0.1.
© 2020 by the authors. Licensee MDPI, Basel, Switzerland. This article is an open access article distributed under the terms and conditions of the Creative Commons Attribution (CC BY) license (http://creativecommons.org/licenses/by/4.0/).
Share and Cite
MDPI and ACS Style
Ghimire, S.; Kapri, K.P. Does the Source of Remittance Matter? Differentiated Effects of Earned and Unearned Remittances on Agricultural Productivity. Economies 2020, 8, 8. https://doi.org/10.3390/economies8010008
AMA Style
Ghimire S, Kapri KP. Does the Source of Remittance Matter? Differentiated Effects of Earned and Unearned Remittances on Agricultural Productivity. Economies. 2020; 8(1):8. https://doi.org/10.3390/economies8010008
Chicago/Turabian StyleGhimire, Shankar, and Kul Prasad Kapri. 2020. "Does the Source of Remittance Matter? Differentiated Effects of Earned and Unearned Remittances on Agricultural Productivity" Economies 8, no. 1: 8. https://doi.org/10.3390/economies8010008
Note that from the first issue of 2016, this journal uses article numbers instead of page numbers. See further details here.