Does the Source of Remittance Matter? Differentiated Effects of Earned and Unearned Remittances on Agricultural Productivity


Abstract
:1. Introduction
2. Background: Migration, Remittance, and Agricultural Productivity in Nepal
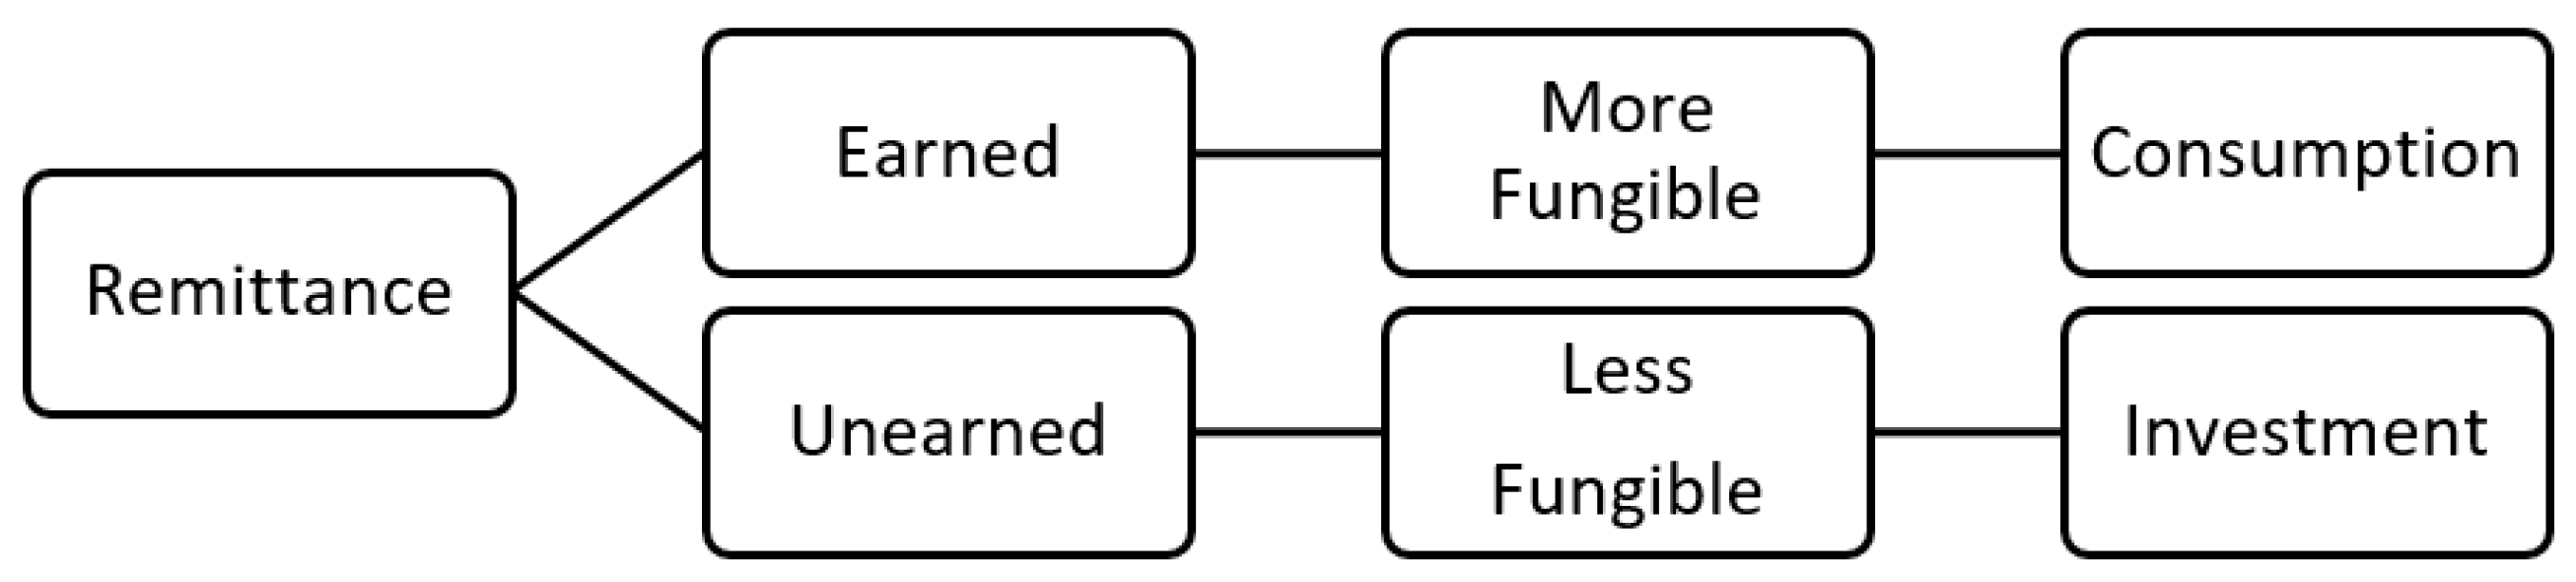
3. Conceptual Framework
4. Data
- Earned remittances inflows (only from household members): The survey provides the information on cash remittances and in-kind remittances received only from household members. We use this information to construct the variable earned remittances inflows. We take natural log of this variable in the regression analysis.
- Unearned remittances inflows (only from non-household members): The survey provides the information on cash remittances and in-kind remittances received only from non-household members. We use this information to construct the variable unearned remittances inflows. We take natural log of this variable in the regression analysis.
- Share of unearned remittances inflows: This is the ratio of unearned remittances to the total remittances inflows for each household3, i.e.,
- Number of migrants: If an individual is away from the household for more than 6 months out of the last 12 months or has recently left and is expected to be away for more than 6 months and will return to the same household in the future, they are considered as migrant. We use this information to calculate the total number of migrants in a household.
- Agricultural productivity: The survey provides the information on crops (such as paddy, wheat, maize, and other cereals) produced by households, price of crop, and number of labor hours used in farm activity. Crop production, price of crop, and labor man days (equivalent to eight hours of work per day) are used to construct the variable crop production (in monetary value) per labor hour for each household. We take natural log of this variable in the regression analysis.
- Other household characteristics: The survey provides rich information about the households. Some of the other characteristics we use in this study include household size, household landholding, investment in agricultural sector, irrigation dummy, urban dummy (urban = 1, rural = 0), ecological belt dummy, share of the children in various age groups, share of female, share of elders, and many others.
- Household head characteristics: The survey also provides household head characteristics. Some of those characteristics that we use in our study include household head sex, age, education, occupation, and marital status.
5. Econometric Method
5.1. Econometric Specification
5.2. Endogeneity of Remittance
6. Empirical Results
7. Conclusions and Discussion
Author Contributions
Funding
Acknowledgments
Conflicts of Interest
Appendix A

| Variables | (1) | (2) |
|---|---|---|
| Ln (Number of Migrants) | Ln (Earned Remittances Inflows) | |
| Ln (estimated number of migrants) | - | 4.356 *** |
| (1.132) | ||
| Ln (household size) | 0.038 *** | - |
| (0.015) | ||
| Share of children age 15 under | −0.049 | 0.602 *** |
| (0.032) | (0.206) | |
| Share of elders age 64 above | −0.001 | −1.083 *** |
| (0.041) | (0.241) | |
| Share of female age16–64 | 0.051 | 0.029 |
| (0.039) | (0.262) | |
| Ln (distance to nearest facility) | 0.001 | −0.087 * |
| (0.006) | (0.048) | |
| Loan dummy | −0.010 | −0.001 |
| (0.010) | (0.065) | |
| Ln (average migrants by PSU) | 0.104 ** | - |
| (0.045) | ||
| Ln (average remittance inflows by PSU) | - | 0.360 *** |
| (0.050) | ||
| Constant | −0.875 * | 3.262 *** |
| (0.447) | (1.021) | |
| Observations | 1890 | 1888 |
| R-squared | 0.073 | 0.163 |
| Number of clusters | 422 | 421 |
| Variables | (1) | (2) |
|---|---|---|
| Ln (Number of Migrants) | Ln (Unearned Remittances Inflows) | |
| Ln (estimated number of migrants) | - | −0.003 |
| (0.251) | ||
| Ln (household size) | 0.038 *** | - |
| (0.012) | ||
| Share of children age 15 under | −0.060 ** | −0.829 *** |
| (0.027) | (0.200) | |
| Share of elders age 64 above | −0.029 | −0.524 ** |
| (0.036) | (0.215) | |
| Share of female age16–64 | 0.022 | −0.629 ** |
| (0.032) | (0.281) | |
| Ln (distance to nearest facility) | −0.007 | −0.145 *** |
| (0.004) | (0.055) | |
| Loan dummy | −0.008 | −0.208 *** |
| (0.008) | (0.075) | |
| Ln (average migrants by PSU) | 0.832 *** | - |
| (0.019) | ||
| Ln (average remittance inflows by PSU) | - | 0.214 *** |
| (0.043) | ||
| Constant | −1.036 *** | 7.653 *** |
| (0.377) | (0.484) | |
| Observations | 1933 | 1661 |
| R-squared | 0.297 | 0.284 |
| Number of Clusters | 465 | 346 |
References
- Abadie, Alberto, Susan Athey, Guido Imbens, and Jeffrey Wooldridge. 2017. When Should you Adjust Standard Errors for Clustering? No. w24003. Cambridge: National Bureau of Economic Research. [Google Scholar]
- Adams, Richard. 1998. Remittances, investment and rural asset accumulation in Pakistan. Economic Development and Cultural Change 47: 155–73. [Google Scholar] [CrossRef]
- Adams, Richard. 2005. Do international migration and remittances reduce poverty in developing countries? World Development 33: 1645–69. [Google Scholar] [CrossRef]
- Ahmed, Faisal. 2012. The perils of unearned foreign income: Aid remittance, and government survival. The American Political Science Review 106: 146–65. [Google Scholar] [CrossRef]
- Amuedo-Dorantes, Catalina, and Susan Pozo. 2010. Accounting for remittance and migration effects on children’s schooling. World Development 38: 1747–59. [Google Scholar] [CrossRef]
- Amuedo-Dorantes, Catalina, and Susan Pozo. 2011a. New evidence on the role of remittances on healthcare expenditures by Mexican households. Review of Economics of the Household 9: 69–98. [Google Scholar] [CrossRef] [Green Version]
- Amuedo-Dorantes, Catalina, and Susan Pozo. 2011b. Remittances and income smoothing. The American Economic Review 101: 582–87. [Google Scholar] [CrossRef]
- Atamanov, Aziz, and Marrit Van den Berg. 2012. Heterogeneous effects of international migration and remittances on crop income: Evidence from the Kyrgyz Republic. World Development 40: 620–30. [Google Scholar] [CrossRef]
- CBS (Central Bureau of Statistics). 2018. Report on the Nepal Labour Force Survey 2017/2018. Available online: https://bit.ly/2LcZL38 (accessed on 1 December 2019).
- Chakrabarti, Averi. 2018. Female Land Ownership and Fertility in Nepal. The Journal of Development Studies 54: 1698–715. [Google Scholar] [CrossRef]
- Christiaensen, Luc, and Lei Pan. 2010. Transfers and Development: Easy Come, Easy Go? Working Paper No. 2010, 125. Helsinki: World Institute for Development Economics Research. [Google Scholar]
- Davis, Jason, and David Lopez-Carr. 2014. Migration, remittances and smallholder decision-making: implications for land use and livelihood change in central America. Land Use Policy 36: 319–29. [Google Scholar] [CrossRef] [Green Version]
- De, Prabal, and Dilip Ratha. 2012. Impact of remittance on household income, asset and human capital: Evidence from Sri Lanka. Migration and Development 1: 163–79. [Google Scholar] [CrossRef] [Green Version]
- de Brauw, Alan. 2010. Seasonal migration and agricultural production in Vietnam. The Journal of Development Studies 1: 114–39. [Google Scholar] [CrossRef]
- Friedman, Milton. 1957. A Theory of the Consumption Function. Princeton: Princeton University Press. [Google Scholar]
- Hatlebakk, Magnus. 2009. Capacity-constrained collusive price discrimination in the informal rural credit markets of Nepal. Review of Development Economics 13: 70–86. [Google Scholar] [CrossRef]
- Hawkins, Richard, and Sally Wallace. 2006. Source of income effects for demand decisions and taxable consumption. Applied Economics 38: 2371–79. [Google Scholar] [CrossRef]
- Imbens, Guido, Donald Rubin, and Bruce Sacerdote. 1999. Estimating the Effect of Unearned Income on Labor Supply, Earnings, Savings, and Consumption: Evidence from a Survey of Lottery Players. Cambridge: National Bureau of Economic Research. [Google Scholar]
- Kapri, Kul, and Shankar Ghimire. 2020. Migration, Remittance, and Agricultural Productivity: Evidence from the Nepal Living Standards Survey. Unpublished Manuscript. [Google Scholar]
- Khanal, Uttam, Khorshed Alam, Ramesh Khanal, and Punya Regmi. 2015. Implications of out-migration in rural agriculture: A case study of Manapang villege, Tanahun, Nepal. The Journal of Developing Areas 49: 331–52. [Google Scholar] [CrossRef]
- Levin, Laurence. 1998. Are assets fungible? Testing the behavioral theory of life-cycle savings. Journal of Economic Behavior and Organization 36: 59–83. [Google Scholar] [CrossRef]
- Lundberg, Shelly, Robert Pollak, and Terence Wales. 1997. Do husbands and wives pool their resources? Evidence from the United Kingdom child benefit. Journal of Human Resources 32: 463–80. [Google Scholar] [CrossRef] [Green Version]
- Maharjan, Amina, Siegfried Bauer, and Beatrice Knerr. 2012. International migration, remittances and subsistence farming: Evidence from Nepal. International Migration 51: e249–e263. [Google Scholar] [CrossRef]
- McKenzie, David. 2017. When Should You Cluster Standard Errors? New Wisdom from the Econometrics Oracle. [Blog post]. October 16. Available online: https://goo.gl/TrK69S (accessed on 26 June 2018).
- MLE (Ministry of Labour and Employment). 2018. Labour migration for Employment—A Status Report for Nepal: 2015/2016–2016/2017; Kathmandu: Ministry of Labour and Employment, Government of Nepal.
- Modigliani, Franco, and Richard Brumberg. 1954. Utility Analysis and the Consumption Function: An Interpretation of Cross-section Data. In Post Keynesian Economics. Edited by Kenneth K. Kurihara. New Brunswick: Rutgers University Press. [Google Scholar]
- Mohanty, Sanjay, Manisha Dubey, and Jajati Parida. 2014. Economic well-being and spending behavior of households in India: does remittances matter? Migration and Development 3: 38–53. [Google Scholar] [CrossRef]
- Pant, Bhubanesh. 2011. Harnessing remittances for productive use in Nepal. Nepal Rastra Bank Economic Review 23: 1–20. [Google Scholar]
- Rozelle, Scott, J. Edward Taylor, and Alan De Brauw. 1999. Migration, remittances, and agricultural productivity in China. American Economic Review 89: 287–91. [Google Scholar] [CrossRef]
- Sapkota, Chandan. 2013. Remittances in Nepal: boon or bane? The Journal of Development Studies 49: 1316–31. [Google Scholar] [CrossRef]
- Shrestha, Subina. 2018. The Plight of Nepal’s Migrant Workers. Aljazeera. February 5. Available online: https://www.aljazeera.com/blogs/asia/2018/02/plight-nepal-migrant-workers-180205084756399.html (accessed on 26 June 2018).
- Smith, Alastair. 2008. The perils of unearned income. The Journal of Politics 70: 780–93. [Google Scholar] [CrossRef] [Green Version]
- Thaler, Richard. 1985. Mental accounting and consumer choice. Marketing Science 4: 199–214. [Google Scholar] [CrossRef]
- Thaler, Richard. 1990. Anomalies: Saving, fungibility, and mental accounts. Journal of Economic Perspectives 4: 193–205. [Google Scholar] [CrossRef]
- Thomas, Duncan. 1990. Intra-household resource allocation: An inferential approach. Journal of Human Resources 25: 635–64. [Google Scholar] [CrossRef]
- Tuladhar, Raju, Chandan Sapkota, and Naveen Adhikari. 2014. Effects of Migration and Remittance Income on Nepal’s Agriculture Yield. ADB South Asia Working Paper Series. No. WPS146820–2; Manila: Asian Development Bank. [Google Scholar]
- World Bank. 2018. World Development Indicators Database. Washington, DC: World Bank. [Google Scholar]
- Zellner, Arnold. 1962. An efficient method of estimating seemingly unrelated regressions and tests for aggregation bias. Journal of the American Statistical Association 57: 348–68. [Google Scholar] [CrossRef]
| 1 | In the Nepal Living Standards Survey (2010/2011), 56% of the 5,988 households receive remittances. From Table 1, the average earned remittance is Rs. 49,084.57 (i.e., exp10.8013) or $672.48 (@ 1 USD = RS. 72.99 annual average in 2011) and unearned remittance is Rs. 3668.73 (i.e., exp8.2076) or $50.26. Those households that receive earned remittances on average invest Rs. 5562.23 (or $76.2) in agriculture. Those who receive unearned remittances invest Rs. 6696.55 (or $91.75). That is, the average investment to remittance ratio for households with earned remittances is 0.1133 whereas this ratio for households with unearned remittances is much higher at 1.8253. This supports the idea that unearned remittances help complement a household’s investment in agriculture. As a result, the higher investment in agriculture for those households with unearned remittances is consistent with our assumption. |
| 2 | We are thankful to an anonymous referee who pointed out this sample size to be inconsistent with the most recent Nepal Labor Force Survey (CBS 2018) which shows only 21.5% of the population being employed in agriculture. The discrepancy in employment rates by sectors between 2010/2011 (when the NLSS survey took place) to 2017/2018 (when the NLFS survey took place) is due to several structural changes in the Nepalese economy between the two periods: the political transformation of the country, dramatic increase in emigration, the devastating earthquake of 2015, the border blockade of 2016, etc. |
| 3 | In the NLSS data, there are certain households that receive both earned and unearned remittances and there are some that receive only one. Specifically, there are about 56% of the 5988 households in the sample that receive some sort of remittances. Out of them 1867 households receive unearned remittances and 2013 households receive earned remittances. Those who receive none or a minimal amount of earned remittances (from migrant household members) are likely to get a larger amount of unearned remittance (from non-household members such as family friends, relatives, neighbors, etc.) and vice versa in the context of Nepal due to cultural and social practices. |
| 4 | |
| 5 | McKenzie (2017) summarizes the work of Abadie et al. (2017) where they suggest that we cluster robust standard errors at the PSU level because there are other PSUs in the population of interest beyond those seen in the sample. |
| 6 | Note: exp1.073 − 1= 1.924. |
| 7 | Calculated at the average value of productivity for the sample at exp5.262 = 192.87 |
| 8 |
| Variables | Obs | Mean | Std. Dev. | Min | Max |
|---|---|---|---|---|---|
| Ln (agricultural productivity) | 3996 | 5.26182 | 1.08326 | 0.12297 | 12.0509 |
| Ln (remittances inflows) | 5988 | 5.27303 | 5.15535 | 0 | 15.8034 |
| Ln (earned remittances inflows) | 2013 | 10.8013 | 1.42176 | 0 | 15.0965 |
| Ln (unearned remittances inflows) | 1867 | 8.2076 | 1.59156 | 0 | 15.8034 |
| Share of unearned remittances inflows | 1867 | 0.6744 | 0.43585 | 0 | 1 |
| Ln (number of migrants) | 2014 | 0.78368 | 0.19493 | 0.69315 | 2.07944 |
| Ln (distance to nearest facility) | 5832 | 1.17847 | 0.62973 | 0 | 6.68586 |
| Loan dummy (outstanding loan = 1) | 5988 | 0.62034 | 0.48534 | 0 | 1 |
| Ln (household size) | 5988 | 1.6793 | 0.39528 | 0.69315 | 3.09104 |
| Share of children age 15 under | 5988 | 0.33683 | 0.23729 | 0 | 1 |
| Share of female age16–64 | 5988 | 0.33774 | 0.18763 | 0 | 1 |
| Share of elders age 64 above | 5988 | 0.07194 | 0.1767 | 0 | 1 |
| HHH sex (male = 1) | 5988 | 0.73309 | 0.44238 | 0 | 1 |
| HHH age | 5988 | 45.9965 | 14.1329 | 11 | 95 |
| HHH age squared | 5988 | 2315.38 | 1383.17 | 121 | 9025 |
| HHH marital dummy (married = 1) | 5988 | 0.76115 | 0.42642 | 0 | 1 |
| HHH education | 5752 | 0.38456 | 0.75074 | 0 | 4 |
| HHH occupation wage in agriculture | 5988 | 0.02973 | 0.16986 | 0 | 1 |
| HHH occupation wage in non-agriculture | 5988 | 0.19258 | 0.39436 | 0 | 1 |
| HHH occupation self-employed in agriculture | 5988 | 0.50843 | 0.49997 | 0 | 1 |
| HHH occupation self-employed in non-agriculture | 5988 | 0.15868 | 0.36541 | 0 | 1 |
| Urban dummy (urban = 1) | 5988 | 0.33673 | 0.47263 | 0 | 1 |
| Mountain belt dummy | 5988 | 0.06815 | 0.25202 | 0 | 1 |
| Hill belt dummy | 5988 | 0.53516 | 0.4988 | 0 | 1 |
| Irrigation dummy (irrigated land = 1) | 4264 | 0.60718 | 0.48844 | 0 | 1 |
| Ln (land per person) | 4264 | 7.20761 | 1.42158 | 0 | 11.8435 |
| Ln (investment per person) | 4510 | 6.19227 | 1.71024 | 0 | 12.0867 |
| Variables | (1) | (2) | (3) | (4) |
|---|---|---|---|---|
| Share of unearned remittances inflows | 0.051 | 0.043 | 1.073 *** | 0.973 ** |
| (0.187) | (0.191) | (0.405) | (0.416) | |
| Urban dummy (urban = 1) | 0.413 *** | 0.412 *** | 0.440 *** | 0.442 *** |
| (0.117) | (0.117) | (0.123) | (0.123) | |
| Mountain dummy | −0.221 ** | −0.216 * | −0.302 *** | −0.292 *** |
| (0.111) | (0.112) | (0.109) | (0.112) | |
| Hill dummy | −0.023 | −0.024 | −0.083 | −0.084 |
| (0.072) | (0.072) | (0.073) | (0.073) | |
| Household size | - | - | 0.021 * | 0.021 * |
| (0.012) | (0.012) | |||
| Share of children age 15 under | - | - | −0.008 | −0.048 |
| (0.250) | (0.248) | |||
| Share of elders age 64 above | - | - | 0.559 ** | 0.537 ** |
| (0.268) | (0.266) | |||
| Share of female age16–64 | - | - | 0.097 | 0.052 |
| (0.325) | (0.320) | |||
| Irrigation dummy (irrigated land = 1) | - | - | 0.146 ** | 0.148 ** |
| (0.072) | (0.072) | |||
| Ln (land per person) | - | - | 0.254 *** | 0.252 *** |
| (0.038) | (0.038) | |||
| Ln (invest per person) | - | - | 0.081 ** | 0.082 ** |
| (0.040) | (0.040) | |||
| Ln (average migrants PSU) | - | −0.123 | - | −0.233 |
| (0.351) | (0.367) | |||
| Constant | 5.282 *** | 5.388 *** | 2.632 *** | 2.914 *** |
| (0.123) | (0.333) | (0.584) | (0.658) | |
| Observations | 1153 | 1153 | 1107 | 1107 |
| R-squared | 0.022 | 0.022 | 0.202 | 0.202 |
| Number of clusters | 275 | 275 | 269 | 269 |
| Variables | (1) | (2) | (3) | (4) |
|---|---|---|---|---|
| Ln (earned remittances inflows) | 0.242 *** | 0.241 *** | 0.263 ** | 0.301 *** |
| (0.080) | (0.081) | (0.108) | (0.112) | |
| Urban dummy (urban = 1) | 0.382 *** | 0.381 *** | 0.390 *** | 0.348 *** |
| (0.101) | (0.101) | (0.109) | (0.113) | |
| Mountain dummy | −0.139 | −0.137 | −0.169 | −0.123 |
| (0.134) | (0.133) | (0.128) | (0.125) | |
| Hill dummy | −0.149 ** | −0.155 ** | −0.189 *** | −0.265 *** |
| (0.072) | (0.076) | (0.072) | (0.076) | |
| Household size | - | - | −0.011 | 0.006 |
| (0.012) | (0.015) | |||
| Share of children age 15 under | - | - | 0.145 | −0.020 |
| (0.222) | (0.253) | |||
| Share of elders age 64 above | - | - | 0.520 * | 0.526 * |
| (0.304) | (0.300) | |||
| Share of female age 16–64 | - | - | −0.132 | 0.021 |
| (0.271) | (0.272) | |||
| Irrigation dummy (irrigated land = 1) | - | - | 0.162 ** | 0.163 ** |
| (0.065) | (0.065) | |||
| Ln (land per person) | - | - | 0.204 *** | 0.209 *** |
| (0.035) | (0.035) | |||
| Ln (invest per person) | - | - | 0.119 *** | 0.120 *** |
| (0.039) | (0.039) | |||
| Ln (number of migrants) | - | −0.244 | - | −3.331 * |
| (0.572) | (1.744) | |||
| Constant | 2.760 *** | 2.965 *** | 0.674 | 2.824 * |
| (0.879) | (1.067) | (1.183) | (1.557) | |
| Observations | 1460 | 1460 | 1413 | 1413 |
| R−squared | 0.045 | 0.045 | 0.186 | 0.190 |
| Number of clusters | 355 | 355 | 350 | 350 |
| Variables | (1) | (2) | (3) | (4) |
|---|---|---|---|---|
| Ln (unearned remittances inflows) | 0.516 *** | 0.523 *** | 0.550 *** | 0.550 *** |
| (0.083) | (0.085) | (0.120) | (0.119) | |
| Urban dummy | 0.033 | 0.023 | 0.154 | 0.148 |
| (0.128) | (0.129) | (0.132) | (0.133) | |
| Mountain dummy | −0.392 *** | −0.389 *** | −0.395 *** | −0.384 *** |
| (0.112) | (0.112) | (0.110) | (0.112) | |
| Hill dummy | −0.251 *** | −0.257 *** | −0.291 *** | −0.295 *** |
| (0.080) | (0.081) | (0.094) | (0.094) | |
| Household size | - | - | 0.024 ** | 0.026 ** |
| (0.012) | (0.013) | |||
| Share of children age 15 under | - | - | 0.184 | 0.146 |
| (0.229) | (0.224) | |||
| Share of elders age 64 above | - | - | 0.621 ** | 0.609 ** |
| (0.255) | (0.253) | |||
| Share of female age 16–64 | - | - | −0.030 | −0.017 |
| (0.262) | (0.261) | |||
| Irrigation dummy (irrigated land = 1) | - | - | 0.153 ** | 0.156 ** |
| (0.071) | (0.071) | |||
| Ln (land per person) | - | - | 0.246 *** | 0.245 *** |
| (0.036) | (0.036) | |||
| Ln (invest per person) | - | - | 0.081 ** | 0.082 ** |
| (0.038) | (0.038) | |||
| Ln (average migrants PSU) | - | −0.212 | - | −0.421 |
| (0.392) | (0.443) | |||
| Constant | 1.391 ** | 1.511 ** | −1.196 | −0.865 |
| (0.638) | (0.665) | (1.176) | (1.164) | |
| Observations | 1153 | 1153 | 1107 | 1107 |
| R−squared | 0.059 | 0.060 | 0.217 | 0.219 |
| Number of clusters | 275 | 275 | 269 | 269 |
© 2020 by the authors. Licensee MDPI, Basel, Switzerland. This article is an open access article distributed under the terms and conditions of the Creative Commons Attribution (CC BY) license (http://creativecommons.org/licenses/by/4.0/).
Share and Cite
Ghimire, S.; Kapri, K.P. Does the Source of Remittance Matter? Differentiated Effects of Earned and Unearned Remittances on Agricultural Productivity. Economies 2020, 8, 8. https://doi.org/10.3390/economies8010008
Ghimire S, Kapri KP. Does the Source of Remittance Matter? Differentiated Effects of Earned and Unearned Remittances on Agricultural Productivity. Economies. 2020; 8(1):8. https://doi.org/10.3390/economies8010008
Chicago/Turabian StyleGhimire, Shankar, and Kul Prasad Kapri. 2020. "Does the Source of Remittance Matter? Differentiated Effects of Earned and Unearned Remittances on Agricultural Productivity" Economies 8, no. 1: 8. https://doi.org/10.3390/economies8010008
APA StyleGhimire, S., & Kapri, K. P. (2020). Does the Source of Remittance Matter? Differentiated Effects of Earned and Unearned Remittances on Agricultural Productivity. Economies, 8(1), 8. https://doi.org/10.3390/economies8010008