Determinants of Private Savings in the Form of Bank Deposits: A Case Study on Regions of the Russian Federation
Abstract
1. Introduction
2. Literature Review
3. Data and Methods
3.1. Data
- (1)
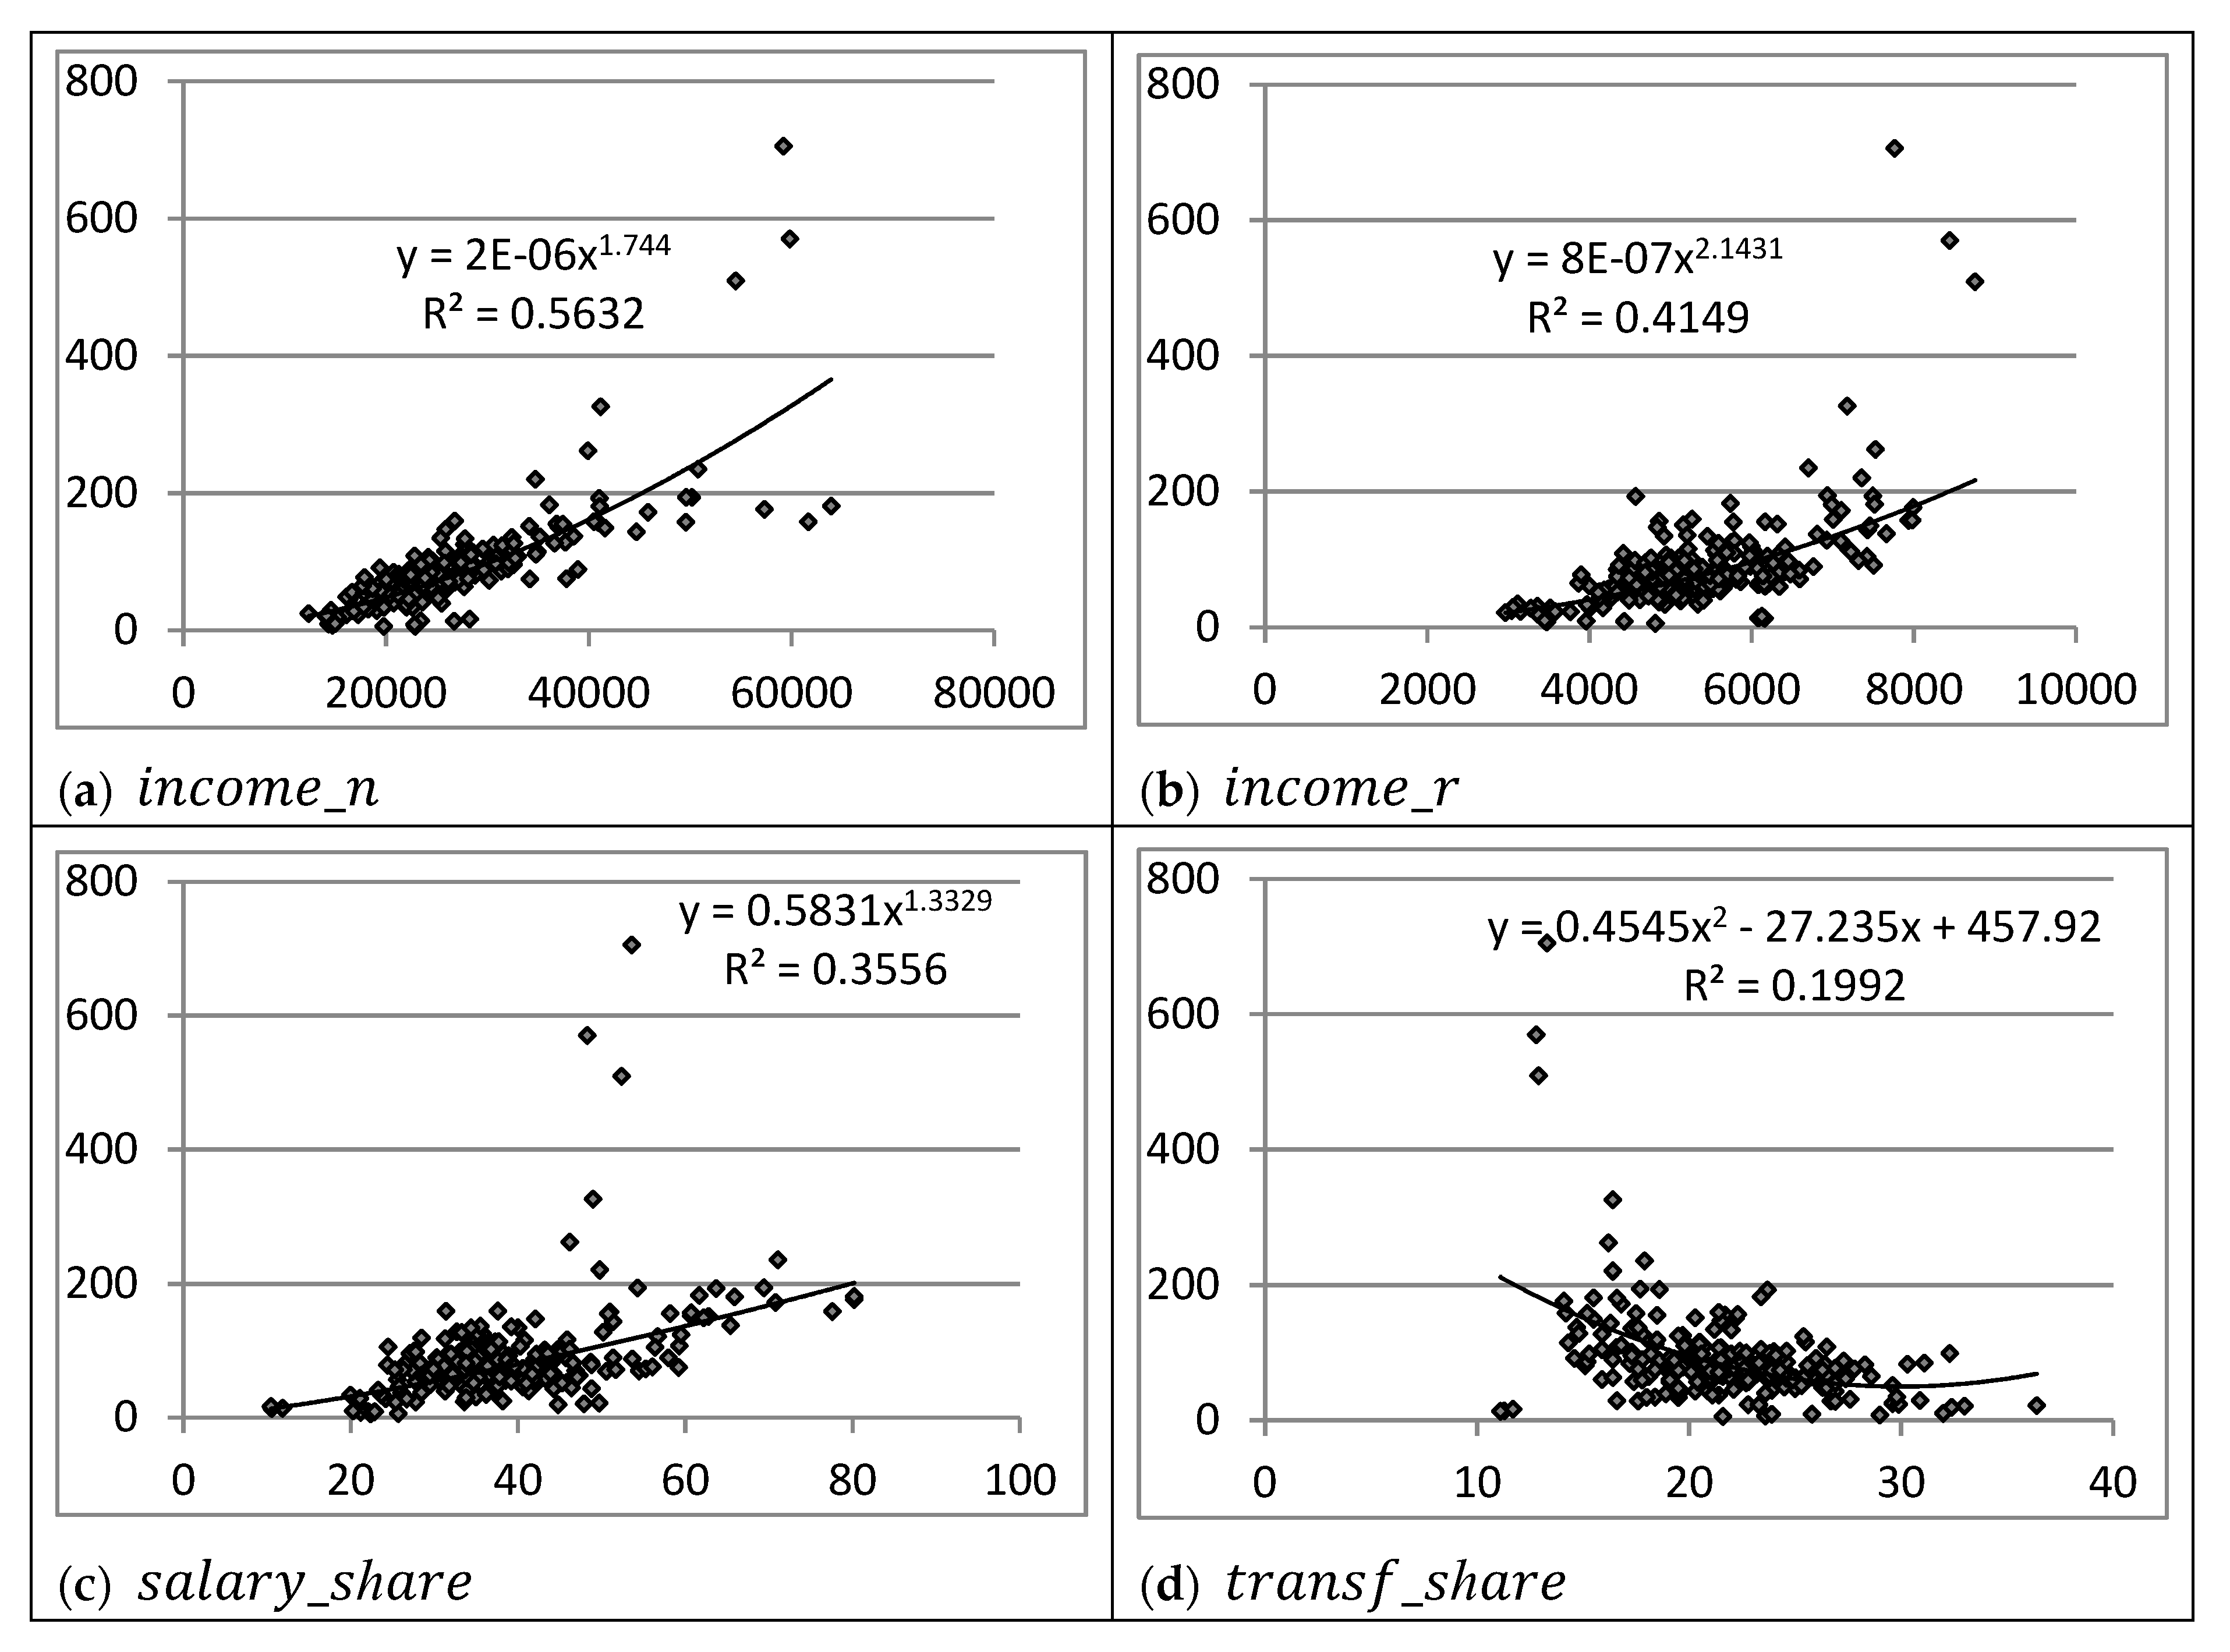
- indicators characterizing the level of personal income in the regions:
- -
- average nominal income per capita—;
- -
- average real income per capita—. To calculate real income, we used a double deflator, representing the ratio of the cost of a fixed consumer basket in a particular region in a certain year to the cost of the same basket on average in Russia in the base year 2001. Thus, we have eliminated both the effect of the relative cost of living in the regions, and the influence of inflation on income growth over time;
- (2)
- indicators characterizing the structure of personal income in the regions:
- -
- the share of wages (salary) in personal income—;
- -
- the share of social transfers—;
- -
- the share of property income—;
- -
- the share of entrepreneurship income—;
- -
- the share of informal income—;
- (3)
- indicators characterizing the structure of personal expenditure in the regions:
- -
- the share of consumption of goods and services in total household expenditure—;
- -
- the share of mandatory payments in total household expenditure—;
- -
- their total value—;
- (4)
- indicators of interpersonal inequality and income differentiation in the regions:
- -
- the portion of the population with income below the subsistence minimum level—;
- -
- the Gini coefficient for personal income—;
- -
- the decile coefficient, which is the ratio of the total income of the richest 10% to the income of the poorest 10%—.
- (5)
- indicators characterizing the demographic structure of the population in the regions:
- -
- the ratio of people over working age (pensionable age) to people of working age (able-bodied age)—;
- -
- the ratio of people under working age to people of working age—;
- -
- demographic burden, which is the number of people under and over working age per 1000 people of working age—;
- -
- fertility rate, number of children per woman—;
- (6)
- indicators characterizing the state of the labor market in the regions:
- -
- employment rate—;
- -
- registered unemployment rate—;
- -
- the ratio of employees to pensioners—;
- (7)
- indicators characterizing the level of accumulated wealth of the population:
- -
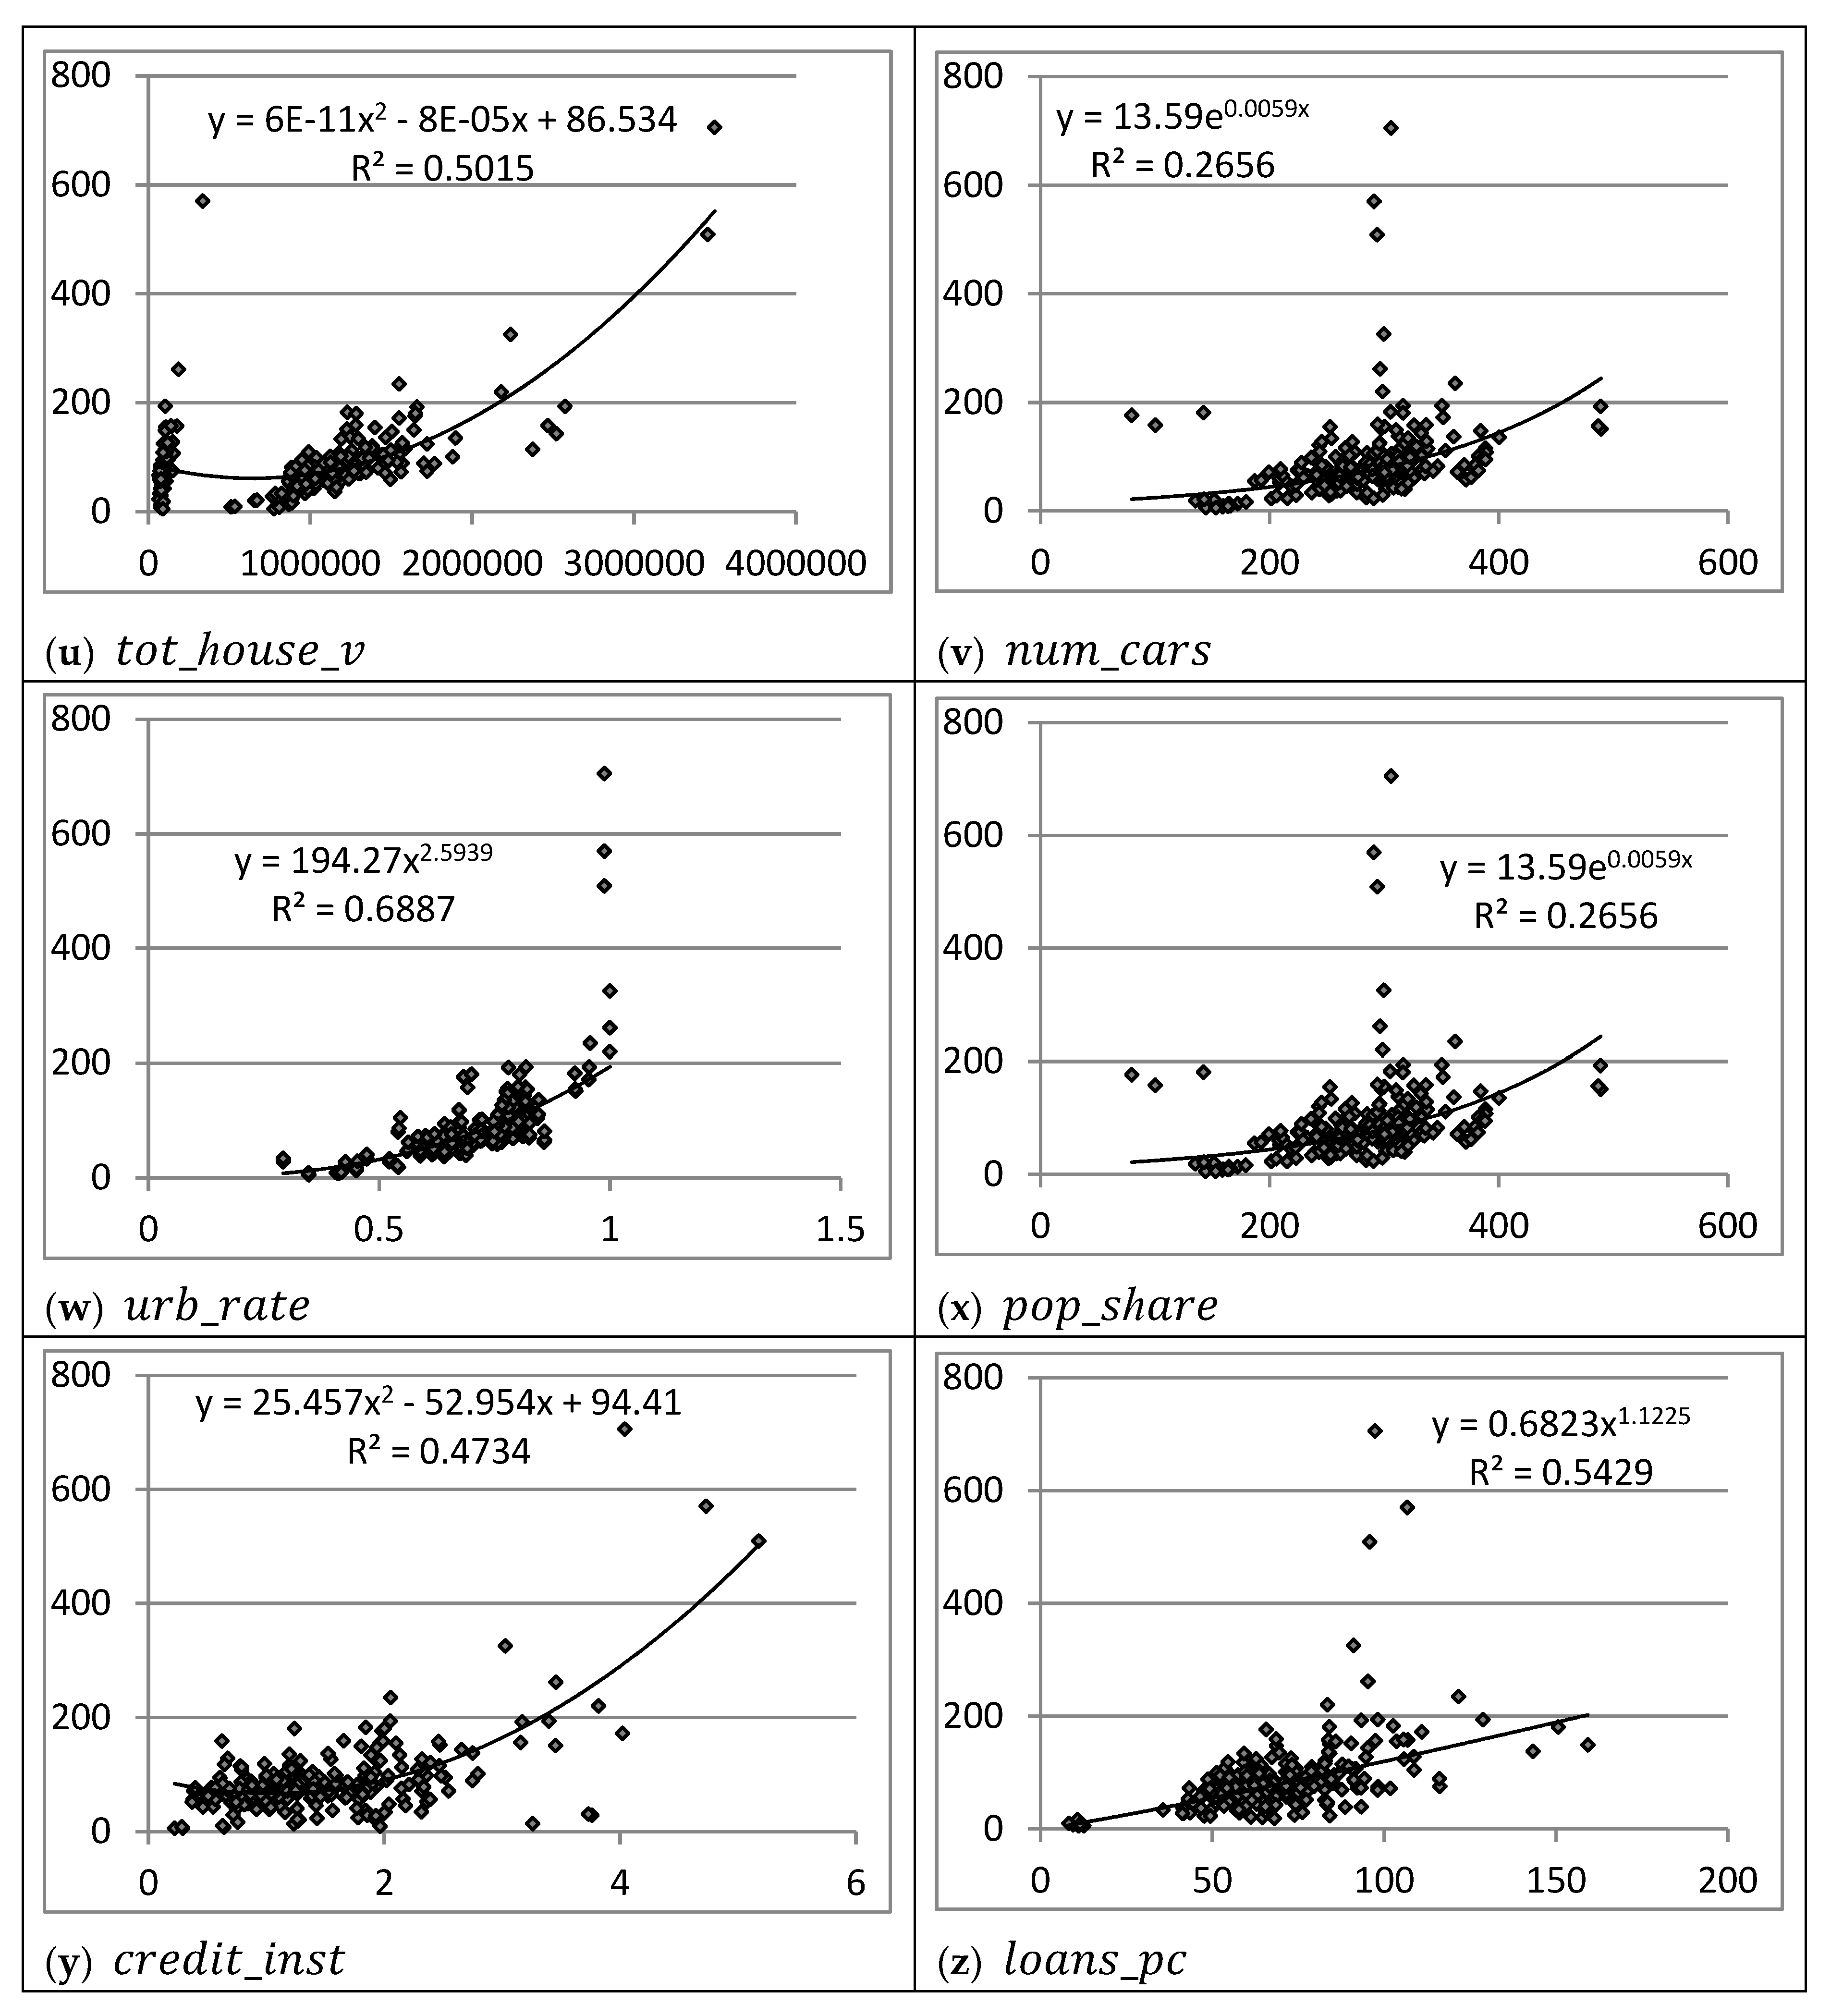
- the value of secondary housing per capita, calculated as the product of the average housing availability (square meters per capita) and the average price per square meter of housing in the secondary market—;
- -
- the price of one square meter of housing in the primary market—;
- -
- the total value of housing per capita, determined by summing the value of secondary and primary housing per capita (the latter was calculated as the product of the new housing commissioning in square meters per capita and the price of 1 sq. m of housing in the primary market)—;
- -
- the number of cars per 1000 inhabitants (we did not take into account their average prices due to the lack of necessary information by region)—;
- (8)
- indicators characterizing agglomeration and scale effects:
- -
- the share of urban population in the region—;
- -
- the share of the region in the total population of the country—;
- (9)
- indicators of the development of the financial system in the regions:
- -
- number of credit institutions per 100 thousand inhabitants—;
- -
- accumulated debt on private loans per capita—.
3.2. Methods
4. Results
5. Discussion
Funding
Conflicts of Interest
Appendix A
| Variables | Mean | Median | Min. | Max. | St. dev. | CV | Skew. | Kurt. |
|---|---|---|---|---|---|---|---|---|
| 26,378.8 | 24,118.0 | 12,398.0 | 63,909.0 | 8699.2 | 0.33 | 1.84 | 4.25 | |
| 5351.0 | 5199.1 | 2964.8 | 8755.5 | 1067.6 | 0.20 | 0.47 | 0.37 | |
| 38.83 | 36.55 | 10.50 | 80.20 | 11.47 | 0.30 | 0.94 | 1.59 | |
| 21.70 | 21.55 | 11.10 | 36.40 | 4.26 | 0.20 | 0.22 | 0.31 | |
| 4.30 | 4.10 | 0.10 | 15.10 | 1.98 | 0.46 | 1.69 | 7.96 | |
| 8.77 | 8.25 | 0.80 | 27.20 | 3.87 | 0.44 | 1.32 | 4.09 | |
| 26.39 | 28.20 | 0.20 | 51.30 | 11.15 | 0.42 | −0.37 | −0.18 | |
| 69.11 | 70.45 | 28.60 | 87.10 | 9.04 | 0.13 | −1.58 | 4.11 | |
| 11.05 | 11.00 | 3.00 | 18.00 | 2.69 | 0.24 | −0.23 | 0.91 | |
| 80.16 | 81.50 | 41.90 | 96.70 | 8.74 | 0.11 | −1.80 | 4.83 | |
| 14.84 | 14.00 | 7.00 | 42.10 | 5.42 | 0.37 | 1.86 | 5.28 | |
| 0.38 | 0.38 | 0.33 | 0.45 | 0.02 | 0.06 | 0.40 | −0.22 | |
| 12.79 | 12.35 | 9.00 | 20.90 | 2.06 | 0.16 | 0.84 | 0.57 | |
| 0.42 | 0.43 | 0.16 | 0.55 | 0.09 | 0.21 | −1.02 | 0.79 | |
| 0.33 | 0.32 | 0.23 | 0.63 | 0.07 | 0.21 | 2.29 | 6.76 | |
| 747.5 | 753.5 | 541.0 | 914.0 | 59.8 | 0.08 | −0.54 | 0.57 | |
| 1.82 | 1.78 | 1.28 | 3.49 | 0.31 | 0.17 | 2.34 | 9.06 | |
| 64.08 | 64.35 | 48.40 | 81.20 | 4.72 | 0.07 | −0.14 | 2.13 | |
| 1.62 | 1.20 | 0.40 | 15.70 | 1.90 | 1.17 | 5.34 | 31.11 | |
| 1.58 | 1.53 | 0.84 | 2.96 | 0.26 | 0.16 | 1.74 | 6.80 | |
| 1,232,430 | 1,150,720 | 411,110 | 3,672,350 | 420,765 | 0.34 | 2.54 | 10.90 | |
| 25,130.3 | 21,492.6 | 1905.9 | 111,354.0 | 15,312.3 | 0.61 | 2.37 | 8.56 | |
| 857,519 | 966,746 | 66,017 | 3,498,380 | 645,424 | 0.75 | 0.60 | 1.06 | |
| 283.10 | 290.93 | 79.54 | 489.16 | 58.31 | 0.21 | −0.13 | 2.09 | |
| 0.70 | 0.71 | 0.29 | 1.00 | 0.13 | 0.19 | −0.60 | 0.99 | |
| 0.01 | 0.01 | 0.00 | 0.09 | 0.01 | 1.00 | 3.07 | 13.29 | |
| 1.52 | 1.36 | 0.22 | 5.18 | 0.80 | 0.53 | 1.34 | 2.75 | |
| 68.49 | 65.44 | 8.23 | 159.31 | 22.46 | 0.33 | 0.42 | 2.27 | |
| 89.13 | 75.35 | 5.65 | 705.37 | 73.11 | 0.82 | 4.75 | 31.59 |
Appendix B


Appendix C


References
- Aaberge, Rolf, Kai Liu, and Yu Zhu. 2017. Political uncertainty and household savings. Journal of Comparative Economics 45: 154–70. [Google Scholar] [CrossRef]
- Agrawal, Pradeep, Pravakar Sahoo, and Ranjan Kumar Dash. 2009. Savings behaviour in South Asia. Journal of Policy Modeling 31: 208–24. [Google Scholar] [CrossRef]
- Babiarz, Patryk, and Cliff A. Robb. 2014. Financial Literacy and Emergency Saving. Journal of Family and Economic Issues 35: 40–50. [Google Scholar] [CrossRef]
- Bagliano, Fabio C., Carolina Fugazza, and Giovanna Nicodano. 2019. Life-cycle portfolios, unemployment and human capital loss. Journal of Macroeconomics 60: 325–40. [Google Scholar] [CrossRef]
- Bernheim, Douglas. 1995. Do households appreciate their financial vulnerabilities? An analysis of actions, perceptions, and public policy. In Tax Policy and Economic Growth in 1990s. Washington: American Council for Capital Formation, pp. 1–30. [Google Scholar]
- Binswanger, Johannes. 2010. Understanding the heterogeneity of savings and asset allocation: A behavioral-economics perspective. Journal of Economic Behavior and Organization 76: 296–317. [Google Scholar] [CrossRef]
- Bosworth, Вarry, and Gabriel Chodorow-Reich. 2006. Saving and Demographic Change: The Global Dimension. Prepared for the 8th Annual Joint Conference of the Retirement Research Consortium, Pathways to a Secure Retirement, Washington, DC; pp. 1–27. Available online: https://www.nber.org/programs/ag/rrc/7.2.pdf (accessed on 25 April 2019).
- Carroll, Christopher D. 1997. Buffer Stock Saving and the Life Cycle/Permanent Income Hypothesis. Quarterly Journal of Economics 112: 1–55. [Google Scholar] [CrossRef]
- Chamon, Marcos, Kai Liu, and Eswar S. Prasad. 2013. Income uncertainty and household savings in China. Journal of Development Economics 105: 164–77. [Google Scholar] [CrossRef]
- Chu, Tianshu, and Qiang Wen. 2017. Can income inequality explain China’s saving puzzle? International Review of Economics and Finance 52: 222–35. [Google Scholar] [CrossRef]
- Cristadoro, Riccardo, and Daniela Marconi. 2012. Urban and Rural Household Savings in China: Determinants and Policy Implications. In The Chinese Economy. Recent Trends and Policy Issues. Edited by Giorgio Gomel, Daniela Marconi, Ignazio Musu and Beniamino Quintieri. Berlin and Heidelberg: Springer, pp. 101–135. [Google Scholar] [CrossRef]
- Curtis, Chadwick C., Steven Lugauer, and Nelson C. Mark. 2017. Demographics and aggregate household saving in Japan, China, and India. Journal of Macroeconomics 51: 175–91. [Google Scholar] [CrossRef]
- Deaton, Angus S. 1991. Saving and Liquidity Constraints. Econometrica 59: 1221–48. [Google Scholar] [CrossRef]
- De Mello, Luiz, Per Mathis Kongsrud, and Robert Price. 2004. Saving Behavior and the Effectiveness of Fiscal Policy. OECD Economics Department Working Papers 397. Paris, French: OECD Publishing, pp. 1–38. Available online: https://ideas.repec.org/p/oec/ecoaaa/397-en.html (accessed on 25 April 2019). [CrossRef]
- De Serres, Alain, and Florian Pelgrin. 2002. The Decline in Private Saving Rates in the 1990s in OECD Countries: How Much Can Be Explained by Non-Wealth Determinants? OECD Economics Department Working Papers 344. Paris, French: OECD Publishing, pp. 1–49. Available online: https://ideas.repec.org/p/oec/ecoaaa/344-en.html (accessed on 25 April 2019).
- Doker, A. Cansin, Adem Turkmen, and O. Selcuk Emsen. 2016. What Are the Demographic Determinants of Savings? An Analysis on Transition Economies (1993–2013). Procedia Economics and Finance 39: 275–83. [Google Scholar] [CrossRef]
- Dynan, Karen E., Jonathan S. Skinner, and Stephen P. Zeldes. 2004. Do So the rich save more? Journal of Political Economy 112: 397–444. [Google Scholar] [CrossRef]
- Edwards, Sebastian. 1995. Why Are Saving Rates So Different Across Countries? An International Comparative Analysis. NBER Working Paper 5097. Cambridge, MA, USA: NBER. Available online: https://www.nber.org/papers/w5097 (accessed on 25 April 2019). [CrossRef]
- Fisher, Irving. 1907. The Rate of Interest: Its Nature, Determination, and Relation to Economic Phenomena. New York: The Macmillan Co., pp. 1–442. [Google Scholar]
- Fisher, Patti J., and Catherine P. Montalto. 2011. Loss aversion and saving behavior: Evidence from the 2007 U.S. Survey of Consumer Finances. Journal of Family and Economic Issues 32: 4–14. [Google Scholar] [CrossRef]
- Friedman, Milton. 1957. The Permanent Income Hypothesis. In A theory of the consumption function. Princeton: Princeton University Press, pp. 20–37. [Google Scholar]
- Ge, Suqin, Dennis Tao Yang, and Junsen Zhang. 2018. Population policies, demographic structural changes, and the Chinese household saving puzzle. European Economic Review 101: 181–209. [Google Scholar] [CrossRef]
- Grigoli, Francesco, Alexander Herman, and Klaus Schmidt-Hebbel. 2014. World Saving. IMF Working Paper WP/14/204. pp. 1–54. Available online: https://www.imf.org/external/pubs/ft/wp/2014/wp14204.pdf (accessed on 25 April 2019).
- He, Hui, Feng Huang, Zheng Liu, and Dongming Zhu. 2018. Breaking the “iron rice bowl:” Evidence of precautionary savings from the Chinese state-owned enterprises reform. Journal of Monetary Economics, 94. [Google Scholar] [CrossRef]
- Horioka, Charles Yuji, and Junmin Wan. 2007. The Determinants of Household Saving in China: A Dynamic Panel Analysis of Provincial Data. Journal of Money, Credit and Banking 39: 2077–96. [Google Scholar] [CrossRef]
- Hüfner, Felix, and Isabell Koske. 2010. Explaining Household Saving Rates in G7 Countries: Implications for Germany. OECD Economics Department Working Papers 754. Paris, French: OECD Publishing. Available online: http://dx.doi.org/10.1787/5kmjv81n9phc-en (accessed on 27 March 2017). [CrossRef]
- Kapounek, Svatopluk, Petr Korab, and Vilma Deltuvaite. 2016. (Ir)rational households’ saving behavior? An empirical investigation. Economics and Finance 39: 625–33. [Google Scholar] [CrossRef]
- Loayza, Norman, Klaus Schmidt-Hebbel, and Luis Servén. 2000. What drives private saving across the world? Review of Economics and Statistics 82: 165–81. [Google Scholar] [CrossRef]
- Li, Hongyi, and Heng-fu Zou. 2004. Savings and income distribution. Annals of Economics and Finance 5: 245–70. [Google Scholar]
- Malkina, Marina. 2017. Contribution of various income sources to interregional inequality of the per capita income in the Russian Federation. Equilibrium. Quarterly Journal of Economics and Economic Policy 12: 399–416. [Google Scholar] [CrossRef]
- Malkina, Marina Yu, and Irina Yu Khramova. 2019. Determinants of Household Saving Behavior in Russia: An Econometric Analysis. Economic Analysis: Theory and Practice 18: 604–21. (In Russian). [Google Scholar] [CrossRef]
- Modigliani, Franco, and Richard H. Brumberg. 1954. Utility Analysis and the Consumption Function: An Interpretation of Cross-Section Data. In Post Keynesian Economics. Edited by K. Kurihara. New Brunswick: Rutgers University Press, pp. 388–436. [Google Scholar]
- Niculescu-Aron, Ileana, and Constanţa Mihaescu. 2012. Determinants of household saving in EU: What policies for increasing savings? Social and Behavioral Sciences 58: 483–92. [Google Scholar] [CrossRef]
- Orji, Anthony. 2012. Bank Savings and Bank Credits in Nigeria: Determinants and Impact on Economic Growth International. Journal of Economics and Financial Issues 2: 357–72. [Google Scholar]
- Rha, Jong-Youn, Catherine P. Montalto, and Sherman D. Hanna. 2006. The effect of self-control mechanisms on household saving behavior. Financial Counseling and Planning 17: 3–16. [Google Scholar]
- Rocher, Stijn, and Michael H. Stierle. 2015. Household Saving Rates in the EU. Why Do They Differ So Much? European Economy Discussion Paper 005. Luxembourg: Publications Office of the European Union. 36p, Available online: https://ec.europa.eu/info/sites/info/files/dp005_en.pdf (accessed on 25 April 2019).
- Sahoo, Pravakar, and Ranjan Kumar Dash. 2013. Financial sector development and domestic savings in South Asia. Economic Modelling 33: 388–97. [Google Scholar] [CrossRef]
- Uddin, Gazi A., Khorshed Alam, and Jeff Gow. 2016. Population age structure and savings rate impacts on economic growth: Evidence from Australia. Economic Analysis and Policy 52: 23–33. [Google Scholar] [CrossRef]
- VCIOM (Russian Public Opinion Research Center). 2017. Savings and Income: How Much Money Is Needed for Happiness? 25 September 2017. Available online: https://wciom.ru/index.php?id=236&uid=3591 (accessed on 27 March 2017).
- Yuh, Yoonkyung, and Sherman D. Hanna. 2010. Which households think they save? Journal of Consumer Affairs 44: 70–97. [Google Scholar] [CrossRef]

| Independent Variables | Model 1 | Model 2 | Model 3 | Model 4 | Model 5 | Model 6 | Model 7 |
|---|---|---|---|---|---|---|---|
| 1.246 (0.096) *** | 0.981 (0.071) *** | 1.005 (0.074) *** | 0.909 (0.074) *** | 0.876 (0.073) *** | 0.927 (0.059) *** | 0.949 (0.060) *** | |
| 0.480 (0.045) *** | 0.395 (0.051) *** | 0.463 (0.051) *** | 0.297 (0.063) *** | - | 0.373 (0.050) *** | 0.334 (0.050) *** | |
| 0.429 (0.026) *** | 0.387 (0.027) *** | 0.341 (0.029) *** | 0.361 (0.028) *** | 0.329 (0.027) *** | 0.297 (0.027) *** | 0.309 (0.027) *** | |
| - | - | - | - | 0.335 (0.060) *** | - | - | |
| −0.468 (0.254) * | - | - | - | - | - | - | |
| - | - | 0.235 (0.071) *** | - | - | - | - | |
| - | - | - | - | - | −0.841 (0.077) *** | −0.967 (0.075) *** | |
| −0.581 (0.088) *** | −0.492 (0.088) *** | −0.421 (0.094) *** | −0.500 (0.091) *** | −0.385 (0.085) *** | - | - | |
| - | - | - | - | 1.137 (0.161) *** | - | - | |
| - | - | - | - | - | - | 0.062 (0.025) ** | |
| - | - | - | 0.200 (0.074) *** | - | - | - | |
| 0.306 (0.052) *** | 0.319 (0.051) *** | 0.346 (0.052) *** | 0.291 (0.049) *** | 0.300 (0.051) *** | 0.269 (0.048) *** | 0.278 (0.046) *** | |
| 0.167 (0.049) *** | 0.143 (0.059) ** | - | 0.119 (0.063) * | - | - | - | |
| 0.401 (0.086) *** | 0.364 (0.083) *** | 0.438 (0.088) *** | 0.483 (0.077) *** | 0.280 (0.084) *** | 0.244 (0.081) *** | ||
| 0.185 (0.022) *** | 0.185 (0.021) *** | 0.203 (0.021) *** | 0.171 (0.020) *** | 0.187 (0.020) *** | 0.193 (0.019) *** | 0.193 (0.018) *** | |
| - | - | - | 0.091 (0.047) * | - | 0.112 (0.033) *** | 0.144 (0.036) *** | |
| R2 adjusted | 0.954 | 0.959 | 0.959 | 0.961 | 0.962 | 0.967 | 0.968 |
| AIC | −252.15 | −276.76 | −280.03 | −285.51 | −299.44 | −333.66 | −338.52 |
| SC | −224.30 | −248.91 | −252.19 | −250.71 | −271.59 | −305.82 | −307.20 |
| χ2 (p-value) | 0.212 | 0.109 | 0.102 | 0.409 | 0.221 | 0.340 | 0.716 |
| Independent Variables | Model 8 | Model 9 | Model 10 | Model 11 | Model 12 | Model 13 | Model 14 |
|---|---|---|---|---|---|---|---|
| const | −6.330 (0.231) *** | −6.056 (0.237) *** | −6.855 (0.325) *** | −6.499 (0.267) *** | −7.137 (0.397) *** | −6.392 (0.267) *** | −7.121 (0.393) *** |
| 0.241 (0.021) *** | 0.209 (0.022) *** | 0.181 (0.023) *** | 0.295 (0.034) *** | 0.294 (0.034) *** | 0.298 (0.034) *** | 0.297 (0.033) *** | |
| 0.086 (0.016) *** | 0.072 (0.016) *** | 0.046 (0.017) *** | 0.072 (0.016) *** | 0.073 (0.016) *** | 0.080 (0.016) *** | 0.080 (0.016) *** | |
| 0.149 (0.009) *** | 0.147 (0.009) *** | 0.144 (0.009) *** | 0.147 (0.009) *** | 0.147 (0.009) *** | 0.139 (0.009) *** | 0.139 (0.009) *** | |
| - | - | - | −0.124 (0.037) *** | - | −0.143 (0.038) *** | - | |
| - | - | - | - | −0.341 (0.103) *** | - | −0.390 (0.104) *** | |
| −0.126 (0.030) *** | −0.124 (0.030) *** | −0.075 (0.032) ** | −0.117 (0.029) *** | −0.118 (0.030) *** | −0.070 (0.035) ** | −0.072 (0.034) ** | |
| - | - | 0.280 (0.081) *** | - | - | - | - | |
| - | - | - | - | - | −0.024 (0.010) ** | −0.024 (0.010) ** | |
| - | 0.102 (0.028) *** | 0.066 (0.029) ** | 0.120 (0.028) *** | 0.119 (0.028) *** | 0.109 (0.028) *** | 0.108 (0.028) *** | |
| 0.010 (0.003) *** | 0.010 (0.003) *** | 0.010 (0.003) *** | 0.012 (0.003) *** | 0.012 (0.003) *** | 0.011 (0.003) *** | 0.011 (0.003) *** | |
| 0.069 (0.018) *** | 0.073 (0.018) *** | 0.079 (0.017) *** | 0.068 (0.017) *** | 0.068 (0.017) *** | 0.065 (0.017) *** | 0.065 (0.017) *** | |
| 0.098 (0.030) *** | 0.106 (0.029) *** | 0.112 (0.029) *** | 0.074 (0.031) ** | 0.074 (0.030) ** | 0.083 (0.030) *** | 0.083 (0.030) *** | |
| 0.026 (0.007) *** | 0.018 (0.007) *** | 0.022 (0.007) *** | 0.019 (0.007) *** | 0.019 (0.007) *** | 0.020 (0.007) *** | 0.020 (0.007) *** | |
| Mean of dependent variable (standard deviation) | 4.281 (0.668) | 4.281 (0.668) | 4.281 (0.668) | 4.281 (0.668) | 4.281 (0.668) | 4.281 (0.668) | 4.281 (0.668) |
| R2 adjusted | 0.921 | 0.925 | 0.929 | 0.928 | 0.928 | 0.930 | 0.930 |
| AIC | −727.89 | −739.05 | −749.36 | −748.22 | −748.34 | −752.44 | −752.45 |
| SC | −696.57 | −704.24 | −711.57 | −709.94 | −710.06 | −710.68 | −710.69 |
| χ2 (p-value) | 0.452 | 0.372 | 0.553 | 0.609 | 0.622 | 0.695 | 0.728 |
| Variables | Mean | Median | Min. | Max. | St. dev. | CV |
|---|---|---|---|---|---|---|
| 1.215 | 1.230 | 0.529 | 1.861 | 0.181 | 0.149 | |
| 0.327 | 0.331 | 0.142 | 0.501 | 0.049 | 0.149 | |
| 0.619 | 0.618 | 0.421 | 1.089 | 0.076 | 0.123 | |
| −0.376 | −0.373 | −0.450 | −0.330 | 0.022 | −0.059 | |
| −0.189 | −0.191 | −0.226 | −0.115 | 0.015 | −0.082 | |
| −0.092 | −0.094 | −0.129 | −0.042 | 0.012 | −0.134 | |
| 0.513 | 0.521 | 0.213 | 0.773 | 0.080 | 0.156 | |
| 0.046 | 0.047 | 0.020 | 0.070 | 0.007 | 0.149 | |
| 0.265 | 0.268 | 0.115 | 0.406 | 0.039 | 0.149 | |
| 0.441 | 0.446 | 0.185 | 0.687 | 0.065 | 0.146 | |
| 0.083 | 0.085 | 0.038 | 0.125 | 0.012 | 0.147 |
© 2019 by the author. Licensee MDPI, Basel, Switzerland. This article is an open access article distributed under the terms and conditions of the Creative Commons Attribution (CC BY) license (http://creativecommons.org/licenses/by/4.0/).
Share and Cite
Malkina, M. Determinants of Private Savings in the Form of Bank Deposits: A Case Study on Regions of the Russian Federation. Economies 2019, 7, 63. https://doi.org/10.3390/economies7020063
Malkina M. Determinants of Private Savings in the Form of Bank Deposits: A Case Study on Regions of the Russian Federation. Economies. 2019; 7(2):63. https://doi.org/10.3390/economies7020063
Chicago/Turabian StyleMalkina, Marina. 2019. "Determinants of Private Savings in the Form of Bank Deposits: A Case Study on Regions of the Russian Federation" Economies 7, no. 2: 63. https://doi.org/10.3390/economies7020063
APA StyleMalkina, M. (2019). Determinants of Private Savings in the Form of Bank Deposits: A Case Study on Regions of the Russian Federation. Economies, 7(2), 63. https://doi.org/10.3390/economies7020063


