1. Introduction
As the Four Asian Tigers (Korea, Hong Kong, Singapore, and Taiwan) achieved high economic growth based on export-led growth policy, many developing countries have also pursued an export promotion policy (
Bhagwati 1988;
Edwards 1998). When a country starts exporting a commodity, the country faces competition in the global market. Exporters adopt advanced technology and management systems, which in turn lead to an improvement in productivity (
Loecker 2007;
Agarwal 2014). Consequently, a country can increase industrial production, employment, and economic growth by exporting. Therefore, the role of export in economic growth has been emphasized in many studies (
Barro and Sala-i-Martin 1992).
India recognized the importance of export in the early 1980s when India introduced limited liberalization and deregulation for economic growth. From Independence in 1947 until 1980, the Indian economy was governed by the socialistic planned economic system with import substitution policy and industrial licensing (
Kim 2018). As a result, the Indian economy suffered from low productivity and efficiency, and the average growth rate of the Indian economy from 1950 to 1980 averaged 3.5% annually, which is widely known as the Hindu Rate of Growth (
Ahluwalia 1995). The Indian economy faced full-scale economic reforms in 1991, in which liberalization and globalization were emphasized. Likewise, export has been an important issue in the Indian economic policy since the early 1980s. However, India’s export performance has not been fascinating. In 2016, India’s contribution to the world export was limited to only 1.6% of the total, whereas China’s share was 17%. In addition, the current Indian government initiated the ‘Make in India’ scheme in 2014 to develop the manufacturing sector, in which improvement in exports and employment generation is accentuated. Nonetheless, the share of manufacturing sector in India’s exports decreased from 80% in 1990 to 61.9%
1 in 2017 (
Anand et al. 2015, p. 6), which is similar to those of the advanced countries like U.S. In the case of China, the contribution of manufacturing exports to the total was 90%. Therefore, India with the world’s second largest population has the problem of unemployment. In this context, it is necessary to examine India’s manufacturing export performance in terms of competitiveness. In particular, we focused on the textiles and clothing (T&C) industry, one of the oldest and most important industries in India. The T&C sector is traditionally important for the Indian economy due to its significant contribution to export, industrial production, and employment generation. The share of this sector in India’s total exports was 12.4% from April to November in 2017. This industry has a 7% share of industrial production, 2% share of Gross Domestic Product (GDP), and 15% share of exports in India, according to the Annual Report by the
Ministry of Textiles (
2018, p. 1). As T&C is a labor-intensive industry, this sector directly employs 45 million people and indirectly employs 60 million people—the second largest employment-generating industry after the agricultural sector in India (
Ministry of Textiles 2018, p. 51). T&C export underwent substantial changes due to the emergence of the global value chain (GVC) and the multi-fiber arrangement (MFA) phase-out. MFA was implemented to impose quotas so that advanced countries could source T&C from developing countries from 1974 to 1994. The Agreement on Textiles and Clothing (ATC) succeeded MFA from 1994 to 2005.
Export competitiveness, in which comparative advantage plays a crucial role, refers to the capability to sell in the global market (
Ketels 2010;
Gupta 2009). Therefore, we calculated the Revealed Comparative Advantage (RCA), the Comparative Advantage by Countries (CAC), and the Market Comparative Advantage (MCA) of India’s T&C, which are based on the concept of comparative advantage. This study particularly examines India’s export performance of T&C in the U.S. market, one of the world’s largest T&C consumers and India’s largest T&C export destination. The U.S. share of India’s total T&C export was 20.9% in 2017. From the U.S. side, India was the third largest importer of T&C after China and Vietnam in 2017. Vietnam and other developing countries, such as Bangladesh and Pakistan, emerged as major exporters of T&C in the global market after the MFA phase-out in 2005 because of their lower labor cost. This indicates that the competition in the global T&C industry intensified after the MFA phase-out. Therefore, it is timely to determine if India’s T&C export competitiveness is sustainable in the U.S. market in the future.
Previous studies on India’s exports in the T&C sector, which were published before 2005, mainly investigated the impacts of MFA phase-out on the export performance of India’s T&C. The competition in the global T&C market was expected to intensify after the MFA phase-out, significantly impacting India’s exports (
Hashim 2005). In a competitive market, deregulation and labor reforms were required to improve export performance, as stated by
Kathuria and Bhardwaj (
1998).
Nordas (
2004) reported that developing countries with lower labor costs, such as India and China, benefitted from the MFA phase-out.
A number of researchers analyzed the export competitiveness of India’s T&C. Most studies (
Kathuria 2013,
2018;
Dhiman and Sharma 2017;
Kannan 2018) analyzed export competitiveness based on RCA, which was developed by
Balassa (
1965).
Kathuria (
2013) examined the comparative advantage of India’s garment industry (HS Codes
2 61 and 62) by calculating RCA and dynamic RCA. He found that India maintained competitiveness in the case of HS Code 61 products from 1995 to 2003.
Dhiman and Sharma (
2017) showed that India enjoyed a comparative advantage in most textile products based on an RCA analysis from 2010 to 2014.
Kannan (
2018) showed that India’s comparative advantage in T&C deteriorated from 1995 to 2007. However, these studies calculated RCA in the global market as a whole and did not reflect the current years; therefore, this study extends the study period from 1991 to 2017. RCA has limitations: it cannot reflect the export competitiveness in a specific country. As the aim here was to investigate export competitiveness in a country, the U.S, we calculated the CAC and the MCA along with the RCA, which are measurements revised to reflect the comparative advantage in a country. CAC and MCA are revised to reflect comparative advantage in a specific market based on RCA.
The rest of this paper is organized as follows.
Section 2 provides an overview of India’s T&C industry.
Section 3 covers India’s export performance in the T&C industry. Methodology and data are covered in
Section 4. Results are discussed in
Section 5, and the last section provides the concluding remarks.
2. Overview of India’s Textiles and Clothing Industry
The T&C industry is traditionally important for the Indian economy due to its significant contributions to total exports, industrial production, and employment. According to the India Brand Equity Foundation, India’s T&C market was worth US
$150 billion in 2017, increasing from 70 billion US dollars in 2009 (
Figure 1). The share of this sector in India’s total exports was 12.4% from April to November in 2017. This industry has a 7% share of industrial production, 2% share of GDP, and 15% share of exports in India, according to the Annual Report by the
Ministry of Textiles (
2018, p. 1). As T&C is a labor-intensive industry, this sector directly employs 45 million people and indirectly employs 60 million people—the second largest employment-generating industry after the agricultural sector in India (
Ministry of Textiles 2018, p. 51). Many female workers and rural citizens are employed in this sector, empowering women and reducing poverty in rural areas. The contribution of Micro, Small and Medium Enterprises (MSMEs), particularly small- and micro-sized firms, in the T&C industry is larger compared to those of other sectors. Over 20% of registered MSMEs are engaged in the T&C sector, according to the fourth census on MSMEs (
Ministry of MSMEs 2009, p. 25). The report on the fourth census of MSMEs has two parts: registered and unregistered enterprises. According to the report, 66% of registered MSMEs were in the manufacturing sector, whereas 73% of unregistered MSMEs were in the service sector.
India’s T&C industry has strength and competitiveness in the global market because India has abundant raw materials, low labor costs, and vertically integrated production facilities (
Anthony and Joseph 2014, p. 22). As T&C is a labor-intensive industry, labor cost is a crucial factor in competitiveness and productivity. India’s labor cost is much lower compared to those of China and other countries, which makes India’s T&C attractive. In 2011, the manufacturing hourly compensation cost in India was US
$1.59, which was much lower than those of the U.S. and Korea, as shown in
Table 1. China’s manufacturing hourly compensation cost in 2011 was US
$2.62 and that of the Philippines was US
$2.02.
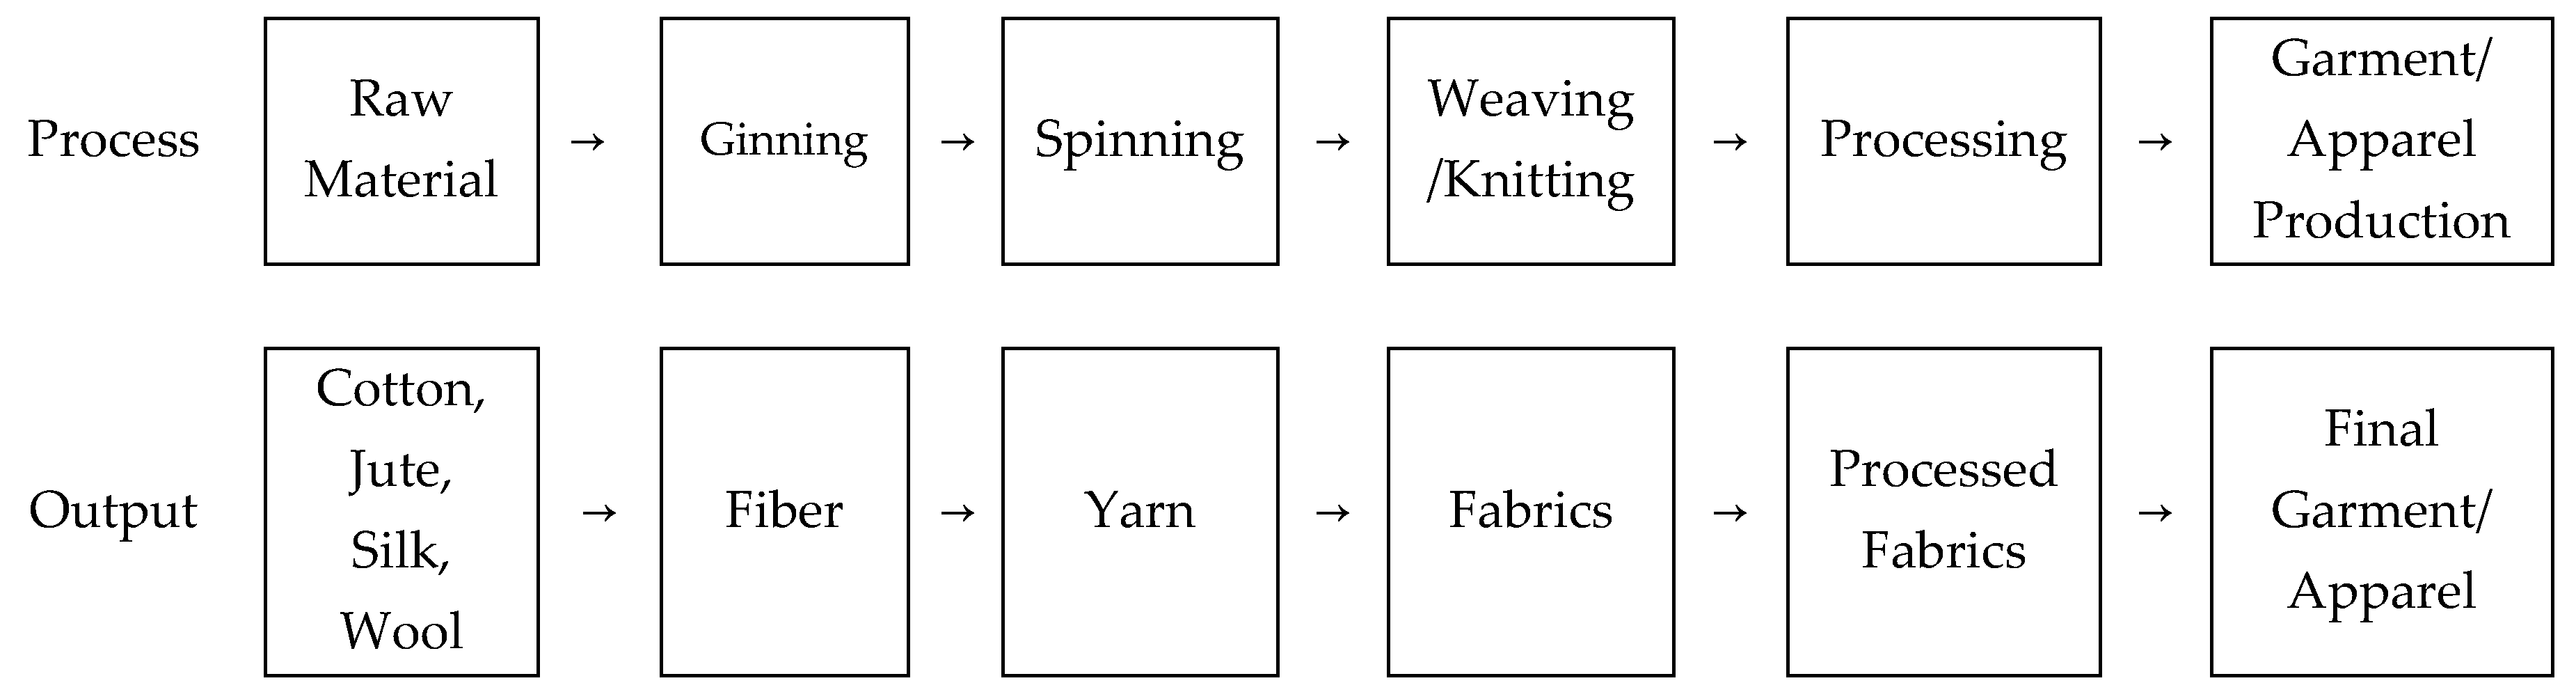
India is one of the world’s largest producers of textiles’ raw materials such as cotton, jute, and silk. Production facilities ranging from the hand-spun and hand-woven sectors to capital-intensive mills are also available in India, as shown in
Figure 2.
India’s ginning processing is well developed, so India’s cotton is of good quality (
Begum and Das 2018, pp. 37–38). India’s spinning processing also has price and variety competitiveness. In addition, vertical integration in production system leads to a lower production cost, as shown in
Table 2. India’s production costs of spun yarn and of woven and knitted fabrics were lower than those of China and other countries such as the U.S. and Korea.
The demand for technical textiles in the global market has been increasing; however, India is not competitive in this market due to the lack of technology and investment. According to a report submitted to the Ministry of Textiles in India, India’s price of man-made fiber ranges from 20% to 25%, more expensive than the international standard (
Wazir Advisors 2016, p. 45). For technological upgrading, the Indian government implemented the Technology Mission for Technical Textiles from FY2011 to FY2015
3. The Technology Upgradation Fund Scheme was introduced in 1999 and was implemented under the name “Revised Restructured Technology Upgradation Fund Scheme”. The Scheme for Integrated Textile Parks was launched in 2005 to provide infrastructure for textile production companies. To improve competitiveness and productivity, the Indian government allowed 100% foreign direct investment (FDI) in the T&C industry through an automatic route. From April in 2000 to June in 2018, the total FDI in India’s T&C was US
$2.97 billion. The major investors were from Mauritius, Singapore, Belgium, Japan, and the U.S.
3. India’s Export Performance of Textiles and Clothing Industry
India’s export of T&C substantially changed during the 1980s. Indian authorities recognized the importance of export and implemented an export promotion policy for economic growth in the early 1980s. As a major source of foreign exchange earnings, exports of the T&C sector were important for export performance (
Economic and Political Weekly 1982, p. 1517). The GVC system emerged in the early 1980s, which significantly affected global T&C export (
Tewari 2005). Therefore, India’s export of T&C increased over three-fold from 1981 to 1990 (
Chartterjee and Mohan 1993).
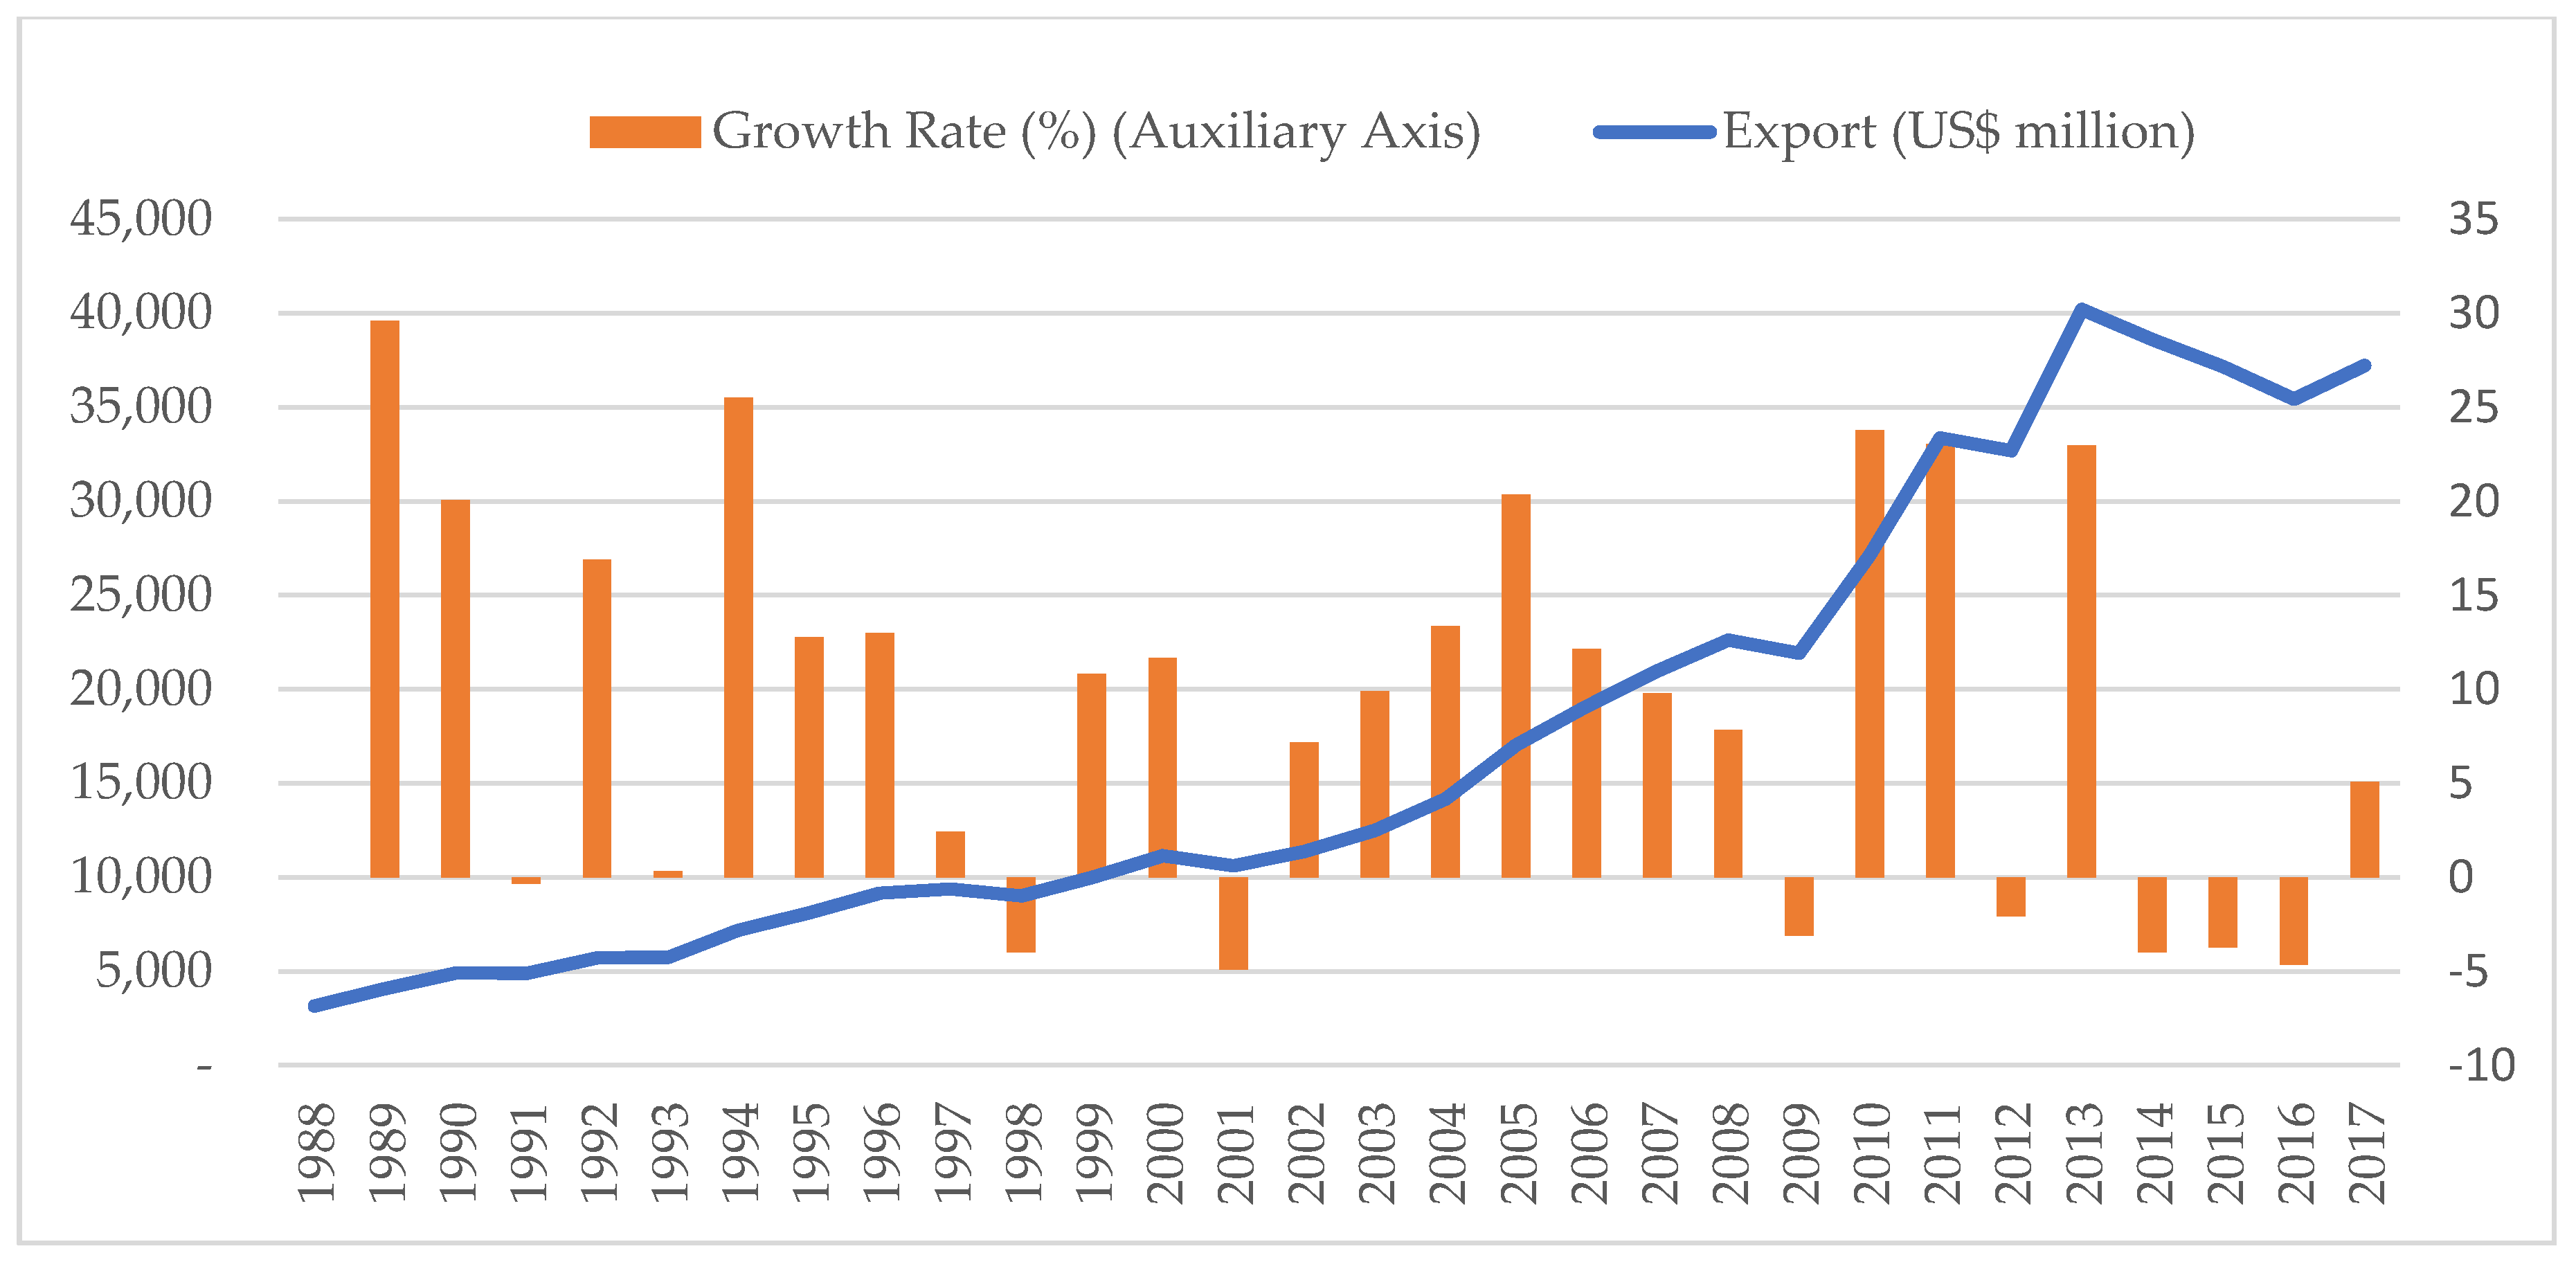
India’s export of T&C was US
$3.1 billion in 1988 and increased to US
$37.2 billion in 2017 at a compound annual growth rate (CAGR) of 8.6% (see
Figure 3).
According to the
WTO (
2018), India was the third largest exporter of textiles after China and the EU, and was the fifth largest exporter of clothing after China, the EU, Bangladesh, and Vietnam in 2017 (see
Table 3).
India exports a variety of T&C commodities, such as cotton yarn and fabrics, man-made yarn and fabrics, wool and silk fabrics, made-ups, and clothing.
Figure 4 shows the composition of Indian textile and apparel exports in 2005, 2010, and 2015. Clothing had the largest share, 43%, of India’s export of T&C in 2015 with an amount of US
$17 billion. Export of fiber and filament increased from US
$1 billion in 2005 to US
$4 billion in 2015, while export of yarn increased from US
$2 billion in 2005 to US
$4 billion in 2015.
India’s major export partners of T&C have been the U.S., UAE, U.K., and China as shown in
Table 4. As of 2017, the U.S. was the top export destination of India’s T&C with a share of 20.92%, followed by UAE (11.04%), Bangladesh (6.04%), UK (6.02%), and Germany (4.8%). From 1991 to 2017, the U.S. was the largest export destination of India’s T&C. India’s export of T&C to the U.S. substantially increased from US
$732.94 million in 1988 to US
$7.78 billion in 2017. Though the average growth rate of India’s T&C export to the U.S. slowed after the MFA phase-out, the average growth rate of India’s T&C export to the U.S. decreased from 12.2% during the period from 1988 to 2005 to 5.2% from 2006 to 2017. The share of India in the U.S. T&C imports was 3.94% in 1995 and increased to 7.18% in 2017.
4. Methodology and Data
4.1. Methodology
As the competition in the market increases with a globalized economy, export competitiveness has been accentuated by many scholars (
Balassa 1965;
Porter 1990;
Krugman 1994). Export competitiveness, in which comparative advantage plays an influential role, is generally defined as a country’s capacity to sell their goods in the global market (
Ketels 2010;
Gupta 2009). Therefore, we calculated the RCA, CAC, and MCA, which are based on the concept of comparative advantage.
Balassa (
1965) developed the RCA to examine the comparative advantage of a country’s specific product in a global market, which is based on market share. The RCA is calculated by the share of a country’s export of a commodity in the share of the respective country’s export in the world. RCA ranges from zero to infinity. An RCA greater than 1 implies that the country has a comparative advantage for a specific commodity in the world, reflecting its export competitiveness.
Country
a’s RCA of commodity
b in the world was calculated as follows:
where
is country
a’s total exports of commodity
b,
is country
a’s total exports,
is world exports of commodity
b, and
WX is world exports
The RCA explains the comparative advantage in terms of a specific product’s share in the global market, so it cannot reveal competitiveness in a specific market.
Kim (
2009) argued that differences exist in the export competitiveness between global and specific markets. The numerator of the RCA can be influenced by the economic size of the respective exporting country (
Kim et al. 1997).
The CAC was developed to analyze the comparative advantage in a specific country (
Min 1993, p. 72). The CAC also measures comparative advantage based on the share of the commodity’s exports, which is similar to the RCA. The CAC of country
a in the
c market with the commodity
b was measured as:
where
is country
a’s exports of commodity
b to country
c,
is country
a’s total exports to county
c,
is country
a’s total exports of commodity
b, and
is country
a’s total exports.
The CAC indicates the comparative advantage of a country’s commodity in a foreign country, which is calculated by the proportion of a country’s export of a commodity in a foreign country in terms of the proportion of export of the commodity in world exports. The CAC also ranges between zero and infinity. A CAC greater than 1 indicates a comparative advantage of a commodity in a foreign country.
The MCA was developed to examine the comparative advantage in a specific market based on the RCA (
Kim et al. 1997). The MCA of country
a in market
c with product
b was calculated as:
where
is country
a’s export of commodity
b to country
c,
is country
a’s total export to country
c,
is world export of commodity
b to country
c, and
is total export to country
c.
and
can be substituted by
and
, country
c’s imports of commodity
b and country
c’s total import, respectively, because a country’s total export is the same as the total import by a country in theory.
The MCA was calculated based on the share of a country’s export of a commodity in a foreign country in relation to the share of a foreign country’s import of a commodity in the world. The MCA also ranges between zero and infinity. An MCA greater than 1 indicates the comparative advantage of a country’s commodity in a foreign country.
4.2. Data
Data on India’s T&C exports to the U.S. were collected based on two-digit HS Codes 50–63, which are listed in
Section 6 of Textiles and Textile Articles. As shown in
Table 5, commodities from HS Codes 50–59 are related to fiber and fabrics, whereas commodities from HS Codes 60–63 are clothing and linen products, i.e., final products.
Data were obtained from UN Comtrade, which was developed by the World Bank and the United Nations Conference on Trade and Development (UNCTAD). The study period covers from 1991 to 2017 because data on the U.S. is available from 1991, while data on India is available from 1988 on UN Comtrade.
5. Results
As there are 14 categories in the T&C sector, we divided the HS codes into three groups to describe the results. The first group includes HS Codes 50–55, the second group covers HS Codes 56–60, and the third group covers HS Codes 61–63, which constitute final products, i.e., clothing and linen goods.
5.1. Revealed Comparative Advantage
The RCA shows the comparative advantage in the global market by measuring the export share of a country’s commodity in the global market in relation to the share of the respective country’s export in world exports. It was assumed that the international competitiveness, rather than demand in a foreign market, leads to an increase in export share (
Kim 2009).
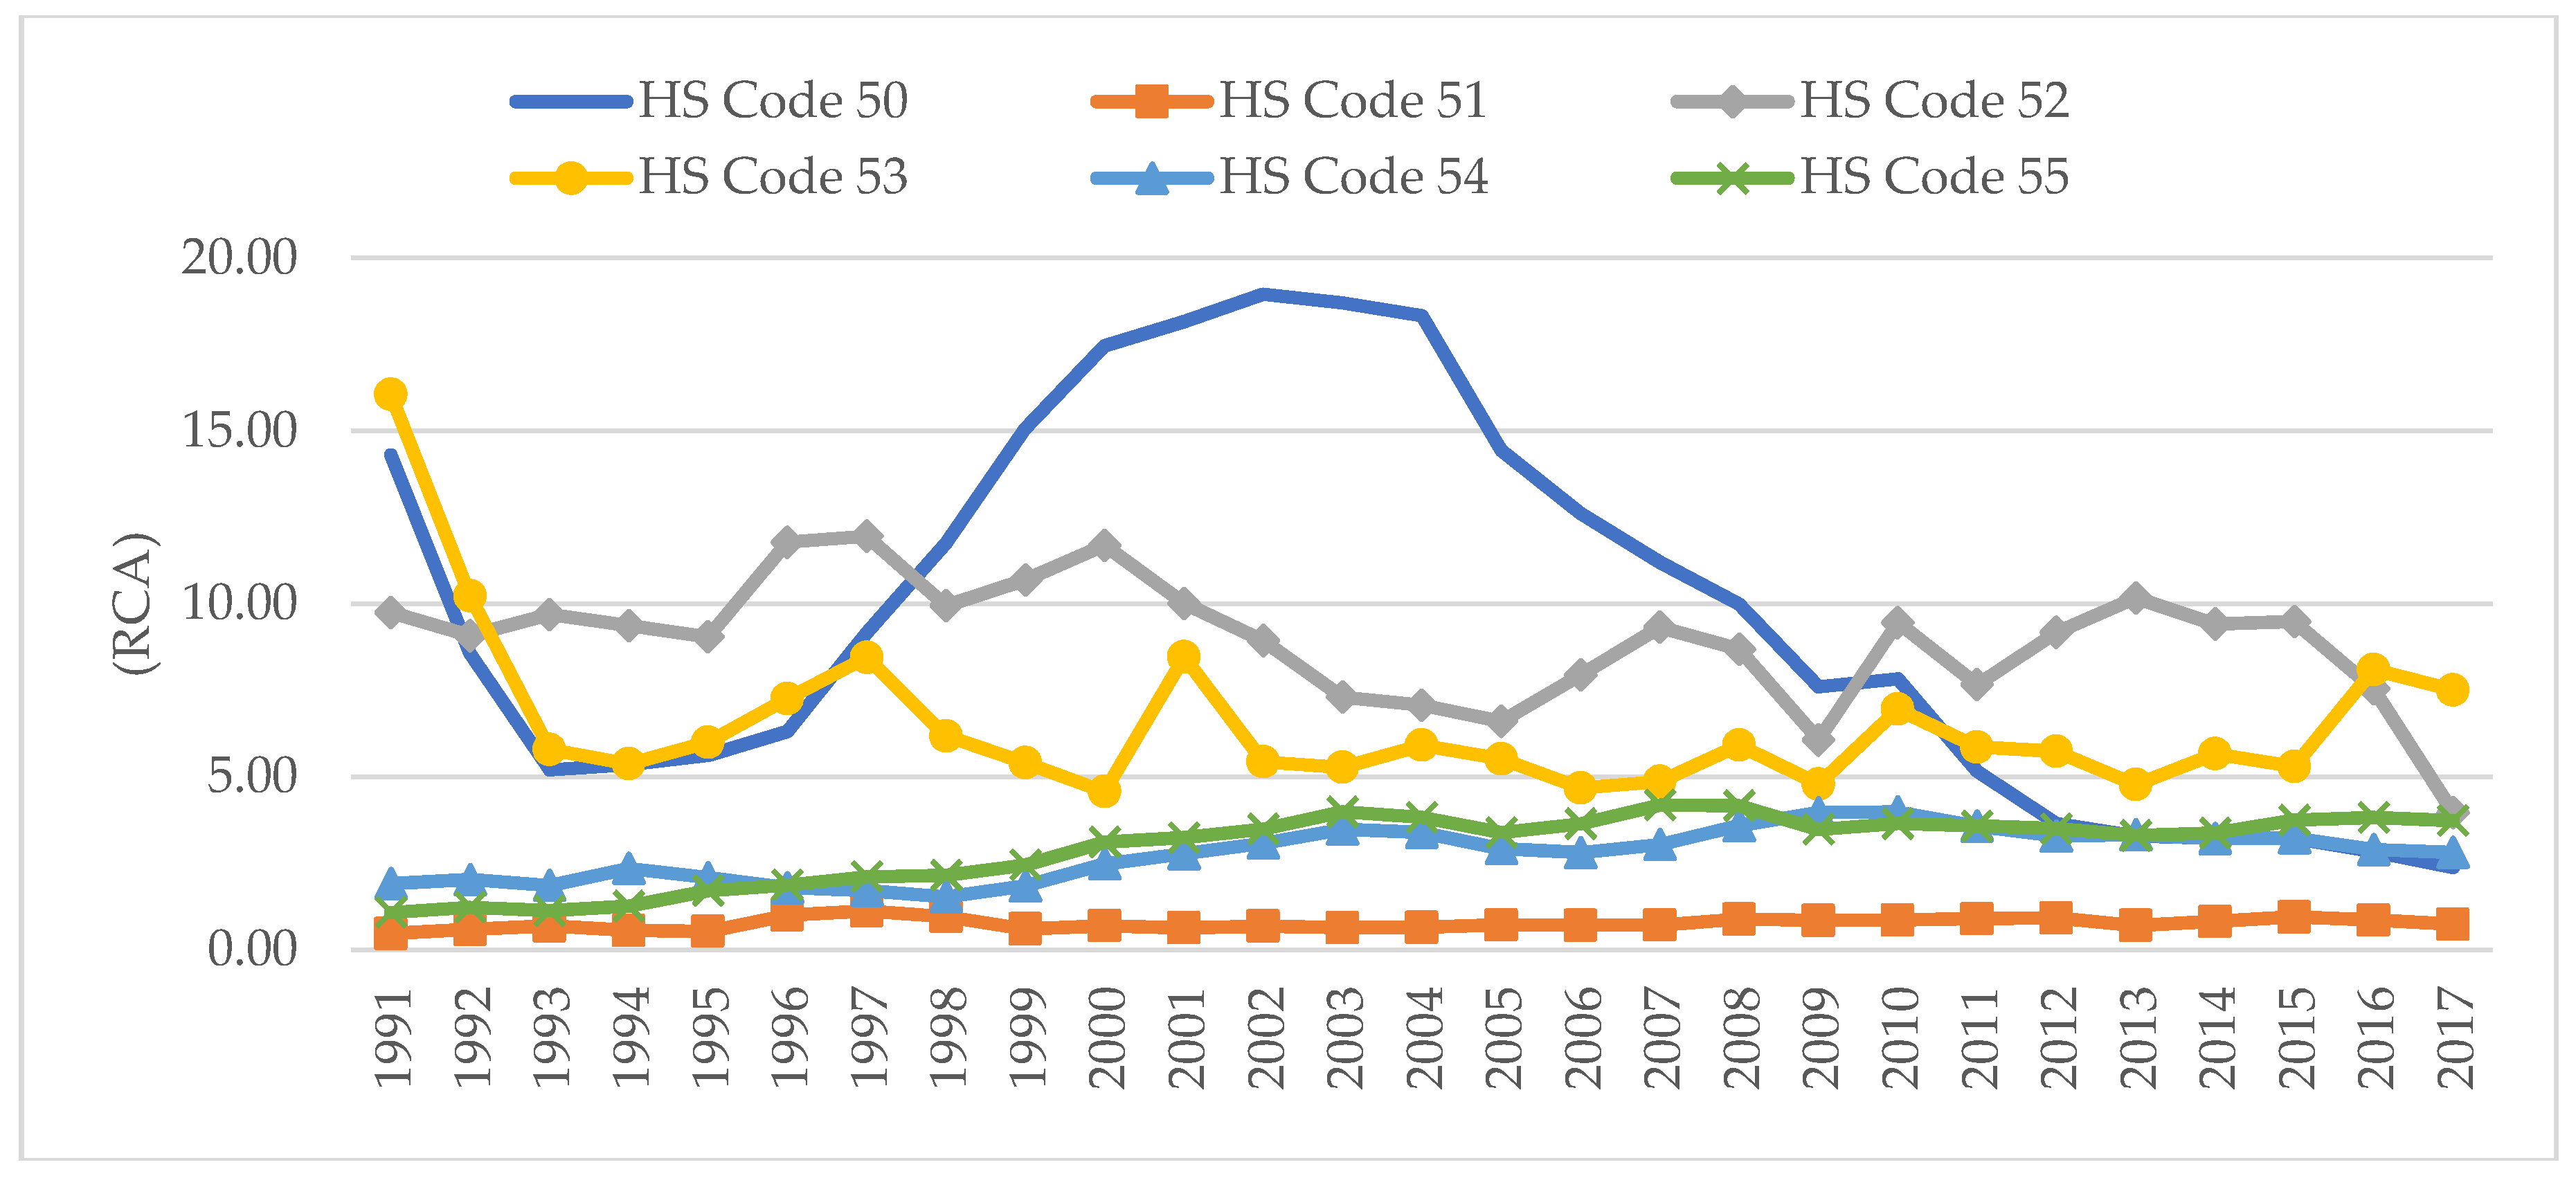
Figure 5 shows India’s RCA of HS Codes 50–55 in the global market from 1991 to 2017. Except for HS Code 51 (wool products), the other five product categories had a comparative advantage in the global market. As discussed above, India has abundant raw materials related to T&C, and this affects India’s comparative advantage in cotton, silk, and yarns and filament. Cotton products, HS Code 52, had an overall greater comparative advantage than the other products; the RCA of HS Code 52 was 9.75 in 1991, decreasing to 3.97 in 2017. The RCA of HS Code 50 substantially decreased from 14.3 in 1991 to 2.39 in 2017; however, from 1997 to 2002, the RCA of India’s silk significantly increased to 18.95 in 2002. Similarly, the RCA of HS Code 53 substantially decreased from 16.05 in 1991 to 7.51 in 2017, implying a loss in comparative advantage in the global market. HS Codes 54 and 55 had a comparative advantage in the global market because the RCA values of the two commodities were greater than 1. In addition, the RCA of both products increased during the study period, unlike those of other products. However, the RCA of HS Code 51 was less than 1 throughout the study period, implying that India’s wool products did not have a comparative advantage in the global market.
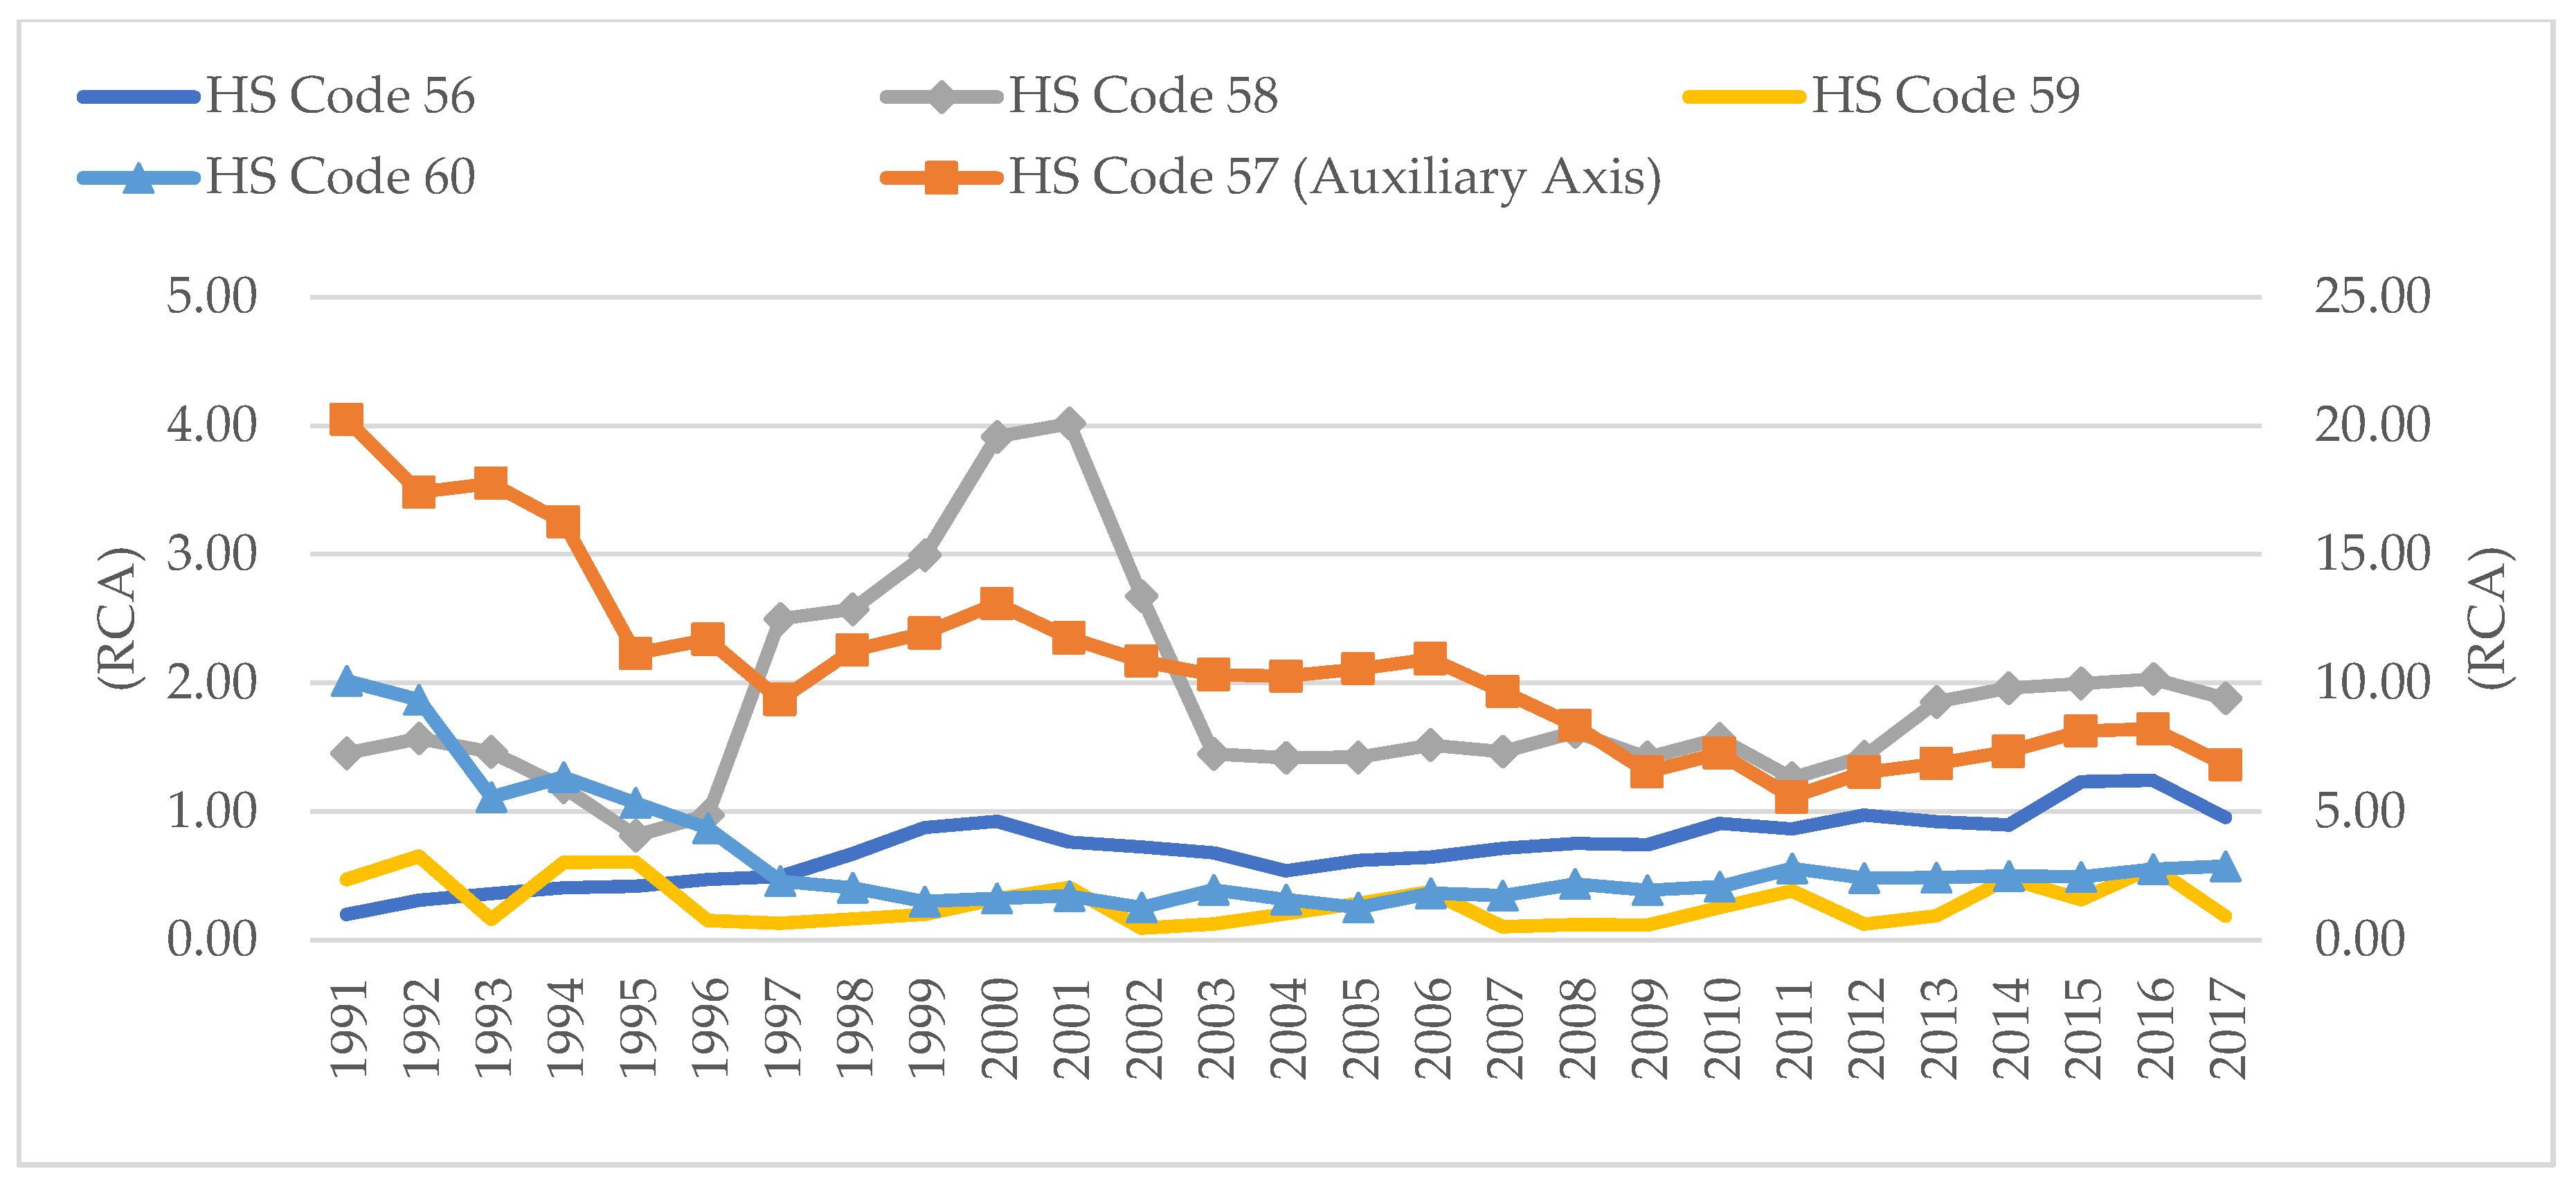
As shown in
Figure 6, India’s RCA of HS Code 57 (carpets and other textile floor coverings) was much higher than that of the other products but displayed a decreasing trend from 20.23 in 1991 to 6.81 in 2017. India’s carpet is competitive in the global market. India’s comparative advantage of HS Code 58 (special woven fabrics) improved in the market because the RCA of HS Code 58 rose from 1.45 in 1991 to 1.88 in 2017. From 1996 to 2002, the RCA of HS Code 58 increased from 0.97 in 1996 to 4.02 in 2001. The RCA of man-made staple fiber increased from 0.20 in 1991 to 0.95 in 2017. However, the products of HS Codes 59 and 60 had an RCA of less than 1, implying that they did not have a comparative advantage in the global market.
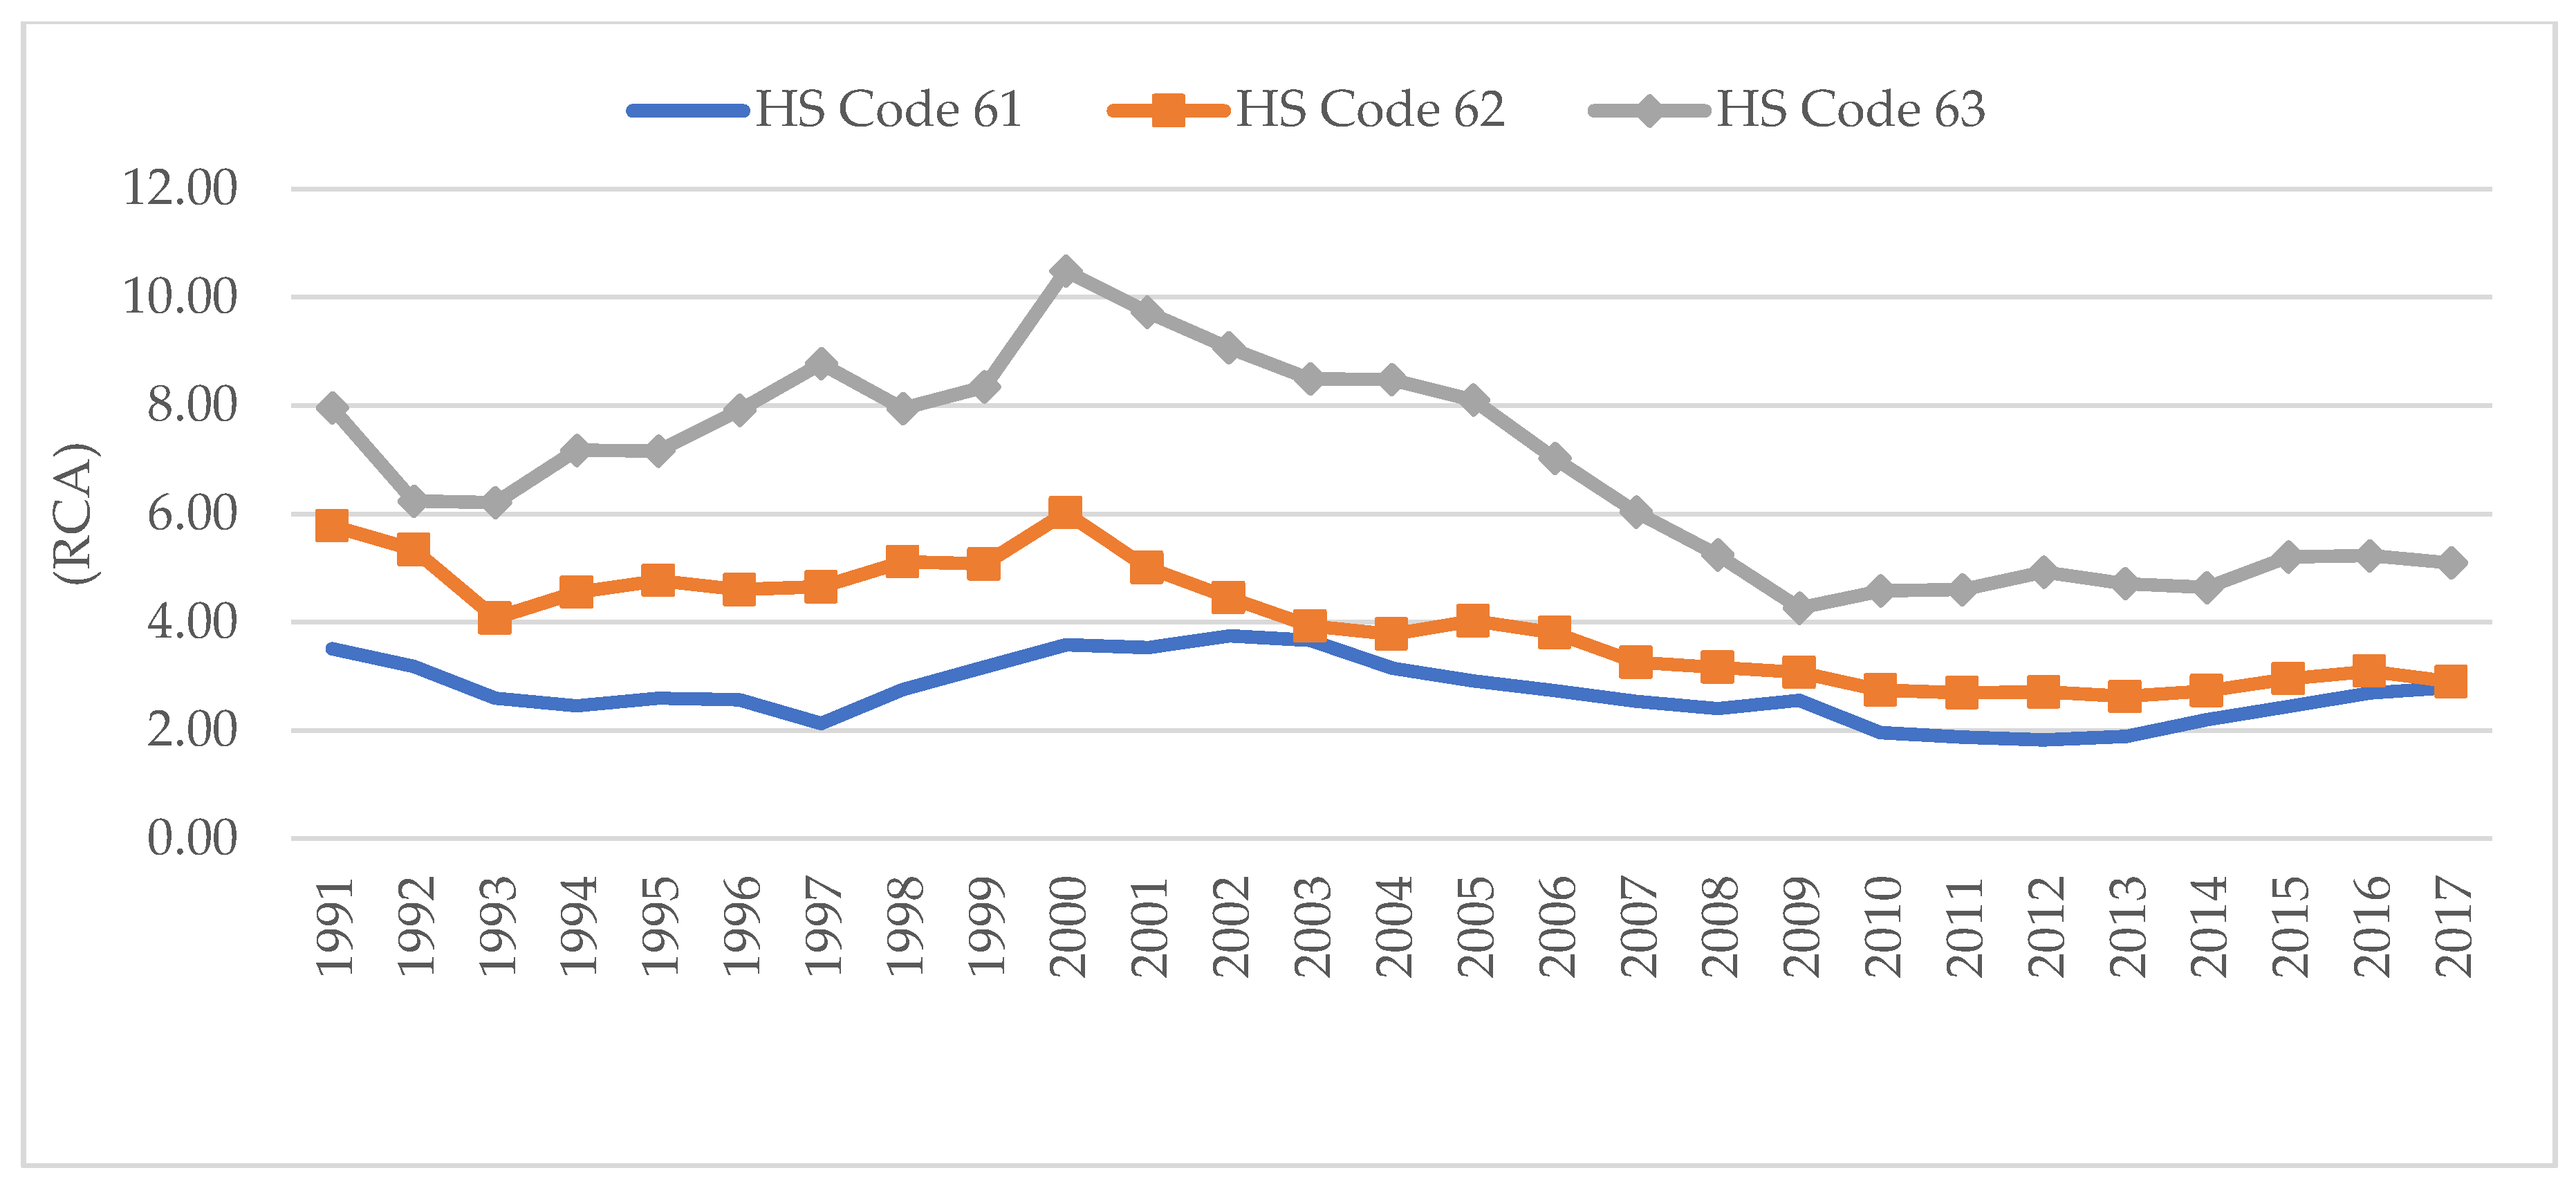
In the case of India’s apparel and made-up commodities, the RCA decreased during the study period, as shown in
Figure 7. Knitted or crocheted apparel (HS Code 61) had an RCA of 3.51 in 1991, dropping to 279 in 2017. Similarly, the RCA of HS Code 62 decreased from 5.78 in 1991 to 2.90 in 2017. Other developing countries, such as Vietnam, Cambodia, and Honduras, emerged as India’s competitors in the global apparel market due to their low labor costs. Other made-up textiles also lost comparative advantage, since the RCA decreased from 8 in 1991 to 5.09 in 2017.
5.2. Comparative Advantage by Countries
The CAC reports the export performance of India’s T&C in the U.S. market in relation to India’s T&C export performance in the global market.
As shown in
Figure 8, only silk (HS Code 50) was greater than 1 in terms of CAC in the U.S. market except for 1992 to 1994, indicating that India’s silk had a comparative advantage in the U.S. market. The CAC of silk increased from 0.99 in 1994 to 1.76 in 2006. However, it decreased to 1.19 in 2017, implying its comparative advantage has deteriorated. India’s export of silk to the U.S. has started decreasing since 2005: US
$21 million in 1991 increased to US
$109.6 million in 2005 and decreased to US
$14.1 million in 2017. The CAC of the commodity under HS Code 53 approached 1 in 2011, and recorded a value of 0.93 in 2017. Other products, such as wool (51), cotton (52), man-made filament (54), and man-made staple fiber (55), did not have a comparative advantage in the U.S. market.
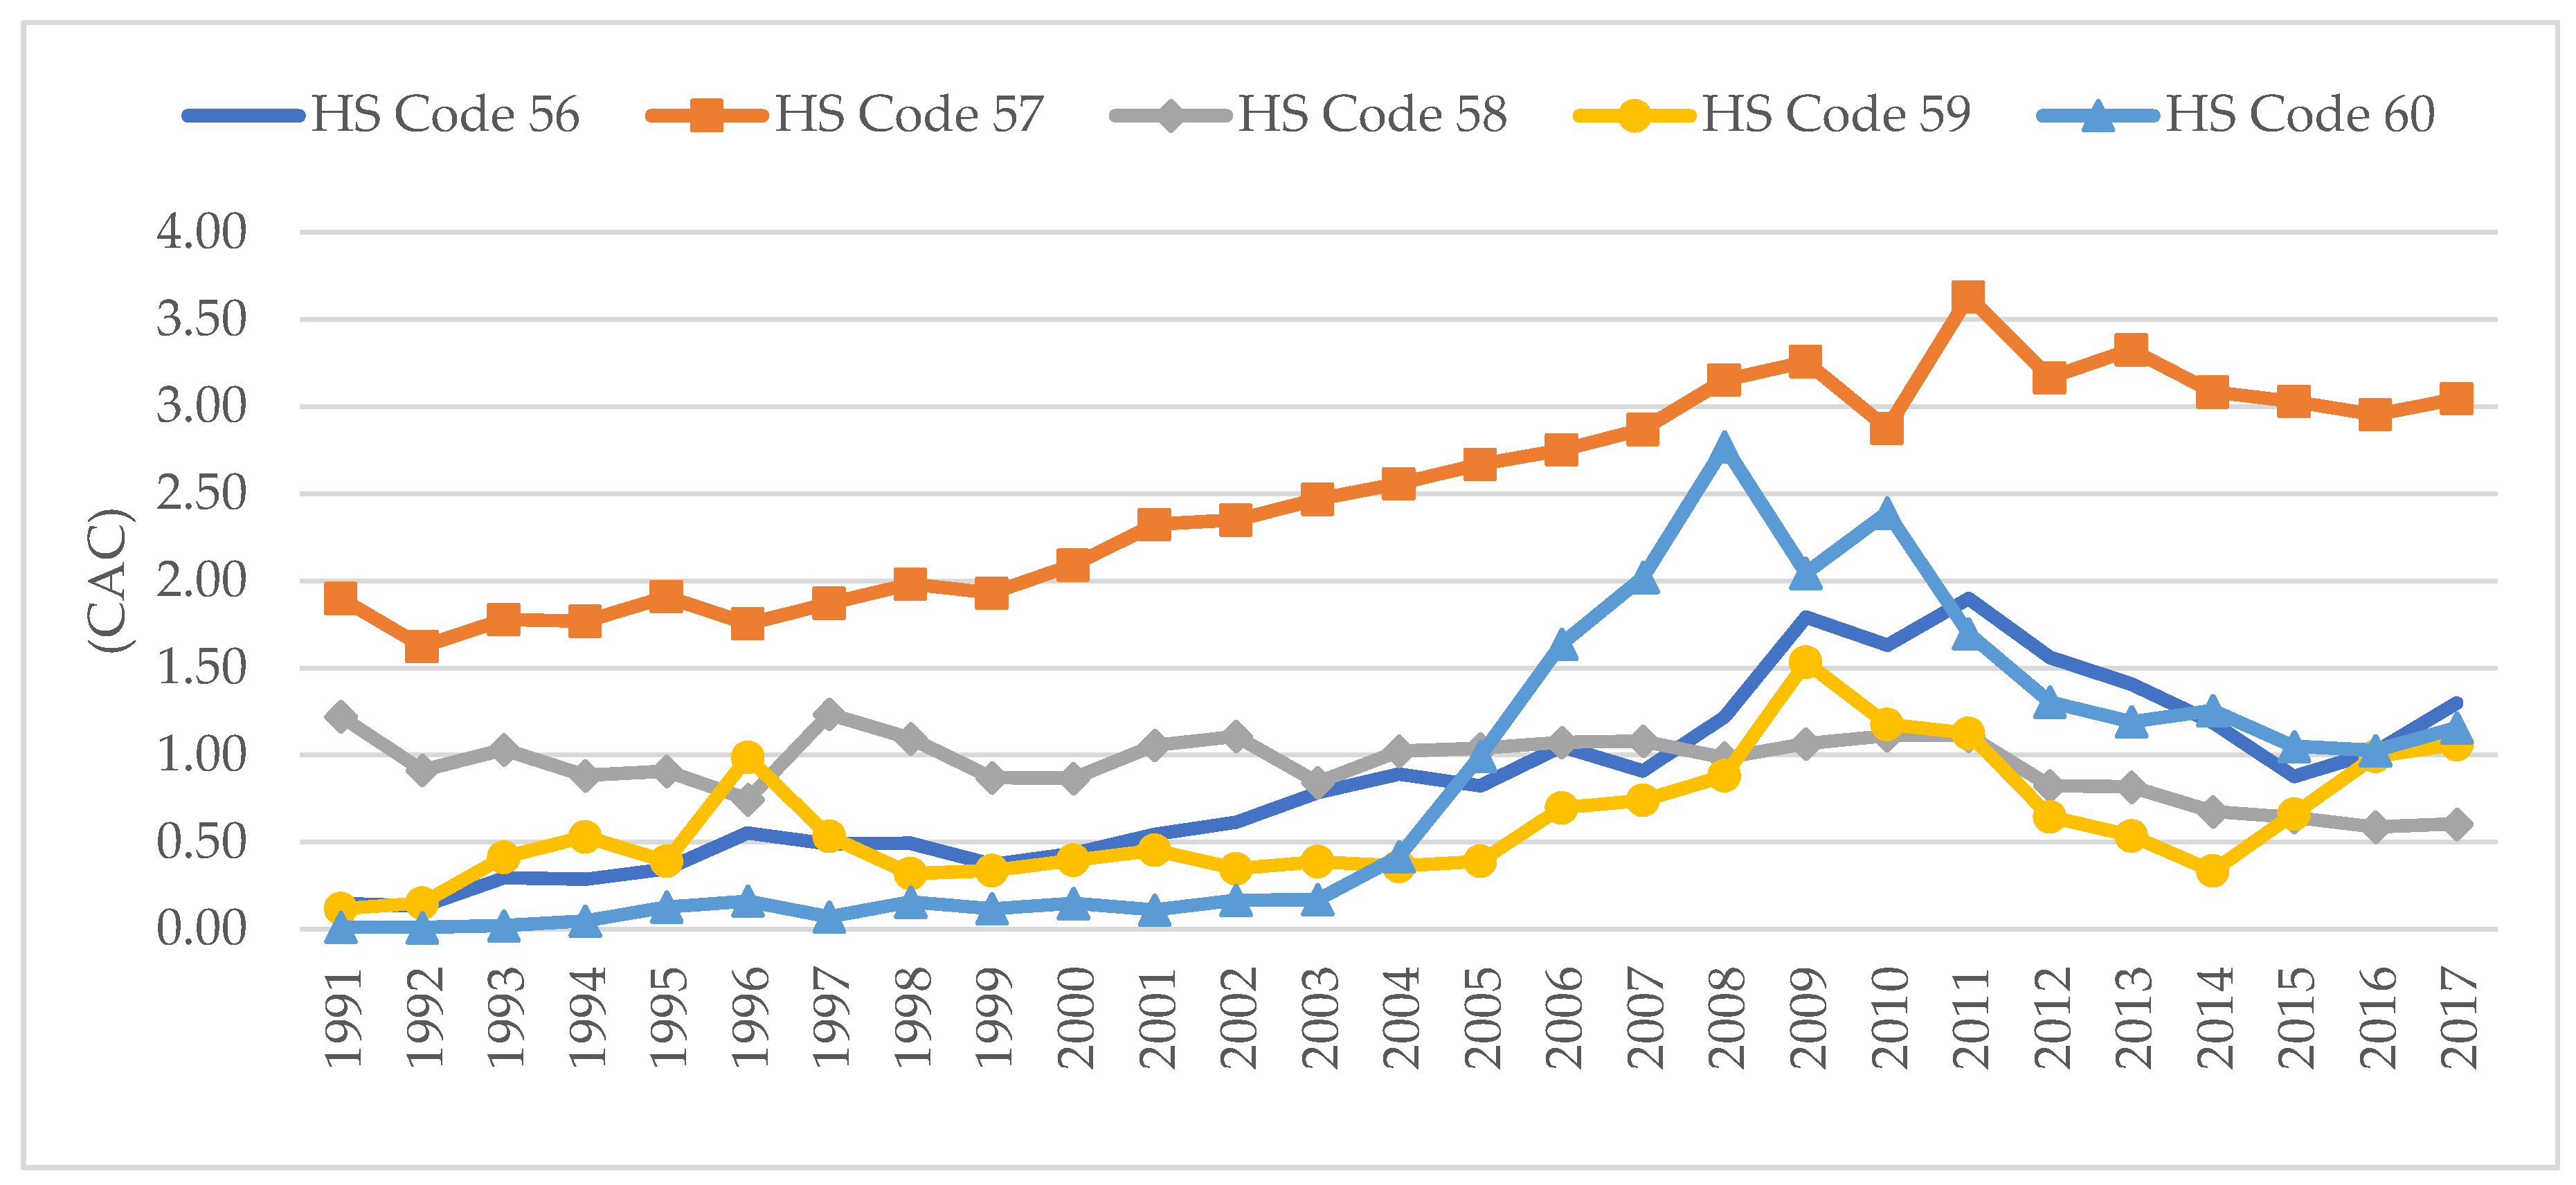
Figure 9 displays the CAC of HS Codes 56–60. Carpets and other textile floor coverings products (HS Code 57) from India had a comparative advantage in the U.S. market because the CAC value of HS Code 57 was greater than 1 throughout the study period. The calculated value improved from 1.9 in 1991 to 3.07 in2017. Simultaneously, India’s export of the HS Code 57 commodity significantly increased from US
$16.2 million to US
$83.4 million at a CAGR of 6.6% during the same period. The CAC of HS Code 56 steadily improved from 0.15 in 1991 to 1.9 in 2011, but deteriorated to 1.30 in 2017. In the case of HS Code 60 (knitted or crocheted fabrics), the CAC significantly increased from 0.42 in 2004 to 2.77 in 2008, decreasing to 1.16 in 2017. Similarly, the CAC of the commodity under HS Code 59 also increased from 0.39 in 2005 to 1.53 in 2009 and dipped to 1.06 in 2017.
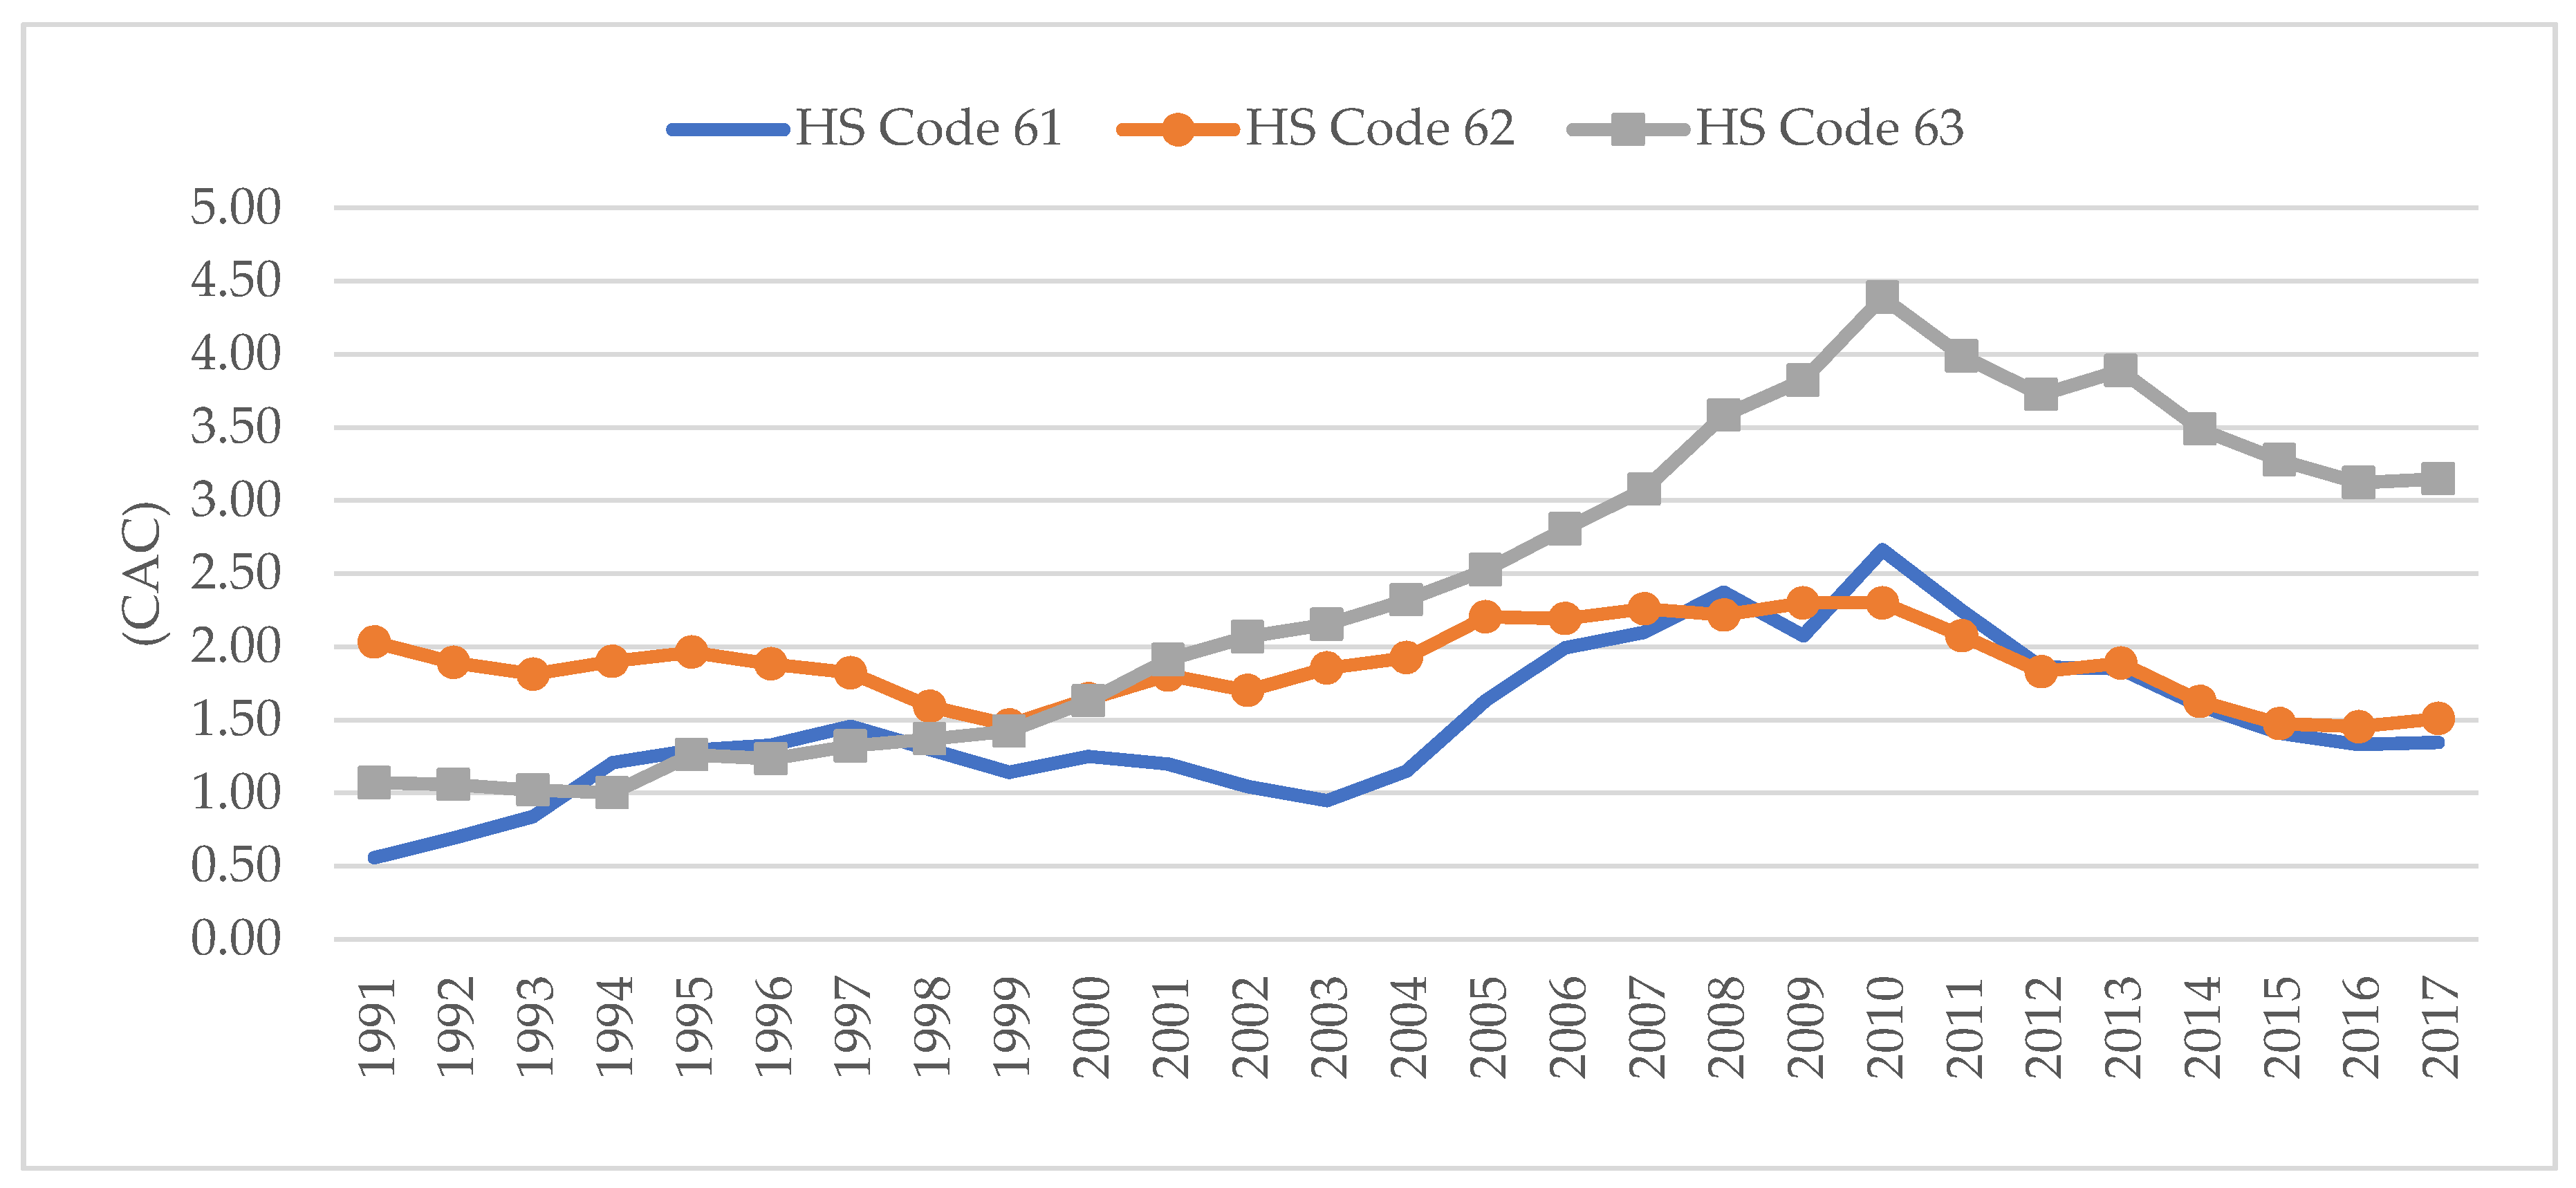
Figure 10 shows India’s CAC values of HS Codes 61, 62, and 63 in the U.S. from 1991 to 2017. The CAC of HS Codes 61–63 increased from 1991 to 2010, but later decreased. The competition in apparel and the made-up and rag market of the U.S. may have become tougher due to emerging new market entrants, such as Vietnam and Pakistan. Except for the products under HS Code 61 from 1991 to 1993 and in 2003, the CAC values of HS Codes 61, 62, and 63 were greater than 1, indicating that these products had a comparative advantage in the U.S. market. In the case of HS Code 63, the CAC significantly increased from 1.07 in 1991 to 4.39 in 2010, implying that India’s exports of made-up and rag products in the U.S. improved during the same period. However, the CAC decreased to 3.15 in 2017. The CAC of HS Code 61 also improved from 0.56 in 1991 to 2.66 in 2010, and dipped to 1.35 in 2017, while that of HS Code 62 slightly increased from 2.03 in 1991 to 2.3 in 2009 and declined to 1.51 in 2017.
5.3. Market Comparative Advantage
The MCA illustrates India’s comparative advantage in the U.S. by calculating the share of T&C exports in India’s exports to the U.S. in relation to the U.S. import share of the commodity in total world imports. Because India is the third largest exporter of T&C to the U.S., the MCA has a larger value than the CAC.
Figure 11 explains India’s MCA of HS Codes 50–55 in the U.S. market.
In the case of HS Code 50, the MCA significantly increased from 7.42 in 1991 to 49.16 in 2001 and decreased to 9.04 in 2017. This indicates that the comparative advantage of India’s silk increased from 1991 to 2001 in the U.S. market but more recently decreased. Similarly, the MCA of HS Code 52 (cotton product) increased from 8.79 in 1991 and to 15.13 in 1996 and later decreased to 2.19 in 2017. The MCA value of HS Code 53 was also greater than 1 but fluctuated during the study period. The wool products under HS Code 51 started gaining a comparative advantage after 1996, while the MCA values of HS Codes 54 and 55 (man-made filaments and man-made staple fibers) also had an MCA greater than 1 after 2002 and 2000, respectively.
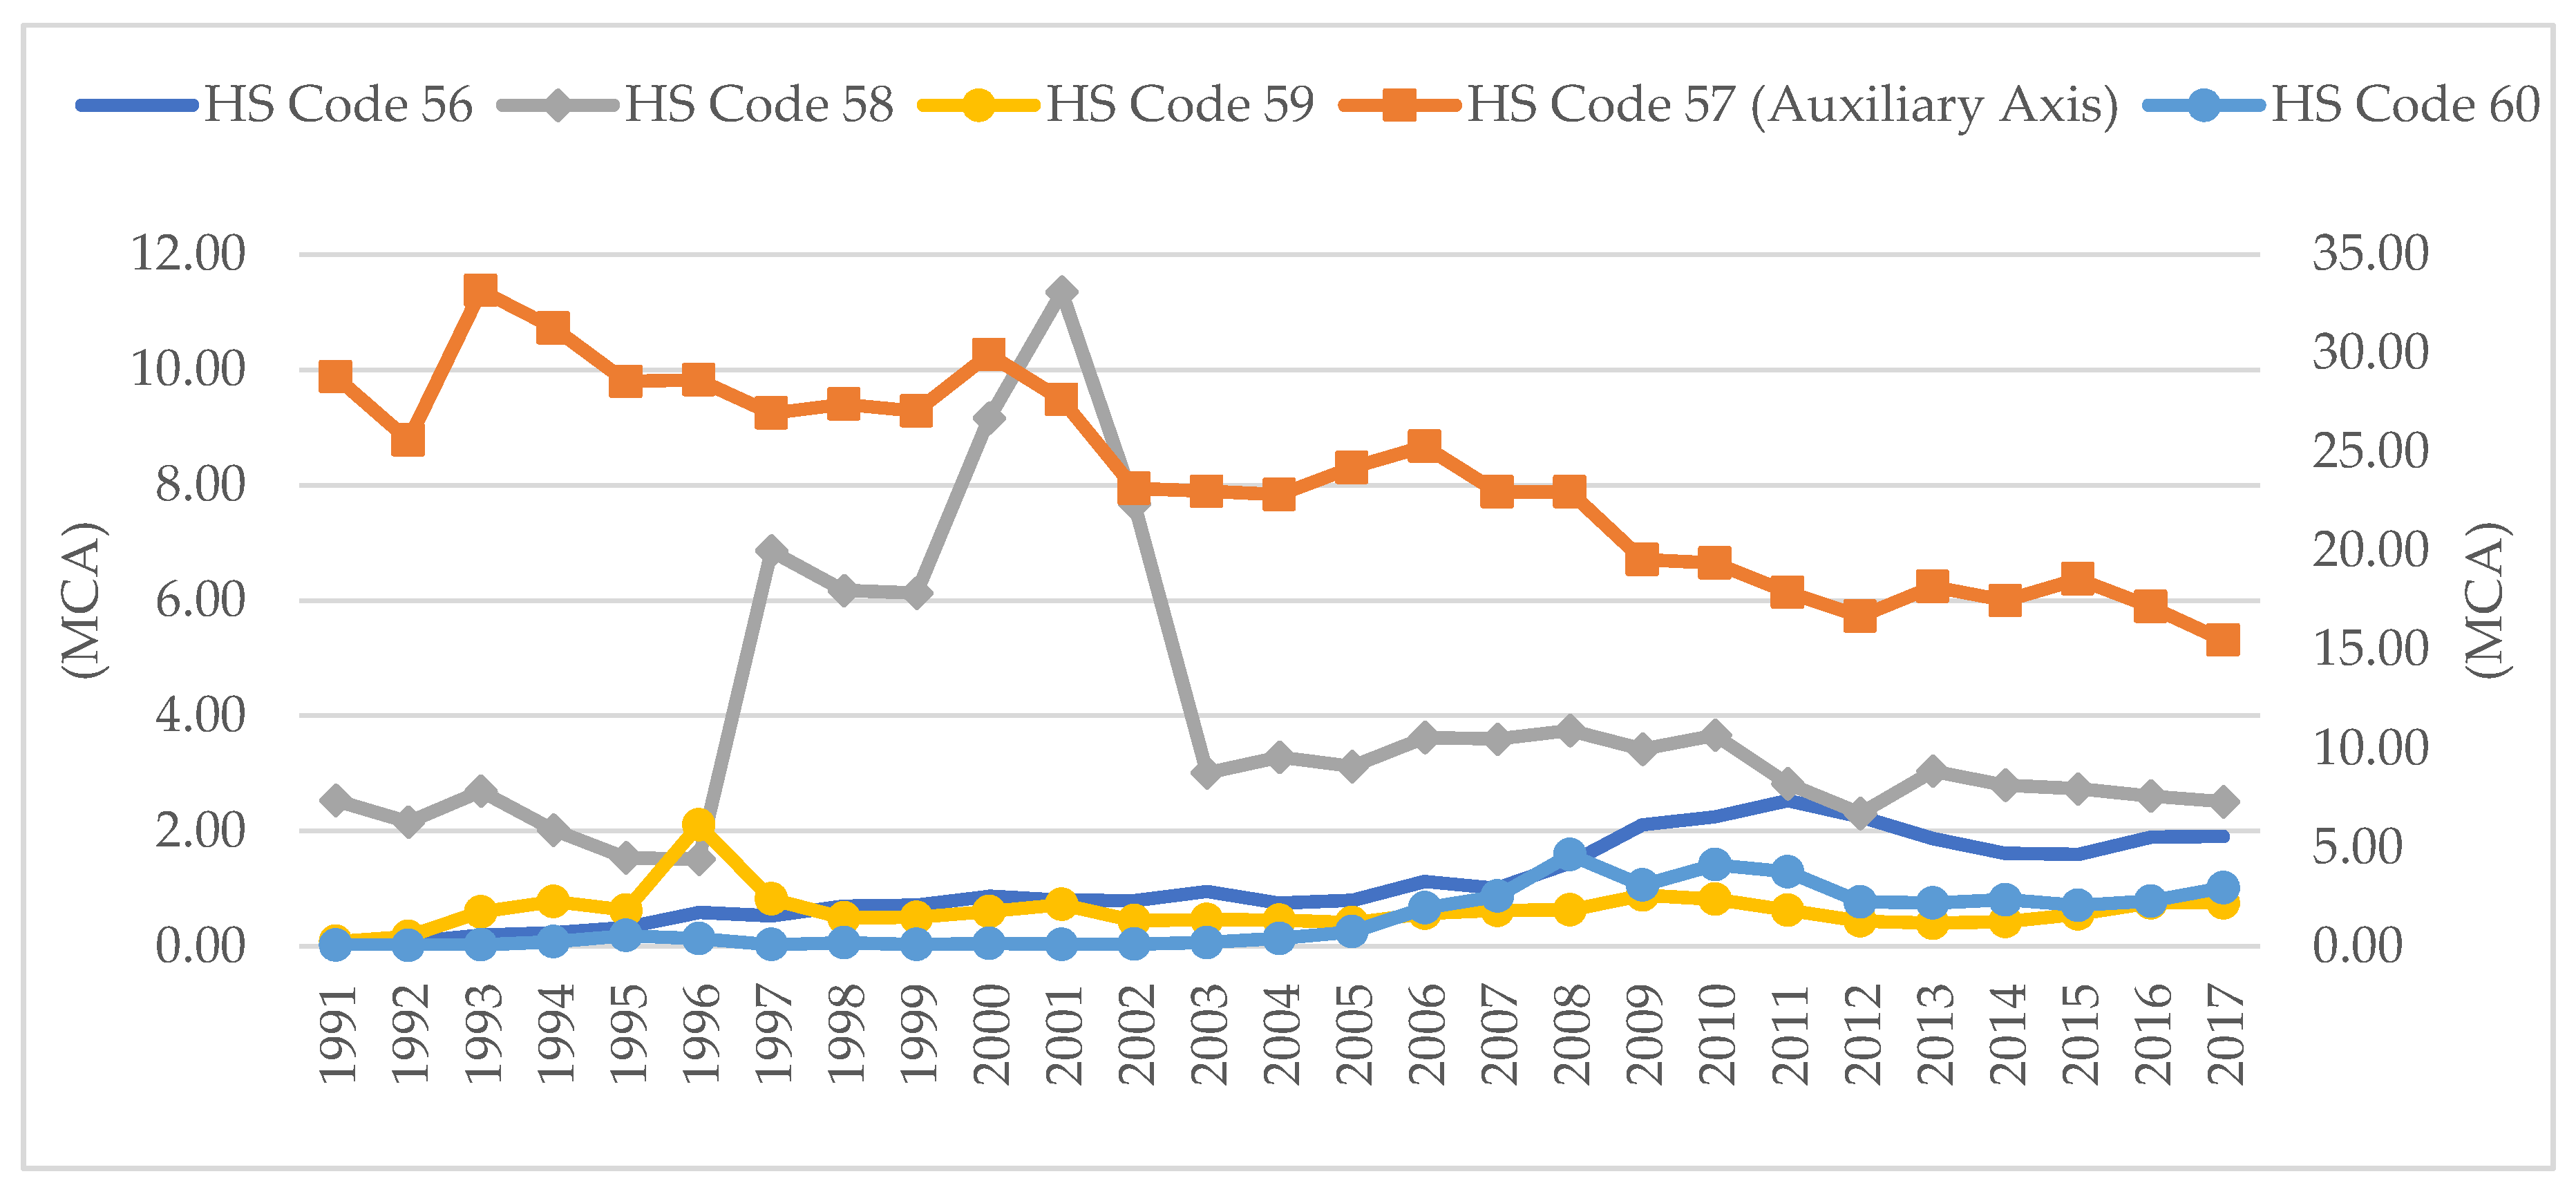
The MCA of HS Code 57 (carpets and other textile floor covering) had been much higher than other products, but its MCA value decreased from 28.8 in 1991 to 15.48 in 2017 (see
Figure 12). In the case of the products under HS Code 58 (special woven fabrics), the MCA significantly increased from 1.51 in 1996 to 11.35 in 2001 but decreased to 2.51 in 2017. Commodities of HS Codes 56 and 60 started improving in terms of their comparative advantage in 2006 because the MCA value increased to greater than one. In the case of HS Code 59, the MCA was less than one during the study period, except in 1996 when the MCA was 2.11.
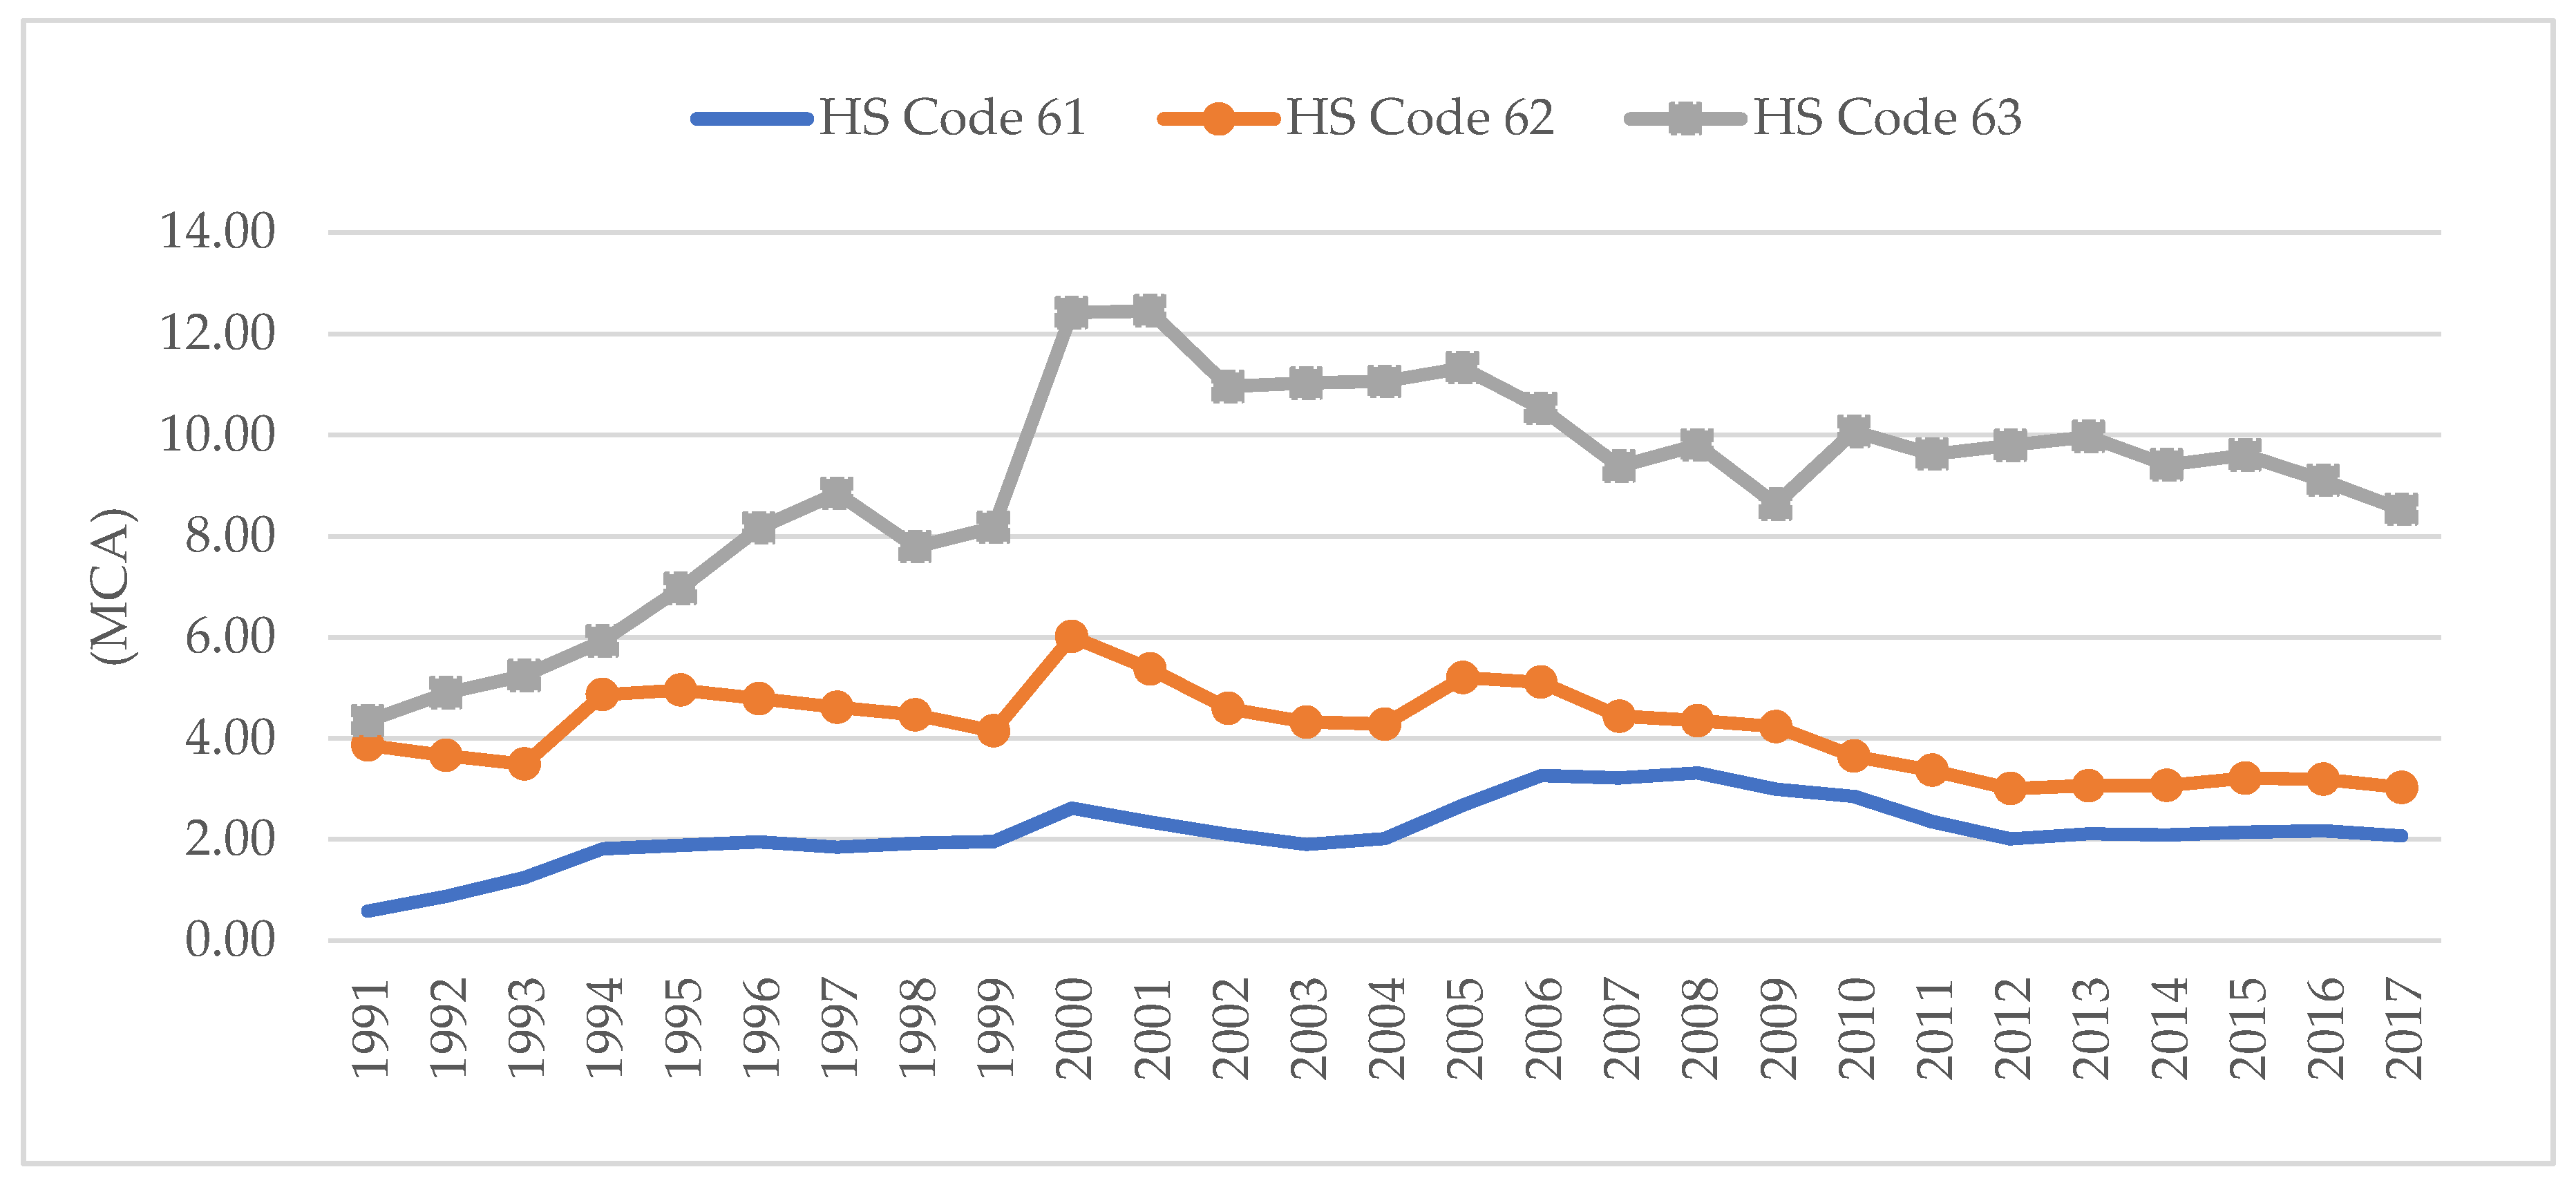
The MCA values of HS Codes 61–63 were greater than 1 throughout the study period except for HS Code 61 in 1991 and 1992, as shown in the
Figure 13. Like the CAC, the MCA of Code 63 was higher than the other two: 4.34 in 1991, increased to 12.45 in 2001, and dropped to 8.53 in 2017. The MCA of HS Code 62 was 3.86 in 1991 and slightly decreased to 3.03 in 2017, while that of HS Code 61 was 0.58 in 1991 and increased to 2.07 in 2017.
6. Analysis
The U.S. has been India’s largest export destination of T&C, receiving around 20% of India’s T&C exports (
Table 4). India mainly exported apparel commodities in T&C to the U.S., as shown in
Table 6, which are covered by HS Codes 61, 62, 63, and 57.
The share of apparel and made-ups in India’s T&C export to the U.S. was over 91.4% in 2015, increasing from 84.4% in 1991. The share of apparel in India’s T&C export to the U.S. decreased from 62.2% in 1991 to 47.3% in 2015, but the share of made-ups increased two-fold, from 22% to 44.1%, during the same period.
After the MFA phase-out in 2005, sourcing countries could import from any country without any bounds and started importing from developing countries with lower labor costs (
Tewari 2005;
Gereffi and Frederick 2010). After the MFA phase-out in 2005, Vietnam, Bangladesh, and Indonesia emerged as major exporters of T&C to the U.S. (
Table 7). Pakistan, Honduras, Cambodia, and Sri Lanka recently emerged as top 10 countries exporting T&C to the U.S. in 2017.
Even though the competition in the U.S. market increased, India’s comparative T&C advantage in the U.S. market improved on average, except for a few commodities, based on our results. India’s share in the import of T&C by the U.S. increased from 3.26% in 1991 to 7.18% in 2017.
As discussed earlier, the main commodities exported from India to the U.S. were apparel and made-ups; hence, the CAC and MCA of apparel and made-ups had higher values than other commodities. Specifically, the CAC and MCA results showed that India had a comparative advantage of HS Codes 61 and 63 in the U.S. market with an increasing trend from 1991 to 2017. In the case of HS Code 62, both the CAC and the MCA values were greater than 1, indicating India’s comparative advantage in the U.S. market. However, the numbers marginally decreased during the study period.
India’s carpet had the highest comparative advantage in terms of the CAC and the MCA in the U.S. market than other T&C products, but the CAC and the MCA were displaying a decreasing trend. From
Table 8, India’s export of HS Code 57 increased from US
$1424.25 million in FY2013 to US
$1779.02 million in FY2017. The share of India in the U.S. imports of carpet also increased from 29.2% in 2012 to 33.2% in 2016, the largest sourcing country for the U.S.
India’s export of yarn and fabrics to the U.S. constituted 8.6% of India’s total exports of T&C to the U.S. in 2015, decreasing from 15.8% in 1991. In terms of the CAC, silk products had a comparative advantage throughout the study period, but other products had a CAC greater than 1 only for certain periods. With regard to the MCA, HS Codes 50, 53, 54, and 58 had a comparative advantage with a bell-shaped curve, indicating that their comparative advantage increased but lessened later. In the case of HS Codes 51, 54, 55, 56, and 60, the MCA values were greater than 1 after a certain time. Only HS Code 59 did not have a comparative advantage due to its MCA being less than 1.
7. Conclusions
T&C industry has an important role in Indian economy due to its significant contribution to exports, industrial production, and employment generation. Global T&C market underwent a significant change after the MFA phase-out in 2005. Hence, the U.S., the largest consumer of T&C in the world, could diversify importing countries after 2005 like Vietnam and Bangladesh with low labor cost. From the India’s side, the U.S. has been the largest export destination from 1991 to 2017. Therefore, it is timely to examine if India’s export competitiveness of T&C in the U.S. is sustainable.
We measured comparative advantage based on RCA, CAC, and MCA to investigate India’s export competitiveness of T&C in the U.S. The RCA is suitable for investigating comparative advantage in the global market, whereas the CAC and the MCA are best employed for examining comparative advantage in a specific market, such as the U.S. The results show that India had export competitiveness of T&C in the U.S. during the study period even though the competition in the U.S. market stiffened after the MFA phase-out in 2005.
However, the emergence of low-cost-producing countries like Vietnam, Bangladesh, and Honduras can threat India’s export competitiveness in the global market. In terms of labor cost, India cannot sustain competitiveness compared to other developing countries like Ethiopia. China is the world’s largest exporter of T&C in spite of higher labor cost. It seems that the quality of Chinese T&C product can compensate higher labor cost. Therefore, India also needs to improve the quality of T&C product. At the same time, the global demand for man-made fiber and fabrics has steadily increased compared to that for natural fiber, in which India has comparative advantage. Therefore, technological development related to man-made fiber and fabrics is essential to India’s T&C future. In addition, the development of India’s export infrastructure, for example logistics, is also required to sustain export competitiveness.
This study has a few limitations, so we conclude with suggestions for further studies. First, India’s comparative advantage should be compared with those of other developing countries, especially Bangladesh and Vietnam, the emerging competitors in the global T&C markets. Second, analyzing the determinants of the comparative advantage of India’s T&C sector will aid in policy suggestion.


