Article

Estimating the Effects of Human Capital Constraints on Innovation in the Caribbean

Inter-American Development Bank, Washington, DC 20577, USA
Economies 2018, 6(2), 33; https://doi.org/10.3390/economies6020033
Submission received: 10 April 2018 / Revised: 4 May 2018 / Accepted: 18 May 2018 / Published: 22 May 2018
(This article belongs to the Special Issue Innovation and Economic Development)

Abstract

:
Human capital, as reflected in education levels and skills, and innovation is an important engine of economic growth. The Caribbean is deficient in both: lower than expected GDP growth rates are accompanied by relatively low innovation at the firm level, and the workforce is characterised by skills deficiencies and educational mismatches. In that regard, this paper exploits firm-level data covering 13 Caribbean countries to examine the extent to which innovation, a key driver of productivity growth, is affected by firms’ inability to find appropriately educated and skilled workers to fill key positions in its organizational structure, which is estimated using Probit models distinguishing between past and future innovation decisions. The econometric analysis finds that firms that have difficulty finding new skilled employees are less likely to engage in any type of innovation compared to those that can, and this is also true for decisions about future technological and non-technological innovations. Moreover, firms that face challenges finding employees with the required core and job-related skills at the managerial and professional levels are also less likely to innovate. Finally, while in-firm training is found to increase the probability of innovation, its magnitude is low.
JEL Classification:
C01; D22; J24

1. Introduction

Low economic growth is perhaps the Caribbean’s greatest Achilles’ heel. Studies that examined this issue have put forward various explanations and hypotheses to explain the region’s low growth performance, with most of them related to deep-rooted competitiveness problems and low levels of productivity, among other structural challenges (Acevedo et al. 2013; Alleyne et al. 2017a; Fuentes et al. 2015). Some researchers and policymakers have argued that the Caribbean’s private sector should play a key role in promoting higher and more sustainable growth. However, the private sector in the Caribbean is currently characterised as being largely static and underperforming based on estimates of sales growth and total factor productivity (Ruprah and Sierra 2016).
Research has shown that innovation is one of the most important sources of competitive advantage that can improve firm productivity and performance in a sustainable way (Atalay et al. 2013; Hall 2011; Lööf and Heshmati 2006). However, firm-level innovation in the Caribbean is low relative to countries of comparable population size as evidenced by determinants such as expenditure on research and development, the number of patents registered per million persons and technology adoption by the government (Ruprah and Sierra 2016).
While previous papers on innovation in the Caribbean have looked at other determinants of innovation such as firm characteristics (Alleyne et al. 2017b) and in-firm training (Mohan et al. 2017), there is a lack of information and/or analysis regarding the link between the human capital constraints that firms face and their decision to innovate. This is a particularly important policy issue as an “inadequately educated workforce” has been consistently identified by firms as the most important constraint to their performance (PROTEqIN Survey 2014; and World Bank Enterprise Survey 2010). The factors underlying this constraint have been attributed to worker emigration, low quality of education, inadequate training offered by local educational institutions, and skills shortages and mismatches (Khadan 2017; Mishra 2006).
Thus, this paper contributes to our understanding of this issue by examining the extent to which innovation decisions in the Caribbean are affected by educational mismatches and firms’ inability to find appropriately skilled workers.1 In particular, the following four questions are empirically examined: (i) the extent to which firm-level innovation is affected by firms’ ability to find new skilled employees; (ii) the extent to which firm-level innovation is affected by educational mismatches at the managerial and professional levels of occupation; (iii) the extent to which firm-level innovation is affected by firms inability to find employees with core skills or job-related skills for various types of jobs; and (iv) the extent to which firm-level innovation is affected by in-firm training.
It has long been recognised that innovation activities in a country or firm require human capital with the ability to generate and apply knowledge and ideas. Indeed, Kim (2002, p. 92) noted that “more highly-educated individuals tend to adopt innovations earlier and implement and adapt them sooner than less-educated individuals.” Studies have found that innovation at the firm level is positively associated with workforce qualifications and expenditure on training (Jones and Grimshaw 2012; OECD 2011). Highly skilled and educated workers are thought to be more apt for generating ideas and adopting technologies to make improvements on existing products and processes. In a review of the literature on workforce skills and innovation, Toner (2011) found that cross-country differences in the quality and quantity of workforce skills are a major factor in explaining observed patterns of innovation.
Studies focusing on the skills mix required for successful innovation find that a wide variety of skills are important. In a study of the determinants of innovation capability in small firms, Albaladejo and Romijn (2000) also found that the skill mix of the workforce tends to be positively associated with innovation performance. Similarly, Leiponen (1996) also found that innovative firms have a more educated workforce than non-innovative firms (see also Amara et al. 2008; van Uden et al. 2014). The appropriate skillsets required for innovation at the firm level may also depend on the stage of innovation, the type of innovation and the type of industry. In a review of the literature, the Organization for Economic Cooperation and Development (OECD) (2011) found that a broad set of skills ranging from reading, writing, academic skills, technical skills, problem-solving, managerial and entrepreneurial skills and even “soft” skills are important to support innovation. Some researchers have emphasised the importance of practical skills and worker experience (Gangl 2000; Winkelmann 1996), while others have found more benefits from general education (Dolton and Vignoles 2002; Krueger and Kumar 2004).
The rest of this paper is organised as follows: section two briefly examines the level of innovation and the extent of educational mismatches in the Caribbean. Section three outlines the estimation strategy. Section four presents the results of econometric estimations related to the effects of skill and educational constraints on innovation decisions and section five concludes the paper with policy recommendations.

2. Education, Skills and Innovation in the Caribbean

The data used is this paper were obtained from the 2014 Productivity, Technology and Innovation (PROTEQIN) survey. The PROTEQIN survey, a representative sample of 1846 firms across 13 Caribbean countries, was the first of its kind to be carried out in the Caribbean, following the 2010 World Bank Enterprise Survey (WBES). The PROTEqIN survey includes more questions than the WBES on skills and education of employees than the WBES, which makes it possible to conduct an analysis of various aspects of the relationship between educational and skill levels of the firms’ workforce and innovation decisions. Moreover, the questions on innovation and educational attainment had a very high response rate across firms in all 13 countries.
Innovation at the firm level is generally low and varies across Caribbean countries. On average, roughly 19 percent of Caribbean firms reported having engaged in some form of innovation in the past three years, specifically, implementation of a new or significantly improved product or process, a new marketing method, or a new organizational method in business practices, workplace organization, or external relations. The range varies from the lowest, at 4.8 percent of firms in Dominica, to the highest at 53 percent of firms in Guyana. A higher proportion of firms reported their intention to engage in innovation in the next two years: an average of 35 percent of firms indicated that their intention to undertake technological innovation in the next two years and 39 percent expect to undertake non-technological innovation.2 Not surprisingly, only 10.3 percent of firms in the Caribbean have an innovation department: the range varies from the lowest at 1.6 percent of firms in Dominica, to the highest, at 36.7 percent of firms in Guyana. In general, firms that have an innovation department are more likely to engage in innovation activities (Table 1).
The PROTEqIN survey also makes it possible to determine the extent to which Caribbean firms are recruiting employees with the appropriate level of education. The PROTEqIN survey includes nine job types: managers; professionals, technicians and associate professionals; clerical support workers; service and sales workers; skilled agricultural, forestry, and fishery workers; craft and related trades workers; plant and machine operators and assemblers; and elementary occupations. Firms were asked to report on the minimum level of education required for each job type and the average level of education of their current workforce by job type. From this information, it is possible to determine the extent to which firms are recruiting employees with the adequate level of education across different job types. Table 2 summarises the results and shows that some firms are unable to find employees with the minimum level of education. This is a more serious challenge for recruitment of managers and professionals.
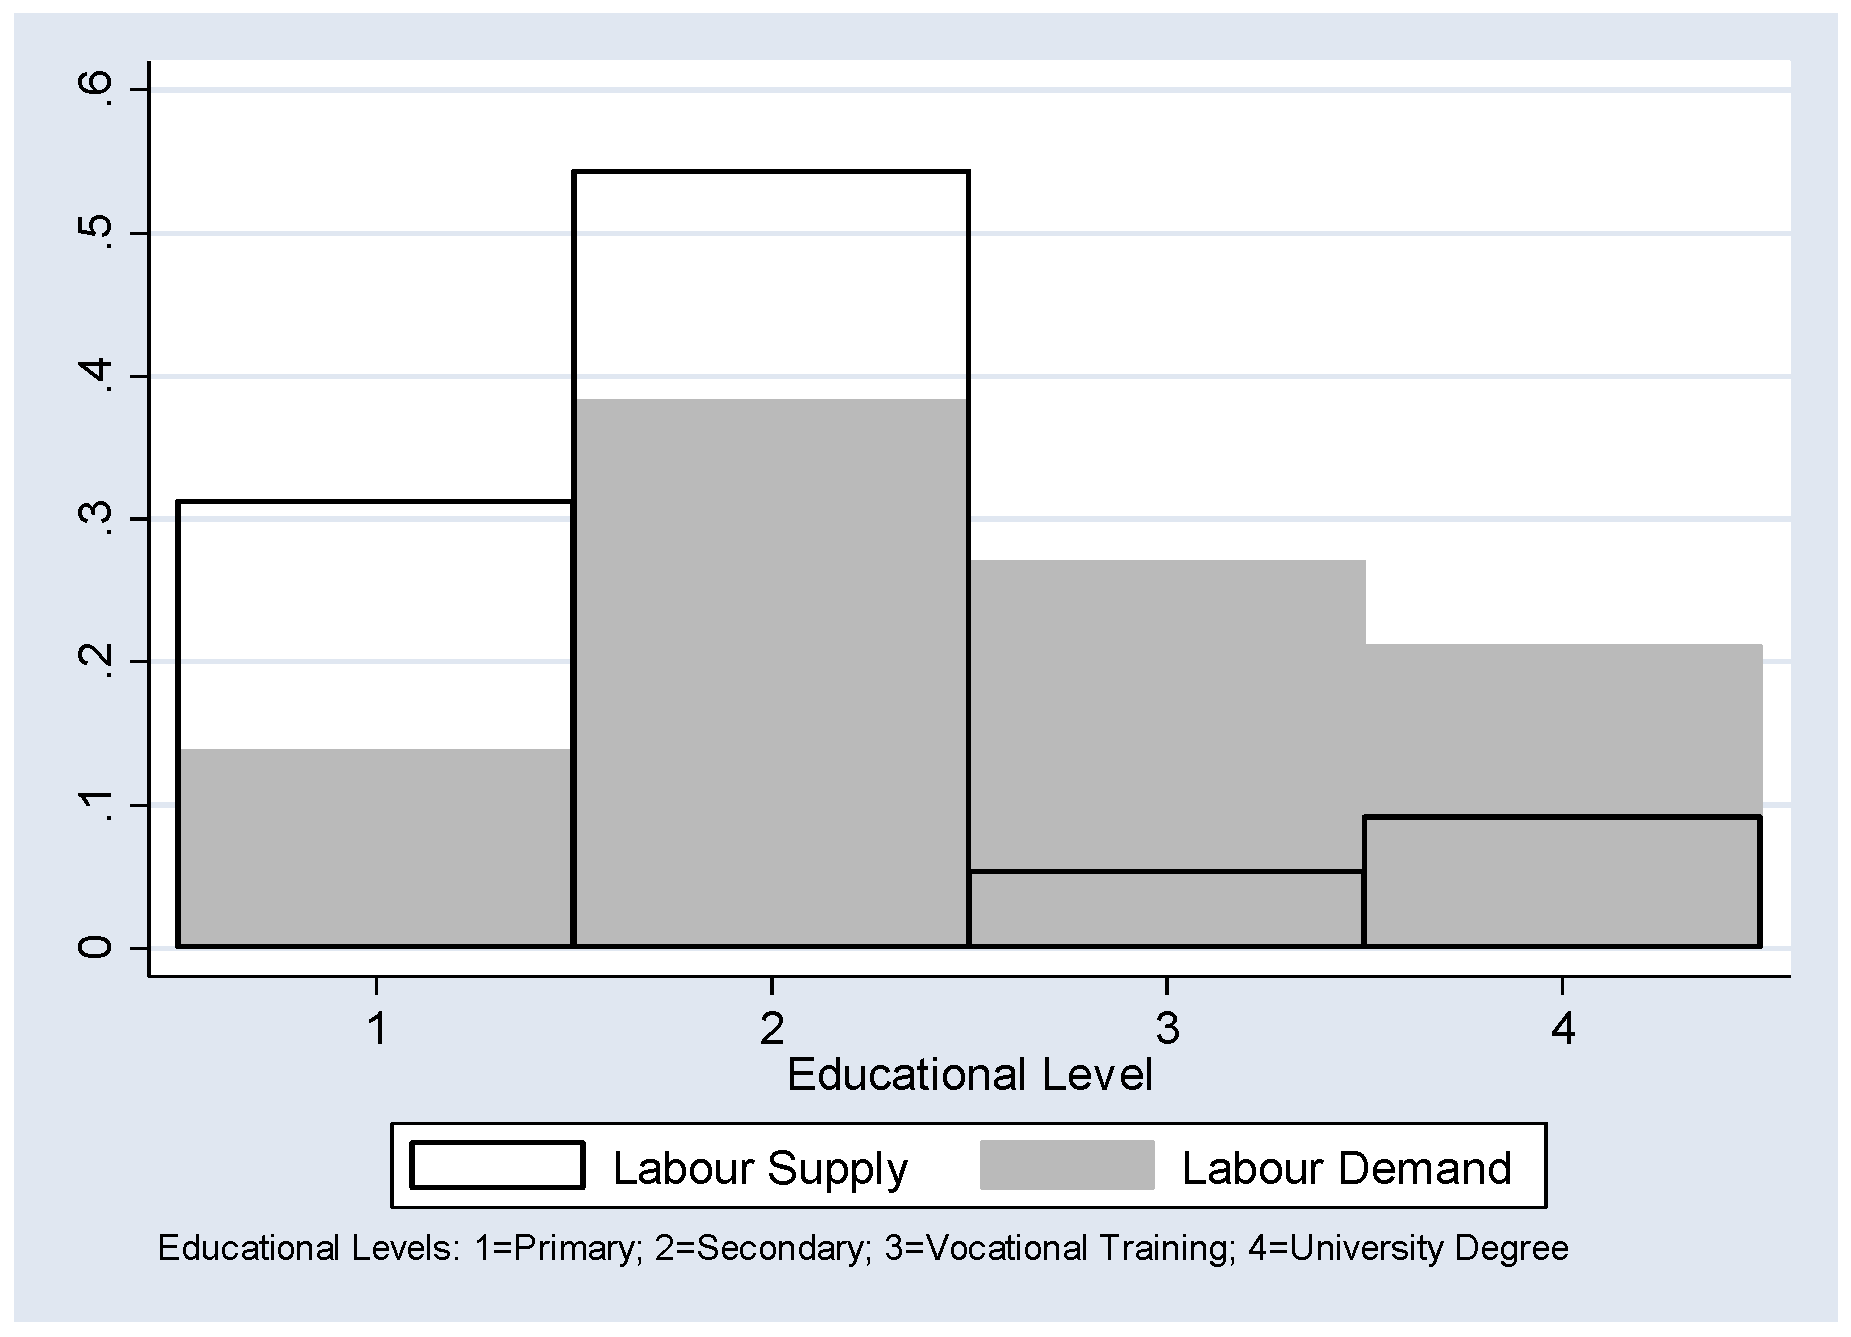
Educational mismatches in selected Caribbean countries can be observed by combining information from labour force surveys with the PROTEqIN survey. 
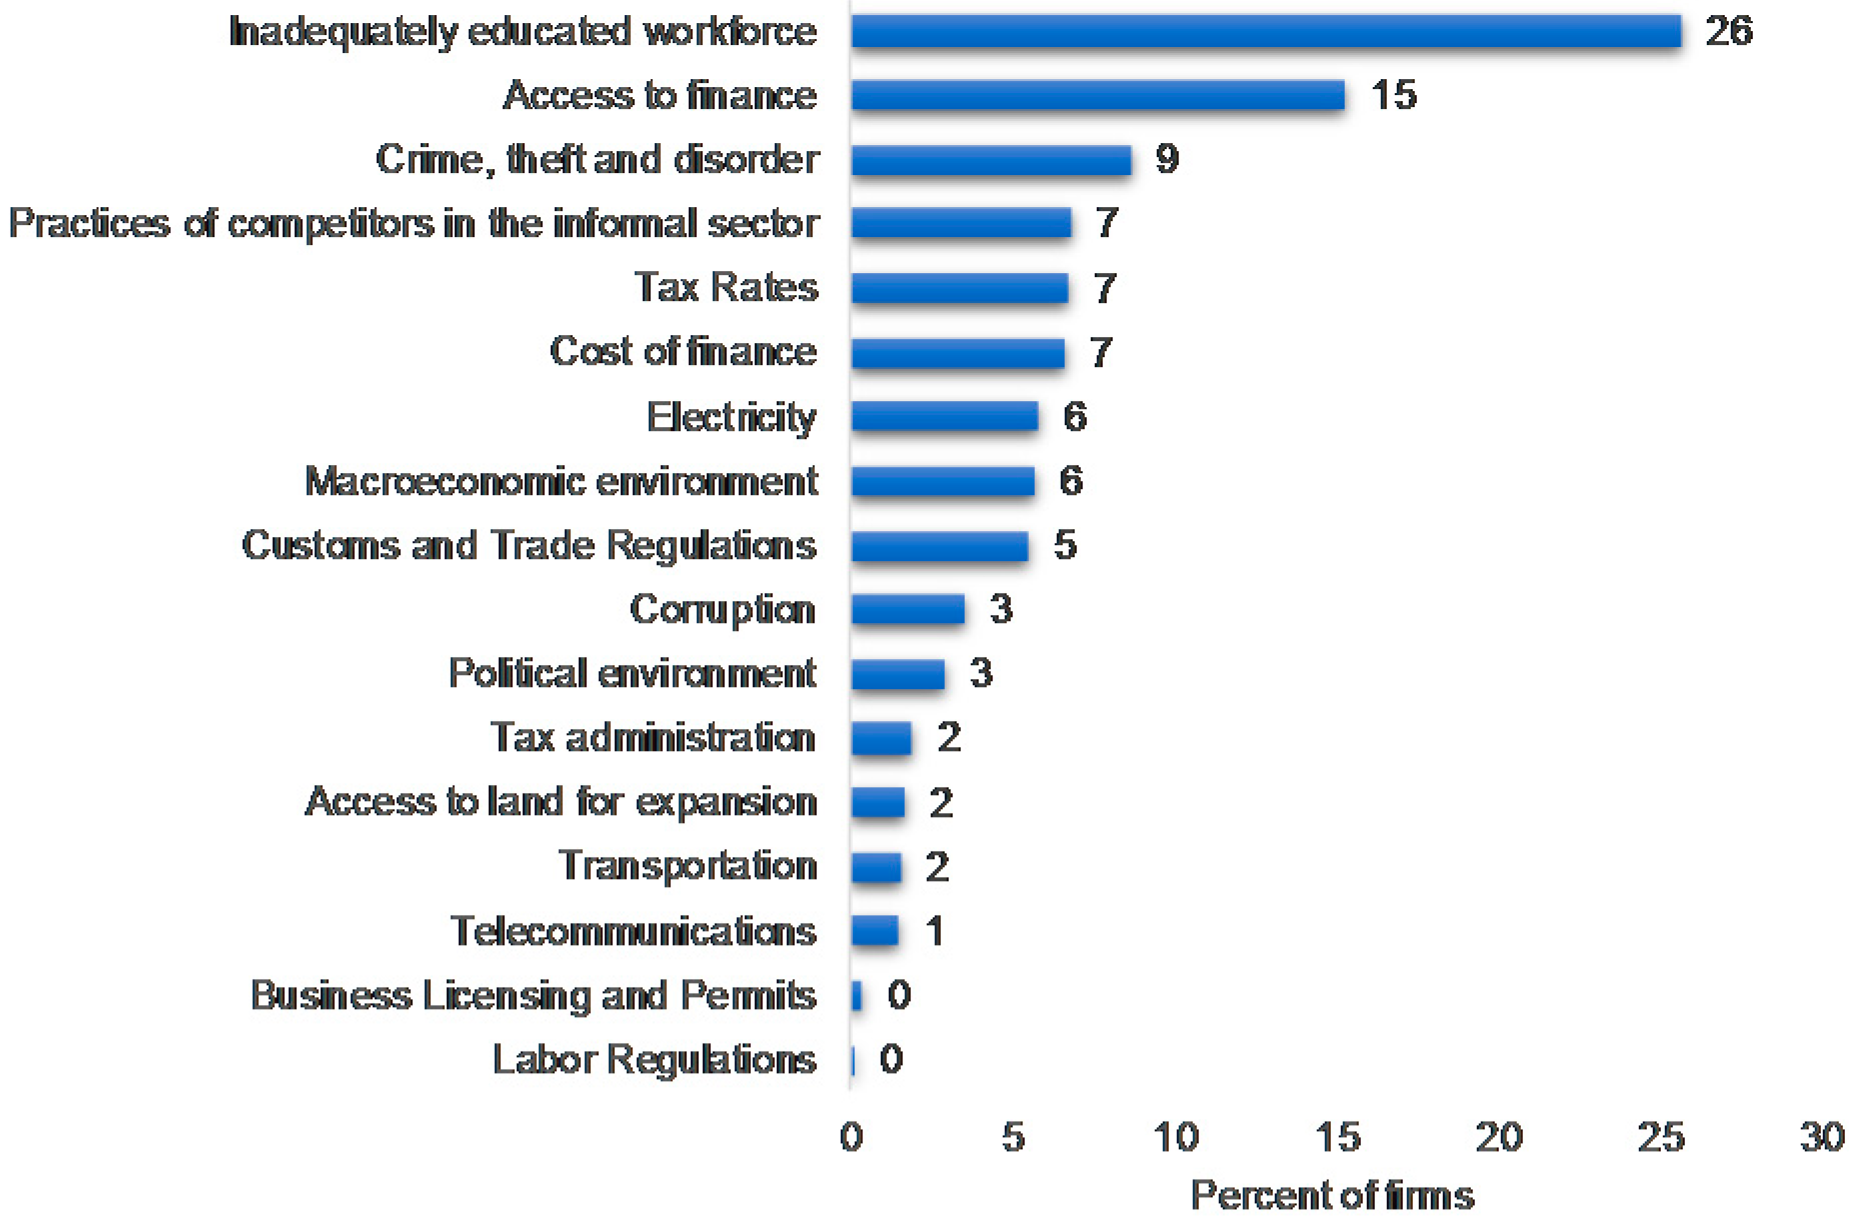
Figure 1 shows the results of an estimated distribution for labour demand using data derived from the 2014 PROTEqIN survey and an estimated distribution of labour supply by educational levels for Barbados, The Bahamas, Jamaica, and Trinidad and Tobago derived from each country’s Labour Force Surveys. The evidence suggests an undersupply of workers with university degrees and vocational training on the right side of the distribution and an oversupply of workers with lower levels of education (primary and secondary). It is therefore not surprising that an inadequately educated workforce is ranked as the most important constraint for firms’ performance (Figure 2).

3. Methodology

This paper tackles four questions: (i) the extent to which firm-level innovation is affected by the firms’ ability to find new skilled employees; (ii) the extent to which firm-level innovation is affected by the educational mismatches at the managerial and professional levels of occupation; (iii) the extent to which firm-level innovation is affected by the firms inability to find employees with core skills or job-related skills; and (iv) the extent to which firm-level innovation is affected by in-firm training.
Three dependent variables reflecting innovation decisions are considered: (i) whether a firm introduced at least one type of innovation in the past three years = 1, otherwise = 0; (ii) whether a firm plans to pursue technological innovation in the next two years = 1, otherwise = 0; and (iii) whether a firm plans to pursue non-technological innovation in the next two years = 1, otherwise = 0, (see Table 3). As each dependent variable is binary, a Probit model is used to estimate the marginal effects associated with factors affecting firms’ decision to innovate.
As this paper focuses on the extent to which education, skills and in-firm training of a firms’ workforce influences innovation, four questions from the PROTEqIN survey are used to construct a set of relevant explanatory variables, along with variables controlling for other standard determinants of innovation (see Table A1 in the Appendix). The first question—Did your establishment have difficulty in finding new skilled employees?—was used to construct a dummy variable equal to 1 if the firm had difficulty finding new skilled employees and 0 otherwise.
The second question used asked firms to specify the minimum level of education required for nine job types, and the average level of education of the firms’ current workforce for the same nine job types. Educational levels and job types comprised five and nine categories, respectively (see Table 2). Six variables are constructed based on whether there are reported differences between the minimum level of education required (MR) for a specific job type and the average level of education required (AR) for that type of job. The analysis focuses on managers and professionals. In the first instance, two dummy variables, one representing a manager mismatch and another representing a professional mismatch are defined as equal to 1 if MR ≠ AR, and 0 otherwise. In addition, four variables are defined to represent undereducated and overeducated managers and professionals as follows: if MR < AR then it is assumed that the firm employs human capital (managerial and or professional) that is undereducated for that position. If the MR > AR, then it is assumed that the firm employs human capital that is overeducated for that position. In this regard, two dummy variables are defined as equal to 1 if AR < MR and 0 otherwise, representing undereducated managers and undereducated professionals, respectively; another two dummy variables, each equal to 1 if AR > MR and 0 otherwise, represent overeducated managers and professionals, respectively (see Table 4).
The third question which asks firms to report whether they had difficulty finding candidates with the appropriate skills (core or job-related) is used to construct another set of explanatory variables.3 For each job type j, a dummy variable is defined as j = 1 if the firm reports that it is “difficult” to “almost impossible” to find candidates with the appropriate skills (core or job-related); and 0 if it is reported as “not difficult” to “slightly difficult”. This yields nine dummy variables, each equal to 1 if the firm had “difficulty” finding employees with core skills for the aforementioned nine job types and 0 otherwise; and another nine dummy variables, each equal to 1 if the firm had “difficulty” finding employees with job-related skills for the aforementioned nine job types (see Table 4).
The fourth variable of interest examines whether in-firm training affects innovation. The question used here asked whether the firm ran formal training programs for its permanent, full-time employees in the last fiscal year, and if so what percentage of production (skilled and unskilled) and non-production workers received training. Two variables were constructed from this question: (i) the percentage of total production workers (skilled and unskilled) that received training and (ii) the percentage of total non-production workers that received training. Table 5 provides summary statistics on the variables used in the regressions.
The regression to be estimated is specified as follows:
I n n o v a t i o n i = β 0 + β 1 ln ( a g e ) i + β 2 ln ( s i z e ) i + β 3 ( e x p o r t e r ) i + β 4 ( i m p o r t e r ) i + β 5 ( i n d u s t r y ) i + X i + θ c + u j
where Innovation is a binary variable equal to 1 if the firm introduced at least one type of innovation in the last three years and 0 otherwise, or if the firm plans to undertake technological innovation in the next two years and 0 otherwise, or if the firm plans to undertake non-technological innovation in the next two years and 0 otherwise; age is the number of years the firm has been in operation, size is the number of employees in the firm at the end of the last fiscal year, exporter is a dummy variable equal to 1 if the firm exports and 0 otherwise, importer is a dummy variable equal to 1 if the firm imports and 0 otherwise, and industry is a dummy variable equal to 1 if the firm is a manufacturer and 0 otherwise. X i represents a vector of explanatory variables:
X i = β 6 ( D S ) i + β 7 ( E M 2 ) i + β 8 ( E M 4 ) i + β 9 ( S K c ) i + β 10 ( S K j ) i + β 11 ( T R ) i
D S is a dummy variable equal to 1 if the firm has difficulty finding new skilled employees and 0 otherwise. E M 2 is a vector of two dummy variables representing manager mismatch and professional mismatch, E M 4 is a vector of four dummy variables representing undereducated managers, undereducated professionals, overeducated managers, and overeducated professionals. S K c is a vector of nine dummy variables each equal to 1 if the firm had “difficulty” finding employees with core skills for nine job types; S K j is a vector of nine dummy variables each equal to 1 if the firm had “difficulty” finding employees with job-related skills for nine job types. T R is a vector of two variables representing the share of production workers that received training and the share of non-production workers that received training. θ c are the country fixed effects, β s are the coefficients to be estimated, and u j is a normally distributed error term. Six separate Probit regressions are estimated, one for each term on the right-hand side of Equation (2).

4. Results

The detailed results from the Probit regressions are presented in Table A2, Table A3, Table A4, Table A5 and Table A6 in the Appendix. The findings from the regressions show that the challenge that Caribbean firms face in recruiting skilled employees and educational mismatches in their workforce at the managerial and professional levels reduce the probability of innovation. Moreover, while the effects of in-firm training on innovation are positive and statistically significant, their magnitude is negligible. These findings generally hold for past innovation, and future innovation decisions related to technological and non-technological activities (Table 6).
The other explanatory variables also show interesting results. The marginal effects of the exporters, firm age, firms size, and manufacturing industry dummies were all positive and statistically significant for past innovation. However, firm age was found to be statistically insignificant for both types of future innovations, and the variable representing exporting firms was found to be statistically insignificant for technological innovation only.
Firms that export are 8 percent more likely to engage in past innovation, and 0.4 percent and 7.6 percent more likely to pursue technological and non-technological innovation in the next two years, than non-exporters. Importers are 7.9 percent more likely to innovate, and 6.9 percent and 6.4 percent more likely to pursue technological and non-technological innovation in the next two years, than non-importers. This finding is consistent with other studies such as Lin and Tang (2013) who found that exporters tend to invest more in R&D compared to non-exporters. Theoretical models by Atkeson and Burstein (2010) and Impullitti and Licandro (2018) show that trade openness induces firms to increase innovation which is mostly explained by the increased competition firms face in international markets (see also Melitz 2003).
Firm age is also found to be positive and statistically significant reflecting a situation where older firms invest more in innovation. The literature on this relationship is inconclusive as some studies have found that older firms have lower innovative probabilities than new entrants or challengers to incumbent firms (Abdelmoula and Etienne 2010; Coad et al. 2016; Czarnitzki and Kraft 2004; Hansen 1992; Huergo and Jaumandreu 2004; Reinganum 1983). However, one of the main arguments put forward in favor of a positive relationship is related to learning effects, which allow older firms to build upon previous capabilities and competences, and through the accumulation of resources and managerial knowledge over time (Herriott et al. 1984; Levitt and March 1988).
Firm size is also found to be statistically significant, increasing innovation by 5.8 percent, as are plans to pursue future technological innovation and non-technological innovation by 5.3 percent and 4 percent, respectively. Similarly, although some papers have found that larger firms tend to invest more in research and development as they can amortize fixed costs over a broader base (Palangkaraya et al. 2016), other studies have found that small firms are more efficient at innovation because they are more flexible and less bureaucratic than larger firms (Becheikh et al. 2006; Le Bas and Scellato 2014). Some studies that have examined the innovation and firm size relationship at the intensive margin draw negative or ambiguous conclusions (Johansson and Lööf 2008). Finally, firms in the manufacturing sector are 16 percent more likely to innovate than firms in other sectors, and 12.1 percent and 6.7 percent more likely to pursue technological innovation and non-technological innovation, respectively, in the next two years.
The marginal effects associated with firms’ inability to find new skilled workers are equal to −0.048, −0.091, and −0.045 for past innovation, future technological innovation, and future non-technological innovation, respectively (i.e., lowering the probabilities of past and future innovations lower by 4.8 percent (past), 9.1 percent (future technological), and 4.5 percent (future non-technological)).
Table A3 and Table A4 in the Appendix present the results associated with a manager mismatch and a professional mismatch, that is, if the firms’ employees are either undereducated or overeducated for those two occupational categories. The marginal effects show that a manager mismatch lowers the probability of innovation by 4.7 percent and 6.6 percent for future technological innovation, while it is statistically insignificant for future non-technological innovation. Similarly, an educational mismatch of professionals lowers the probability of innovation by 4.6 percent but is statistically insignificant for both types of future innovation.
As educational mismatches can be classified as either overeducated or undereducated, Table 6 provides the marginal effects associated with both occupational levels. The results show that overeducated and undereducated managers negatively affect past innovation and future technological innovation. The marginal effects for overeducated managers show that it is relatively larger for future technological innovation, lowering by 13 percent and lowering past innovation by 7 percent. Undereducated managers also reduce the probability of past and future technological innovation by 4 percent and 5 percent, respectively. Moreover, having overeducated professionals increases the probability of future technological innovation by 8 percent, while having undereducated professionals lowers past innovation by 5 percent.
Table A5 in the Appendix presents the results of regressions that examined the relationship between firms’ inability to find workers with appropriate core and job-related skills and innovation. In general, the marginal effects show that at least for three occupational categories, the probability of both past and future innovation is lowered, especially when firms are unable to find employees with the appropriate core skills. The marginal effects show that past innovation is lowered by 9 percent and 4 percent, respectively when firms have difficulty in finding managers with appropriate core and job-related skills, respectively. The effect is also statistically significant for future non-technological innovation, but insignificant for future technological innovation. However, future technological innovation is lowered by 18 percent and 9 percent when firms are unable to find professionals with the appropriate core skills and job-related skills, respectively. Difficulty in finding professionals with the appropriate core and job-related skills are also statistically significant for past innovation, and future non-technological innovation. Difficulty in finding labour with the appropriate core and job-related skills in other job categories such as skilled agricultural workers, craft workers, and plan and machine operators are found to affect the likelihood of innovation, particularly future innovation (see Table A5 in the Appendix).
With respect to training, the results in Table A6 in the Appendix show that training of both production and non-production workers is more likely to increase innovation. Mohan et al. (2017) in examining the determinants of in-firm training in the Caribbean found that it is positively related to firm characteristics such as firm size, being part of a larger firm, exporting, foreign ownership, and expenditure on R&D. These authors also found that training had a positive effect on innovation. The marginal effects reported in Table A6 show that training of both production and non-production workers is positively associated with past and future innovation.

5. Conclusions

This paper sought to fill the gap on the extent to which human capital constraints affect past and future innovation decisions of Caribbean firms. Innovation in the Caribbean is relatively lower than in countries of comparable population size, and Caribbean firms have consistently ranked an “inadequately educated workforce” as their most serious obstacle to improving performance. Low innovation levels have been considered as an underlying cause of the region’s low economic growth and declining productivity levels. Thus, understanding the link between human capital constraints faced by firms and their innovation decisions is a critical issue for policymakers in the Caribbean. In that regard, this paper provides empirical evidence on the relationship between several dimensions of human capital constraints and past and future innovation decision of firms. The paper examined the determinants of firm innovation decisions, focusing on those related to human capital constraints, through several Probit models using firm-level data on 13 Caribbean countries.
The findings from this paper show that human capital constraints do have a statistically significant effect on firm innovation decisions in the Caribbean. Four aspects of human capital constraints were examined: (i) the difficulty of a firm finding new skilled workers; (ii) educational mismatches for managerial and professional job types; (iii) difficulty finding employees with core and job-related skills; and (iv) the importance of in-firm training. The paper shows that when firms’ have difficulty finding new skilled employees they are less likely to engage in any type of innovation, and this is also true for decisions about future technological and non-technological innovations. It was also found that educational mismatches for managerial and professional job types also lowers the likelihood of innovation. This effect is particularly important for future technological innovation when there are overeducated managers and professionals. Moreover, firms that face challenges to find employees with the required core and job-related skills at the managerial and professional levels are less likely to innovate, than those that do not. Finally, in-firm training is found to increase the probability of innovation, but its magnitude is low. In terms of the other traditional determinants of innovation, it was found that firm age, firm size, exporters, importers and manufacturing firms were statistically significant in increasing the probability of past innovation decision. However, for future technological innovation firm age and exporters were statistically insignificant, while for future non-technological innovation all the mentioned variables were statistically significant except for firm age.
The findings suggest that human capital constraints can potentially lower the likelihood of innovation among Caribbean firms. Such an outcome could have adverse macroeconomic implications through the lowering productivity growth. It is, therefore, important for policymakers to enact polices to address the underlying causes of educational and skill mismatches in the labour force and streamline education and training programs that are most relevant to the evolving demands of the labour market. Admittedly, the literature on the underlying factors causing human capital constraints in the Caribbean is sparse, but what exists suggests that the relatively deficient human capital stock is related to worker emigration, quality of education and training and perhaps the need for more relevant education and training programs. The latter may reflect gaps in education policies, information asymmetries between institutions that provide education and training and private sector demand for labour, and weak monitoring and evaluation mechanisms within the region’s education system. Further research in this area is needed along with better-quality data to make more conclusive policy statements. Additionally, given the low intensity of training reported by firms, there is significant potential to increase in-firm training and/or establish networks with both local and foreign institutions to design training programs that can enhance the quality and relevance of firms’ human capital stock within the Caribbean.
In terms of policy suggestions going forward, perhaps a starting point for policymakers is to evaluate the existing stock of programs designed to improve innovation, determine what is working and what is not, and make appropriate changes to the policy mix, as there are other factors apart from human capital constraints that influence innovation decisions.

Conflicts of Interest

The author declares no conflicts of interest.

Appendix

Table A1 shows the survey questions used to construct the dependent and independent variables used in the regression analysis.
Table A1. Selected question from the PROTEqIN survey.
VariablesSurvey Questions
Dependent variables
Past InnovationIn the last three years, did this establishment introduce to the market a new or significantly improved good or service?
Future technological innovationIn the next two years, do you to plan to pursue any of the following innovations in your establishment: (i) product innovation and (ii) process innovation?
Future non-technological innovationIn the next two years, do you to plan to pursue any of the following innovations in your establishment: (i) organizational innovation and (ii) marketing innovation?
Independent variables
Log of firm ageIn what year did this establishment begin operations?
Log of firm sizePlease describe the full-time permanent workforce of your establishment at the end of last fiscal year?
ExporterIn the last fiscal year, what percentage of this establishment’s sales were direct exports?
ImporterDuring the last fiscal year, what percentage of this establishment’s sales were material inputs or supplies of foreign origin?
Were any of the material inputs or supplies purchased in the last fiscal year, imported directly?
Difficulty finding new skillsDid your establishment have difficulty in finding new skilled employees?
Mismatch variablesFor those occupational categories that the firm employs, please specify the following: (i) Minimum required level of education and (ii) Average level of education.
Difficulty finding core and job-related skills for nine (9) job typesPlease specify [on a range from Not difficult (1) to Almost impossible (5)] for each relevant job type the difficulty of finding candidates with the appropriate (i) Core skills and (ii) Job-related skills?
TrainingWhat percentage in each category below received formal training: (i) production workers (skilled and unskilled) and (ii) non-production workers?
Source: PROTEqIN Survey (2014).
Table A2. Difficulty finding employees with new skills.
Past InnovationFuture Innovation
Any Type of InnovationTechnological InnovationNon-Technological Innovation
Log of firm age0.0270.0010.000
(0.06) ***(0.048)(0.048)
Log of firm size0.0580.0530.040
(0.04) ***(0.034) ***(0.033) ***
Exporter0.0800.0040.076
(0.10) ***(0.089)(0.086) **
Importer0.0790.0690.064
(0.09) ***(0.073) **(0.070) **
Industry (manufacturing sector = 1)0.1600.1210.067
(0.09) ***(0.075) ***(0.073) **
Difficulty finding new skills−0.048−0.091−0.045
(0.09) ***(0.074) ***(0.071) *
Observations176717971797
Wald(311) ***(274) ***(170) ***
Log Pseudo Likelihood−666−1012−1110
Pseudo R20.2380.130.08
Country fixed effectsYesYesYes
Notes: (1) coefficients reported are marginal effects; (2) robust standard errors in parenthesis; (3) * coefficients are statistically significant at the 10 percent level, ** at the 5 percent level; *** at the 1 percent level.
Table A3. Educational mismatches.
Past InnovationFuture Innovation
Any Type of InnovationTechnological InnovationNon-Technological Innovation
Log of firm age0.0290.0030.001
(0.058) **(0.049)(0.047)
Log of firm size0.0460.0350.031
(0.037) ***(0.031) ***(0.030) **
Exporter0.0770.0030.077
(0.100) ***(0.089)(0.086) **
Importer0.0760.0660.062
(0.091) ***(0.073) **(0.070) **
Industry (manufacturing sector = 1)0.1610.1230.067
(0.084) ***(0.075) ***(0.073) **
Manager mismatch−0.047−0.066−0.004
(0.079) **(0.065) **(0.063)
Professional mismatch−0.046−0.0060.000
(0.085) **(0.070)(0.068)
Observations176717971797
Wald(319) ***(275) ***(166) ***
Log Pseudo Likelihood−662−1013−1112
Pseudo R20.2420.130.07
Country fixed effectsYesYesYes
Notes: (1) coefficients reported are marginal effects; (2) robust standard errors in parenthesis; (3) * coefficients are statistically significant at the 10 percent level, ** at the 5 percent level; *** at the 1 percent level. Source: Authors’ estimation based on the 2014 PROTEqIN survey.
Table A4. Educational mismatches: overeducated and undereducated employees.
Past InnovationFuture Innovation
Any Type of InnovationTechnological InnovationNon-Technological Innovation
Log of firm age0.0280.0020.000
(0.058) **(0.049)(0.048)
Log of firm size0.0450.0320.029
(0.036) ***(0.031) ***(0.030) ***
Exporter0.0760.0010.076
(0.100) ***(0.089) **(0.086) **
Importer0.0760.0650.062
(0.092) ***(0.073) **(0.071) **
Industry (manufacturing sector = 1)0.1620.1210.068
(0.085) ***(0.075) ***(0.073) **
Educational mismatch:
 Overqualified managers−0.07−0.13−0.02
(0.128) **(0.102) ***(0.096)
 Underqualified managers−0.04−0.050.00
(0.086) **(0.071) *(0.069)
 Overqualified professionals−0.010.080.06
(0.145)(0.123) *(0.121)
 Underqualified professionals−0.05−0.03−0.01
(0.091) ***(0.074)(0.071)
Observations176717971797
Wald(318) ***(285) ***(169) ***
Log Pseudo Likelihood−661−1009−1111
Pseudo R20.240.130.08
Country fixed effectsYesYesYes
Notes: (1) coefficients reported are marginal effects; (2) robust standard errors in parenthesis; (3) * coefficients are statistically significant at the 10 percent level, ** at the 5 percent level; *** at the 1 percent level. Source: Authors’ estimation based on the 2014 PROTEqIN survey.
Table A5. Difficulty finding core and job-related skills.
Past InnovationFuture Innovation
Any Type of InnovationTechnological InnovationNon-Technological Innovation
Core SkillsJob-Related SkillsCore SkillsJob-Related SkillsCore SkillsJob-Related Skills
Log of firm age0.0320.0180.007−0.0060.004−0.012
(0.057) **(0.056)(0.048)(0.047)(0.047)(0.047)
Log of firm size0.0490.0380.0400.0300.0310.025
(0.036) ***(0.035) ***(0.031) ***(0.031) ***(0.031) ***(0.031) ***
Exporter0.0880.0820.0120.0110.0790.084
(0.097) ***(0.096) ***(0.090)(0.089)(0.086)(0.086) **
Importer0.0500.0430.0320.0200.0390.028
(0.086) **(0.083) **(0.070)(0.070)(0.069)(0.069)
Industry (manufacturing sector=1)0.1680.1630.1210.1210.0630.059
(0.083) ***(0.081) ***(0.066) ***(0.075) ***(0.073) **(0.073) ***
Difficulty finding core and job-related skills by job type:
Managers−0.09−0.04−0.060.00−0.07−0.01
(0.124) ***(0.075) **(0.103)(0.066)(0.103) *(0.065) *
Professionals−0.08−0.05−0.18−0.09−0.07−0.03
(0.134) **(0.076 )***(0.011) ***(0.069) ***(0.111) *(0.067) *
Technicians and associate professionals−0.020.010.01−0.010.00−0.03
(0.077)(0.075)(0.067)(0.066)(0.064)(0.064)
Clerical support workers0.040.030.070.000.020.01
(0.105)(0.105)(0.095) *(0.091)(0.092)(0.090)
Service and Sales workers−0.010.02−0.030.000.010.05
(0.092)(0.089)(0.080)(0.078)(0.078)(0.076)
Skilled agricultural, forestry, and fishery workers−0.03−0.09−0.01−0.09−0.05−0.13
(0.089)(0.090) ***(0.076)(0.077) ***(0.074) *(0.074) ***
Craft and related trades workers0.02−0.02−0.04−0.07−0.01−0.06
(0.081)(0.078)(0.069)(0.069) ***(0.066)(0.067) **
Plant and machine operators, and assemblers−0.050.010.070.020.060.10
(0.105) *(0.100)(0.089) **(0.088) **(0.087) *(0.087) ***
Elementary occupations0.000.08−0.060.10−0.010.03
(0.151)(0.145) **(0.133)(0.127) **(0.131)(0.127)
Observations176717671797179817971798
Wald(258) ***(221) ***(214) ***(156) ***(128) ***(128) ***
Log Pseudo Likelihood−706−746−1047−1076−1130−1130
Pseudo R20.190.150.100.070.060.06
Country fixed effectsYesYesYesYesYesYes
Notes: (1) coefficients reported are marginal effects; (2) robust standard errors in parenthesis; (3) * coefficients are statistically significant at the 10 percent level, ** at the 5 percent level; *** at the 1 percent level. Source: Authors’ estimation based on the 2014 PROTEqIN survey.
Table A6. Training of production and non-production workers.
Past InnovationFuture Innovation
Any Type of InnovationTechnological InnovationNon-Technological Innovation
Log of firm age0.0280.0130.000
(0.074)(0.063)(0.060)
Log of firm size0.0490.0290.029
(0.047) ***(0.041) *(0.039) *
Exporter0.053−0.0450.089
(0.121) *(0.115)(0.106) **
Importer0.0470.0040.017
(0.110) *(0.092)(0.089)
Industry (manufacturing sector = 1)0.1830.0720.010
(0.108) ***(0.102) ***(0.096)
Training:
Share of production workers (skilled and unskilled) that received training0.0030.0050.004
(0.003) ***(0.003) ***(0.002) ***
Share of non-production workers that received training0.0040.0050.003
(0.003) ***(0.003) ***(0.003) **
Observations102010421042
Wald(171) ***(93) ***(60) ***
Log Pseudo Likelihood−407−590−657
Pseudo R20.230.120.06
Country fixed effectsYesYesYes
Notes: (1) coefficients reported are marginal effects; (2) robust standard errors in parenthesis; (3) * coefficients are statistically significant at the 10 percent level, ** at the 5 percent level; *** at the 1 percent level. Source: Authors’ estimation based on the 2014 PROTEqIN survey.

References

  1. Abdelmoula, Myriam, and Jean Michel Etienne. 2010. Determination of R&D investment in French firms: A two-part hierarchical model with correlated random effects. Economics of Innovation and New Technology 19: 53–70. [Google Scholar]
  2. Acevedo, Sebastian, Aliona Cebotari, and Therese Turner-Jones. 2013. Caribbean Small States: Challenges of High Debt and Low Growth. Washington: International Monetary Fund. [Google Scholar]
  3. Albaladejo, Manuel, and Henny Romijn. 2000. Determinants of Innovation Capability in Small UK Firms: An Empirical Analysis. Working Paper # 00.13. Eindhoven, The Netherlands: Eindhoven Centre for Innovation Studies. [Google Scholar]
  4. Alleyne, Trevor, Krishna Srinivasan, Inci Otker, and Uma Ramakrishnan, eds. 2017. Unleashing Growth and Strengthening Resilience in the Caribbean. Washington: International Monetary Fund. [Google Scholar]
  5. Alleyne, Antonio, Troy Lorde, and Quinn Weekes. 2017. A Firm-Level Investigation of Innovation in the Caribbean: A Comparison of Manufacturing and Service Firms. Economies 5: 34. [Google Scholar] [CrossRef]
  6. Amara, Nabil, Réjean Landry, Nizar Bechiekh, and Mathieu Ouimet. 2008. Learning and novelty of innovation in established manufacturing SMEs. Technovation 28: 450–63. [Google Scholar] [CrossRef]
  7. Atalay, Murat, Nilgün Anafarta, and Fulya Sarvan. 2013. The Relationship between Innovation and Firm Performance: An Empirical Evidence from Turkish Automotive Supplier Industry. Proceedings-Social and Behavioural Sciences 75: 226–35. [Google Scholar] [CrossRef]
  8. Atkeson, Andrew, and Ariel Tomás Burstein. 2010. Innovation, Firm Dynamics, and International Trade. Journal of Political Economy 118: 433–84. [Google Scholar] [CrossRef]
  9. Becheikh, Nizar, Réjean Landry, and Nabil Amara. 2006. Lessons from Innovation Empirical Studies in the Manufacturing Sector: A Systematic Review of the Literature from 1993–2003. Technovation 26: 644–64. [Google Scholar] [CrossRef]
  10. Coad, Alex, Agustí Segarra, and Mercedes Teruel. 2016. Innovation and firm growth: Does firm age play a role? Research Policy 45: 387–400. [Google Scholar] [CrossRef]
  11. Czarnitzki, Dirk, and Kornelius Kraft. 2004. An Empirical Test of the Asymmetric Models on Innovative Activity: Who Invests More into R&D, the Incumbent or the Challenger? Journal of Economic and Behavioral Organization 54: 153–73. [Google Scholar]
  12. Dolton, Peter, and Anna Vignoles. 2002. The Return on Post–Compulsory School Mathematics Study. Economica 69: 113–42. [Google Scholar] [CrossRef]
  13. Fuentes, Rodrigo, Valerie Mercer-Blackman, and Karl Melgarejo. 2015. Understanding Economic Growth in the Caribbean Region: A Conceptual and Methodological Study. Mimeo. Washington: Inter-American Development Bank. [Google Scholar]
  14. Gangl, Markus. 2000. Changing Labour Markets and Early Career Outcomes: Labour Market Entry in Europe over the Past Decade. Arbeitspapiere Working Paper #26. Mannheim, Germany: Mannheimer Zentrum für Europäische Sozialforschung. [Google Scholar]
  15. Hall, Bronwyn. 2011. Innovation and Productivity. NBER Working Paper 17178. Cambridge, MA, USA: Nationa Bureau of Economic Research. [Google Scholar]
  16. Hansen, John. 1992. Innovation, Firm Size, and Firm Age. Small Business Economics 4: 37–44. [Google Scholar]
  17. Herriott, Scott, Daniel Levinthal, and James G. March. 1984. Learning from Experience in Organizations. American Economic Review 75: 298–302. [Google Scholar]
  18. Huergo, Elena, and Jordi Jaumandreu. 2004. How Does Probability of Innovation Change with Firm Age? Small Business Economics 22: 193–207. [Google Scholar] [CrossRef]
  19. Impullitti, Giammario, and Omar Licandro. 2018. Trade, Firm Selection and Innovation: The Competition Channel. The Economic Journal 128: 189–229. [Google Scholar] [CrossRef]
  20. Johansson, Börje, and Hans Lööf. 2008. Innovation Activities Explained By Firm Attributes and Location. Economics of Innovation and New Technology 17: 533–52. [Google Scholar] [CrossRef]
  21. Jones, Barbara, and Damian Grimshaw. 2012. The Effects of Policies for Training and Skills on Improving Innovation Capabilities in Firms. Compendium of Evidence on the Effectiveness of Innovation Policy Intervention. NESTA. Manchester: Manchester Institute of Innovation Research, University of Manchester. [Google Scholar]
  22. Khadan, Jeetendra. 2017. Are Oil and Gas Smothering the Private Sector in Trinidad and Tobago? Washington: Inter-American Development Bank. [Google Scholar]
  23. Kim, Young-Hwa. 2002. A State of Art Review on the Impact of Technology on Skill Demand in OECD Countries. Journal of Education and Work 15: 89–109. [Google Scholar] [CrossRef]
  24. Krueger, Dirk, and Krishna Kumar. 2004. Skill-Specific Rather than General Education: A Reason for US-Europe Growth Differences? Journal of Economic Growth 9: 167–207. [Google Scholar] [CrossRef]
  25. Le Bas, Christian, and Giuseppe Scellato. 2014. Firm innovation persistence: A fresh look at the frameworks of analysis. Economics of Innovation and New Technology 23: 423–46. [Google Scholar] [CrossRef]
  26. Leiponen, Aija. 1996. Education and Innovative Capabilities. Working Paper # 96-140. Laxenburg: International Institute for Applied Systems Analysis. [Google Scholar]
  27. Levitt, Barbara, and James March. 1988. Organizational Learning. Annual Review of Sociology 14: 319–40. [Google Scholar] [CrossRef]
  28. Lin, Faqin, and Hsiao Chink Tang. 2013. Exporting and Innovation: Theory and Firm-Level Evidence from People’s Republic of China. International Journal of Applied Economics 10: 52–76. [Google Scholar]
  29. Lööf, Hans, and Almas Heshmati. 2006. On the Relationship between Innovation and Performance: A Sensitivity Analysis. Economics of Innovation and New Technology 15: 317–44. [Google Scholar] [CrossRef]
  30. Melitz, Marc. 2003. The Impact of Trade on Intra-industry Reallocations and Aggregate Industry Productivity. Econometrica 71: 1695–725. [Google Scholar] [CrossRef]
  31. Mishra, Prachi. 2006. Emigration and Brain Drain: Evidence from the Caribbean. IMF Working Paper 06/25. Washington, DC, USA: International Monetary Fund. [Google Scholar]
  32. Mohan, Preeya, Eric Strobl, and Patrick Watson. 2017. In-Firm Training, Innovation and Productivity: The Case of Caribbean Small Island Developing States. IDB Publications (Working Papers) 8216. Washington, DC, USA: Inter-American Development Bank. [Google Scholar]
  33. OECD (Organisation for Economic Cooperation and Development). 2011. Skills for Innovation and Research. Paris: Organisation for Economic Cooperation and Development. [Google Scholar]
  34. Palangkaraya, Alfons, Thomas Spurling, and Elizabeth Webster. 2016. What Drives Firm Innovation? A Review of the Economics Literature. Centre for Transformative Innovation. Melbourne: Australian Council of Learned Academies. [Google Scholar]
  35. Reinganum, Jennifer. 1983. Uncertain Innovation and the Persistence of Monopoly. American Economic Review 73: 741–48. [Google Scholar]
  36. Ruprah, Inder, and Ricardo Sierra. 2016. Engine of Growth? The Caribbean Private Sector Needs More than an Oil Change. Washington: Inter-American Development Bank. [Google Scholar]
  37. Toner, Phillip. 2011. Workforce Skills and Innovation: An Overview of Major Themes in the Literature. OECD Education Working Paper # 55. Paris, France: OECD Publishing. [Google Scholar]
  38. Van Uden, Annelies, Joris Knoben, and Patrick Vermeulen. 2014. Human Capital and Innovation in Developing Countries: A Firm Level Study. Working Paper STRAT14-01. Nijmegen, The Netherlands: Radboud University Nijmegen. [Google Scholar]
  39. Winkelmann, Rainer. 1996. Training, Earnings and Mobility in Germany. Konjunkturpolitik 42: 275–98. [Google Scholar]
1
The Caribbean countries considered in the analysis are Antigua and Barbuda, Barbados, Dominica, Grenada, Guyana, Jamaica, Saint Lucia, St. Kitts and Nevis, St. Vincent and the Grenadines, Suriname, The Bahamas and Trinidad and Tobago.
2
Technological innovation refers to product and process innovation and non-technological innovation refers to organizational and marketing innovations.
3
Core skills refer to communication skills, team-working skills, problem-solving skills, literacy skills (reading and writing), numeracy skills (analysis of numerical data and calculations), use of information and communication technology, planning and organizing skills, customer care skills, responsibility, reliability and trustworthiness, motivation and commitment, self-management and entrepreneurship, general vocational job-specific skills, advanced vocational job-specific skills, and foreign language. Job-related skills refer to the minimum required level of education, domestic post-secondary education, foreign post-secondary education, grades and transcripts, theoretical knowledge of the job, practical knowledge of the job, previous work experience in the same field, previous work experience in different field, and general experience in a workplace (PROTEqIN survey, 2014).
Figure 1. Labour demand and supply differentiated by educational level (percent). Source: Ruprah and Sierra (2016).
Economies 06 00033 g001
Figure 2. Most important constraints affecting firms’ performance (percent). Source: PROTEQIN Survey (2014).
Economies 06 00033 g002
Table 1. Innovation in the Caribbean (% of firms).
Past InnovationFuture InnovationInnovation Department
Technological InnovationNon-Technological Innovation
Antigua and Barbuda13.023.726.73.1
Barbados30.641.536.620.3
Dominica4.827.038.11.6
Grenada9.324.033.34.7
Guyana53.377.575.036.7
Jamaica20.036.031.813.2
Saint Lucia14.817.229.72.3
St. Kitts and Nevis16.030.432.06.4
St. Vincent and the Grenadines20.327.143.63.8
Suriname51.678.370.032.5
The Bahamas16.524.429.13.1
Trinidad and Tobago9.427.934.45.3
Caribbean19.434.938.610.3
Source: PROTEqIN Survey 2014.
Table 2. Educational mismatch at the firm level.
Required Minimum Education and Average Education (Percent of Firms)
ManagersProfessionalsTechnicians and Associate ProfessionalsClerical Support WorkersService and Sales WorkersSkilled Agricultural, Forestry, and Fishery WorkersCraft and Related Trades WorkersPlant and Machine Operators, and AssemblersElementary Occupations
Minimum level of education sought for position
Completed primary0.40.01.02.93.12.11.28.513.1
Completed secondary7.82.215.035.027.127.843.859.684.1
Completed college/vocational training12.810.270.961.869.669.754.930.9
University graduate68.675.513.10.2 0.4
Post-graduate (Masters, Ph. D)10.412.1
Average level of education of current workforce
Completed primary2.00.91.43.33.92.16.640.261.4
Completed secondary16.68.135.564.160.473.475.647.926.0
Completed college/vocational training24.222.453.032.435.324.217.66.4
University graduate47.861.010.10.20.2 0.6
Post-graduate (Masters, Ph. D)9.37.6
Source: Authors estimates from PROTEqIN 2014. Note: the table provides information on the distribution of educational requirements and the average level of education for each job type. The green cells indicate a situation where more firms have employees with an appropriate (or higher) level of education required for that job type and red cells indicate otherwise.
Table 3. Dependent variables.
Past innovationIntroduction of at least one type of innovation in the past three years = 1
Otherwise = 0
Future technological innovationFirm plans to pursue technological innovation in the next two years = 1
Otherwise = 0
Future non-technological innovationFirm plans to pursue non-technological innovation in the next two years = 1
Otherwise = 0
Table 4. Explanatory variables.
Difficulty in finding new skilled employeesFirm had difficulty finding new skilled employees = 1
Otherwise = 0
Manager mismatchFor managers: if (MR) ≠ (AR) = 1
Otherwise = 0
Professional mismatchFor professional: if (MR) ≠ (AR) = 1
Otherwise = 0
Overqualified managersFor managers: if (MR) < (AR) = 1
Otherwise = 0
Underqualified managersFor managers: if (MR) > (AR) = 1
Otherwise = 0
Overqualified professionalsFor professional: if (MR) < (AR) = 1
Otherwise = 0
Underqualified professionalsFor professional: if (MR) > (AR) = 1
Otherwise = 0
Difficulty finding candidates with the appropriate skills (core or job-related):
ManagersManagers: “difficult” to “almost impossible” = 1
Managers: “not difficult” to “slightly difficult” = 0
ProfessionalsProfessionals: “difficult” to “almost impossible” = 1
Professionals: “not difficult” to “slightly difficult” = 0
Technicians and associate professionals (TAP)TAP: “difficult” to “almost impossible” = 1
TAP: “not difficult” to “slightly difficult” = 0
Clerical support workers (CSW)CSW: “difficult” to “almost impossible” = 1
CSW: “not difficult” to “slightly difficult” = 0
Service and sales workers (SSW)SSW: “difficult” to “almost impossible” = 1
SSW: “not difficult” to “slightly difficult” = 0
Skilled agricultural, forestry, and fishery workers (SAFFW)SAFFW: “difficult” to “almost impossible” = 1
SAFFW: “not difficult” to “slightly difficult” = 0
Craft and related trades workers (CRTW)CRTW: “difficult” to “almost impossible” = 1
CRTW: “not difficult” to “slightly difficult” = 0
Plant and machine operators, and assemblers (PMOA)PMOA: “difficult” to “almost impossible” = 1
PMOA: “not difficult” to “slightly difficult” = 0
Elementary occupations (EO)EO: “difficult” to “almost impossible” = 1
EO: “not difficult” to “slightly difficult” = 0
Table 5. Summary statistics.
VariableNumber of ObservationsMeanStd. Dev.
Past innovation18150.190.40
Future technology innovation18460.350.48
Future non-technology innovation18460.390.49
ln (age)17972.980.71
ln (size)18443.221.17
Exporter18460.160.37
Importer18460.540.50
Difficulty finding core skills
Manager18460.830.37
Professionals18460.790.41
Technicians and associate professionals18460.530.50
Clerical support workers18460.160.37
Service and Sales workers18460.220.42
Skilled agricultural, forestry, and fishery workers18460.410.49
Craft and related trades workers18460.450.50
Plant and machine operators, and assemblers18460.150.35
Elementary occupations18460.120.33
Difficulty finding job-related skills
Manager18460.660.48
Professionals18460.610.49
Technicians and associate professionals18460.420.49
Clerical support workers18460.160.37
Service and sales workers18460.260.44
Skilled agricultural, forestry, and fishery workers18460.280.45
Craft and related trades workers18460.360.48
Plant and machine operators, and assemblers18460.160.37
Elementary occupations18460.110.32
Industry (manufacturing sector = 1)18440.250.43
Difficulty finding new skills18460.460.50
Manager mismatch18460.490.50
Professional mismatch18460.550.50
Overqualified managers18460.130.34
Underqualified managers18460.360.48
Underqualified professionals18460.470.50
Overqualified professionals18460.070.26
Training of workers
 Share of production workers (skilled and unskilled)106110.1922.21
 Share of non-production workers106113.1322.02
Source: Authors’ estimation based on the 2014 PROTEqIN survey. Note: “ln” stands for natural logarithms.
Table 6. Summary of main results from Probit estimations.
Dependent Variables
Any Type of InnovationTechnological InnovationNon-Technological Innovation
Difficulty finding new skills−0.048 ***−0.091 ***−0.045 *
Educational mismatch:
Manager mismatch−0.047 **−0.066 **−0.004
Professional mismatch−0.046 **−0.0060.000
Overqualified managers−0.07 **−0.13 ***−0.02
Underqualified managers−0.04 **−0.05 *0.00
Overqualified professionals−0.010.08 *0.06
Underqualified professionals−0.05 ***−0.03−0.01
Training:
Share of production workers (skilled and unskilled)0.003 ***0.005 ***0.004 ***
Share of non-production workers0.004 ***0.005 ***0.003 ***
Source: Author’s estimates. * coefficients are statistically significant at the 10 percent level, ** at the 5 percent level; *** at the 1 percent level. See Appendix 1 for detailed results.

