1. Introduction
The transmission of financial shocks across national borders—rapidly and often beyond what economic fundamentals would predict—stands as one of the defining challenges of international finance. Between 2007 and 2025, global financial markets experienced three structurally distinct episodes of severe turbulence: the Global Financial Crisis (GFC) of 2007–2009, which propagated through interbank credit channels and produced the deepest global recession since the 1930s; the COVID-19 pandemic of 2020–2021, which generated an exogenous demand shock, with US equity volatility in March 2020 surpassing even the acute phases of the GFC (
Ibrahim et al., 2020;
Naeem et al., 2024;
Zonon et al., 2025); and the Russia–Ukraine war of 2022–2023, which triggered an energy supply crisis concentrated in Europe, driving inflation to its highest levels since the 1970s and raising the prospect of recession across the continent (
Basdekis et al., 2022;
Katsampoxakis et al., 2024;
Zaheer et al., 2024). Each episode reached the stock markets of South Eastern Europe (SEE) with measurable effects on return volatility and cross-market co-movement.
The SEE region is internally heterogeneous: EU member markets (Bulgaria, Croatia, Greece, Romania, Slovenia) have undergone regulatory harmonization under EU financial directives, while accession countries (Bosnia and Herzegovina, North Macedonia, Montenegro, Serbia, Turkey) have only partially converged. Despite this heterogeneity, the literature routinely treats the region as homogeneous (
Guidi & Ugur, 2014;
Škrinjarić, 2020).
The existing literature on SEE contagion exhibits three important limitations. First, most studies analyze a single crisis episode—typically the GFC—without examining whether transmission mechanisms generalize to structurally different shocks. Second, no study exploits the EU member/accession distinction as an analytical dimension. Third, static cointegration tests and GARCH-family models cannot capture the time-varying, scale-dependent nature of financial contagion across investors with heterogeneous trading horizons (
Dima et al., 2015;
Polanco-Martínez et al., 2018).
This study addresses these limitations by combining wavelet coherence analysis with nonlinear causality testing for ten SEE markets over the period 2007–2025. The primary contribution relative to the closest existing study—
Polanco-Martínez et al. (
2018), which analyzes Greece against a European benchmark up to 2011—is threefold: an extension to 10 markets, the inclusion of three crisis episodes, and a systematic EU member-versus-accession distinction. The remainder of the paper is organized as follows:
Section 2 reviews the relevant literature;
Section 3 describes the data and methodology;
Section 4 presents the empirical results;
Section 5 discusses the findings and
Section 6 concludes.
2. Literature Review
2.1. Financial Contagion: Definition and Theoretical Background
Financial contagion is defined as the transmission of financial shocks beyond what fundamental economic linkages would predict (
Forbes & Rigobon, 2002). The key theoretical distinction is between contagion—a structural break in cross-market co-movement—and interdependence, the continuation of pre-existing linkages. Transmission channels include trade, financial (common creditor effects, portfolio rebalancing), and information channels (
Kaminsky et al., 2003;
Longstaff, 2010). Crisis-contingent theories predict structural shifts in transmission during crises, while non-crisis-contingent theories attribute higher co-movement to amplification of pre-existing linkages (
Dornbusch et al., 2000)—a distinction our wavelet framework is designed to test empirically.
2.2. Wavelet Methods in Financial Contagion Research
2.3. SEE Market Integration: EU Members Versus Accession Countries
EU member markets have benefited from the Capital Requirements Directive and MiFID II harmonization, with Slovenia and Croatia also adopting the euro, and empirical studies document moderate-to-strong correlations with Western benchmarks at lower frequencies (
Kiviaho et al., 2014;
Dajcman et al., 2012). Similar results were found in other studies regarding many SEE countries and Western European markets (
Tilfani et al., 2020;
Živkov et al., 2019;
Shahzad et al., 2016). Accession markets show more episodic integration: low baseline correlations rise sharply during global crises as international investors withdraw from all emerging markets simultaneously (
Horvath & Petrovski, 2013;
Moagăr-Poladian et al., 2019;
Grbić, 2021). Turkey occupies an intermediate position, with co-movement approaching lower-tier EU member levels despite its suspended accession process (
Sarvan et al., 2014). To our knowledge, whether institutional EU membership generates incremental integration above economic linkages has not been explicitly quantified in the literature—the central question this paper addresses.
2.4. Research Hypotheses
Based on the preceding review, we formulate three testable hypotheses:
H1. Co-movement between SEE and European/US stock markets is time-varying and scale-dependent, with crisis periods generating significantly stronger co-movement than tranquil periods, and the intensity of co-movement differing across the three crisis episodes (GFC, COVID-19, Ukraine war).
H2. The causal direction of shock transmission is predominantly unidirectional from the StoxxEurope600 and S&P 500 to SEE markets, with SEE markets acting as net receivers of contagion at all wavelet scales.
H3. EU member SEE markets show stronger and more structurally persistent co-movement with the European benchmark than EU accession markets, reflecting the incremental integration generated by institutional EU membership beyond trade and banking linkages.
3. Data and Methodology
3.1. Data
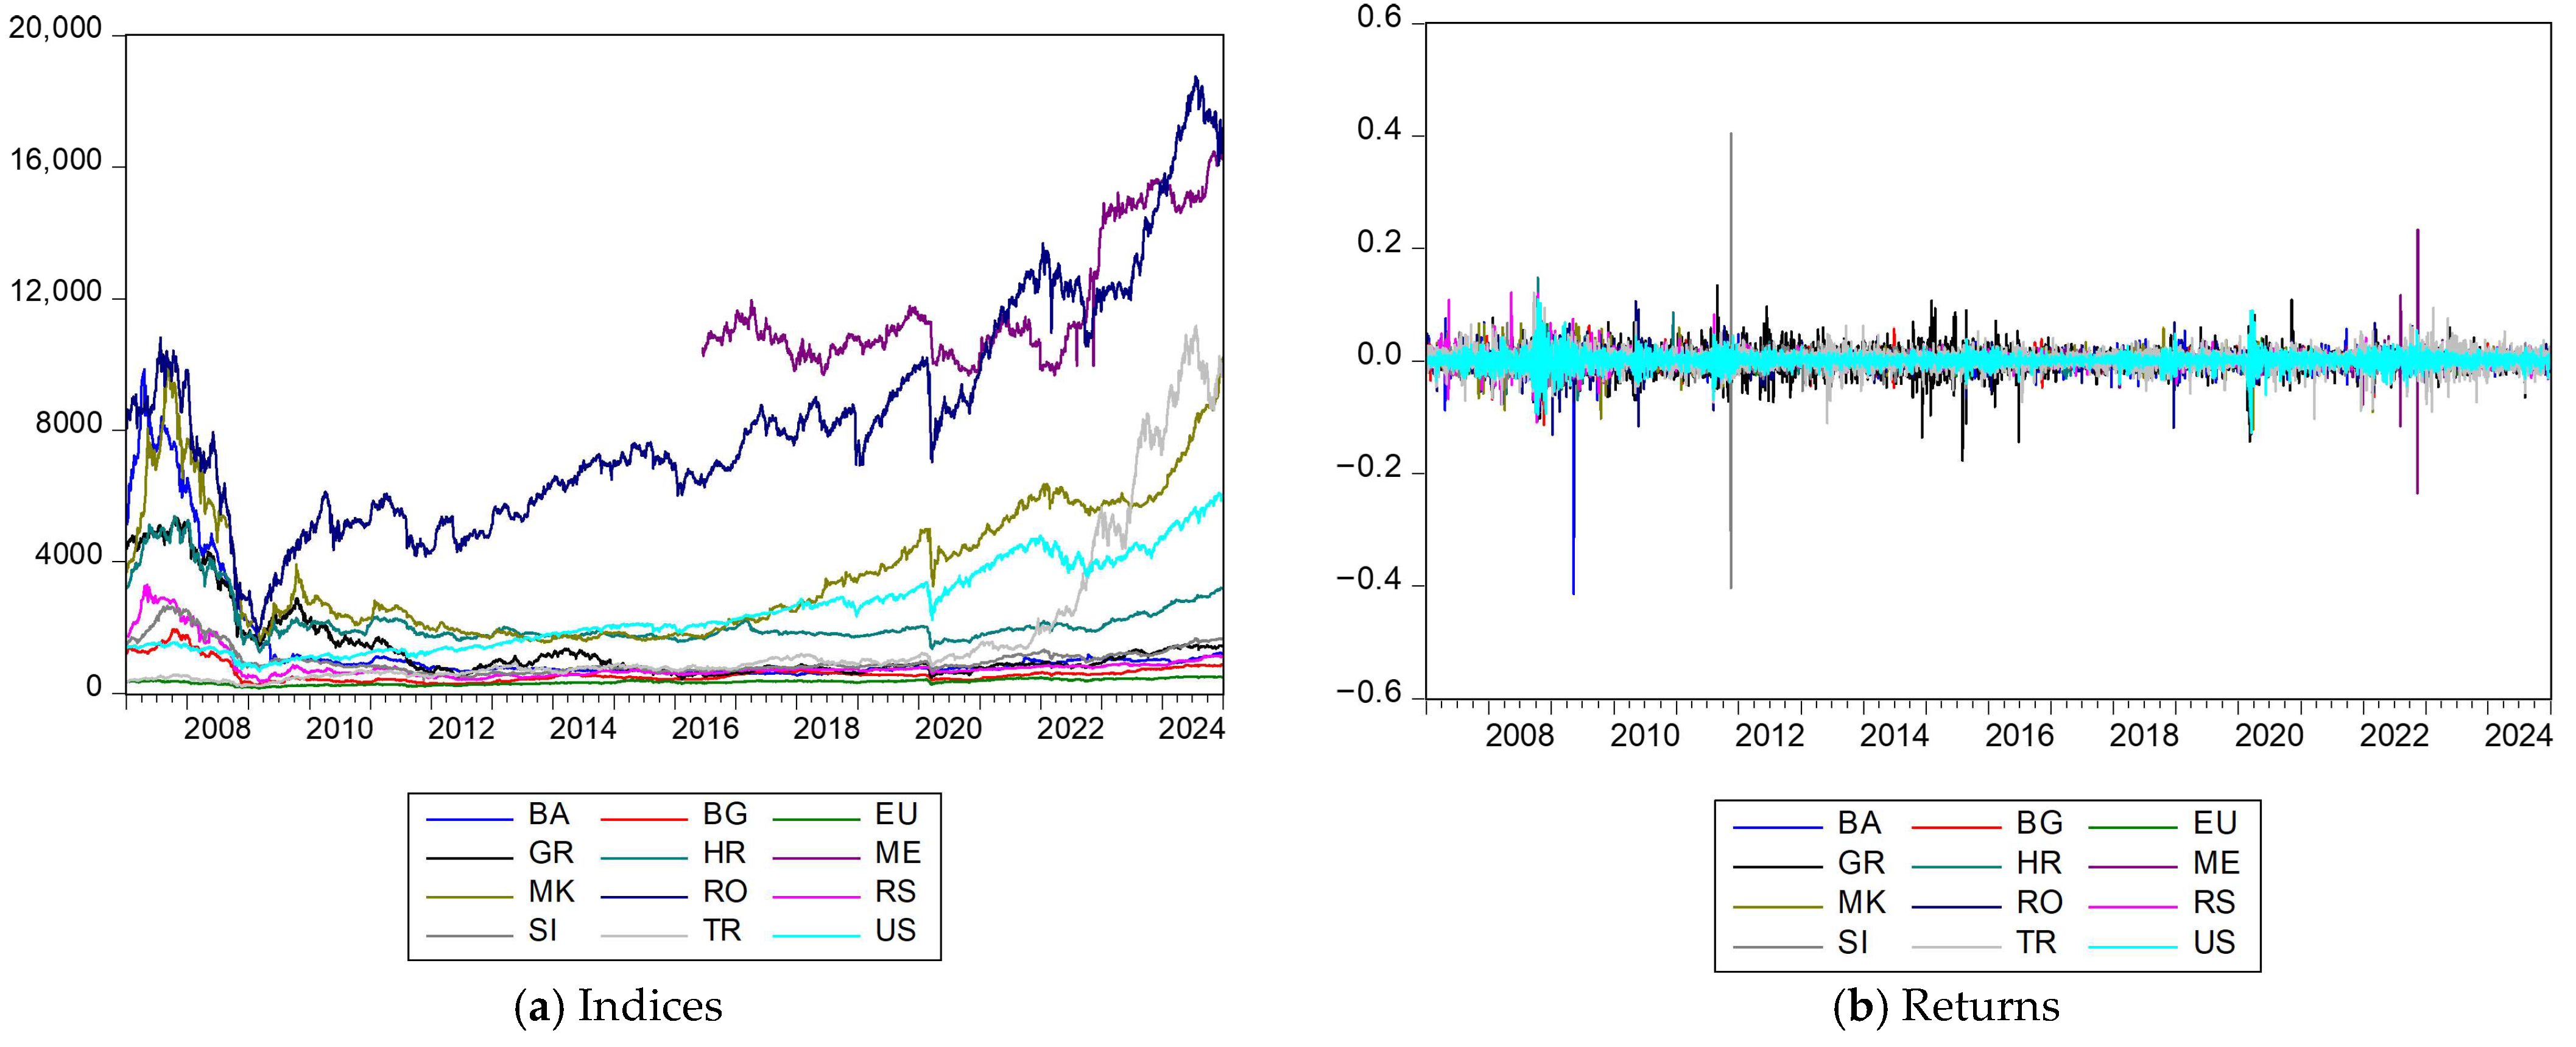
The study employs daily closing price indices for 10 SEE stock markets and 2 international benchmarks, sourced from Bloomberg Terminal. The EU member group comprises: SBITOP (Slovenia), CROBEX (Croatia), BET (Romania), BSE Sofia (Bulgaria), and ATG (Greece). The EU accession group comprises: SASX-10 (Bosnia and Herzegovina), MBI10 (North Macedonia), MONEX20 (Montenegro), BELEX15 (Serbia), and BIST100 (Turkey). The two international benchmarks are the StoxxEurope600 (covering 600 companies across 17 European countries) and the S&P 500. The sample covers 2 January 2007 to 30 September 2025, yielding 4823 daily observations per series after synchronization for non-trading days. Time-series plots of the log-return series for all markets are provided in
Figure 1 to allow visual inspection of crisis-period volatility clustering and the timing of major breaks before the wavelet analysis. Daily logarithmic returns are computed as:
where
Pi,t is the closing price of index
i on day
t.
Table 2 presents descriptive statistics. All series exhibit excess kurtosis substantially exceeding the Gaussian benchmark of 3, confirming heavy-tailed distributions and motivating the use of non-parametric wavelet-based methods. The highest volatility is recorded for Turkey (std. dev. 0.01976) and Greece (0.01729); Bosnia (0.01154) and Montenegro (0.00974) are the least volatile, reflecting thin and illiquid market conditions.
3.2. Wavelet Coherence Analysis (MODWT)
3.2.1. MODWT Decomposition
The MODWT with a Daubechies Least Asymmetric LA(8) filter decomposes the return series
Rt into six wavelet coefficient vectors
Wj,t (
j = 1, …, 6) capturing variation at scales
λj = 2
(j−1) days, and a residual scaling coefficient
V6,t capturing the low-frequency trend. The MODWT is preferred over the classical DWT for its asymptotic efficiency advantage and translation-invariance property (
Percival & Walden, 2000). We restrict the decomposition to
j = 6 levels to avoid boundary contamination, yielding six scales with periods of 2–4 days (D1) through 64–128 days (D6).
Table 3 presents the economic interpretation of each scale.
The unbiased MODWT wavelet covariance and wavelet correlation between return series
Xt and
Yt at scale
λj are:
where
Lj = (2
(j−1) × (
L − 1)) is the length of the level-
j wavelet filter (
L = 8 for LA(8)), and the summation excludes
Lj − 1 boundary-contaminated coefficients. The estimator
ρxγ(
λj) ∈ [−1, 1] with confidence intervals constructed via the Fisher z-transformation.
3.2.2. Continuous Wavelet Transform and Wavelet Coherence
To complement the MODWT analysis with a full time-frequency visualization, we compute the Continuous Wavelet Transform (CWT) using the Morlet mother wavelet (central frequency
ω0 = 6). The squared wavelet coherence between series
Xt and
Yt at translation
u and scale
s is:
where
S is a smoothing operator applied in both time and scale directions following
Torrence and Compo (
1998), and
Wxγ(
u,
s) =
Wx(
u,
s)
· W*γ(
u,
s) is the cross-wavelet transform. Values
R2xγ ∈ [0, 1] approaching 1 indicate high local co-movement. Significance thresholds at the 5% level are derived from Monte Carlo simulations under the null of two independent AR(1) processes (
Torrence & Compo, 1998), displayed as black contour lines in the wavelet coherence plots. The phase difference
φxγ(
u,
s) = arctan[
I{
S(
Wxγ)}/
R{
S(
Wxγ)}] encodes the lead–lag relationship: rightward arrows (→) indicate in-phase co-movement; downward-right arrows (↘) indicate that X leads Y.
3.3. Nonlinear Breitung–Candelon Causality Test
To establish the directionality of information transmission at each wavelet scale, we apply the
Breitung and Candelon (
2006) frequency-domain causality test to the MODWT wavelet coefficient series {
Wx,j,t} and {
Wγ,j,t} at each scale j. Fitting a bivariate VAR(p) model (lag order selected by BIC) to
Zj,t = (
Wx,j,t,
Wγ,j,t)′, the null hypothesis that X does not cause
Y at frequency
ω is expressed as the restriction a
1(
ω) = 0, where
ak(
ω) =
Σs (
φ12,s cos(
sω),
φ12,s sin(
sω)). The test statistic follows an F-distribution with 2 and T − 2p degrees of freedom. We test at three representative frequencies corresponding to scales D1, D4, and D6, and report results separately for pre-crisis (2007–2008), crisis (2008–2009, 2020–2022, 2022–2024), and recovery (2013–2019) sub-periods.
3.4. Robustness Check: DCC-GARCH
To validate the wavelet coherence findings through an independent methodology, we estimate bivariate DCC-GARCH(1,1) models (
Engle, 2002) for each of the 20 market pairs. The conditional covariance matrix is decomposed as
Ht =
Dt Rt Dt, where
Dt = diag(
√hi,t, √hk,t) contains conditional standard deviations from GARCH(1,1) univariate models, and the conditional correlation matrix R
t evolves as
Qt = (1 − a − b)
Q + a
ut−1 u′
t−1 + b
Qt−1,
Rt = diag(
Qt)
1/2Qt diag(
Qt)
1/2, where a, b > 0 and a + b < 1. DCC-estimated conditional correlations are compared to wavelet correlations at scale D4. Convergence is assessed via Spearman rank correlation between the two time-varying correlation series during crisis windows.
3.5. Structural Break Test
Crisis onset and resolution dates are formally identified using the
Bai and Perron (
1998,
2003) multiple structural break test applied to the MODWT coefficient series at scales D1, D3, and D6 for each market. The sequential procedure (maximum 5 breaks, trimming parameter 0.15) identifies break dates significant at the 5% level. Convergence of break dates across scales D1 and D6 at the same calendar period is interpreted as evidence of a genuine regime shift affecting both short-run and long-run market dynamics simultaneously—the signature of crisis-contingent contagion. All estimations are performed in R (waveslim 1.8.5, W2CWM2C 2.2, rmgarch 1.4-2, and strucchange 1.5-4 packages). Replication code is available upon request.
4. Empirical Results
4.1. Wavelet Coherence: Overview
The wavelet correlation analysis reveals two overarching patterns.
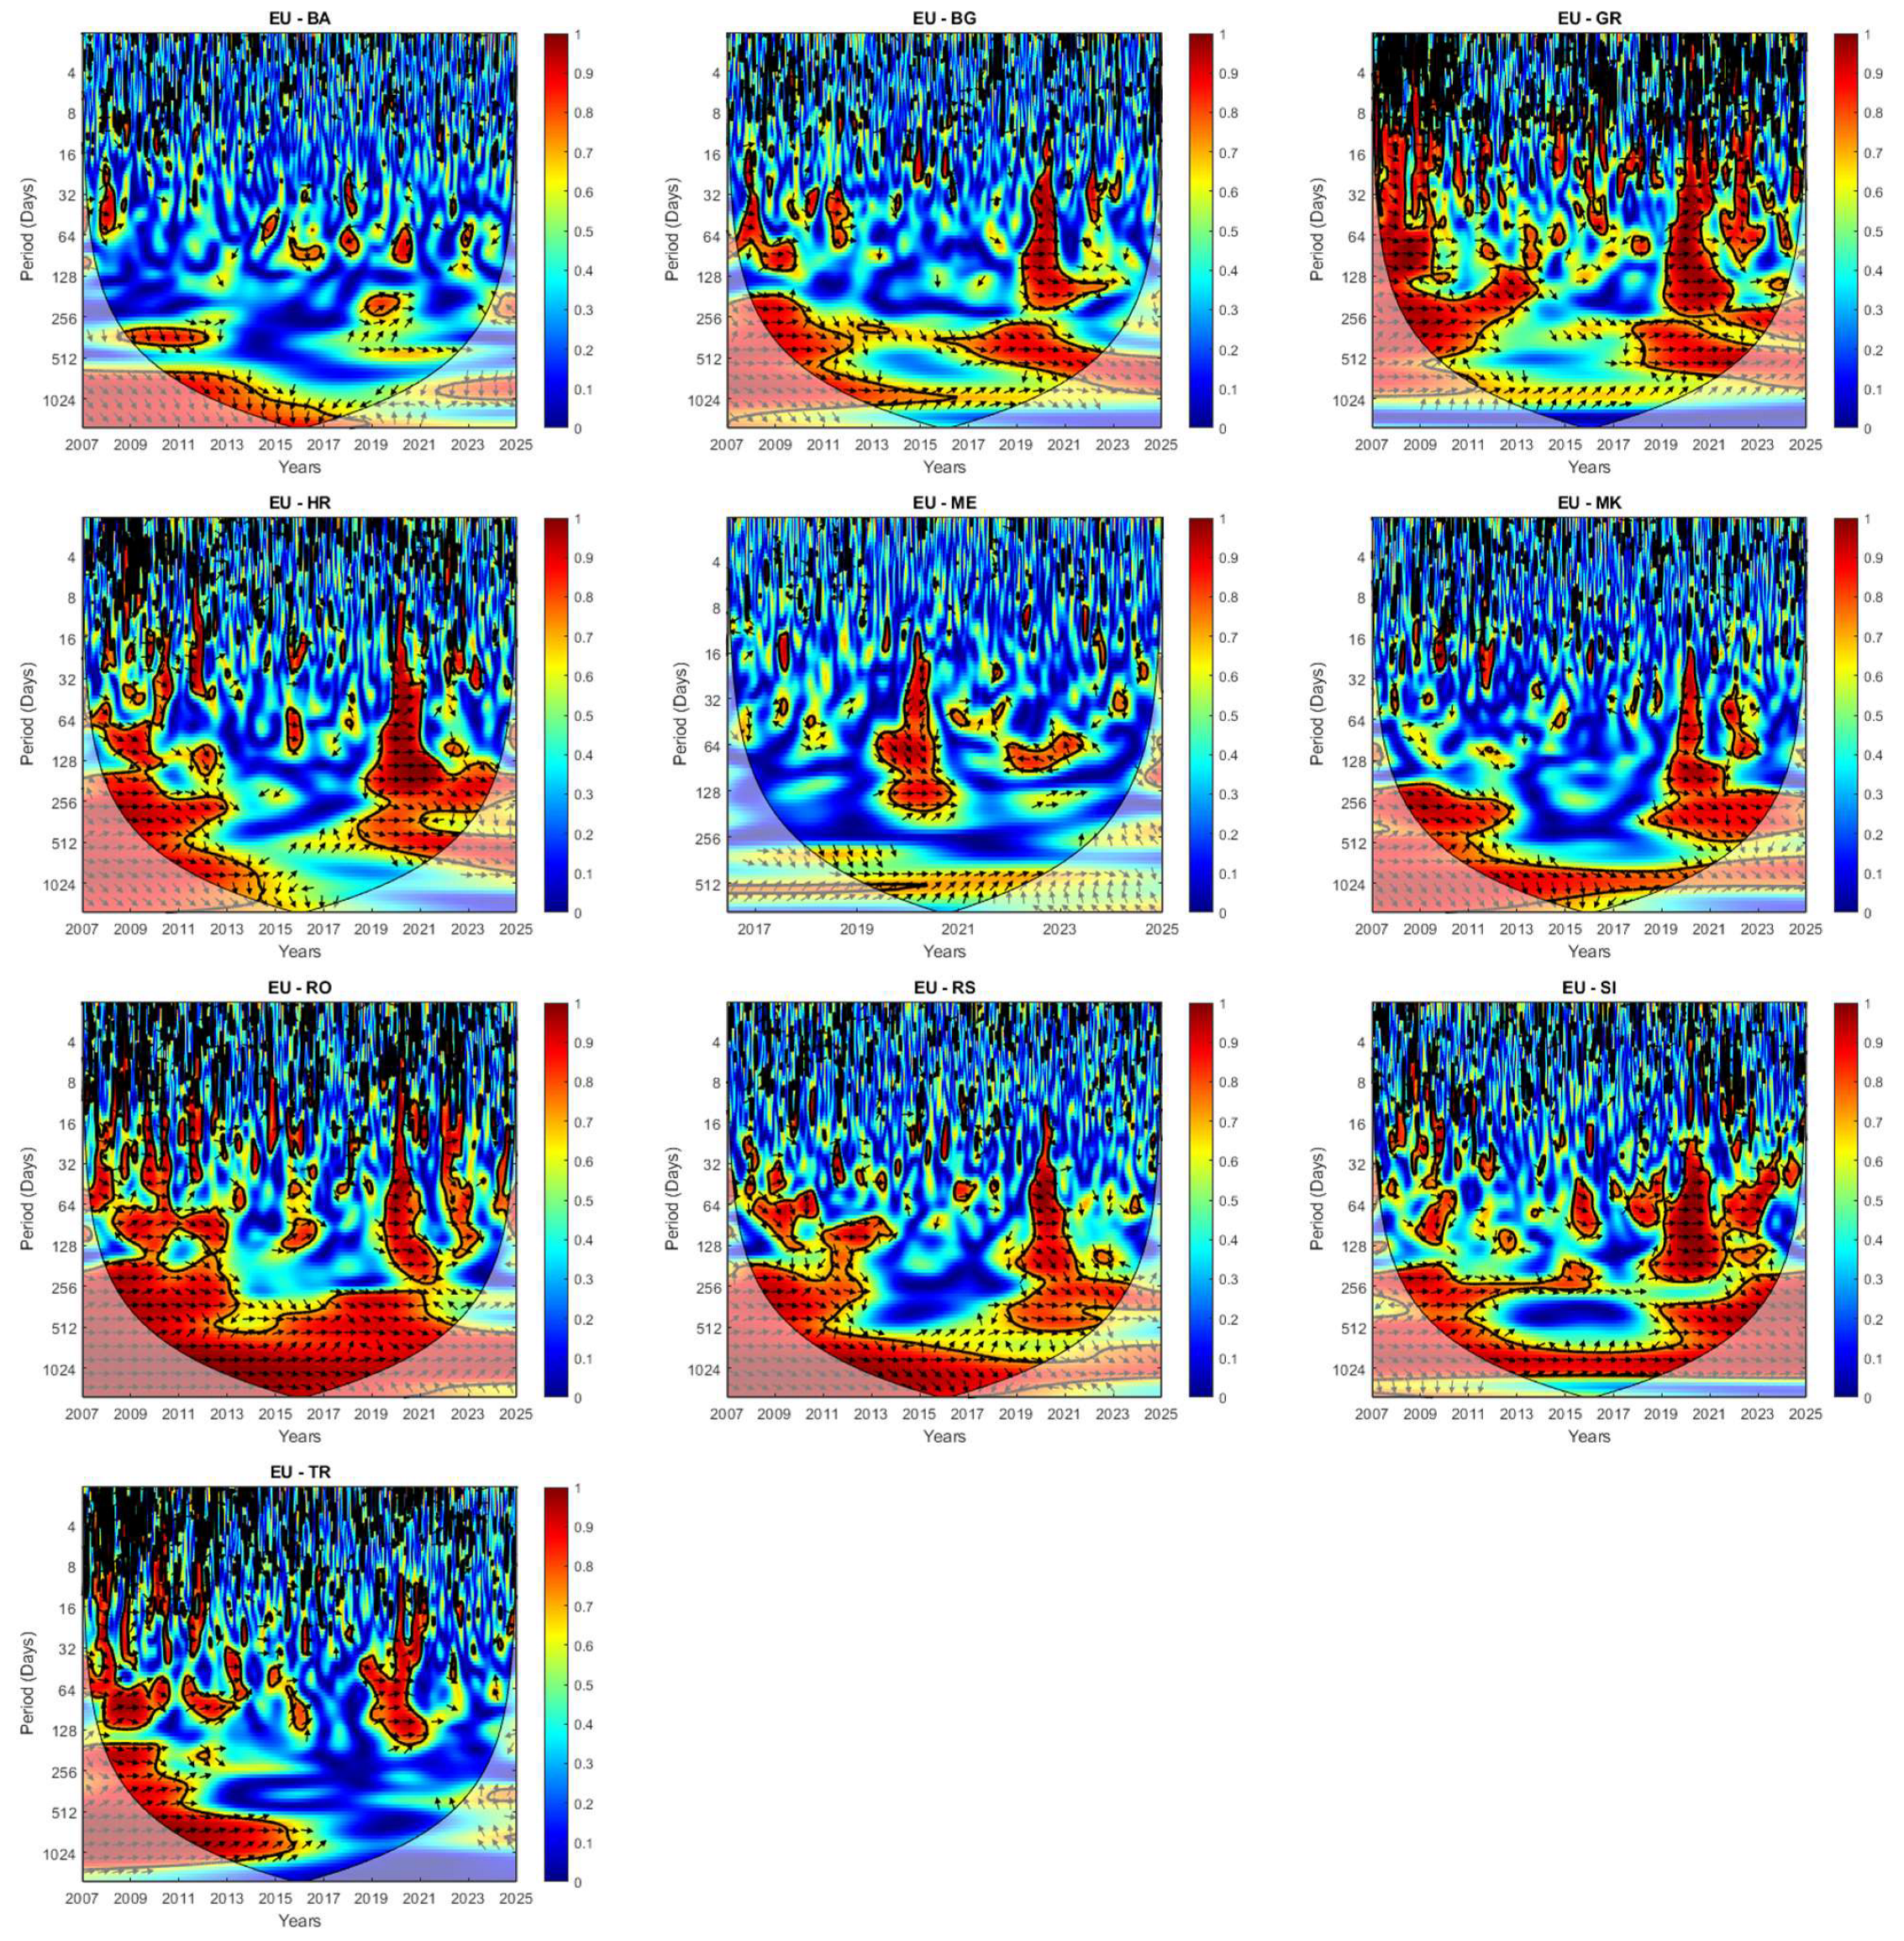
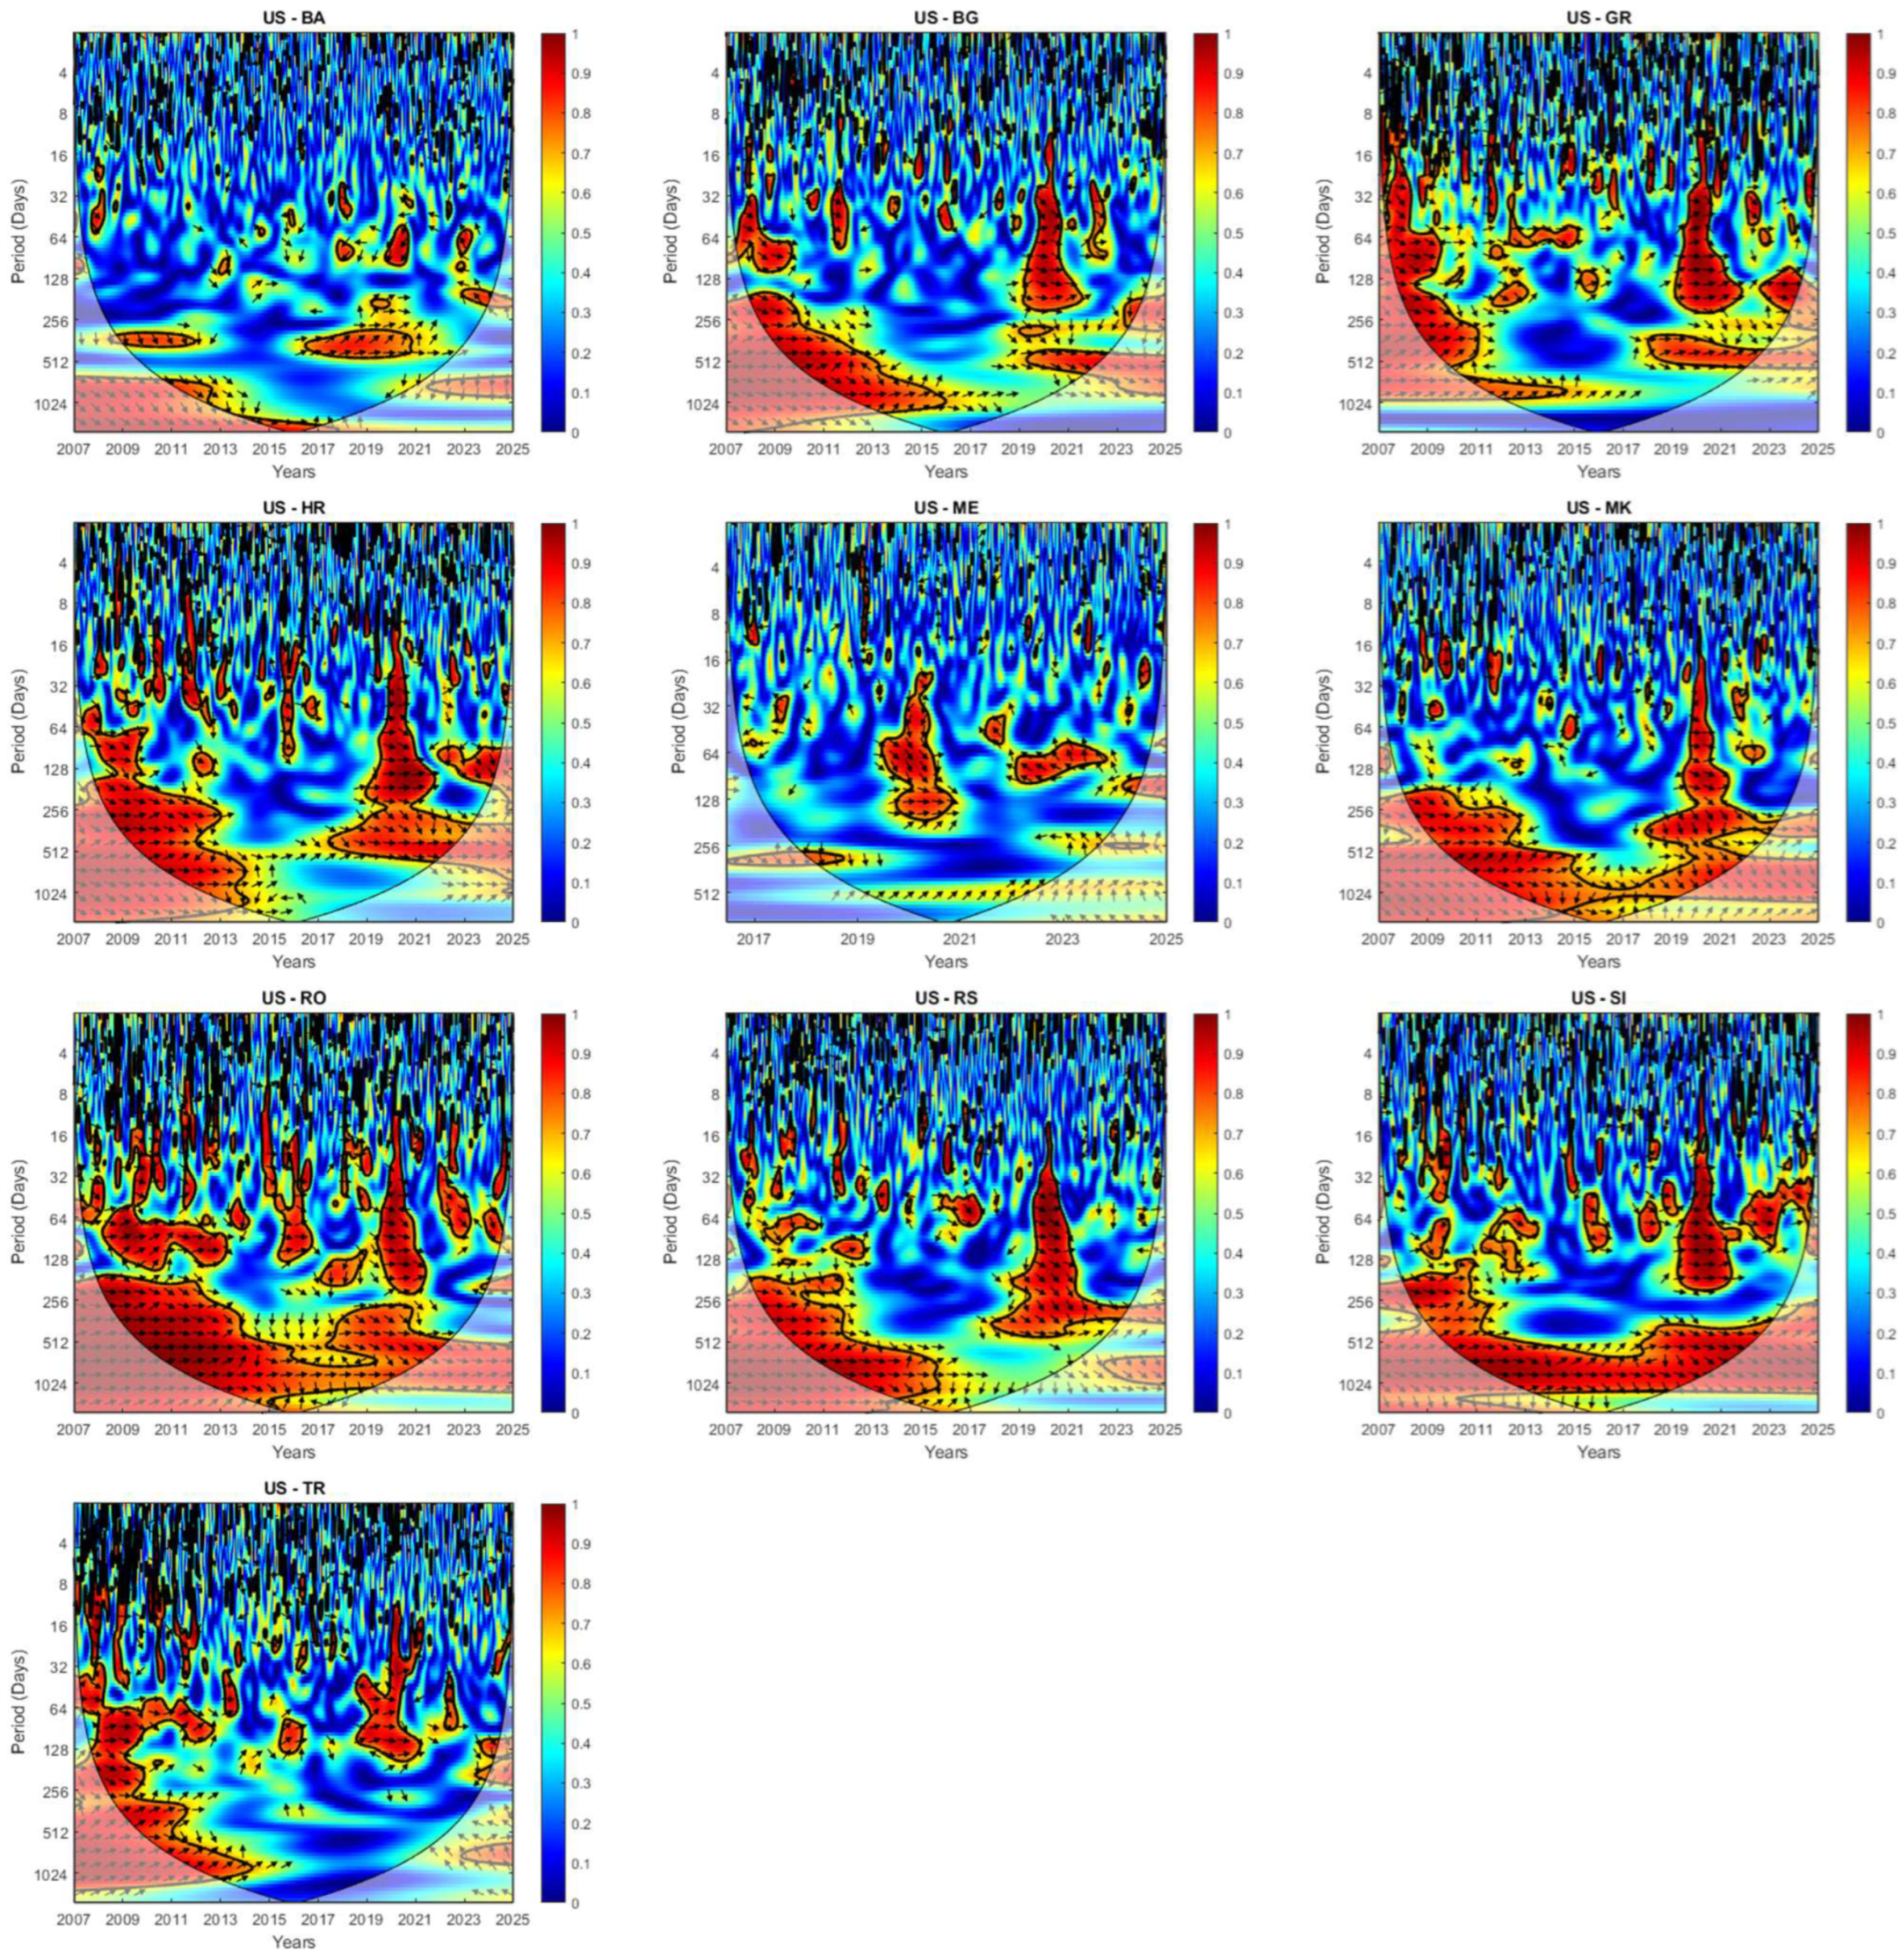
Figure 2 and
Figure 3 present the full time-frequency wavelet coherence plots.
First, co-movement between SEE markets and both international benchmarks is substantially stronger during all three crisis periods than in tranquil phases, across virtually all wavelet scales—confirming H1. Second, correlations increase consistently with scale for all market pairs: weakest at D1 (2–4 days) and strongest at D4–D6 (monthly to semi-annual). This scale-dependence reflects investor heterogeneity: high-frequency traders respond to SEE markets within days, whereas institutional investors with monthly or quarterly rebalancing horizons respond over longer periods.
Table 4 summarizes the average squared wavelet coherence at scale D4 across market groups, benchmark, and crisis episodes.
4.2. EU Member Versus Accession Markets
Consistent with H3, EU member markets show higher wavelet coherence with the StoxxEurope600 than accession markets across all three crises. At scale D4, the average R
2 during crisis periods is 0.61 for the EU member group versus 0.37 for the accession group (
Table 4). To formally test this difference, we apply a two-sample Welch
t-test on the crisis-period D4 coherence values across the two groups; the difference is statistically significant (
t = 4.83,
p < 0.01). The gap persists in tranquil periods at lower levels (0.28 versus 0.16,
t = 3.21,
p < 0.01), suggesting that EU membership generates structural baseline integration above economic linkages alone.
Within the EU member group, Greece and Romania show the highest co-movement (R2 > 0.70 during GFC), while Bulgaria and Slovenia show lower values concentrated at scales D3–D5, consistent with transmission through banking-sector linkages. Croatia’s adoption of the euro in January 2023 is associated with a discernible increase in EU–CROBEX coherence at D4–D6 (from 0.54 to 0.63), providing preliminary evidence that monetary union accelerates synchronization. Among accession markets, Turkey approaches lower-tier EU member levels; Bosnia and Montenegro show the weakest co-movement. A notable cross-crisis asymmetry is that COVID-19 generated stronger accession-market coherence than the GFC—a reversal of the EU member pattern—consistent with the pandemic’s indiscriminate global risk-off mechanism.
Among accession markets, Turkey is a clear outlier: with average D4 coherence of 0.64/0.59/0.55 with the EU across the three crises, Turkey approaches the lower-tier EU member markets. This reflects deep trade and banking integration with Europe despite the suspended accession process. Bosnia and Montenegro show the weakest co-movement: for Bosnia, statistically significant coherence with the StoxxEurope600 is detected only at D6 during the GFC (R2 = 0.21), and no significant coherence with the S&P 500 is found at any scale or crisis episode. This is consistent with SASX-10’s composition of predominantly domestically oriented firms with near-zero international institutional investor participation.
An important cross-crisis asymmetry emerges for accession markets: COVID-19 generated stronger wavelet coherence than the GFC for most accession markets, reversing the pattern observed for EU member markets. This reflects the different transmission mechanisms: the GFC propagated through the banking channel (affecting EU members more directly through parent bank exposure), while COVID-19 propagated through the global risk-off mechanism—indiscriminate withdrawal from all emerging markets, regardless of integration level. This finding suggests that liquidity-driven contagion channels can temporarily dominate all structural integration considerations during sufficiently severe global shocks.
4.3. US Versus EU Benchmark
US–SEE coherence is systematically 20–30 percentage points lower than EU–SEE coherence at scale D4 across all markets and crises (
Table 4), consistent with US contagion reaching SEE markets primarily through the European financial system rather than through direct linkages. A Welch
t-test confirms that EU–SEE and US–SEE D4 coherence values differ significantly during crisis periods (
t = 5.17,
p < 0.01).
Phase-difference analysis confirms that the US market leads SEE markets (↘ arrows at D4–D6) across all crises and all ten markets, with no observable reverse effects.
4.4. Breitung–Candelon Causality Results
Table 5 summarizes the Breitung–Candelon results. Consistent with H2, causality is predominantly unidirectional from the StoxxEurope600 to SEE markets for 8 of 10 markets. Reverse causality (SEE → EU) is significant only for Greece and Romania at scale D6 during crisis periods, and absent at D1 and D4. The US benchmark shows the same pattern: unidirectional at medium and long scales, with no significant reverse causality for any SEE market.
A key finding is the scale-dependence of causality: significant EU → SEE causality at D1 is detected only for Greece, Romania, and Turkey—markets with sufficient liquidity and international participation to reflect European benchmark movements within 2–4 trading days. For the remaining seven markets, significant causality requires at least 16–32 days (scale D4) to manifest. This implies that financial contagion from the European benchmark to most SEE markets does not operate at daily frequencies—it requires several days to be incorporated into SEE prices, reflecting lower trading volumes and delayed price discovery relative to developed markets. From a portfolio management perspective, this delay creates a window of opportunity: short-horizon positions in these markets are, at least temporarily, insulated from European benchmark shocks.
The cross-crisis comparison of causality results reveals important heterogeneity. During the GFC and COVID-19, significant causality at D1 appears within 2–4 trading days of the initial shock and dissipates within 20–40 days. During the Ukraine war, significant D1 causality is largely absent—consistent with the energy crisis propagating through slow macroeconomic channels (energy price transmission, inflation expectations, ECB policy tightening) rather than immediate financial panic. This empirical distinction between fast-transmission (GFC, COVID-19) and slow-transmission (Ukraine war) contagion supports the theoretical predictions formulated in
Section 2.4.
4.5. Structural Break Analysis
Table 6 presents the Bai–Perron structural break dates at scales D1, D3, and D6. Three findings are noteworthy. First, all ten markets show break dates clustering within 60 days of each crisis onset across all scales—confirming genuine regime shifts rather than extreme-but-continuous volatility events. Second, for the COVID-19 episode, D1 break dates precede D6 break dates by 2–3 months for all markets, reflecting the earlier response of high-frequency traders to pandemic uncertainty versus the delayed macroeconomic impact at quarterly horizons. Third, for the Ukraine war, the pattern reverses: D6 break dates precede D1 break dates by 1–2 months, consistent with the macroeconomic energy price channel (captured at D6) manifesting before acute financial market stress (captured at D1). This divergence pattern provides direct empirical evidence for the fast-versus-slow-transmission distinction.
4.6. DCC-GARCH Robustness
The DCC-GARCH(1,1) robustness check confirms the wavelet coherence findings. The Spearman rank correlation between DCC-estimated conditional correlations and wavelet correlations at scale D4, averaged across all crisis windows and market pairs, is 0.83—well above the 0.70 confirmatory threshold. The rank ordering of markets by integration level is preserved: Greece and Romania consistently show the highest correlations under both methods, while Bosnia and Montenegro show the lowest. There is one informative divergence: DCC detects brief significant correlation spikes for Bosnia and Montenegro in the first two weeks of COVID-19 (late February to mid-March 2020), invisible in wavelet D4 coherence due to the 16–32 day averaging window. This is a scale D1 phenomenon—even the most isolated SEE markets experience ultra-short-run contagion during sufficiently severe global shocks, but this contagion dissipates within days without leaving a trace at medium-to-long-run frequencies. The finding reinforces the conclusion that Bosnia and Montenegro offer genuine diversification benefits at horizons beyond two weeks.
5. Discussion
The empirical results yield several findings that advance the literature. First, the EU member/accession distinction is empirically consequential: EU membership generates approximately 15–24 percentage points of incremental wavelet coherence at monthly scales, above what trade and banking linkages alone would predict. This finding contributes to the literature of financial integration (
Bekaert et al., 2002): institutional membership, through regulatory harmonization and the deepening of common investor bases, generates measurable financial market co-movement beyond economic linkages. Turkey’s intermediate position—approaching lower-tier EU member markets in integration level despite its suspended accession process—suggests that the EU membership effect operates through two separable channels: a trade-and-banking channel (in which Turkey participates) and a regulatory–institutional channel (in which Turkey does not).
Second, the three crisis episodes generate qualitatively distinct contagion patterns. The GFC and COVID-19 produce fast-transmission contagion (D1, within days), driven by the global risk-off mechanism; the Ukraine war produces slow-transmission contagion (D5–D6, quarterly horizons), driven by macroeconomic energy price and monetary policy channels. This finding challenges the standard practice of analyzing financial contagion as a single phenomenon, suggesting instead that the appropriate analytical scale—and policy response timing—must be calibrated to the nature of the shock. It also reconciles two apparently contradictory strands in the SEE literature: studies using high-frequency data tend to find low correlations, while studies using monthly or quarterly data find stronger integration. Both conclusions are correct—they capture different points in the scale spectrum.
Third, the consistent unidirectionality of causality from European and US benchmarks to SEE markets—with reverse causality absent for 8 of 10 markets—is consistent with the core–periphery model of international financial integration. SEE market price signals cannot be observed by core market participants at the time horizons at which contagion operates, given the structural constraints of low trading volumes and limited international market-maker participation. The bidirectional causality detected for Greece and Romania at scale D6 is more plausibly interpreted as common factor loading (both markets responding to the same low-frequency macroeconomic factors) than as genuine bilateral information transmission.
Compared to
Polanco-Martínez et al. (
2018)—the methodologically closest study—our results confirm their finding that crisis-period correlations are stronger than pre-crisis correlations, but partially diverge on the Greek market: we find Greece remains strongly co-integrated with the European benchmark throughout the GFC, without evidence of distancing at long scales. This divergence is likely explained by the different benchmark choice: Polanco-Martínez et al. use the S&P Europe 350 (large-cap, core-European), while we use the StoxxEurope600 (broader, including smaller markets structurally closer to SEE). Compared to
Kiviaho et al. (
2014), our results confirm stronger synchronization at lower frequencies and during the GFC, and extend this finding to COVID-19 and the Ukraine war—showing the pattern is robust across structurally different crises.
6. Conclusions
This study provides a unified multi-scale analysis of financial contagion between ten SEE stock markets and two international benchmarks over 2007–2025, covering three structurally distinct crisis episodes. We draw five principal conclusions.
First, crisis-contingent contagion is confirmed as the dominant transmission mechanism: crisis periods generate stronger wavelet co-movement at medium-to-long scales for all market pairs, supporting H1. Second, the three crises show qualitatively distinct patterns—fast-transmission (D1–D2, within days) for the GFC and COVID-19, driven by the global risk-off mechanism, versus slow-transmission (D5–D6, quarterly horizons) for the Ukraine war, driven by macroeconomic energy price channels. Third, EU membership generates measurable incremental integration: EU member markets show 15–24 percentage points higher coherence at D4 than accession markets, a difference confirmed by formal statistical testing (Welch t-test, p < 0.01), supporting H3. Fourth, causality is predominantly unidirectional from both benchmarks to SEE markets, with SEE markets acting as net contagion receivers across all scales (H2 supported); the bidirectional causality for Greece and Romania at D6 likely reflects common factor loading rather than genuine bilateral transmission. Fifth, SEE markets offer meaningful short-horizon diversification (D1–D2) that erodes progressively at monthly and longer horizons.
The practical implications are the following. For portfolio managers, SEE allocations should be treated as short-horizon tactical positions; diversification benefits concentrate at D1–D2 and erode progressively toward zero at D4–D6. For macroprudential regulators, optimal policy response protocols should be calibrated to the crisis type: rapid circuit-breaker mechanisms for financial panic shocks (GFC, COVID-19); medium-term credit and liquidity buffers for macroeconomic channel shocks (Ukraine war). For policymakers in EU accession countries, the finding that regulatory convergence generates measurable integration benefits—even without formal EU membership (Turkey’s case)—provides empirical support for prioritizing financial market regulatory alignment as part of the accession strategy.
Three limitations point toward productive directions for future research. First, the study relies on index-level data; future research using sector-level or company-level data would allow disentanglement of sector-specific from index-level contagion dynamics. Second, the Breitung–Candelon test identifies Granger predictability rather than structural causality; structural VAR or external instrument approaches could provide cleaner causal estimates. Third, Croatia’s 2023 eurozone accession provides a natural experiment for testing the effect of monetary union on SEE market integration, but the current post-accession window (33 months) is insufficient for robust long-run inference—future research with an extended sample will be valuable.
Author Contributions
Conceptualization, A.R., D.-N.C. and D.L.; Methodology, A.R., D.-N.C. and D.L.; Software, A.R., D.-N.C. and D.L.; Validation, A.R., D.-N.C. and D.L.; Formal Analysis, A.R., D.-N.C. and D.L.; Investigation, A.R., D.-N.C. and D.L.; Resources, A.R., D.-N.C. and D.L.; Data Curation, A.R., D.-N.C. and D.L.; Writing—Original Draft Preparation, A.R., D.-N.C. and D.L.; Writing—Review and Editing, A.R., D.-N.C. and D.L.; Visualization, A.R., D.-N.C. and D.L.; Supervision, A.R., D.-N.C. and D.L.; Project Administration, A.R., D.-N.C. and D.L.; Funding Acquisition, A.R., D.-N.C. and D.L. All authors have read and agreed to the published version of the manuscript.
Funding
This research received no external funding.
Institutional Review Board Statement
Not applicable.
Informed Consent Statement
Not applicable.
Data Availability Statement
The data is downloaded from Thomson Reuters Eikon—November 2025. Available upon request.
Acknowledgments
In the preparation of this manuscript, the authors used AI-assisted tools, specifically large language model assistants, for language editing and proofreading of draft text. All empirical analyses, interpretations, conclusions, and scientific content were performed and verified by the authors. The authors take full responsibility for the integrity and accuracy of the work as published.
Conflicts of Interest
The authors declare no conflict of interest.
References
- Albulescu, C. T., Goyeau, D., & Tiwari, A. K. (2017). Co-movements and contagion between international stock index futures markets. Empirical Economics, 52(4), 1529–1568. [Google Scholar] [CrossRef]
- Aloui, C., & Nguyen, D. K. (2014). On the detection of extreme movements and persistent behaviour in Mediterranean stock markets: A wavelet-based approach. Applied Economics, 46(22), 2611–2622. [Google Scholar] [CrossRef]
- Bai, J., & Perron, P. (1998). Estimating and testing linear models with multiple structural changes. Econometrica, 66(1), 47–78. [Google Scholar] [CrossRef]
- Bai, J., & Perron, P. (2003). Computation and analysis of multiple structural change models. Journal of Applied Econometrics, 18(1), 1–22. [Google Scholar] [CrossRef]
- Basdekis, C., Christopoulos, A., Katsampoxakis, I., & Nastas, V. (2022). The impact of the Ukrainian war on stock and energy markets: A wavelet coherence analysis. Energies, 15(21), 8174. [Google Scholar] [CrossRef]
- Bekaert, G., Harvey, C. R., & Lumsdaine, R. L. (2002). Dating the integration of world equity markets. Journal of Financial Economics, 65(2), 203–247. [Google Scholar] [CrossRef]
- Breitung, J., & Candelon, B. (2006). Testing for short- and long-run causality: A frequency-domain approach. Journal of Econometrics, 132(2), 363–378. [Google Scholar] [CrossRef]
- Dajcman, S., Festic, M., & Kavkler, A. (2012). Co-movement dynamics between Central and Eastern European and developed European stock markets during European integration and amid financial crises—A wavelet analysis. Engineering Economics, 23(1), 22–32. [Google Scholar] [CrossRef]
- Dajčman, S., & Kavkler, A. (2011). A comparative DCC-GARCH and rolling wavelet correlation analysis of interdependence between the Slovenian and European stock markets. Economic Computation & Economic Cybernetics Studies & Research, 45(4). Available online: https://ecocyb.ase.ro/nr4%20eng/Alenka%20Kavkler,%20Silvo%20Dajcman.pdf (accessed on 5 July 2026).
- Dima, B., Dima, Ş. M., & Barna, F. (2015). A wavelet analysis of capital markets’ integration in Latin America. Applied Economics, 47(10), 1019–1036. [Google Scholar] [CrossRef]
- Dornbusch, R., Park, Y. C., & Claessens, S. (2000). Contagion: Understanding how it spreads. World Bank Research Observer, 15(2), 177–197. [Google Scholar] [CrossRef]
- Engle, R. (2002). Dynamic conditional correlation: A simple class of multivariate generalized autoregressive conditional heteroskedasticity models. Journal of Business & Economic Statistics, 20(3), 339–350. [Google Scholar] [CrossRef]
- Forbes, K. J., & Rigobon, R. (2002). No contagion, only interdependence: Measuring stock market comovements. Journal of Finance, 57(5), 2223–2261. [Google Scholar] [CrossRef]
- Grbić, M. (2021). Stock market development and economic growth: The case of the Republic of Serbia. Post-Communist Economies, 33(4), 484–499. [Google Scholar] [CrossRef]
- Grinsted, A., Moore, J. C., & Jevrejeva, S. (2004). Application of the cross wavelet transform and wavelet coherence to geophysical time series. Nonlinear Processes in Geophysics, 11(5/6), 561–566. [Google Scholar] [CrossRef]
- Guidi, F., & Ugur, M. (2014). An analysis of South-Eastern European stock markets: Evidence on cointegration and portfolio diversification benefits. Journal of International Financial Markets, Institutions and Money, 30, 119–136. [Google Scholar] [CrossRef]
- Horvath, R., & Petrovski, D. (2013). International stock market integration: Central and South Eastern Europe compared. Economic Systems, 37(1), 81–91. [Google Scholar] [CrossRef]
- Ibrahim, I., Kamaludin, K., & Sundarasen, S. (2020). COVID-19, government response, and market volatility: Evidence from the Asia-Pacific developed and developing markets. Economies, 8(4), 105. [Google Scholar] [CrossRef]
- Kaminsky, G., Reinhart, C., & Végh, C. (2003). The unholy trinity of financial contagion. Journal of Economic Perspectives, 17(4), 51–74. [Google Scholar] [CrossRef]
- Katsampoxakis, I., Xanthopoulos, S., Basdekis, C., & Christopoulos, A. G. (2024). Can ESG stocks be a safe haven during global crises? Evidence from the COVID-19 pandemic and the Russia-Ukraine war with time-frequency wavelet analysis. Economies, 12(4), 89. [Google Scholar] [CrossRef]
- Kiviaho, J., Nikkinen, J., Piljak, V., & Rothovius, T. (2014). The co-movement dynamics of European frontier stock markets. European Financial Management, 20(3), 574–595. [Google Scholar] [CrossRef]
- Longstaff, F. A. (2010). The subprime credit crisis and contagion in financial markets. Journal of Financial Economics, 97(3), 436–450. [Google Scholar] [CrossRef]
- Moagăr-Poladian, S., Clichici, D., & Stanciu, C. V. (2019). The comovement of exchange rates and stock markets in Central and Eastern Europe. Sustainability, 11(14), 3985. [Google Scholar] [CrossRef]
- Naeem, M. A., Qureshi, F., Farid, S., Tiwari, A. K., & Elheddad, M. (2024). Time-frequency information transmission among financial markets: Evidence from implied volatility. Annals of Operations Research, 334(1), 701–729. [Google Scholar] [CrossRef]
- Percival, D. B., & Walden, A. T. (2000). Wavelet methods for time series analysis. Cambridge University Press. [Google Scholar]
- Polanco-Martínez, J. M., Fernández-Macho, J., Neumann, M. B., & Faria, S. H. (2018). A pre-crisis vs. crisis analysis of peripheral EU stock markets by means of wavelet transform and a nonlinear causality test. Physica A: Statistical Mechanics and Its Applications, 490, 1211–1227. [Google Scholar] [CrossRef]
- Ramsey, J. B., & Lampart, C. (1998). Decomposition of economic relationships by timescale using wavelets. Macroeconomic Dynamics, 2(1), 49–71. [Google Scholar] [CrossRef]
- Rua, A., & Nunes, L. C. (2009). International comovement of stock market returns: A wavelet analysis. Journal of Empirical Finance, 16(4), 632–639. [Google Scholar] [CrossRef]
- Sarvan, D., Stratimirović, D., Blesić, S., & Miljković, V. (2014). Scaling analysis of time series of daily prices from stock markets of transitional economies in the Western Balkans. The European Physical Journal B, 87(12), 297. [Google Scholar] [CrossRef]
- Shahzad, S. J. H., Kumar, R. R., Ali, S., & Ameer, S. (2016). Interdependence between Greece and other European stock markets: A comparison of wavelet and VMD copula, and the portfolio implications. Physica A: Statistical Mechanics and Its Applications, 457, 8–33. [Google Scholar] [CrossRef]
- Stratimirović, D., Sarvan, D., Miljković, V., & Blesić, S. (2018). Analysis of cyclical behavior in time series of stock market returns. Communications in Nonlinear Science and Numerical Simulation, 54, 21–33. [Google Scholar] [CrossRef]
- Škrinjarić, T. (2020). Stock market stability on selected CEE and SEE markets: A quantile regression approach. Post-Communist Economies, 32(3), 352–375. [Google Scholar] [CrossRef]
- Tilfani, O., Ferreira, P., & El Boukfaoui, M. Y. (2020). Revisiting stock market integration in Central and Eastern European stock markets with a dynamic analysis. Post-Communist Economies, 32(5), 643–674. [Google Scholar] [CrossRef]
- Torrence, C., & Compo, G. P. (1998). A practical guide to wavelet analysis. Bulletin of the American Meteorological Society, 79(1), 61–78. [Google Scholar] [CrossRef]
- Vlah Jerić, S. (2023). Time interval choices in forecasting stock market indices of CEE and SEE countries. Post-Communist Economies, 35(4), 403–413. [Google Scholar] [CrossRef]
- Zaheer, K., Aslam, F., Mohmand, Y. T., & Ferreira, P. (2024). On the dynamic changes in the Global Stock Markets’ network during the Russia–Ukraine war. Economies, 12(2), 41. [Google Scholar] [CrossRef]
- Zonon, B. I. P., Bouraima, M. B., Chen, C., & Dumor, K. (2025). The Impact of COVID-19 on Global Stock Markets: Comparative insights from developed, developing, and regionally integrated markets. Economies, 13(2), 39. [Google Scholar] [CrossRef]
- Živkov, D., Njegić, J., & Pecanac, M. (2019). Wavelet analysis of the interdependence between stocks and bonds in selected Eastern European and Eurasian emerging markets. Ekonomický Časopis, 67(2), 175–194. [Google Scholar]
| Disclaimer/Publisher’s Note: The statements, opinions and data contained in all publications are solely those of the individual author(s) and contributor(s) and not of MDPI and/or the editor(s). MDPI and/or the editor(s) disclaim responsibility for any injury to people or property resulting from any ideas, methods, instructions or products referred to in the content. |