1. Introduction
Private investment is widely recognized as a key driver of post-conflict recovery due to its potential role in reconstructing infrastructure, promoting employment, productivity and structural transformation. However, existing research provides limited evidence on how specific fiscal policy instruments, such as taxes, domestic versus external borrowing, and capital versus recurrent spending, affect domestic and foreign private investment in post-conflict economies. Rwanda, characterized by constrained fiscal space, shallow credit markets, and evolving institutions, offers a particularly relevant yet unexplored context to examine these dynamics. Understanding the interplay between fiscal composition and institutional quality is critical for designing policies that effectively stimulate private sector-led recovery and development in post-conflict settings.
Fiscal policy is a key tool in this process, influencing macroeconomic stability and shaping the environments in which private sectors operate. However, the effects of fiscal instruments on private investment are particularly complex in post-conflict contexts. Understanding the relationship between fiscal composition and institutional quality is therefore critical for the formulation of policies that effectively catalyze private sector-driven recovery, and foster growth and economic transformation.
Three theoretical perspectives offer complementary insights into the nexus between fiscal policy and private investment. Keynesian theory predicts that expansionary fiscal policy can crowd in private investment in economies with underutilized capacity by stimulating aggregate demand and investor confidence. Rwanda’s post-genocide economy, with widespread infrastructure gaps and low capacity utilization, suggests that well-targeted public spending, especially in infrastructure, education, and healthcare, could enhance private investment by lowering production costs and creating complementary opportunities (
World Bank, 2022). Empirical evidence from African contexts supports this view: in Ethiopia and Nigeria, capital and recurrent expenditure have been shown to stimulate private investment, whereas certain tax reforms may initially reduce investment before yielding positive long-term effects (
Bedhiye & Singh, 2022;
Idowu et al., 2020;
Shobande & Olunkwa, 2020).
In contrast, neoclassical theory emphasizes that fiscal expansion, particularly when financed domestically, can raise interest rates and crowd out private investment. Rwanda’s shallow financial markets and significant financing needs are potential sources of public–private sector competition for scarce resources. This may create conditions for potential crowding-out effects of public domestic borrowing. Empirical studies corroborate this: in Nigeria, domestic borrowing exhibits positive short-term effects on private investment but may have negative long-term effects, whereas increases in external debt tend to suppress foreign investment (
Babalola & Onikosi-Alliyu, 2020;
Yusuf & Mohd, 2021). Similarly, in Rwanda,
Theoneste and Mulyungi (
2018) find that government spending may negatively affect private investment, whereas tax revenue and public borrowing positively influence it, highlighting the importance of fiscal composition and financing sources.
Ricardian Equivalence, which posits fiscal neutrality, is less applicable in Rwanda, given that the assumptions of perfect capital markets and rational foresight are rarely met. Credit constraints, imperfect competition, and institutional fragility undermine the predictive power of this framework (
International Monetary Fund, 2023). Consequently, theory alone cannot fully explain Rwanda’s private investment dynamics. Therefore, empirical analysis that disaggregates fiscal instruments is essential.
Institutional quality further mediates the effects of fiscal policy outcomes. Credible and effective institutions reduce uncertainty, enforce property rights, and ensure regulatory transparency, thereby enhancing investor confidence. In Rwanda, reforms led by the Rwanda Development Board (RDB) to streamline business registration, facilitate investment approvals, and strengthen oversight have coincided with increased FDI inflows and improvements in World Bank Doing Business indicators (
World Bank, 2022;
International Monetary Fund, 2023). Empirical evidence from Sub-Saharan Africa (SSA) confirms that institutional credibility amplifies the private sector’s responsiveness to fiscal intervention (
Kaharudin & Ab-Rahman, 2022;
Sawadogo, 2024). These findings suggest that the effectiveness of fiscal instruments depends not only on their composition but also on the institutional environment.
Despite these theoretical and empirical insights, significant gaps remain. First, post-conflict economies like Rwanda are unexplored, particularly those undergoing rapid institutional and macroeconomic reforms under constrained fiscal space. Thus, evidence from relatively stable contexts may not fully apply (
Collier, 2009). Second, most studies aggregate fiscal policy or rely on cross-country panels, obscuring the differentiated effects of specific instruments, such as domestic versus external borrowing, capital versus recurrent spending, or direct versus indirect taxes, on domestic and foreign private investment. Third, the mediating role of institutional quality in shaping fiscal policy outcomes remains insufficiently examined in post-conflict settings.
Addressing these gaps, this study analytically integrates theory and empirical evidence to explore how different fiscal components affect domestic and foreign private investment in Rwanda’s post-conflict economy. Further, the study assesses the extent to which institutional quality mediates the relationship between fiscal policy and private investment.
Using a country-specific Vector Error Correction Model (VECM), the study captures both short- and long-term associations, distinguishing domestic and foreign investment responses to different fiscal instruments while accounting for Rwanda’s post-conflict institutional and fiscal contexts. By linking theory, empirical findings, and Rwanda’s unique context, the study seeks to determine whether fiscal composition and institutional embedding matter as much as the scale of fiscal intervention in shaping private investment outcomes in a post-conflict country.
By achieving the above, this study contributes to the literature on fiscal policy and investment by disaggregating fiscal instruments to assess their differentiated effects on private investment in a post-conflict economy. As discussed above, existing evidence increasingly suggests that investment responses depend on the composition of fiscal instruments, the structure of public financing, institutional quality and prevailing macroeconomic conditions. However, these dimensions are rarely examined jointly, particularly in low-income and post-conflict economies where fiscal policy simultaneously supports reconstructions, institutional building, and private sector development. By focusing on Rwanda, which since 1994 has combined extensive public investment, institutional reforms, and diverse financing strategies, the study offers a distinctive case for understanding how different fiscal instruments affect private investment in a post-conflict setting. This nuanced perspective enriches debates on fiscal policy effectiveness in low-income, post-conflict economies and highlights the differentiated pathways through which fiscal composition and sources influence private-sector development.
The remainder of the paper is structured as follows:
Section 2 presents the related literature review,
Section 3 describes the data and methodology,
Section 4 presents empirical findings and discussion, and
Section 5 concludes with policy recommendations.
2. Literature Review
The relationship between fiscal policy and private investment remains one of the most debated issues in development. While the crowding-in hypothesis suggests that government interventions can stimulate private investment through improved infrastructure, enhanced productivity and reduced transaction costs, the crowding-out hypothesis argues that taxation and public borrowing may discourage private investment by reducing profitability and competing for scarce financial resources. Empirical evidence from developing economies reflects this theoretical divide. For example,
Bedhiye and Singh (
2022) find that fiscal policy significantly influences private investment in Ethiopia, although the effects vary across fiscal instruments. Similarly,
Mbaleki (
2024) reports that fiscal expenditure generates positive multiplier effects in South Africa, suggesting that public spending can support private investment activity under favorable macroeconomic conditions. These results reinforce the argument that fiscal policy constitutes a pivotal instrument for mitigating market failures and alleviating structural impediments that frequently constrain private investment in low-income economies.
However, the literature also provides substantial evidence supporting crowding-out effects.
Islam and Nguyen (
2024) show that public debt may reduce private investment in developing economies where government compete directly with private firms for limited financial resources. Likewise,
Furceri and Sousa (
2011) demonstrate that fiscal policy shocks generate heterogeneous investment responses depending on prevailing economic conditions. These findings suggest that fiscal policy does not exert a uniform effect on private investment and that investment outcomes depend on the specific channels through which fiscal interventions affect the economy.
Recent studies increasingly attribute these divergent findings to differences in fiscal composition, financing structures, institutional quality, and broader macroeconomic conditions.
Francois et al. (
2024) show that public investment can crowd in private investment when it alleviates infrastructure bottlenecks and enhances productivity, while
Bojanic (
2015) argues that the effectiveness of public expenditure depends largely on how resources are allocated across sectors. Similarly,
Wilson (
2016) demonstrates that different fiscal instruments generate different investment responses, whereas
Park and Meng (
2024) emphasize the importance of institutional and financial conditions in shaping fiscal policy outcomes. Collectively, these studies suggest that understanding the fiscal policy and investment nexus requires moving beyond aggregate fiscal indicators to examine the composition of taxation, expenditure, and debt.
Beyond fiscal composition, financing structures and institutional quality play a critical role in shaping the impact of fiscal policy on private investment. Evidence from Sub-Saharan Africa indicates that the nature of financing sources significantly influences the effectiveness of public investment and its spillover effects on private sector activity (
Drama, 2025). Similarly,
Ndungu and Muriu (
2017) show that stronger institutions enhance domestic private investment by improving policy credibility, resource allocation, and investor confidence. Collectively, these findings indicate that the effectiveness of fiscal policy depends not only on the scale of fiscal interventions but also on the modalities of financing and the institutional contexts within which they are implemented.
The conflicting findings reported in the literature therefore do not necessarily indicate inconsistency; rather, they reflect differences in institutional environments, financing strictures, fiscal composition and macroeconomic conditions across countries. As a result, fiscal policies that crowd in private investment in one setting may generate crowding-out effects in another. Moreover, much of the existing literature relies on aggregate fiscal indicators, potentially masking the distinct effects of individual tax categories, expenditure components, and debt financing sources and composition. These limitations are particularly important in post-conflict economies, where fiscal policy plays a central role in the process of reconstruction and economic transformation.
The importance of these factors becomes particularly evident in post-conflict and low-income countries. Such countries often face severe infrastructure deficits, limited domestic savings, underdeveloped financial systems and substantial reconstructions needs, prompting governments to play a more active role in economic development. Under these conditions, public investment may crowd in private investment by addressing structural constraints and restoring investor confidence. At the same time, reliance on domestic borrowing may crowd out private investment by diverting scarce financial resources away from productive private sector activities. Consequently, the relationship between fiscal policy and private investment in post-conflict settings remains fundamentally context-specific. Rwanda provides a particular informative case because its post-1994 development strategy has combined extensive public investment, significant institutional reforms, and the use of both domestic and external financing to support economic transformation and private sector-led growth.
This study examines the effects of disaggregated taxation, expenditure, and debt variables on private investment in post-conflict Rwanda while explicitly accounting for institutional quality, monetary conditions, macroeconomic fundamentals, and external sector influences. Unlike previous studies that rely primarily on aggregate fiscal indictors, the analysis distinguishes among tax categories, expenditure components, and debt financing sources, thereby enabling a more nuanced assessment of the channels through which fiscal policy affects private investment. The study further incorporates key control variables, including credit conditions, inflation, exchange rate, trade openness, and economic growth, to isolate fiscal effects from broader macroeconomic and external influences. By employing a Vector Error Correction Model (VECM), the analysis captures both short-run adjustments and long-run equilibrium relationships, providing new evidence on how fiscal composition, financing structure, institutional quality, and macroeconomic conditions jointly shape crowding-in or -out effects in a low-income post-conflict economy.
3. Material and Method
3.1. Nature and Sources of Data
The study employs quarterly macroeconomic data spanning 1996 Q1–2024 Q4, a period that captures Rwanda’s transition from post-conflict recovery to sustained economic growth. The dataset comprises indicators of private investment, disaggregated fiscal policy variables (taxation, expenditure, and debt components), a measure of institutional quality, and key macroeconomic controls. Data were sourced from the Ministry of Finance and Economic Planning (MINECOFIN), the National Bank of Rwanda (BNR), and the World Bank’s World Development Indicators (WDIs). All nominal variables were converted into real terms using appropriate deflators to ensure comparability over time.
Because some variables were only available at annual frequency, temporal disaggregation was applied using a quadratic match sum interpolation procedure to generate frequency-consistent quarterly series. The procedure was applied only to selected non-fiscal variables available exclusively at annual frequency, particularly government effectiveness. Fiscal policy variables, including tax revenues, government expenditure, and public debt indicators were obtained directly at quarterly frequency from official sources and therefore required no interpolation. The interpolation approach is more suitable for variables that evolve relatively gradually over time, particularly institutional indicators such as government effectiveness and trade openness. For variables such as trade openness, quarterly movements may be influenced by external shocks, exchange rate fluctuations and trade cycles that cannot be fully captured through temporal disaggregation. Consequently, such interpolated series should be interpreted as an approximation of underlying quarterly trends rather than exact measures of intra-year variations. Given that the study primarily focuses on long-run equilibrium relationships and adjustment dynamics within a VECM framework, the interpolated variables are intended to capture medium- and long-term structural movements rather than short-term seasonal fluctuations.
Institutional quality is treated as an endogenous variable within the empirical system to reflect its dual role. First, it mediates the transmission of fiscal policy by influencing credibility, efficiency, and investor confidence. Second, it may itself respond to economic performance, capturing potential feedback effects between governance and investment dynamics. The following
Table 1 provides details of the data used in this study.
BNR stands for National Bank of Rwanda; MINECOFIN stands for Ministry of Finance and Economic Planning; WDI stands World Bank World Development Indicator; and WBI stands for World Bank Indicator.
The selection of variables is grounded in both theoretical and empirical considerations. Disaggregated expenditure components (capital and recurrent) capture potential crowding-in effects through productivity-enhancing public investment, while debt variables (domestic and external) reflect possible crowding-out channels via financial market pressures and debt overhang. Tax variables account for distortionary effects on investment incentives as well as revenue mobilization capacity. Institutional quality captures the governance channel through which fiscal policy effectiveness is conditioned. Macroeconomic control variables, including domestic credit to the private sector, exchange rate, inflation, trade openness, GDP growth, and lending interest rates, are incorporated to account for broader investment conditions and to reduce omitted variable bias in the estimation.
3.1.1. Long-Run Model Specification
The empirical analysis is guided by a long-run relationship in which private investment depends on fiscal policy composition, institutional quality, and macroeconomic conditions:
where
represents private investment (proxied alternatively by private gross fixed capital formation (PGFCF), total domestic private investment (TDPI), and Foreign Direct Investment (FDI); Total Tax Revenue
, Total Government Expenditure (
, and Total Public Debt (
capture government effectiveness; while
is a vector of macroeconomic control variables, including domestic credit, exchange rate, inflation, trade openness, GDP growth, and lending interest rates.
is the error term.
This long-run relationship is estimated within a reduced-form multivariate framework, which allows the data to reveal dynamic interactions without imposing strong a priori structural restrictions. Such an approach is particularly appropriate in post-conflict environments like Rwanda, where institutions and economic structures are evolving, and theoretical restrictions may not hold consistently over time.
The cointegrating vector is normalized on private investment, enabling the long-run equilibrium relationship to be interpreted as a function of fiscal policy variables, institutional quality, and macroeconomic conditions. This normalization aligns with the study’s objective of assessing how the composition and financing of fiscal policy influence private investment outcomes. The specification reflects the central hypothesis that fiscal policy effects are instrument-specific, vary by financing source, and are conditioned by institutional quality and macroeconomic stability. To capture both long-run equilibrium relationships and short-run adjustments, the model is embedded within a VECM framework, which is well-suited for analyzing co-integrated time series systems with potential feedback effects among variables.
3.1.2. VECM Framework
Given the non-stationary nature of macroeconomic time series data and the likelihood of long-run equilibrium relationships, the long-run relationship in Equation (1) is reformulated into the Vector Error Correction Model (VECM) representation, which allows the empirical framework to capture both the long-run equilibrium and the short-run dynamics. Therefore, the study employs a VECM, derived from a Vector Autoregressive (VAR) framework:
where
is a vector of endogenous variables, π represents the long-run relationship matrix, and
captures short-run dynamics. The matrix π can be decomposed as π = αβ′, where β′
represents the long-run equilibrium relationship, and α contains the speed of adjustment coefficients. Within this framework, the adjustment coefficients associated with private investment indicate how quickly investment responds to disequilibria arising from fiscal shocks, institutional changes, or macroeconomic imbalances. A statistically significant adjustment term implies that private investment is endogenous to the long-run fiscal–institutional equilibrium and adjusts over time to restore balance.
The VECM specification is particularly appropriate in this study because it allows for: (i) the simultaneous modeling of multiple endogenous fiscal instruments, (ii) the identification of long-run equilibrium relationships through integration, and (iii) the analysis of short-run dynamics and feedback effects between fiscal policy, institutional quality, and private investment. This is critical in a post-conflict setting such as Rwanda, where fiscal variables and investment outcomes are jointly determined and evolve.
3.2. Estimation Strategy and Diagnostic Procedures
The empirical analysis follows a structured multivariate time series procedure consistent with the VECM framework. First, the time series properties of all variables were examined using the Augmented Dickey–Fuller (ADF) and Phillips–Perron (PP) tests to determine their order of integration. The presence of non-stationary variables integrated of order one (I(1)) provides the basis for testing cointegration relationships among private investment, disaggregated fiscal variables, institutional quality, and macroeconomic controls.
Second, the optimal lag length for the underlying vector autoregressive (VAR) system is selected using multiple information criteria, including the Akaike Information Criterion (AIC), Bayesian Information Criterion (BIC), and Hannan–Quinn Information Criterion (HQIC). Third, the Johansen’s cointegration approach, based on the trace and maximum eigenvalue statistics, was then used to determine the existence of the long-run relationships among the variables and justify estimation of the VECM.
Following confirmation of cointegration, the VECM was estimated to capture both short-run dynamics and long-run equilibrium relationships. The error correction term (ECT) measured the speed of adjustment toward long-run equilibrium, while standard diagnostic tests, including serial correlation, heteroskedasticity, and parameter stability tests, were conducted to verify model adequacy.
To further investigate the dynamic transmission mechanisms, Impulse Response Function (IRF) and Forecast Error Variance Decomposition (FEVD) were estimated. These analyses complement the VECM results by illustrating the dynamic responses of private investment to fiscal policy innovations and the relative contributions of each variable to forecast error variance. Moreover, the study employed a linear VECM framework; therefore, the Impulse Response Functions illustrate dynamic adjustment mechanisms rather than nonlinear relationships. Although nonlinear fiscal responses may exist under different econometric conditions, examining such dynamics is beyond the scope of this study and represents a useful direction for future research.
3.3. Econometric Considerations and Limitations
Several econometric considerations are acknowledged in interpreting the results. First, the inclusion of multiple disaggregated fiscal variables introduces potential multicollinearity. However, within a VECM framework, the emphasis is placed on system-wide dynamics and cointegrating relationships rather than individual parameter estimates. To reduce redundancy, alternative model specifications are estimated where necessary. Second, the use of interpolated quarterly data, particularly for institutional indicators such as government effectiveness, may introduce measurement error and smooth short-run fluctuations. While this approach is standard in macroeconomic time series analysis, it may limit the precision of short-run estimates. Accordingly, greater emphasis is placed on long-run relationships.
Third, the relatively limited sample size for quarterly data (1996 Q1–2024 Q4) may affect the efficiency of parameter estimates and the power of cointegration tests. This constraint is typical in country-specific time series studies and is mitigated through parsimonious model specification and robustness checks. Fourth, the reliance on a reduced-form VECM implies that the analysis captures dynamic associations rather than structural causal effects. As such, the findings should be interpreted as conditional relationships consistent with theoretical expectations, rather than definitive causal estimates. Finally, the identification of shocks in IRF and FEVD analysis depends on variable ordering assumptions, which may influence results. Sensitivity to alternative ordering is therefore considered in robustness analysis.
4. Results
4.1. Descriptive Statistics
The descriptive statistics presented in
Table A1,
Appendix A reveal important patterns in Rwanda’s post-conflict fiscal and economic trajectory.
Firstly, private investment shows considerable variability over the years. Both gross fixed capital formation and domestic private investment follow similar fluctuations. This indicates that private investment activity in post-conflict Rwanda was not stable but fluctuated over the period.
Secondly, government expenditure displays a clear upward trend, with both capital and current spending increasing over time. This trend in expenditure levels reflects a potential growing role of government in Rwanda’s post-conflict reconstruction and development process.
Thirdly, the financing of public investment highlights a balanced reliance on both domestic and external borrowing. At the same time, external grants emerge as a significant component of financing. This highlights the importance of external resources in Rwanda’s post-conflict financing landscape.
Fourthly, indicators of financial sector development point to relatively limited domestic financial depth. Credit to the private sector remains relatively constrained, highlighting the restrictive financing environment in which businesses have operated during the post-conflict recovery period.
Finally, institutional and macroeconomic indicators show gradual improvement over the sample period. Government effectiveness displays a positive trend, inflation remains moderate, and revenue mobilization increases over time.
Overall, the descriptive statistics portray an economy characterized by fluctuating private investment, rising public expenditure and investment, substantial reliance on external financing, evolving institutional environment, and relatively shallow domestic financial markets.
4.2. Unit Root and Cointegration Results
Unit root tests using the ADF and PP procedures indicate that most variables are non-stationary in levels but become stationary after first differencing, suggesting order one [I(1)]. A few variables, notably DT and TOGS, are stationary in levels [I(0)]. This mixed order of integration is compatible with the VECM framework. Detailed results are reported in
Table A2 (
Appendix A). Given the predominance of I(1) variables, the Johansen cointegration test is applied to assess long-run relationships. The results confirm the existence of cointegration among the variables, supporting the presence of a stable long-run equilibrium linking fiscal policy and private investment. Lag selection criteria (AIC, SC, and HQ) consistently indicate an optimal lag length of two, which is used in the VECM estimation.
4.3. Long-Run Results of Aggregated Fiscal Policy Variables and Private Investment
The long-run estimates reported in
Table 2 indicate that aggregate fiscal instruments are systematically associated with private investment outcomes, but their effects differ in both direction and magnitude. The notation (−1) on respective regressors denotes a one-period lag in the VECM specification, capturing delayed investment responses to changes in fiscal policy and other explanatory variables, consistent with the dynamic nature of investment behavior. Total Tax Revenue (TAXR) and public debt (PD) are both negatively associated with private investment, with elasticities of −3.03 and −1.10, respectively. Specifically, a 1% increase in TAXR and PD corresponds to a decline in private investment of approximately 3.03% and 1.10%, respectively. These results indicate that both taxation and public debt are negatively associated with private investment, with taxation exhibiting a stronger negative association than public debt, consistent with the crowding-out hypothesis and the relevant literature discussed above.
This pattern can be understood within the context of Rwanda’s evolving, yet still relatively shallow, financial system. As the literature suggests, one possible explanation is that higher tax burdens reduce firms’ retained earnings and limit their capacity for internal financing. At the same time, public borrowing, particularly in domestic markets, may intensify competition for scarce credit. This interpretation aligns closely with findings from previous studies (
Shobande & Olunkwa, 2020;
Yusuf & Mohd, 2021).
In contrast, total public expenditure (TPEXP) is positively and significantly associated with private investment (). This positive association suggests that, at an aggregate level, government spending is associated with higher private investment over the long run. One possible explanation, frequently advanced in the literature, is that productive public expenditure may complement private investment through improvements in infrastructure and public service delivery, although these channels are not directly tested in the present analysis. The coexistence of negative tax and debt effects with a positive expenditure effect highlights an important fiscal composition issue: the net impact of fiscal policy depends not only on its size but also on how it is financed and allocated.
Institutional quality furthers these relationships. The positive and statistically significant coefficient on lagged government effectiveness () indicates that improvements in governance are associated with higher private investment in the long run. This finding suggests that higher levels of governance effectiveness are positively associated with private investment in the long run. The relevant literature suggests that this relationship may reflect institutional characteristics such as policy credibility, transparency and administrative capacity. In post-conflict settings, previous studies suggest that institutional quality can shape investment decisions by reducing policy uncertainty and fostering a more stable business environment.
Taken together, the aggregate results point to structural tensions in Rwanda’s fiscal framework. While taxation and debt are central to financing reconstruction and development, their association with reduced private investment suggests potential trade-offs that warrant careful policy consideration.
4.4. Disaggregated Fiscal Policy Effects on Total Private Investment
Building on the aggregate model,
Table 3 disaggregates fiscal variables to examine their individual associations with private investment. The results reveal substantial heterogeneity across fiscal instruments, suggesting that fiscal composition and financing structure are central to understanding private sector responses in Rwanda.
Direct taxes (DTs) are negatively and significantly associated with private investment (β = −13.8; , indicating a strong contractionary relationship. While the magnitude of this elasticity appears large, it should be interpreted with caution. In the Rwandan context, this may reflect scale effect, measurement issues, or the relatively small and formalized tax base, where marginal changes in recorded direct tax revenues can correspond to disproportionately large variations in measured investment. One possible explanation, as suggested in the relevant literature, is that higher direct taxation may encourage shifts in economic activities between the formal and informal sectors or influence firms’ investment decisions. However, these behavioral responses are not directly investigated in the present study. Consequently, the estimated coefficient should be interpreted as a statistical association rather than as evidence of direct causal relationships or precise magnitude effects.
In contrast, taxes on goods and services (TOGSs) and taxes on international trade (TOITs) seem to be positively associated with private investment, although the magnitudes are comparatively modest. This positive association is consistent with the argument in the literature that indirect taxes may impose fewer distortions on investment decisions than direct taxes (
Yusuf & Mohd, 2021).
On the expenditure side, the source of financing emerges as a critical determinant of investment outcomes. Capital expenditure financed by foreign resources (CAPEXPFFR) shows a strong positive association with private investment (β = 5.55; ), consistent with the crowding-in hypothesis discussed in the literature. In post-conflict economies such as Rwanda, previous studies suggest that externally financed projects, particularly those supported by concessional loans or grants, may complement private investment by expanding public infrastructure and reducing pressure on domestic financing resources. These potential transmission channels, however, are not directly tested in the present analysis.
The disaggregated debt results further reinforce these patterns. Domestic debt (DOMDEBT) is negatively and significantly associated with private investment (β = −0.91, ), a finding that is consistent with the view in the literature that domestic borrowing may be associated with tighter domestic financing conditions. EXTDEBT, in contrast, shows a positive but statistically insignificant association. However, this neutrality should be interpreted cautiously. Although the literature suggests that long-term debt sustainability concerns may shape investment behavior, such dynamics are beyond the scope of the present empirical model.
Institutional quality remains a consistent factor across specifications. The positive and significant coefficient on lagged government effectiveness (β = 1.09; ), confirms the earlier finding that improvement in governance is associated with stronger private investment outcomes. The lagged coefficient suggests that government effectiveness is associated with private investment after a one-period delay. This is consistent with the economic literature which suggests that improvements in governance may gradually exert positive influence on investment decisions.
Overall, the disaggregated results clarify that the aggregate crowding-out and crowding-in patterns, identified in
Section 4.3, are not uniform effects, but rather the net outcome of offsetting influences across different fiscal instruments. Direct taxation and domestically financed fiscal activities are negatively associated with private investment, whereas externally financed capital expenditure and indirect tax instruments exhibit a positive association. These findings highlight the importance of fiscal composition and financing structure, while the mechanism through which these fiscal instruments influence private investment remain matters for further empirical investigations.
4.5. Effect of Disaggregated Fiscal Policy Variables (FPVs) on Domestic and Foreign Private Investment
As reported in
Table 4 below, the results for domestic private investment indicate that different fiscal policy instruments exhibit distinct associations with domestic private investment. The literature suggests that these relationships may operate through cost and financing channels. Direct taxes (DTs) and trade taxes (TOITs) are both negatively and significantly associated with TPDI, with elasticities of −5.41 and −0.94, respectively (
Table 4). These negative associations indicate that direct taxes and trade taxes are linked to lower domestic investment. One possible explanation, consistent with the literature, is that these tax instruments may influence firms’ profitability, financing capacity and production costs. Direct taxes reduce retained earnings and internal financing capacity, while trade taxes increase the cost of imported capital goods and intermediate inputs, thereby lowering expected returns on investment.
In contrast, taxes on goods and services show a positive association with TPDI (β = 4.57; with statistical significance at the 1% threshold), a finding that is consistent with the view in the literature that indirect taxes may impose fewer distortions on investment decisions than direct taxes. While the mechanisms through which direct and indirect taxes influence private investment are not directly evaluated in the present study, taken together, the tax structure still points to a net contractionary association, consistent with the aggregate results.
On the expenditure side, the financing structure again plays a central role. Domestically financed capital expenditure (CAPEXPFDR) is negatively associated with TPDI (β = −0.74; with statistical significance at the 1% threshold), indicating a negative association between domestically financed capital expenditure and domestic private investment. One possible interpretation, supported by the literature, is that domestically financed public investment may compete with private investment for domestic financial resources. However, changes in credit conditions and access to finance are not directly examined in the present study. This is consistent with the earlier finding that domestic debt constrains private sector access to finance in Rwanda’s relatively shallow financial system.
External debt (EXTDEBT) is also negatively associated with TPDI (β = −0.60; p < 0.003), although through a different channel. Unlike domestic borrowing, external debt may influence private investment through different channels. The literature suggests that debt-serving obligations and fiscal constraints may affect public resources allocation over time, thereby limiting public investment and reducing its potential to leverage private investment. In the context of limited fiscal space, these obligations can divert public resources away from growth-enhancing expenditure, indirectly affecting domestic investment conditions.
Institutional quality continues to play a facilitating role. This positive and significant coefficient on lagged government effectiveness (β = 1.53; with statistical significance at the 5% threshold) suggests that higher levels of government effectiveness are associated with greater domestic private investment. One possible explanation suggested in the literature is that improvement in governance may contribute to a more favorable investment environment. However, reductions in uncertainty and changes in investor confidence are not directly tested by the current estimated model.
Overall, the TPDI results indicate that domestic investment exhibits stronger associations with some fiscal policy instruments than others. In particular, direct taxation, trade taxes, domestically financed capital expenditure, and external debt are negatively associated with domestic private investment, whereas taxes on goods and services and government effectiveness display positive associations.
In contrast to domestic investment, the estimated results indicate that FDI is not significantly associated with the tax variables included in the model, while exhibiting stronger associations with selected fiscal and institutional variables. The estimated coefficients for direct taxes (DTs), taxes on goods and services (TOGSs), and trade taxes (TOITs) are statistically insignificant, suggesting that tax policy plays a limited role in shaping Foreign Direct Investment decisions in this context (
Table 5).
One possible explanation, suggested by the foreign investment literature, is that foreign investors may respond differently to fiscal policy than domestic investors because their investment decisions are influenced by a broader range of factors, including market conditions, institutional quality, and the overall investment environment. However, these potential transmission channels are not directly tested in the present study.
Consistent with this interpretation, externally financed capital expenditure (CAPEXPFFR) is positively and significantly associated with FDI (β = 1.54; with statistical significance at the 5% threshold). This positive association is consistent with the argument in the literature that externally financed capital expenditure may complement foreign private investment through improvements in infrastructure and the broader investment environment. Additionally, in line with the literature on foreign aid conditionalities, externally financed projects are frequently accompanied by governance reforms and accountability measures that may support investment.
In contrast, recurrent expenditure (CURREXP) is negatively associated with FDI (β = −7.53; with statistical significance at the 1% threshold). One possible interpretation, consistent with the literature, is that higher recurrent expenditure may be perceived as a sign of weak public financial management and ineffective fiscal policy, which in turn provides less support for productive investment.
Both external and domestic public debt show positive associations with FDI (β = 2.16 and β = 0.43, respectively), with external public debt being significant at the 1% level and domestic debt public debt at the 5% level. One possible explanation, drawn from the literature, is that public borrowing intended to finance productive investment may be viewed positively by investors. However, as noted earlier, those associations should be interpreted cautiously, as excessive debt accumulation may eventually undermine macroeconomic stability.
Finally, institutional quality remains a key determinant. The positive and significant association between lagged government effectiveness and foreign private investment (β = 1.93; p < 0.005) confirms earlier findings that improvements in government effectiveness are positively associated with foreign private investment.
4.6. Extended Model of Private Investment with Macroeconomic Controls
The study recognizes that private investment is shaped by monetary, financial, and external sector conditions. To address this, the extended specification incorporates lending interest rate, inflation, exchange rates, domestic credit to the private sector, trade openness, and GDP growth as control variables. These additions are intended to better isolate the estimated associations between fiscal policy instruments and private investment by accounting for key macroeconomic influences that could otherwise confound the estimated relationships.
To examine the validity of the baseline results and account for larger macroeconomic factors, the model is expanded to incorporate key control variables relevant to private investment. The enlarged specification (
Table 6) verifies many of the patterns discovered in previous sections, such as
Section 4.3 and
Section 4.5, while additionally explaining the importance of macroeconomic factors in determining investment trends.
Consistent with previous findings, CAPEXPFFR remains positively associated with private investment. In contrast, CURREXP and DOMDEBT continue to show negative connections, implying negative associations between recurrent expenditure, domestic debt and private investment. The inclusion of macroeconomic variables provides additional insights into the associations between the broader macroeconomic environment and private investment. DCTPS is positively and significantly associated with private investment. This finding is consistent with the literature which suggests that the availability of domestic credit may facilitate private investment.
Similarly, GDPGR has a positive relationship with private investment, a finding that is consistent with the accelerator theory proposed in the literature.
In contrast, lending interest rates (LRs) have a negative and significant relationship with private investment, indicating a negative association between lending interest rates and private investment, consistent with the literature which suggests that higher borrowing costs may discourage investment. The real exchange rate (EXCHR) has a negative association with private investment. In contrast, trade openness (TO) seems statistically insignificant, indicating that trade openness is not significantly associated with private investment in the estimated model. As suggested in the literature, the investment effects of trade liberalization may depend on complementary structural and institutional factors that are not directly examined in this study.
Institutional quality remains a strong influence in all criteria. The coefficient on lagged government effectiveness (=1.93; with statistical significance at the 1% threshold) remains positive and highly significant, confirming the positive association between government effectiveness and private investment observed in earlier specifications. This finding is consistent with the institutional economic literature, though the specific mechanisms through which governance influences private investment are not directly tested by the estimated model.
Overall, the enlarged model demonstrates that private investment is associated with both fiscal policy variables and breather macroeconomic conditions. While the estimated results highlight the importance of these factors, the specific channels through which they interact to influence private investment remain matters for further empirical investigation.
4.7. Impulse Response Function (IRF) Analysis
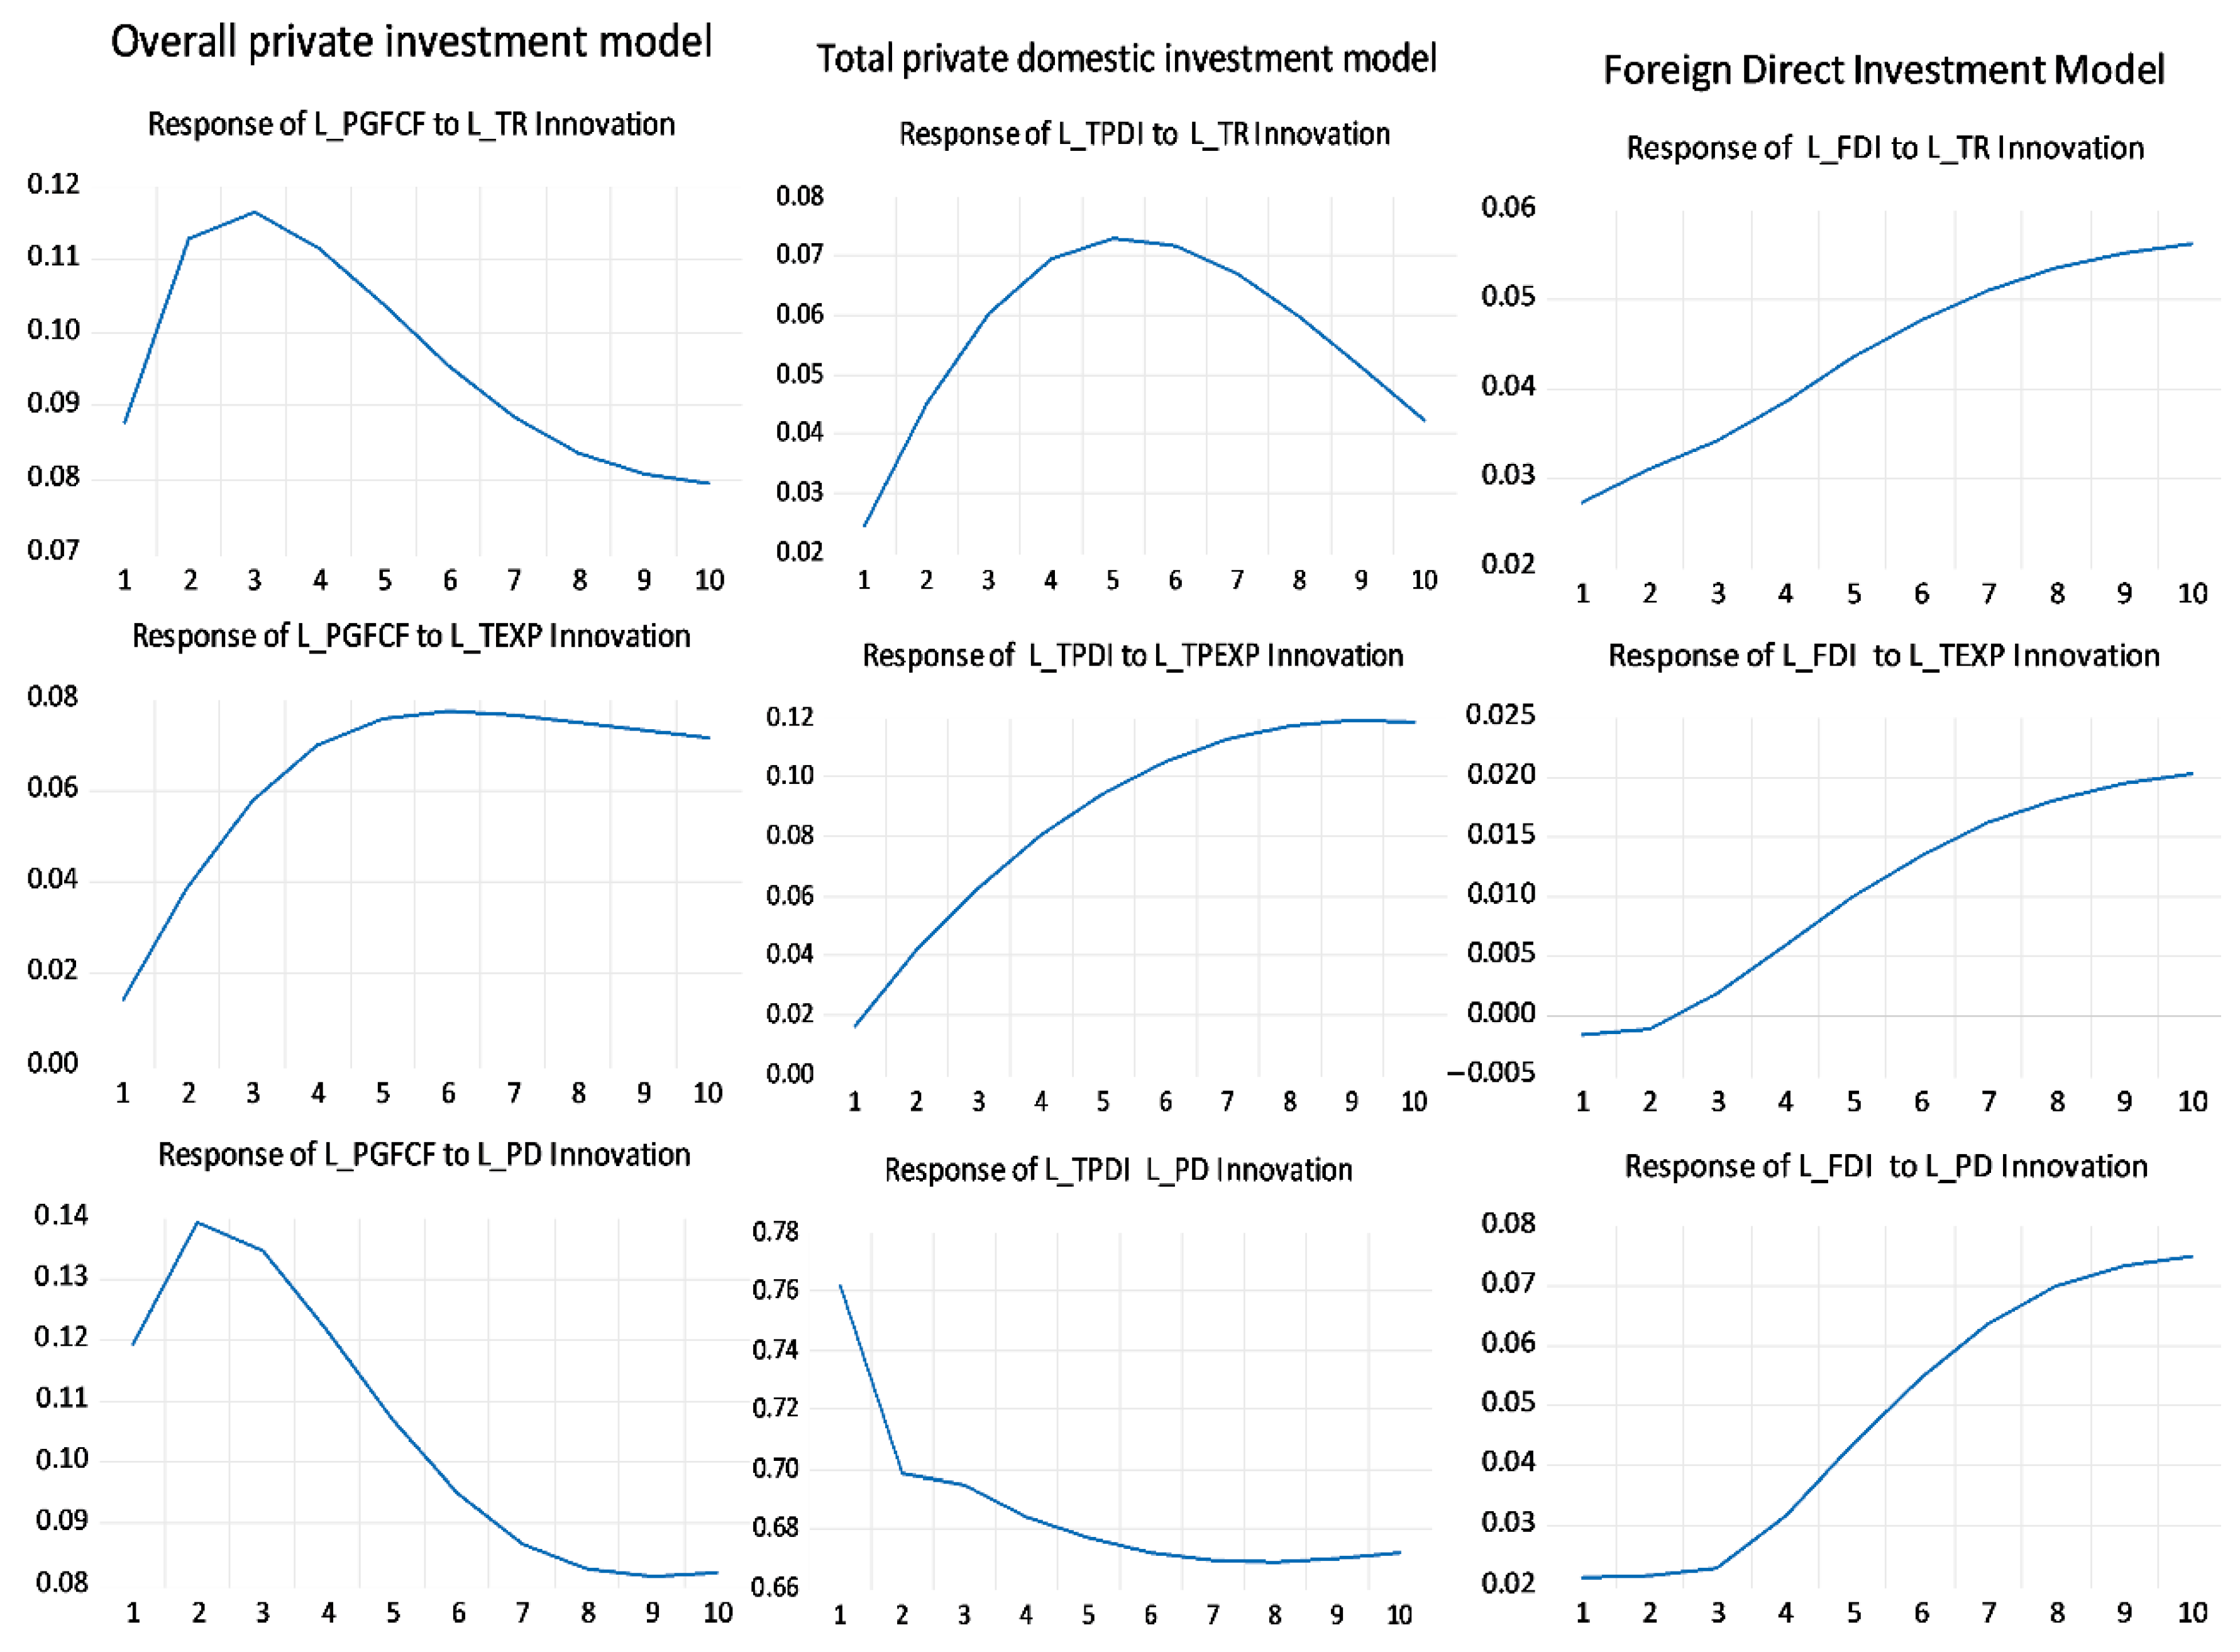
The impulse response analysis (
Figure 1) sheds light on the dynamic implications of fiscal shocks on private investment in Rwanda. The findings indicate a nonlinear response of private investment across total, domestic, and foreign components to changes in the tax burden across time.
In the short to medium term, incremental tax shocks are associated with a modest increase in private investment. One possible explanation, suggested in the fiscal policy literature, is that tax revenues may finance productive public expenditure that complements private investment. Yet, this benefit fades and reverses with time, with enlarged tax burdens finally linked to decreased investment. While this transmission mechanism is not directly identified by the IRF analysis, the observed pattern is consistent with the view that the investment effects of taxation may differ over time. While moderate taxation may indirectly encourage investment, disproportionate taxation may diminish after-tax returns and weaken investment incentives.
Rather than assuming an exact threshold, this nonlinear response is broadly consistent with the idea underlying the Laffer Curve, signifying that the relationship between taxation and economic activity is not monotone. In this context, the IRFs emphasize the necessity of balancing revenue mobilization and investment incentives, especially in a resource-constrained, post-conflict economy.
More broadly, the findings illustrate that the response of private investment to fiscal shocks evolves over time, highlighting the dynamic adjustments captured by the VECM framework. The impacts of taxation are neither immediate nor uniform but evolve and vary between investment kinds. While the overall trend appears to be similar across total, domestic, and foreign investment, the magnitude and duration of reactions may differ, suggesting the need for additional sectoral or firm-level study.
From a policy standpoint, the estimated responses suggest that the design of fiscal policy warrants careful considerations. Previous studies have argued that broadening the tax base and improving the efficiency of public expenditure may help balance revenue mobilization with investment objectives. Measures aimed at extending the tax base, improving compliance, and increasing the efficiency of public spending may achieve revenue goals while having minimal negative consequences on private investment. This is especially relevant in Rwanda, where sustaining investment-led growth necessitates careful alignment of fiscal capacity and private sector incentives.
Figure 1 presents the impulse response of private gross fixed capital formation (L_PGFCF), total private domestic investment and Foreign Direct Investment (FDI) to one-standard-deviation shocks in tax revenue (L_TAXR), total expenditure (L_TEXP), and public debt (L_PD) derived from the VECM. The horizontal axis represents the time horizon (in periods), while the vertical axis shows the percentage deviation from the equilibrium path.
4.8. Variance Decomposition Results
The Variance Decomposition results (
Table A4,
Table A5 and
Table A6) give more evidence on the relative role of fiscal tools in influencing private investment trends. By the tenth period, tax revenue accounts for 33.6% of the forecast error variance in total private investment (PGFCF), while domestic debt contributes 21.3%, reflecting their significant short- and medium-term impact. Total public expenditure explains a rising share of variance in total domestic private investment (16.5%), whereas Foreign Direct Investment is less sensitive to fiscal shocks, with the majority of its variance explained by its own innovations, though government spending and public debt gains influence over longer horizons.
Together, the IRFs and Variance Decomposition reinforce the dynamic and instrument-specific effects of fiscal policy. Moderate taxes can indirectly encourage investment by improving public goods, while high taxation or reliance on domestic debt stifles private capital development, especially in Rwanda’s resource-constrained post-conflict scenario. From a policy standpoint, our findings emphasize careful fiscal calibration, broadening the tax base, improving compliance, and increasing public expenditure efficiency in order to balance revenue mobilization with private investment incentives.
5. Summary and Policy Implications
5.1. Summary
Using Rwanda as a case study, this study applies a VECM technique to quarterly data spanning 1996 Q1–2024 Q4 to investigate the short- and long-term association between disaggregated fiscal policy and private investment in a post-conflict and resource-constrained environment. The analysis indicates that direct taxes and domestically financed debt are negatively associated with private investment, whereas externally financed capital spending is positively associated, thereby highlighting the differentiated effects of fiscal instruments.
However, these findings should be interpreted as statistical association rather than evidence of structural causality. Accordingly, fiscal policy should recognize the inherent trade-offs between revenue mobilizations and private investment promotion, particularly in post-conflict and resource-constrained economies.
The extended model confirms that these fiscal relationships remain robust after controlling key macroeconomic variables. Domestic credit to the private sector and economic growth are positively associated with private investment, whereas higher lending interest rates are negatively associated with investment. The impulse response analysis further suggests that the effects of fiscal policy evolve over time, highlighting the importance of considering both short- and long-run investment responses.
Overall, the findings demonstrate that the composition of fiscal policy matters as much as its overall size. The results suggest that financial structure, expenditure composition and institutional quality are important considerations when assessing the relationship between fiscal policy and private investment in post-conflict economies.
Like most empirical studies, this study is subject to limitations. First, the analysis hinges on aggregate quarterly time series data for Rwanda. Although this allows examination of long-run macroeconomic relationships, it does not capture sector-specific responses to fiscal policy. Different sectors may respond differently to taxation, expenditure, and public debt.
Second, while the VECM framework identifies long- and short-run association, it does not establish causal transmission mechanisms. As a result, the study cannot directly determine whether the observed association operates through credit constraints, infrastructure development, investor confidence, institutional credibility or other channels frequently discussed in the literature.
Third, although the inclusion of relevant macroeconomic control variables reduces the possibility of omitted variable bias, potential endogeneity between fiscal and private investment variables cannot completely be ruled out. Future studies may use instrumental variables, structural VAR models panel data techniques to strengthen causal inference.
Finally, the findings are based exclusively on Rwanda’s post-conflict economic experience. While the results may offer useful insights for similar developing economies, caution should be exercised when generalizing them to economies with different institutional, fiscal or macroeconomic conditions.
Future research could extend this study by employing sector-level datasets, comparing multiple post-conflict low-income economies, and examining the specific mechanisms through which fiscal policy influences private investment.
5.2. Policy Implications
The findings show that fiscal policy’s effectiveness in catalyzing private investment in Rwanda is determined by its composition, financing structure, and institutional environment rather than its aggregate scale. The negative relationship between direct taxation, domestically financed debt, and domestic private investment suggests that distortionary tax burdens and reliance on domestic borrowing can be associated with limited private-sector activity, possibly through lowering after-tax returns and tightening credit markets. The distortionary effects of direct taxation suggest that efforts to increase domestic resource mobilization for financing ambitious development plans should prioritize alternatives to raising tax rates. These may include enhancing efficiency through digitalization, broadening the tax base, particularly by tapping into the large informal sector, and strengthening tax compliance. Moreover, public domestic borrowing should be considered only as a last resort, given its potential crowding-out effects.
At the same time, the positive association of externally financed capital spending and private investment emphasizes the need for strategically planned public investment, especially when supported by concessional foreign resources. Unlike domestically financed expenditure, which may impose financial trade-offs, such financing appears to relieve supply-side limitations without crowding out private credit.
Importantly, the findings demonstrate that fiscal policy success is dependent on institutional quality. Enhancements in government effectiveness should therefore be pursued, given their potential to facilitate the transmission of fiscal measures into investment outcomes. This emphasizes the necessity of embedding budgetary measures within broader, long-term governance reforms.
Finally, the differentiated responses of domestic and foreign investors, together with the prevailing macroeconomic conditions, highlight the necessity of calibrating fiscal policy with precision. Taken together, these findings suggest that an effective fiscal strategy in post-conflict settings requires instrument-specific design, balanced financing options, and alignment with institutional and macroeconomic conditions, rather than adhering to standard policy prescriptions.