1. Introduction
Global food systems are increasingly organized through complex international production networks in which agricultural goods cross multiple borders before reaching final consumers. These agricultural global value chains (GVCs) link upstream input suppliers—such as fertilizer, energy, and machinery producers—to farming, processing, logistics, and retail sectors across countries. While this fragmentation has improved efficiency and scale, it has also introduced new vulnerabilities, as shocks originating in one node of the network can propagate rapidly and nonlinearly throughout the system (
Angelidis & Varsakelis, 2023;
Ioannidis et al., 2025). Recent disruptions—including the COVID-19 pandemic, climate-related extreme events, and geopolitical conflicts—have underscored the fragility of agricultural GVCs and their central role in global food security.
The literature review is developed in relation to four connected strands of research: multi-country input–output analysis, global value-chain accounting, agricultural trade resilience, and network-based shock propagation. Extensive literature has examined international trade and GVCs using multi-country input–output (IO) frameworks, building on the foundational Leontief production structure to trace value added and intermediate flows across borders (
Leontief, 1936;
Miller & Blair, 2009;
Timmer et al., 2015). These approaches have been widely applied to manufacturing and services, and more recently to agri-food systems, highlighting the importance of imported inputs, embodied emissions, and value-added trade (
Koopman et al., 2014;
Johnson & Noguera, 2012;
Gereffi et al., 2005). Parallel strands of research focus on agricultural trade resilience, emphasizing diversification, strategic stocks, and trade openness as buffers against shocks (
Antràs & Chor, 2013;
Baldwin & Lopez-Gonzalez, 2015). However, there remains considerable debate over whether deeper GVC integration enhances resilience by providing alternative sourcing channels, or instead amplifies systemic risk by increasing dependence on tightly coupled upstream inputs (
Acemoglu et al., 2012;
Baqaee & Farhi, 2019;
Headey & Fan, 2008).
Recent work has further emphasized that agricultural and food trade systems should be understood as interdependent networks whose resilience depends not only on aggregate openness but also on the structure of partner diversification, product concentration, and upstream input dependence.
Jafari et al. (
2024), for example, conceptualize the global food and agricultural trade network as a multidimensional resilience system shaped by connectivity, network structure, and the ability to absorb trade-flow disruptions.
Dalheimer and Bellemare (
2025) show that participation in global agricultural value chains is associated with food-price outcomes, underscoring the relevance of GVC positioning for food-price levels and volatility. More generally, recent network-based trade models highlight how shocks propagate through international production linkages and how trade barriers, supply-chain frictions, and input–output dependencies can generate indirect effects beyond the initially affected sector or country (
Baqaee & Farhi, 2024;
Burman et al., 2024). These contributions reinforce the need for tractable frameworks that connect agricultural GVC structure, input dependence, and shock propagation.
Agriculture occupies a distinctive position within GVCs that complicates this debate. Unlike many manufacturing sectors, agricultural production is characterized by fixed-proportions technologies, seasonal constraints, and strong dependence on critical inputs such as fertilizer, fuel, and logistics services. These features imply limited short-run substitutability and make agriculture particularly sensitive to disruptions in upstream supply chains and trade costs. Recent studies argue that fertilizer shortages and transport bottlenecks can generate cascading output losses far beyond the initially affected regions (
Bellemare, 2015;
Headey et al., 2022;
FAO, 2018), while others suggest that global trade can partially offset local production shocks through rerouting and price adjustment mechanisms (
World Bank, 2023). Reconciling these perspectives requires analytical frameworks that explicitly model network structure, fixed-coefficient technologies, and shock propagation.
Taken together, the existing literature provides powerful tools for measuring value-added trade, mapping global production networks, and evaluating food-system resilience. Nevertheless, three limitations motivate the present study. First, much of the multi-regional input–output literature is primarily accounting-oriented and does not always make explicit how binding upstream capacity constraints alter downstream feasibility in agricultural value chains. Second, studies of agricultural trade resilience often emphasize diversification, trade openness, or food-price volatility, while giving less formal attention to the fixed-proportion technologies that limit short-run substitution in agriculture. Third, network-based shock-propagation models identify amplification through production linkages, but agricultural-specific channels such as fertilizer dependence, logistics frictions, and export-capacity constraints are often treated separately. The research gap addressed in this paper is therefore the absence of a compact analytical framework that jointly represents these mechanisms within a transparent network-Leontief structure.
The purpose of this study is to provide a transparent analytical framework for organizing the analysis of agricultural GVC vulnerability within a standard network-Leontief structure. The paper does not claim to introduce a new input–output methodology, nor does it provide a full empirical calibration of agricultural trade disruptions. Its contribution is instead conceptual, organizational, and mechanism-based. Specifically, it adapts established multi-country input–output accounting to an agricultural GVC setting in which fixed input requirements, trade frictions, fertilizer dependence, and capacity constraints are considered jointly. This framing clarifies the conditions under which upstream agricultural disruptions may transmit to downstream processing and final consumption, while also identifying the data requirements for future empirical implementation. First, it provides a formal yet intuitive representation of agricultural GVCs that highlights the structural sources of fragility arising from fixed-proportion input requirements and cross-border interdependence. Second, it applies the model to a stylized but realistic case inspired by the ongoing Ukraine-related disruptions, illustrating how port insecurity, rerouting costs, and fertilizer constraints can jointly generate quantity shortfalls and price pressures in downstream food markets. The principal analytical insight is that agricultural GVCs may exhibit amplification effects when upstream constraints bind in fixed-coefficient production networks.
Accordingly, the stylized numerical application should be interpreted not as empirical evidence on the realized magnitude of Ukraine-related disruptions, but as a mechanism-based illustration of the research gap identified above: how fixed input coefficients, trade frictions, and binding upstream constraints can jointly shape downstream quantity and price outcomes in agricultural GVCs. This illustration is not intended to restrict the scope of the proposed framework. The general framework is formulated for a multi-country, multi-sector input–output system. The two-country application is used only as a transparent numerical scenario through which the propagation mechanism can be observed in a simple and interpretable setting.
2. Analytical Framework
The framework builds on conventional Leontief input–output analysis. The accounting identities, technical coefficients, and Leontief inverse used below are standard in the IO literature. The novelty of the present paper is therefore not methodological in a narrow mathematical sense, but lies in the structured application of these tools to agricultural GVC fragility, with explicit attention to fixed-proportion input use, trade-cost shocks, and capacity constraints. This clarification also defines the limits of the analysis: the framework is static, deterministic, and illustrative unless calibrated with observed multi-regional input–output data. The framework deliberately abstracts from substitution among inputs, endogenous supplier switching, strategic inventory use, price-mediated feedback loops, and optimizing behavior by firms or governments. These omissions are important limitations. They are adopted here to preserve the logic of a short-run Leontief environment in which input proportions are fixed and upstream capacity constraints may become binding. A richer dynamic or general-equilibrium model would be required to analyze medium-run adaptation, re-optimization, and network reconfiguration.
We employ a multi-country, multi-sector input–output (IO) model to characterize international trade in agricultural GVCs (
Leontief, 1936;
Miller & Blair, 2009;
Timmer et al., 2015;
Angelidis, 2026). Agriculture is modeled as an intermediate-intensive sector that depends on a range of imported inputs—including fertilizer, fuel, machinery, feed, and packaging—while also acting as a key upstream supplier to downstream sectors such as food processing, retail trade, and agro-industrial manufacturing. By embedding agriculture within a fully articulated IO network, the framework captures the propagation of final demand and supply-side shocks across countries and sectors through fixed-coefficient production relationships. The following subsections introduce the model incrementally, beginning with basic definitions of countries, sectors, and flows, and progressively incorporating production technology, value-added accounting, trade frictions, and shock propagation mechanisms.
2.1. Countries, Sectors, and Flows
We begin by defining the basic economic environment in which production and trade take place. The global economy is represented as a set of countries and sectors connected through intermediate and final demand flows. This subsection introduces the notation for gross output, intermediate input transactions, and final demand across country–sector pairs, and establishes the market-clearing conditions that govern production (
Miller & Blair, 2009;
Timmer et al., 2015). These definitions provide the accounting backbone of the model and ensure consistency between domestic production, international trade, and final consumption.
We formalize these elements by introducing notation for country–sector outputs, intermediate transactions, and final demand, and by stating the corresponding market-clearing conditions. Consider a global economy consisting of countries, indexed by , and production sectors, indexed by , with agriculture explicitly included as sector . Economic activity is represented at the country–sector level.
Let
denote gross output produced by sector
in country
. Intermediate input flows are denoted by
, representing deliveries from producer
to user
. Final demand is denoted by
and captures the use of goods produced by
for final consumption in country–sector
. For each producer
, market-clearing requires that gross output equals the sum of intermediate deliveries and final demand across all destination countries and sectors,
Before proceeding to the subsequent components of the model,
Table 1 summarizes the notation used throughout the analytical framework. The table is intended to help readers follow the transition from the basic input–output accounting identities to the later discussion of trade costs, capacity constraints, and shock propagation.
2.2. Technology: Input Coefficients and the GVC Engine
Production technology is modeled using fixed input coefficients, consistent with a Leontief representation of production processes. This subsection formalizes the input–output structure by defining the technical coefficients that describe intermediate input requirements per unit of output. By stacking country–sector outputs and coefficients into matrix form, the model yields a global IO system whose Leontief inverse captures both direct and indirect production linkages. This structure constitutes the core “GVC engine” of the framework, enabling the tracing of how final demand or supply shocks propagate through interconnected production networks. These technological relationships are summarized by a matrix of input coefficients, which allows the global production system to be expressed compactly and solved using the Leontief inverse.
Under the assumption of Leontief (fixed-proportions) technology, production in each country–sector requires predetermined quantities of intermediate inputs per unit of output (
Leontief, 1936;
Miller & Blair, 2009). We therefore define the input (technical) coefficient
as the amount of input from producer
required to produce one unit of gross output in sector
of country
. Formally,
which implies that intermediate input flows satisfy
For analytical convenience, the country–sector variables are collected into vector and matrix form. Let denote the stacked vector of gross outputs across all country–sector pairs, and let represent total final demand by producer, obtained by summing final uses across all destination countries. Let denote the global input–output coefficient matrix, whose entries measure the units of input from producer required per unit of output in sector of country .
The resulting multi-country input–output system can then be written as
which admits the solution
where
is the Leontief inverse. The Leontief inverse summarizes the total—direct and indirect—production required throughout the global economy to satisfy a given vector of final demand.
In the agricultural context, this structure implies that a disruption to fertilizer exports in country propagates through the production network by constraining agricultural output in country . The resulting reduction in agricultural supply subsequently affects downstream food-processing activities and, in turn, retail and export sectors. These direct and indirect transmission channels are fully captured by the Leontief inverse L, which summarizes the economy-wide propagation of upstream shocks through agricultural GVCs.
2.3. Value-Added Generation and Income Distribution
To connect production flows to income generation, the model explicitly accounts for value added at the country–sector level. This subsection introduces value-added coefficients and derives the mapping between final demand and the distribution of income across producers worldwide. By linking gross output requirements to value-added generation, the framework allows the identification of who ultimately earns income from global consumption, thereby providing a foundation for standard GVC accounting measures and policy-relevant distributional analysis. Using this production structure, we next derive the relationship between final demand and value-added generation at the country–sector level.
To link gross production to income generation, we define the value-added share for each producer
as the ratio of value added to gross output,
Collecting these shares into a diagonal matrix
, total value added generated worldwide in order to satisfy a given vector of final demand
can be expressed as
This relationship constitutes a central accounting identity in GVC analysis: final consumption in any location induces value-added creation across multiple countries and sectors through the underlying production network (
Koopman et al., 2014;
Johnson & Noguera, 2012).
2.4. Bilateral Final-Demand Absorption and Value-Added Generation
Building on the global IO structure, this subsection disaggregates final demand by destination country to analyze bilateral trade relationships in value-added terms. We formalize how final consumption in one country induces production and value added across multiple foreign sectors and countries, and derive commonly used GVC trade measures such as domestic value added embodied in exports. This approach enables a decomposition of gross trade flows into their underlying value-added components, with particular attention to agriculture and agri-food trade. This formulation permits the decomposition of final demand by destination country, from which bilateral value-added trade measures can be constructed.
Let
denote the component of global final demand that is absorbed in destination country
, expressed as a vector indexed by producers. The gross output required worldwide to satisfy country
’s final demand is then given by
The value added generated by producer
as a consequence of final consumption in country
is therefore
The object defined here should be interpreted as domestic value added generated in country
by final demand absorbed in country
. This is a final-demand-based value-added decomposition. It is closely related to value-added trade measures, but it is not, by itself, a complete gross-export decomposition because it does not separately identify intermediate exports, re-exports, returned domestic value added, or foreign value added embodied in gross exports. (
Koopman et al., 2014;
Johnson & Noguera, 2012;
Gereffi et al., 2005). This measure is obtained by aggregating value added across all sectors in the exporting country,
where the summation includes agriculture alongside non-agricultural sectors. Focusing exclusively on agricultural activities, the corresponding agriculture-specific component of domestic value added generated in country
by final demand absorbed in country
2.5. Agriculture-Specific Upstream/Downstream Links
Agriculture occupies a distinctive position within global production networks, characterized by strong upstream input dependence and critical downstream linkages (
Hertel, 1997;
FAO, 2018). This subsection isolates agricultural sectors within the IO system to examine their interactions with both domestic and foreign suppliers and users. By decomposing the input–output matrix into agriculture and non-agriculture blocks, the framework highlights fertilizer, energy, and logistics dependence on the upstream side, as well as agriculture’s role as an input into food processing and related industries. These linkages provide a structural basis for assessing vulnerability to input disruptions. To operationalize these distinctions, we partition the input–output matrix into agriculture and non-agriculture blocks and define summary measures of agricultural import dependence.
To highlight the distinctive role of agriculture within the global input–output network, sectors are partitioned into agriculture and non-agriculture (). This decomposition permits the global input–output coefficient matrix to be expressed in block form, isolating the principal upstream and downstream linkages involving agricultural production. In particular, captures intra-agricultural input requirements (e.g., seed and feed loops), represents agricultural inputs embodied in downstream processing and manufacturing activities (such as food products, textiles, and biofuels), and describes non-agricultural inputs used in agriculture, including fertilizer, chemicals, machinery, energy, and logistics services.
On this basis, a scalar measure of agricultural import dependence in country
j can be defined as the share of intermediate agricultural inputs sourced from foreign producers. Formally,
This indicator provides a transparent link between upstream input disruptions—such as fertilizer shortages or energy price increases—and the vulnerability of agricultural output to external shocks.
2.6. Trade Costs, Prices, and Competitiveness (Minimal Add-On)
To connect physical production networks with prices and competitiveness, the model incorporates trade costs in a reduced-form manner. This subsection introduces iceberg-type trade frictions that affect the delivered cost of intermediate and final goods across borders. Under fixed-proportions technology, changes in trade costs translate directly into unit cost pass-through, allowing the analysis of how transport disruptions, tariffs, and border frictions influence agricultural and food prices. This extension links the quantity-based IO framework to observable price dynamics in international markets. We therefore introduce trade-cost parameters into the unit-cost representation of production to examine how frictions transmit through agricultural GVCs.
A parsimonious way to incorporate trade frictions is to model delivered unit cost from
to
:
where
is an iceberg/trade-cost factor (transport, tariffs, border delays), (
Anderson & van Wincoop, 2004;
Head & Mayer, 2014).
If input choice is fixed-proportions (Leontief), costs pass through linearly. Unit cost for
:
where
is unit value-added cost (wages/rents/land).
In agricultural GVCs, trade-cost shocks may have relatively large downstream effects because many agricultural products are bulky, perishable, and dependent on time-sensitive logistics, including refrigerated transport and port handling. Under fixed-proportion technologies, these frictions enter downstream unit costs through the delivered prices of intermediate inputs.
2.7. Shocks and Propagation Through Agricultural GVCs
Finally, the framework is extended to analyze supply-side disruptions and their propagation through agricultural GVCs. This subsection introduces capacity constraints and input availability shocks that limit feasible production relative to unconstrained IO requirements. By comparing required output to effective capacity, the model captures nonlinear adjustment mechanisms such as rationing and output shortfalls. This structure allows the study of how localized shocks—such as fertilizer shortages, export disruptions, or infrastructure damage—can generate cascading effects throughout downstream sectors and across countries. Building on this structure, we model supply-side disruptions as capacity constraints and characterize their implications for feasible production and unmet final demand.
To analyze supply-side disruptions, we introduce shocks that limit effective production capacity or input availability at the country–sector level. A capacity shock is represented as an upper bound on feasible output,
where the inequality is understood elementwise,
denotes pre-shock productive capacity, and
measures the fraction of capacity lost by producer
.
For a given vector of final demand
, the unconstrained input–output system implies required gross output
. Feasibility requires that these requirements do not exceed effective capacity, i.e.,
The source of nonlinearity in this framework does not arise from the Leontief inverse itself, which is linear in final demand under unconstrained conditions. Rather, nonlinearity enters through the capacity constraint. When required output remains below effective capacity, the system responds linearly to demand or cost shocks. However, once required output exceeds available capacity, the relevant node becomes binding and downstream production must be rationed. The response function is therefore piecewise linear, with a threshold at the point where the unconstrained Leontief requirement equals effective capacity. This threshold mechanism is the basis for any nonlinear amplification discussed in the paper.
When this condition is violated, production becomes capacity-constrained and output must be rationed. A parsimonious closure is obtained by assuming proportional adjustment, so that realized output is given by
with the minimum taken elementwise. The resulting vector of unmet final demand is then
This formulation captures a central source of fragility in agricultural GVCs: disruptions to critical upstream inputs—such as fertilizer export constraints—can bind production capacity and generate nonlinear downstream shortages throughout the network (
Acemoglu et al., 2012;
Baqaee & Farhi, 2019;
Ghosh, 1958;
Jones, 2011).
This mechanism is particularly relevant for food systems, where upstream input shortages and price pressures have been shown to translate rapidly into food price volatility, distributional stress, and food-security risks, especially in low- and middle-income economies (
Bellemare, 2015;
Headey et al., 2022).
To summarize,
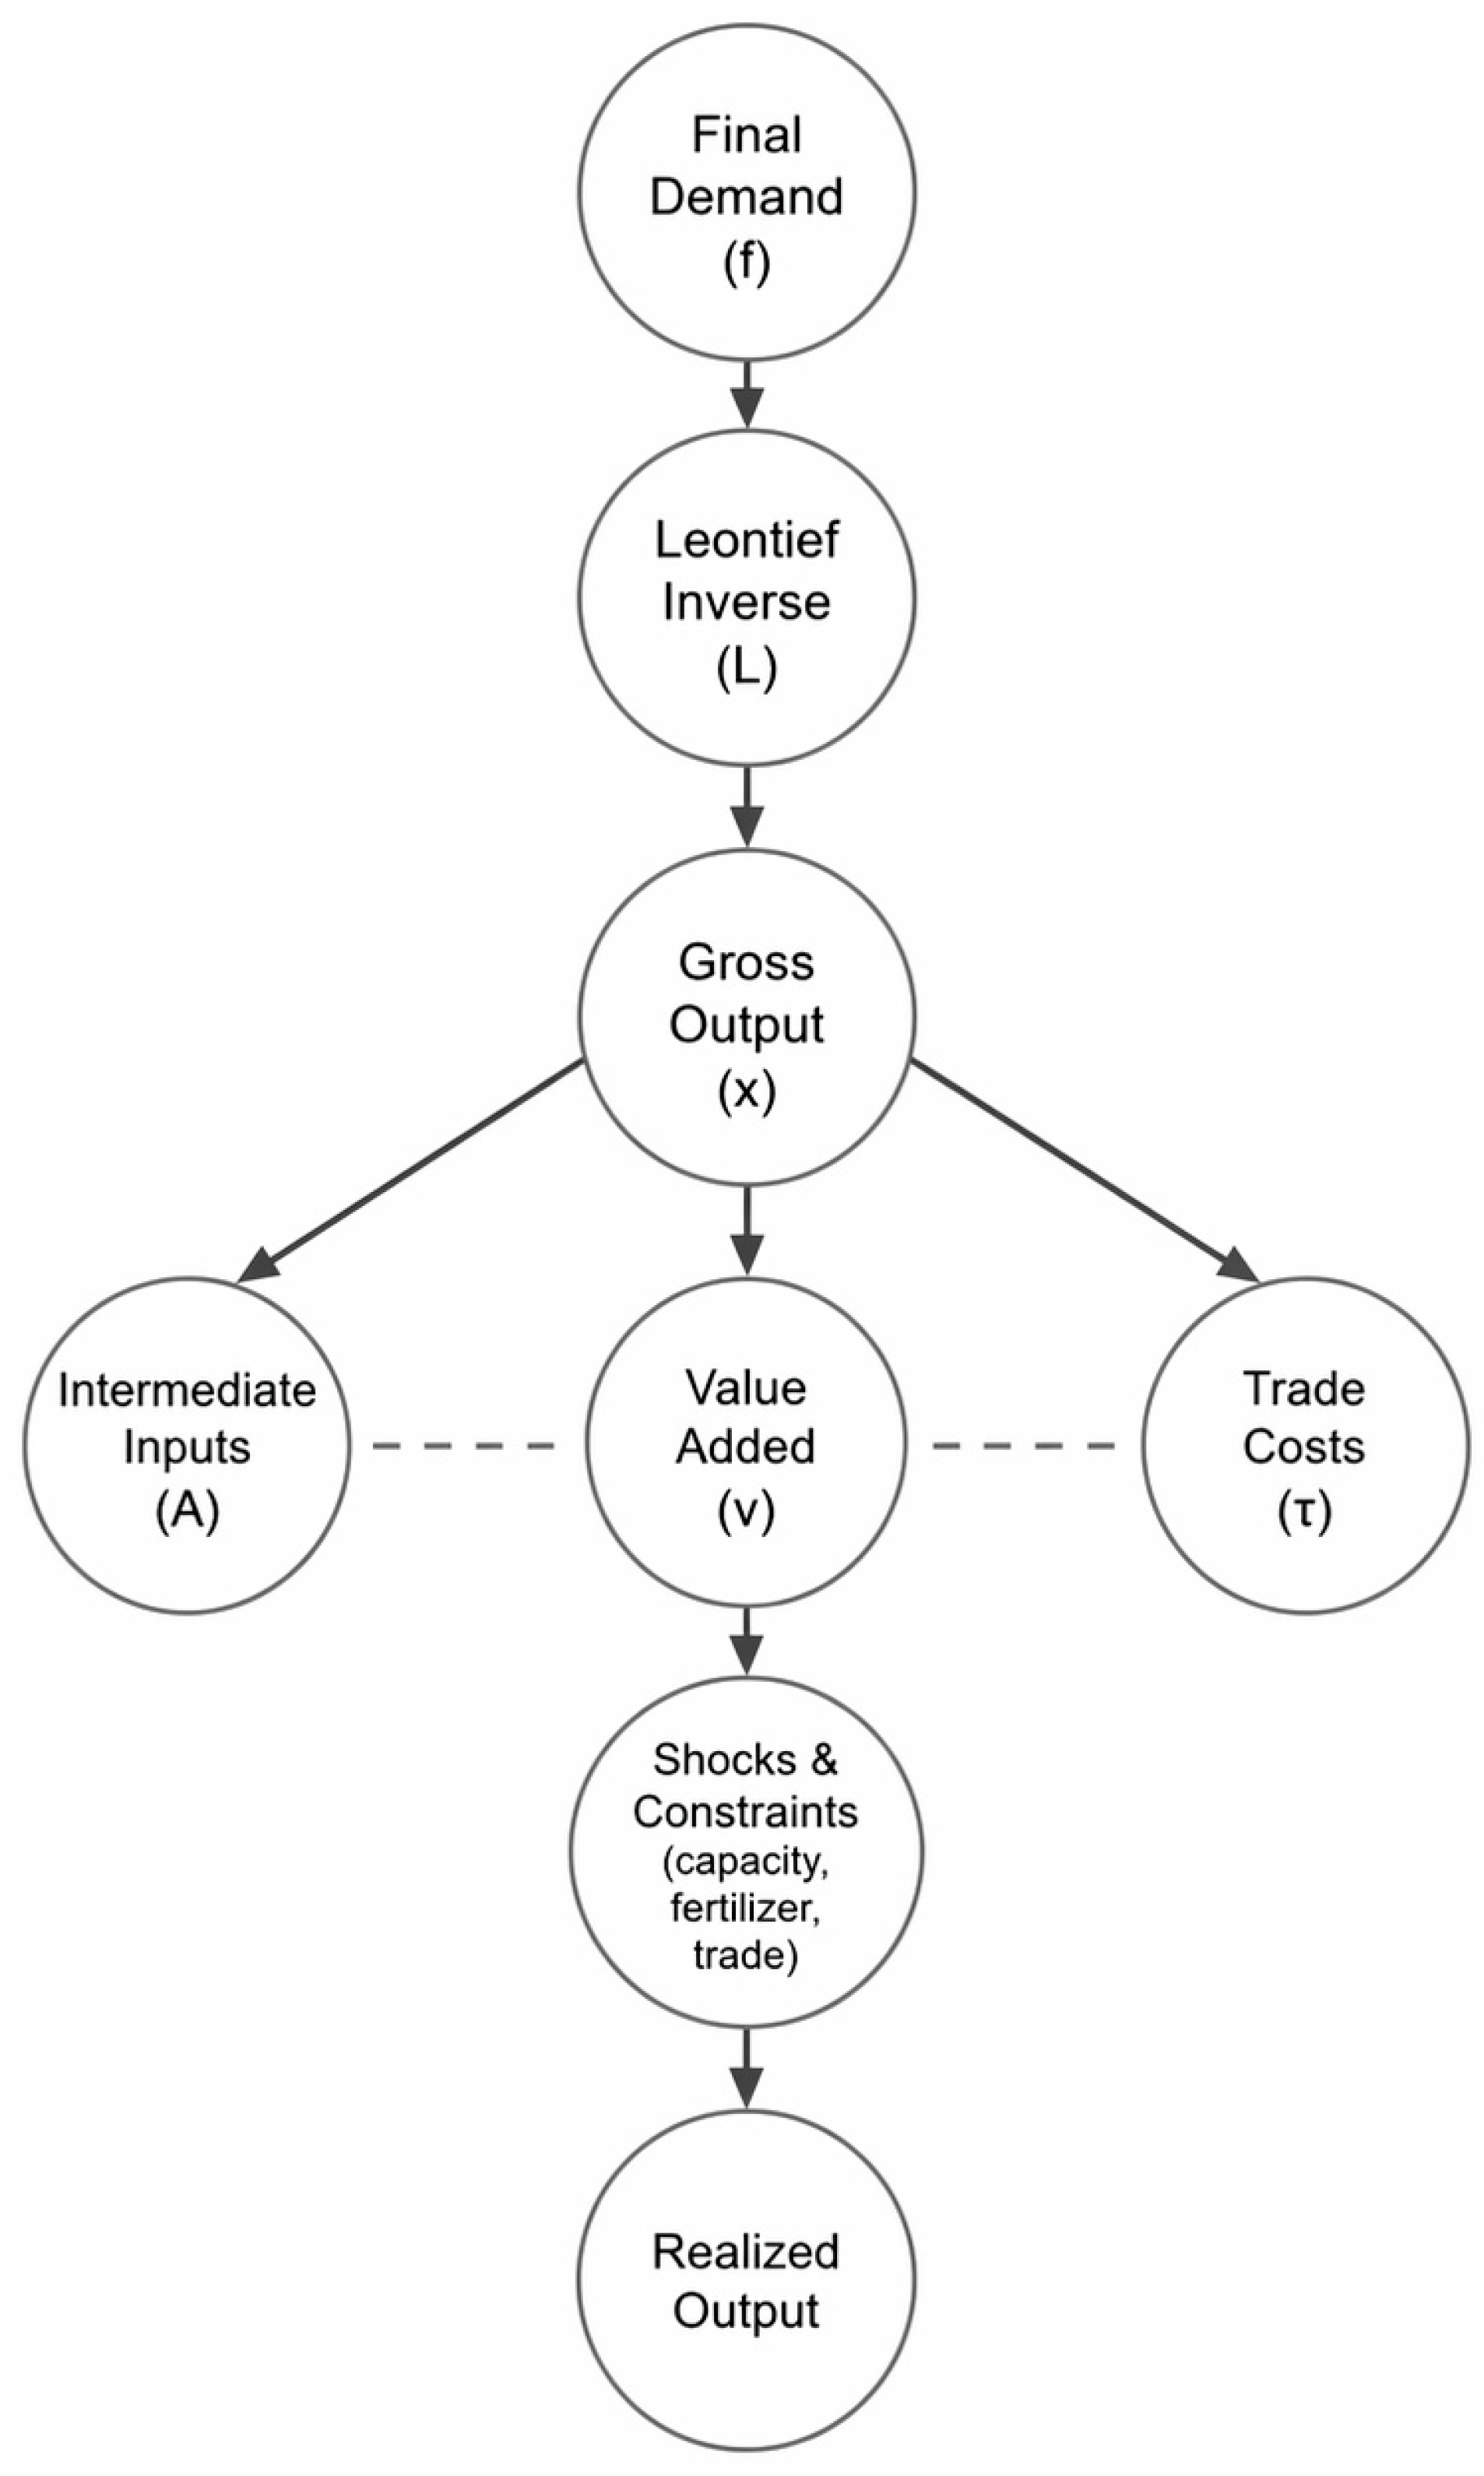
Figure 1 presents a schematic illustration of the network-Leontief framework. It integrates the core components developed throughout this section, including final demand, the Leontief production system, intermediate input linkages, value-added generation, and trade costs, while explicitly incorporating the role of capacity constraints and input shocks. It clarifies how demand- and supply-side mechanisms interact within agricultural GVCs and how shocks propagate through the interconnected production network.
3. Stylized Application
The general framework developed above applies to a full multi-country, multi-sector input–output system. For expositional clarity, the present section uses a deliberately reduced-form three-node representation of one agricultural value chain linking Ukrainian grain production, United Kingdom food processing, and United Kingdom retail demand. This exercise is explicitly stylized. It is not intended to approximate a full multi-country, multi-sector input–output system, nor should the numerical values be read as empirical estimates of the realized economic effects of the Ukraine-related disruptions. Rather, the example is designed to illustrate, in the simplest possible setting, how the mechanisms introduced in the analytical framework operate when upstream capacity constraints, trade-cost shocks, and input-availability restrictions interact. The numerical application should therefore be interpreted as an educational scenario analysis that clarifies model logic and transmission channels, not as a calibrated assessment of the Ukraine–United Kingdom agri-food system. It is not designed to estimate the realized economic impact of the Ukraine-related disruptions. Instead, it shows how selected assumptions regarding input coefficients, export capacity, trade costs, and fertilizer availability affect downstream outcomes within the proposed network-Leontief framework.
3.1. A Reduced-Form Ukraine–United Kingdom Illustration
This subsection presents a stylized yet empirically grounded application of the proposed framework, motivated by the ongoing disruptions associated with the war in Ukraine. The example focuses on a simple agricultural GVC linking Ukrainian grain production to food processing in the United Kingdom (UK) and, ultimately, to UK final consumers. The chain is subject to three interrelated sources of disturbance: (i) insecurity and physical damage affecting Black Sea export infrastructure, (ii) increased trade frictions arising from rerouting, insurance premia, and logistical delays, and (iii) constraints on fertilizer availability within Ukraine that limit upstream agricultural capacity.
The parameterization of the example reflects conditions prevailing in late 2025 and early 2026. In December 2025, Russian military actions targeted Ukraine’s Black Sea port infrastructure and civilian grain vessels, raising transport risk and insurance costs and continuing to disrupt export logistics, even where shipments were able to proceed. These developments have been widely reported as contributing to heightened uncertainty in global grain markets and renewed concerns regarding global food security (
The Guardian, 2025). At the same time, Ukraine’s fertilizer supply chain has been severely constrained. A recent assessment by the Deutsche Gesellschaft für Internationale Zusammenarbeit (GIZ) documents that only two of six domestic ammonia and fertilizer plants were operational in 2025, while more than 60% of nitrogen fertilizer requirements were met through imports. In addition, the Togliatti–Odesa ammonia pipeline—historically a critical corridor for fertilizer inputs—remained offline, further exacerbating upstream supply bottlenecks (
GIZ, 2025). These conditions imply that agricultural production capacity is not only exposed to export disruptions but is also vulnerable to persistent input constraints that may affect output over multiple production cycles.
In terms of price conditions, the international benchmark price for wheat stood at approximately 508.6 U.S. cents per bushel (about USD 5.09 per bushel) on 5 January 2026, reflecting both heightened geopolitical risk and tighter global supply conditions (
Trading Economics, 2026). Taken together, these observations provide a realistic empirical backdrop against which the illustrative GVC scenario is constructed.
3.1.1. A Minimal 3-Node “Ukraine → UK” Agricultural GVC
This subsection introduces an economically meaningful three-node GVC designed to illustrate the core transmission mechanisms embedded in the proposed framework. The chain links Ukrainian agricultural production to food processing activities in the UK and, subsequently, to UK retail and food-service sectors serving final consumers. By abstracting from sectoral and geographic complexity, the structure isolates the essential upstream–downstream dependencies that characterize agricultural GVCs, while remaining sufficiently rich to capture input bottlenecks and propagation effects. The resulting representation provides a transparent baseline against which the effects of shocks can be clearly identified and quantified. On this basis, the following formulation specifies the corresponding input–output coefficients and market-clearing conditions that characterize the three-node structure.
We consider a stylized three-node agricultural GVC designed to illustrate the core transmission mechanisms of the model. The upstream node represents Ukrainian grain and oilseed production, whose output is used as an intermediate input abroad. The intermediate node corresponds to food-processing activities in the UK, including milling, animal feed production, edible oils, and packaged foods. The downstream node represents UK retail and food-service sectors supplying final consumers.
Production relationships across the three nodes are assumed to follow a Leontief input–output structure. Specifically, one unit of processed food output requires
units of grain, while one unit of retail output requires
units of processed food. These technological coefficients imply the following input-coefficient matrix, where rows denote input-supplying nodes and columns denote output-producing nodes:
Given a vector of final demand
, gross output throughout the chain satisfies the standard Leontief system
where
denotes the Leontief inverse associated with the three-node production network.
3.1.2. Baseline: UK Final Demand Pulls Ukrainian Farm Output Through the Chain
Building on the three-node structure, this subsection establishes a baseline scenario in which UK final demand is met under unconstrained production and trade conditions. The purpose of this exercise is to quantify the gross output requirements at each stage of the value chain implied by a given level of final consumption. By computing the implied upstream production in Ukrainian agriculture and UK food processing, the analysis illustrates how final demand in a downstream market is transmitted backward through the GVC via fixed input–output relationships. This benchmark serves as a reference point for evaluating the magnitude and nature of subsequent disruptions. We now compute the implied gross output levels at each node of the chain for a given level of UK final demand, which serves as the benchmark against which all subsequent shocks are evaluated.
As a benchmark case, assume that final demand in the UK arises exclusively at the retail stage. Accordingly, the final-demand vector is given by
The gross output required at each node of the value chain to satisfy this level of final consumption is obtained from the Leontief system
, yielding
Thus, meeting 100 units of final retail food demand in the UK requires 40 units of domestic food-processing output, which in turn embody 14 units of Ukrainian grain. This benchmark illustrates how downstream final demand can imply upstream production requirements in a fixed-coefficient value-chain representation.
The assumptions underlying the three-node illustration are summarized in
Table 2. These values define the benchmark final-demand requirement, the fixed input coefficients linking retail demand to processing and grain production, and the illustrative shock parameters used in the subsequent scenario analysis. The values are not intended to represent a full empirical calibration. Rather, they provide a transparent parameterization designed to illustrate how final demand, input coefficients, trade costs, and upstream capacity constraints interact within the proposed framework. They should be interpreted as transparent scenario parameters rather than as econometrically estimated coefficients. Their purpose is to discipline the illustration and to make clear how each parameter enters the model.
3.1.3. Shock A: Export/Security Disruption Cuts Effective Export Capacity
This subsection examines the impact of a negative capacity shock affecting Ukrainian grain exports, motivated by heightened insecurity and physical damage to Black Sea port infrastructure. Such disruptions are modeled as a reduction in effective export capacity, constraining the ability of upstream production to satisfy downstream requirements. The analysis demonstrates how, under fixed-proportions technology, a binding upstream constraint propagates proportionally through the entire chain, generating output shortfalls in downstream processing and retail sectors. This mechanism highlights the vulnerability of food supply chains to localized transport and security shocks, even when downstream productive capacity remains intact. To formalize this mechanism, we introduce a capacity constraint on Ukrainian grain exports and examine its consequences for feasible production and downstream supply.
We model a disruption to Ukrainian grain exports as a capacity constraint on upstream agricultural output. Let effective grain export capacity satisfy
where
denotes the fraction of capacity lost. To reflect heightened insecurity, insurance premia, and rerouting constraints associated with Black Sea disruptions, we consider a reduction in effective export capacity of 30 percent, i.e.,
.
In the benchmark scenario, the unconstrained requirement implied by UK final demand is
. Under the assumed shock, maximum feasible grain exports are therefore limited to
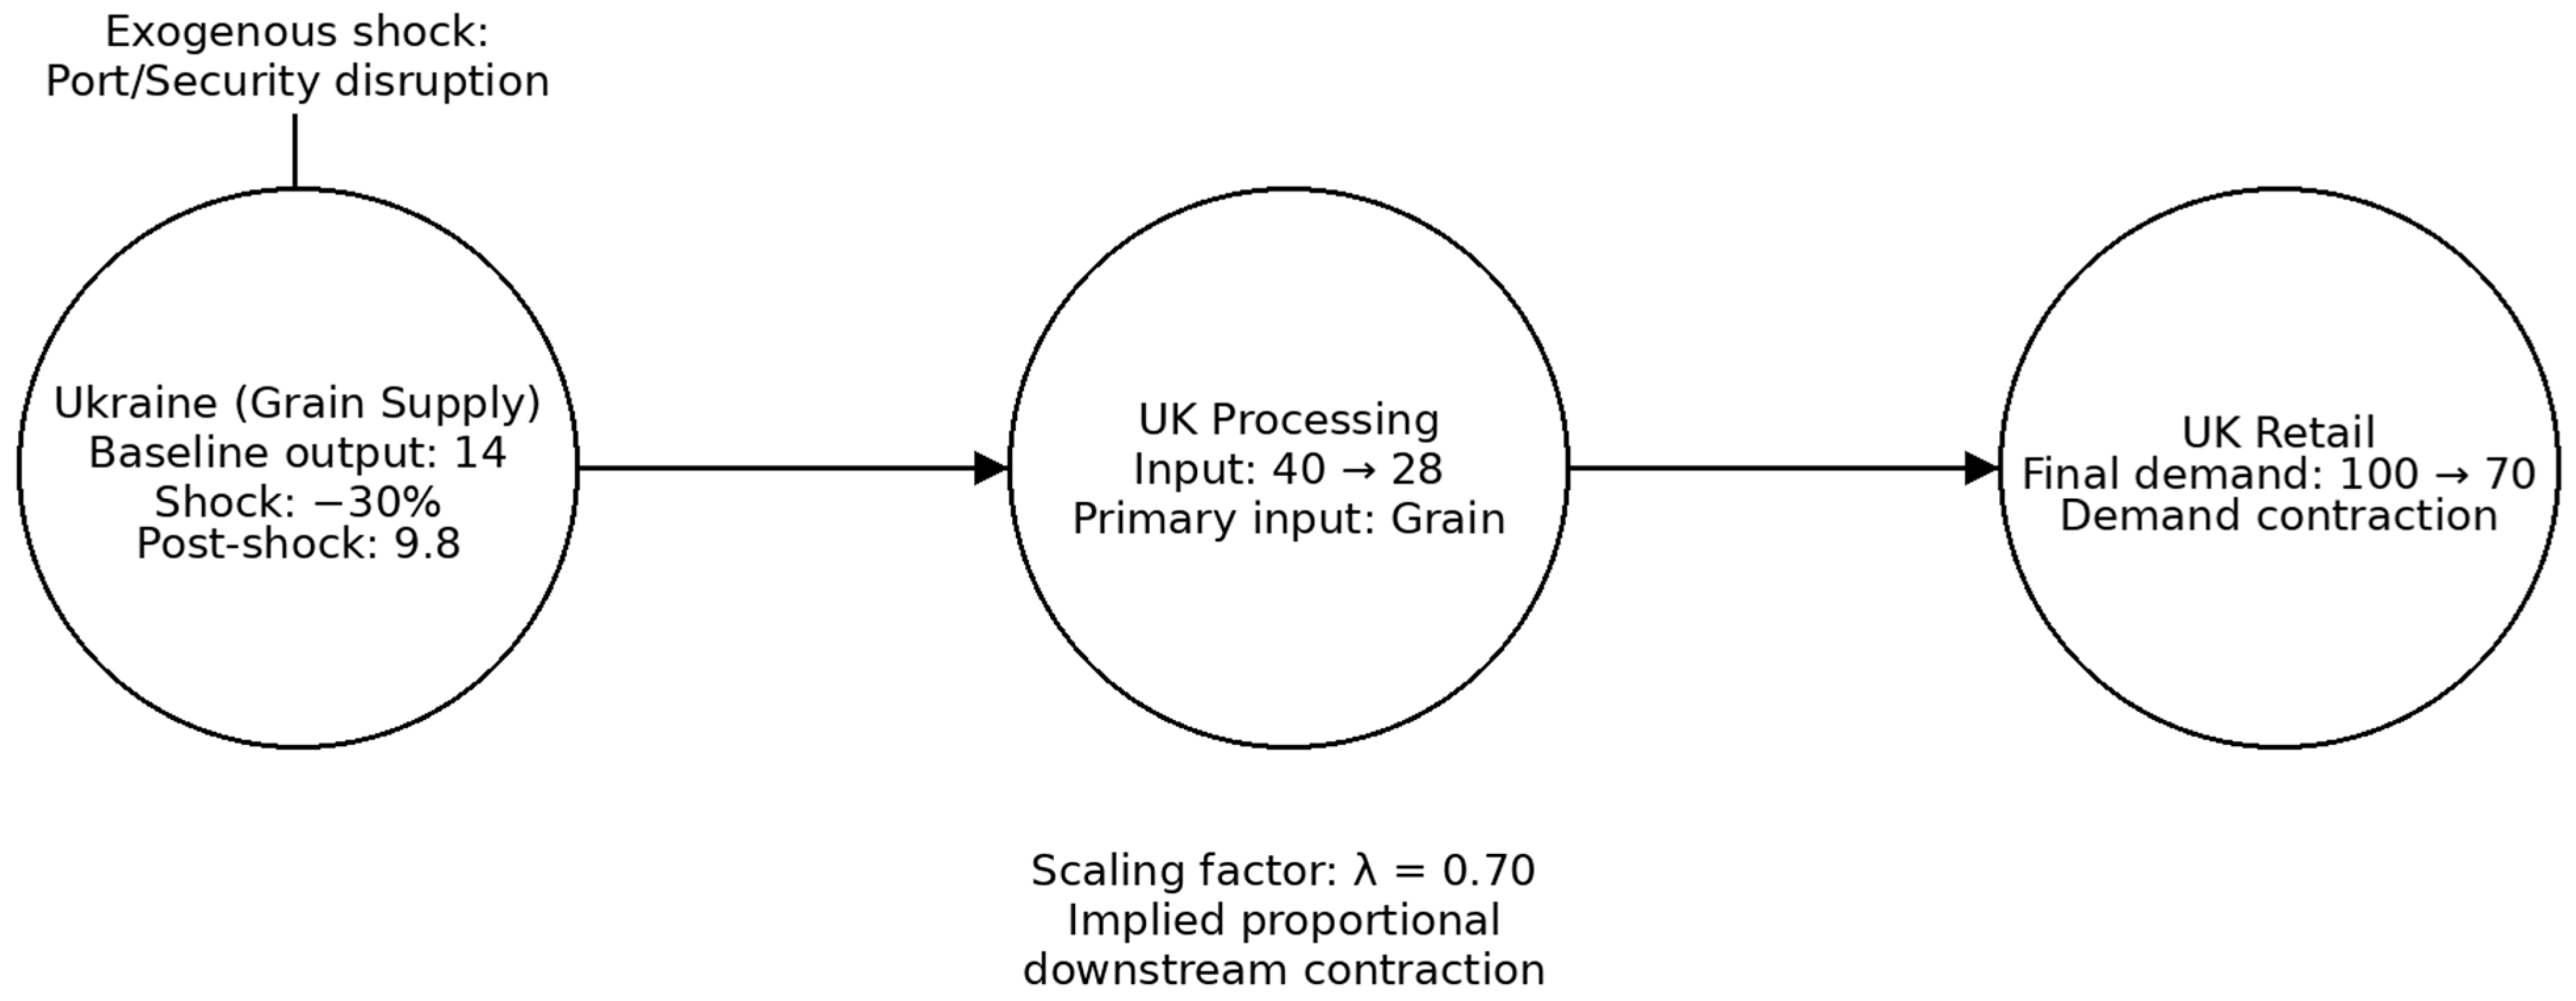
When fixed input coefficients bind, a standard closure is proportional rationing across downstream activities. The resulting scaling factor is
implying feasible output levels of
Figure 2 visualizes the network transmission of the export-capacity shock, emphasizing the central role of upstream constraints in shaping downstream outcomes. The disruption to Ukrainian grain exports propagates mechanically through fixed input–output linkages, generating proportional contractions in UK processing and retail output despite unchanged downstream productive capacity.
It is important to emphasize that the contraction in this simple example is proportional once the constraint binds. The nonlinear feature is not the proportional rationing rule itself, but the threshold transition from an unconstrained regime to a constrained regime. Below the capacity threshold, downstream output is unaffected by small upstream disturbances; once the threshold is crossed, the same type of disturbance generates an abrupt reduction in feasible downstream production. Thus, the example illustrates a kinked, capacity-driven response rather than a continuously nonlinear production function.
Thus, a contraction in Ukrainian grain export capacity translates directly into a shortfall in UK retail food supply, even though downstream processing capacity remains intact. This outcome reflects the presence of binding upstream input constraints within the agricultural GVC. Consistent with recent reporting on attacks affecting Black Sea grain shipments, this transmission channel reflects observed risk dynamics rather than a purely hypothetical mechanism.
3.1.4. Shock B: Rerouting Raises Trade Costs → Price Pass-Through in UK Food
While capacity disruptions affect quantities directly, trade-related risks may also operate through prices. This subsection introduces an increase in trade costs associated with rerouting, higher insurance premia, and logistical delays, modeled as an increase in iceberg-type transport costs. The focus here is on cost transmission rather than physical shortages. Under Leontief production, higher delivered input prices translate mechanically into higher unit costs in downstream sectors. The analysis therefore illustrates how geopolitical risk and transport frictions can generate food price inflation in importing countries even in the absence of binding quantity constraints. We therefore extend the baseline model by incorporating trade costs into unit production costs and trace the resulting price transmission along the value chain.
To incorporate price effects arising from trade frictions, we extend the framework to include delivered input prices. Let
denote the world price of Ukrainian grain, and let
represent an iceberg trade-cost factor capturing transport costs, insurance premia, and routing delays. The delivered price of grain to the UK is therefore given by
Under Leontief technology, the unit cost of food processing in the UK can be expressed in dual form as
where
aggregates domestic value-added components, including labor costs, energy inputs, and operating margins.
Taking the benchmark international wheat price to be approximately
USD per bushel (
Trading Economics, 2026), and considering an increase in trade costs from
to
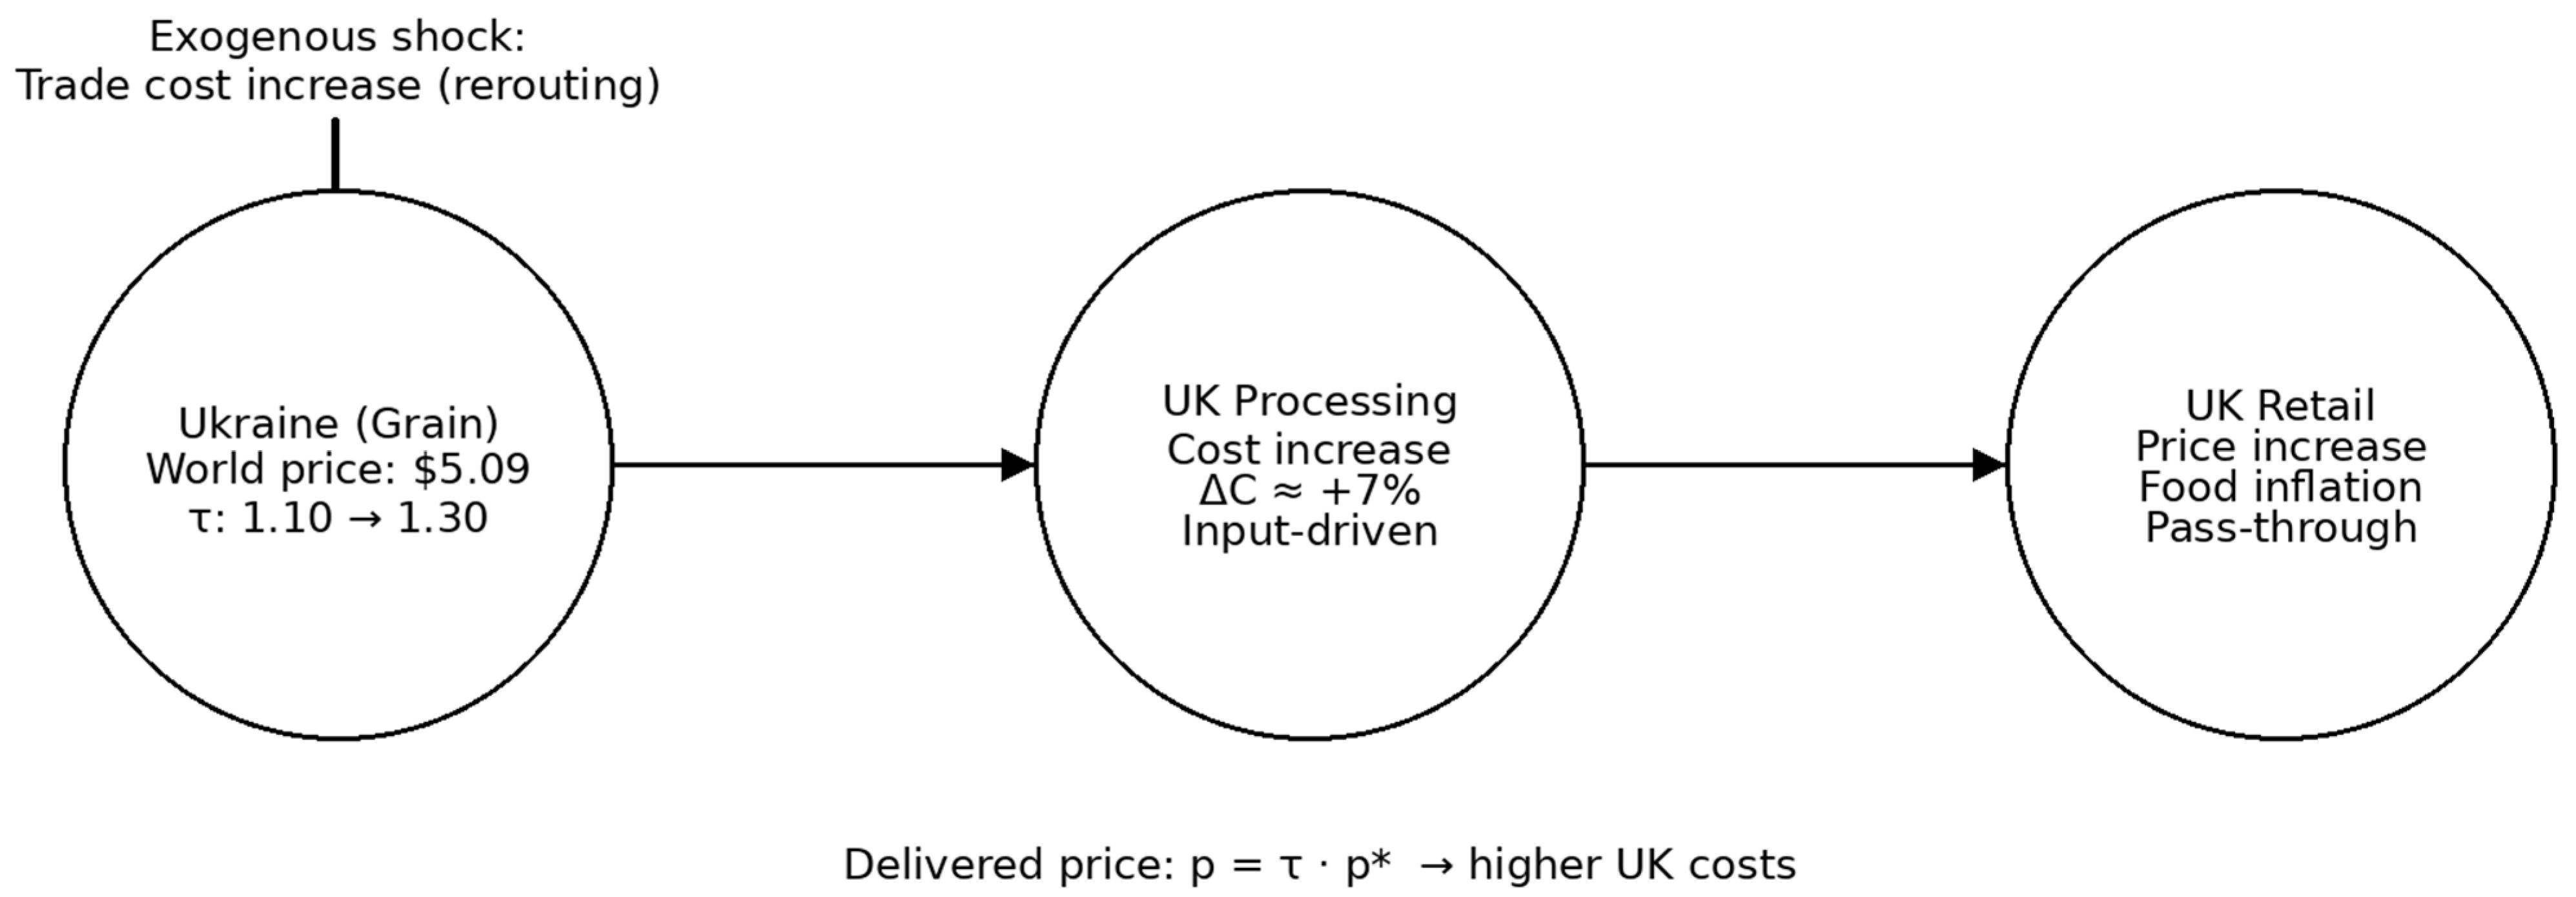
due to elevated risk, insurance costs, and rerouting, the delivered price rises from
implying an increase of
The corresponding pass-through into processing unit costs is therefore
This calculation illustrates that, even in the absence of binding quantity constraints, heightened corridor risk and rerouting pressures mechanically translate into higher food-processing costs—and ultimately food price inflation—through fixed input shares embodied in agricultural GVCs.
Figure 3 illustrates the propagation of a trade-cost shock through the stylized three-node agricultural value chain. An increase in the iceberg trade-cost factor raises the delivered price of Ukrainian grain to the UK, which, under fixed-proportions production, translates directly into higher unit costs in food processing and subsequent price increases at the retail level. Unlike quantity-constrained scenarios, this mechanism operates through linear cost pass-through under the maintained Leontief cost structure. It should therefore be interpreted as a price-transmission channel rather than as evidence of nonlinear output adjustment.
3.1.5. Fertilizer Constraints as an Upstream Amplification Channel
The final subsection considers fertilizer availability in Ukraine as an endogenous upstream constraint that amplifies both export capacity shocks and trade-cost pressures. By linking agricultural output capacity to fertilizer inputs, the framework captures a critical structural feature of modern agriculture: strong dependence on imported and infrastructure-intensive intermediate inputs. The analysis highlights how fertilizer shortages can depress production capacity over multiple periods, tightening export constraints and increasing vulnerability to trade disruptions. In this sense, fertilizer constraints operate as a medium-term amplification channel that reinforces both quantity shortfalls and price pressures throughout the agricultural GVC. This channel is captured by allowing upstream agricultural capacity to depend on fertilizer availability, which we formalize and integrate into the shock analysis below.
Ukrainian grain production itself is contingent on the availability of critical upstream inputs, most notably nitrogen-based fertilizers, as well as on functioning transport and processing infrastructure. To capture this dependence in a parsimonious manner, we allow effective agricultural capacity to vary with fertilizer availability. Specifically, let feasible grain output satisfy
where
denotes pre-disruption capacity and
represents an input-availability index. Fertilizer availability is parameterized as
with
capturing the sensitivity of agricultural capacity to fertilizer disruptions.
The fertilizer-sensitivity parameter should be interpreted as an illustrative scenario parameter rather than as an empirically estimated elasticity. The present study does not estimate the causal effect of fertilizer availability on Ukrainian agricultural output. Instead, the parameter is used to represent, in reduced form, the possibility that fertilizer shortages lower effective upstream agricultural capacity and thereby amplify downstream disruptions. A full empirical calibration would require crop-specific fertilizer-use data, fertilizer-price and import data, agronomic yield-response estimates, and observed production outcomes over time. The illustrative specification is therefore intended to clarify the mechanism, not to quantify its realized magnitude.
Recent assessments indicate that Ukraine exhibits import dependence exceeding 60 percent for nitrogen fertilizers and that critical ammonia infrastructure, including the Togliatti–Odesa pipeline, remains non-operational under war conditions. These features render fertilizer availability particularly vulnerable to logistical and geopolitical disruptions, thereby increasing the likelihood of persistent capacity constraints.
Consequently, while port and security disruptions primarily affect export flows in the short run, fertilizer shortages operate as a medium-term amplification mechanism by depressing harvest and export capacity across production cycles. Together, these channels jointly tighten effective grain supply and raise trade costs , reinforcing both quantity shortages and price pressures along agricultural GVCs.
3.1.6. Sensitivity Analysis and Scenario Comparison
To assess whether the illustrative results depend on a single parameterization, we conduct a simple sensitivity analysis around the baseline three-node chain. The exercise varies four key assumptions: the grain input coefficient in UK food processing, the magnitude of the Ukrainian export-capacity shock, the iceberg trade-cost factor, and the fertilizer-sensitivity parameter. The sensitivity analysis is not intended to validate the model empirically. Its purpose is to show whether the qualitative mechanism depends on a single numerical assumption. Across scenarios, the central result is unchanged: when upstream capacity is sufficient, shocks operate primarily through costs; when upstream capacity becomes binding, downstream quantities must adjust.
Three scenarios are considered. The low-disruption scenario assumes a smaller export-capacity loss and a moderate increase in trade costs. The baseline scenario corresponds to the parameterization used above. The high-disruption scenario combines a larger export-capacity loss, stronger trade-cost increases, and more severe fertilizer constraints. Comparing these scenarios clarifies that downstream outcomes are highly sensitive to upstream capacity assumptions once the binding-constraint threshold is crossed.
The results confirm that the model’s quantitative implications are coefficient-dependent. However, the qualitative mechanism is robust: when upstream agricultural capacity remains sufficient, final demand can be met with higher costs; when upstream capacity becomes binding, downstream output must adjust. This distinction between cost pass-through and quantity rationing is central to the proposed framework.
Table 3 presents the alternative disruption scenarios used to assess the sensitivity of the results. The scenarios vary the magnitude of the export-capacity loss, the trade-cost factor, and the severity of fertilizer-related input constraints. The purpose is to show how the model behaves under low-, baseline-, and high-disruption assumptions, rather than to estimate the realized economic impact of the Ukraine-related shocks.
The scenario comparison also illustrates the quantitative implications of the alternative assumptions. Under the maintained proportional-rationing closure, a 10 percent reduction in effective upstream grain capacity implies a scaling factor of 0.90, reducing feasible retail output from 100 to 90 units and generating an implied final-demand shortfall of 10 units. In the baseline case, the 30 percent capacity loss lowers the scaling factor to 0.70, so feasible retail output falls to 70 units and the implied shortfall rises to 30 units. In the high-disruption scenario, the 50 percent capacity loss reduces feasible retail output to 50 units, implying a 50-unit downstream shortfall. The trade-cost assumptions generate a parallel price channel: using the benchmark wheat price of USD 5.09 per bushel, an iceberg factor of 1.10 implies a delivered price of approximately USD 5.60 per bushel, while factors of 1.30 and 1.50 imply delivered prices of approximately USD 6.62 and USD 7.64 per bushel, respectively. Relative to the low-disruption trade-cost factor, the baseline and high-disruption assumptions therefore imply delivered-price increases of approximately 18.2 percent and 36.4 percent. These figures show how alternative assumptions about upstream capacity and trade frictions translate into downstream quantity rationing and price pass-through within the model.
3.2. Requirements for Empirical Calibration
A full empirical implementation of the framework would require replacing the stylized coefficient matrix with observed country-sector input–output coefficients from a multi-regional input–output database. Existing databases provide different but complementary routes for such calibration. WIOD offers transparent country-sector input–output tables that are well suited for tracing value-added and intermediate-input linkages across advanced and major emerging economies. OECD ICIO provides a globally consistent framework for mapping production, consumption, investment, and international trade flows by country and activity. EORA offers broader country coverage and high-resolution MRIO information, which may be useful when the analysis requires inclusion of smaller or lower-income economies. GTAP is particularly useful for policy simulation because it combines input–output structure with bilateral trade, protection, and sectoral detail, including agricultural and food-related sectors. In an empirical extension of the present framework, these databases could be used to construct the technical-coefficient matrix, recover the Leontief inverse, and identify the relevant upstream and downstream agricultural nodes. Bilateral agricultural trade data, fertilizer-use data, energy-price indicators, transport-cost measures, insurance premia, export-volume data, and observed output or price responses could then be used to calibrate the shock parameters. The present paper therefore provides the analytical structure for such an exercise, but it does not claim to estimate the realized economic impact of Ukraine-related disruptions. The numerical results should be interpreted as scenario-based illustrations of how assumptions about upstream constraints, trade frictions, and input dependence alter shock transmission through a fixed-coefficient agricultural value chain.
4. Discussion
This paper presented a stylized network-Leontief framework for analyzing agricultural GVCs under fixed input coefficients, trade frictions, and capacity constraints. The numerical application should be interpreted as an illustration of mechanisms rather than as empirical evidence. Within this limited scope, the framework clarifies how upstream input constraints and trade-cost shocks can propagate through a fixed-coefficient agricultural value chain. The results are therefore best understood as analytically consistent with existing IO and GVC theories, rather than as an empirical test of competing claims about GVC integration and resilience. This interpretation is consistent with recent food-trade network studies showing that resilience depends on the topology of trade relationships, the availability of substitute suppliers, and the concentration of critical commodities, rather than on trade openness alone.
A first implication of the framework is that amplification effects may arise when upstream capacity constraints bind in a fixed-coefficient production network. The analysis does not imply that all agricultural GVCs are inherently fragile under all conditions. Rather, it identifies structural conditions under which vulnerability is more likely: limited input substitutability, concentrated upstream supply, binding logistical constraints, and weak availability of critical inputs such as fertilizer. This result aligns with network-based macroeconomic studies emphasizing the amplification role of input–output linkages (
Acemoglu et al., 2012;
Baqaee & Farhi, 2019), and extends them to the agricultural context, where fixed coefficients and biological constraints further limit short-run adjustment. In contrast to manufacturing sectors, where firms may re-optimize input mixes or switch suppliers more flexibly, agriculture exhibits binding input bottlenecks that make quantity adjustments abrupt rather than gradual.
The Ukraine–United Kingdom illustration demonstrates this mechanism in a simplified numerical setting. Export disruptions at Black Sea ports reduce effective grain supply, which mechanically constrains UK food processing and retail output under Leontief technology. This finding complements recent empirical work documenting how transport insecurity and export restrictions exacerbate food shortages and volatility in importing countries (
Headey & Fan, 2008;
Bellemare, 2015). Importantly, the framework shows that these effects do not depend on price spikes alone: physical constraints are sufficient to generate downstream shortages, even when nominal demand and processing capacity remain unchanged.
A second important result concerns the distinct but interacting roles of quantity and price channels. While capacity shocks directly limit feasible output, increases in trade costs associated with rerouting, insurance premia, and delays propagate through prices. Under fixed-proportions production, higher delivered input costs are passed through linearly into downstream unit costs, contributing to food price inflation in importing countries. This result is consistent with earlier analyses of trade-cost pass-through in GVCs (
Baldwin & Lopez-Gonzalez, 2015;
FAO, 2018), but the present framework highlights why agriculture is particularly sensitive: high transport intensity, perishability, and cold-chain dependence raise the elasticity of unit costs with respect to trade frictions. Thus, even in the absence of binding quantity constraints, geopolitical risk can materially affect food affordability.
The analysis further underscores the amplifying role of fertilizer constraints as a medium-term vulnerability. Unlike port disruptions, which may fluctuate with security conditions, fertilizer shortages affect production capacity over multiple seasons. By linking agricultural output capacity directly to fertilizer availability, the model captures an endogenous mechanism through which upstream input disruptions magnify both quantity shortfalls and price pressures. This finding resonates with recent concerns regarding fertilizer markets and energy–agriculture linkages (
FAO, 2018;
Headey et al., 2022), and suggests that resilience assessments focusing solely on trade routes or export volumes may substantially underestimate systemic risk.
Taken together, the framework suggests a way of organizing the debate on GVC integration and resilience, although adjudicating between competing empirical claims requires calibrated data and econometric or simulation-based validation. In agricultural GVCs characterized by fixed coefficients and concentrated upstream inputs, integration may instead increase exposure to systemic shocks by tightening technological and logistical interdependencies. This perspective helps reconcile empirical findings that alternately emphasize buffering and amplification effects of global trade (
Antràs & Chor, 2013;
Acemoglu et al., 2012).
From a policy standpoint, the framework suggests several implications, but these implications must be interpreted conditional on the assumptions embedded in the stylized application. In particular, the results depend on fixed input coefficients, limited short-run substitutability, exogenous capacity constraints, and a proportional-rationing closure once upstream constraints bind. Within that analytical environment, food-security strategies should look beyond aggregate trade openness and examine input-specific vulnerabilities, especially fertilizer, energy, and logistics. Maintaining physical redundancy—through alternative export corridors, strategic input stocks, or domestic and regional fertilizer capacity—may be particularly valuable when critical upstream nodes are difficult to substitute in the short run. Likewise, the distinction between price and quantity channels implies that policies aimed only at dampening inflation may not address the underlying physical constraint during severe disruptions. These policy insights should therefore be read as analytically grounded hypotheses for future empirical testing rather than as direct estimates of policy effects.
Finally, the paper opens several avenues for future research. The present framework is intentionally parsimonious and static; extending it to a dynamic, multi-period setting would allow the study of inventory adjustment, planting decisions, and intertemporal substitution. Incorporating probabilistic shocks and endogenous network reconfiguration could further enrich resilience analysis. Empirically, calibrating the model using detailed multi-regional input–output tables and sector-specific elasticities would enable quantitative assessments of policy counterfactuals. These extensions would build naturally on the analytical core developed here.
5. Conclusions
This paper has developed a stylized network-Leontief framework for organizing the analysis of agricultural GVCs under fixed input coefficients, trade frictions, and capacity constraints. The framework is not proposed as a new input–output methodology, nor does the numerical application constitute an empirical calibration. The numerical findings should therefore be read as scenario-based illustrations of transmission mechanisms, not as empirical estimates. Its contribution is to clarify how upstream input dependence, trade-cost shocks, and binding capacity constraints can be represented within a transparent production-network structure.
The main analytical insight is that agricultural GVC vulnerability depends on the interaction between network position, input substitutability, and effective upstream capacity. When critical upstream nodes remain unconstrained, shocks may operate primarily through cost pass-through. When those nodes become capacity-constrained, downstream output must adjust through rationing or unmet final demand. Fertilizer availability is treated within this framework as a plausible amplification channel, but the relevant sensitivity parameter is illustrative and would need to be estimated in future empirical work.
The most important next step is empirical calibration. Future research could implement the framework using WIOD, OECD ICIO, EORA, or GTAP, combined with agricultural trade data, fertilizer-use data, transport-cost indicators, insurance premia, and observed price or production responses. Such calibration would allow the framework to move from scenario-based illustration to quantitative assessment of policy counterfactuals. In this sense, the paper provides a tractable analytical foundation for future empirical work on agricultural GVC resilience, food-security risks, and the design of more robust international agri-food systems. Also, future research should extend the framework by incorporating substitution elasticities, endogenous price adjustment, inventory behavior, supplier switching, and optimization under uncertainty, ideally within a calibrated multi-regional input–output or computable general-equilibrium setting.