Article

Working Conditions and Job Values in the Chinese Labor Market

School of Economics and Management, Nanjing Tech University, Nanjing 211816, China
Economies 2026, 14(7), 249; https://doi.org/10.3390/economies14070249
Submission received: 28 April 2026 / Revised: 29 June 2026 / Accepted: 29 June 2026 / Published: 3 July 2026
(This article belongs to the Section Labour and Education)

Abstract

As the world’s largest labor market, China exhibits a range of distinctive and, at times, puzzling employment phenomena. Using an online survey on working conditions and the best–worst scaling method across 13 dimensions of job values, this study examines variations in working conditions and job value preferences among Chinese workers. The results reveal systematic differences in working conditions, with workers holding second-generation urban hukou and college degrees from better universities enjoying superior job amenities, while female workers face some inferior job attributes. On average, monetary job benefits primarily influence job choice decisions, though job amenities also play a crucial role. Additionally, our findings demonstrate substantial heterogeneity in job values among individuals. Interestingly, expressed job preferences align with actual job choices, suggesting that job values are effective indicators of labor market dynamics. Understanding these variations in working conditions and job value preferences provides essential insights into the Chinese labor market.

1. Introduction

As the world’s largest labor market, China’s labor market exhibits a range of distinctive and often puzzling employment phenomena. On the one hand, the 996 system (working from nine to nine, six days a week) has been adopted increasingly by Chinese companies1, which has led to the emergence of significant labor-related phenomena, exemplified by the “Nei Juan” movements (Wang & Subramaniam, 2023). On the other hand, there is growing interest in a wider range of occupations and increasing competition for public sector jobs (Li et al., 2023), which offer stable, good welfare, usually a relaxed work pace, and a high social status. Lastly, with the rapid growth of China’s digital economy, flexible employment is highlighted as a key area for creating job opportunities. According to China’s Ministry of Human Resources and Social Security, the number of flexible workers in China will reach about 200 million by the end of 2021. To understand these labor market phenomena, evaluating workers’ actual working conditions and job values is vital for policymakers designing effective employment strategies, especially amid rising unemployment.
To elicit workers’ preferences for job attributes, traditional empirical approaches often rely on hedonic pricing frameworks or discrete choice experiments; however, these methods frequently encounter empirical matching frictions or cognitive load constraints when evaluating numerous job attributes simultaneously. To address these difficulties, we introduce a best–worst scaling method to study overall workers’ job values. The best–worst scaling (BWS) method, introduced by Finn and Louviere (1992), is a specific type of stated preference method based on random utility theory (McFadden, 1973; Thurstone, 1927). BWS has some distinct advantages compared with other measurement approaches such as category rating scales or paired comparisons (Louviere et al., 2013). Respondents selected the best and worst options among alternatives in each question set, which provides richer information about the ranking of the choice options (Louviere et al., 2013). Notably, BWS Case 1 is typically straightforward for respondents (Marley & Louviere, 2005) and can be practical for measuring more objects than paired comparison methods. In particular, BWS can reveal both average job values and individual-level heterogeneity through person-specific parameters. Furthermore, this study also explores workers’ actual working conditions based on job attributes so as to test whether workers’ job values are actually related to their working conditions.
Consequently, this study fills important gaps in the existing literature. Our paper contributes to three strands of literature. Firstly, to the best of our knowledge, our study is the first attempt to describe Chinese workers’ working conditions. Concentrating on differences by gender, Hukou, education, and age, we find that job characteristics differ substantially across groups. Secondly, although recent studies show that there is considerable heterogeneity in individuals’ preferences for job attributes (Lavetti, 2023; Mas & Pallais, 2017), this study can draw an overall picture and segment the labor supply market using individual-level preference shares. Accounting for heterogeneous preferences acknowledges the well-documented reality that different individuals place different weights on amenities and wages (Eriksson & Kristensen, 2014). This information could help policymakers understand the growing interest in a wider range of occupations and the increasing competition for public-sector jobs (Li et al., 2023). Thirdly, this research also contributes to a strand of literature in labor economics that examines the relationship between job values and workers’ real choice of working conditions. Our results show that the stated preferences are partly consistent with their actual choice of working amenities, which can be a good indicator.

2. Literature Review

Although the theoretical relationship between job characteristics and wages has been well-established (e.g., Rosen, 1986), several important studies have sought to empirically analyze workers’ working conditions, their preferences for job attributes, and how their preferences play a significant role in job choice (Datta, 2019; Lavetti, 2023; Maestas et al., 2023; Mas & Pallais, 2017). It has long been recognized that wages do not fully reflect the compensation that individuals receive from working; workers typically considered many other job characteristics as well (Lavetti, 2023), and workers may be willing to sacrifice higher wages for better job characteristics when making job choices (Kniesner et al., 2012; Rosen, 1986). Further evidence has shown that working conditions in the United States vary (Maestas et al., 2023), and actual wage variation is consistent with workers’ stated preferences (Mas & Pallais, 2017). Thus, labor supply preferences for different job characteristics may shape how the labor market evolves (Datta, 2019).
Numerous studies have explored how to elicit workers’ preferences for job attributes. One approach is building on the theoretical framework for hedonic pricing in Rosen (1974). Some studies have found the hedonic utility model difficult to apply (Brown, 1980; Duncan & Holmlund, 1983; Gronberg & Reed, 1994; Oyer, 2008) because the equilibrium matching of jobs to workers reflects both workers’ and firms’ preferences and various labor market frictions prevent workers from matching with their most preferred job types (Wiswall & Zafar, 2018). Consequently, the equilibrium distribution of wage and non-wage amenity bundles generally does not align with workers’ underlying preferences (Hwang et al., 1998). To address this problem, choice and field experiments have recently been used to study workers’ preferences for working condition attributes (Mas & Pallais, 2017; Wiswall & Zafar, 2018). The choice experiment can be used to randomize the job characteristics on offer in a way that would be difficult to implement in the real labor market (Maestas et al., 2023). These studies show that workers are willing to accept significant wage reductions for job amenities (Mas & Pallais, 2017) and that workers have different preferences for amenities relative to wages (Lavetti, 2023; Maestas et al., 2023).
However, choice experiments make it difficult to draw an overall picture of preferences for many job attributes because the number of comparisons needed increases geometrically with the number of objects to be measured (Louviere et al., 2013). For example, Maestas et al. (2023) define nine core job attributes for workers, except for wages, including schedule flexibility, telecommuting, physical job demands, pace of work, autonomy at work, paid time off, working in teams, job training, and meaningful work. Asking individuals to choose from all possible pairs of objects is not feasible in a survey setting as the number of objects grows due to the increasing cognitive load, which is a clear weakness of the method of paired comparisons (Louviere et al., 2013). Although Maestas et al. (2023) solve the problem in a clever way, which lets respondents assume that any job attributes not explicitly described were identical across jobs, it is impossible to draw an overall picture of preferences for all core job attributes for workers. This information is important for identifying heterogeneity in job attribute preferences across gender, age, and education levels, as it reveals shifts in workers’ job values and enables predictions about labor supply changes.
Although some studies have explored workers’ preferences for job amenities (Mas & Pallais, 2017; Wiswall & Zafar, 2018), there was still a lack of a clear overall picture of job values. Based on the notion of value formulated by Rokeach (1973) and Gutman (1982), values were different from preferences because stable underlying values motivated consumers’ purchasing decisions (Gutman, 1982; Rokeach, 1973). Previous studies in the food marketing field have shown that values are the underlying factors driving consumers’ preferences and can help explain consumers’ food choice behavior more parsimoniously (Ellison et al., 2021; Lusk & Briggeman, 2009; Sun et al., 2023).
Previous studies also showed that individuals have substantial heterogeneity in preferences for job characteristics (Wiswall & Zafar, 2018). For example, women on average had a higher willingness to pay (WTP) for jobs with greater work flexibility and job stability, whereas men had a higher WTP for jobs with higher earnings growth (Wiswall & Zafar, 2018). Wiswall and Zafar (2018) found that high-achieving undergraduate women were willing to give up 7% of their pay to have a job with part-time hour options, while men were only willing to give up 1% of their wages. Therefore, it is valuable to examine workers’ job values and their heterogeneity in order to identify overall labor supply preferences and their market segments.
In summary, while the literature has established the theoretical link between wages and job attributes (Rosen, 1986), empirical estimation remains challenging due to market frictions in hedonic models (Hwang et al., 1998) and cognitive constraints in choice experiments (Louviere et al., 2013; Maestas et al., 2023). Furthermore, despite documented preference heterogeneity across worker demographics (Lavetti, 2023; Wiswall & Zafar, 2018), a cohesive framework capturing an overall picture of underlying job values is still lacking. This study bridges these gaps by applying the best–worst scaling approach to shift the analytical focus from specific preferences to stable underlying values.

3. Research Method

3.1. Survey Design

The best–worst scaling method, a form of stated preference (Finn & Louviere, 1992), was used to measure workers’ preferences for job values. In recent years, BWS methods have been used in a variety of research settings, including food value (Bazzani et al., 2018; Cerroni et al., 2022; Lusk & Briggeman, 2009), food attribute (Cohen, 2009), and food policy (Caputo & Lusk, 2022). In measuring human values, Lee et al. (2007) found that BWS produced better results than other rating scales. BWS reduces cognitive load and avoids the complexity of full-profile choices, leading to more accurate and reliable data (Flynn et al., 2007).
In this experiment, 13 job values, including wages and amenities, are described in Table 1. Following Maestas et al. (2023), who defined a set of core job attributes for workers, this study incorporated these job attributes, including schedule flexibility, telecommuting, physical job demands, pace of work, autonomy at work, paid time off, working in teams, job training, and meaningful work.
Furthermore, we also added wage level, job stability, medical and pension benefits, and innovation of work. Although workers typically consider many other job characteristics (Lavetti, 2023), wage is still an important factor in deciding which jobs to accept. Medical and pension benefits are forms of compensation provided by employers, in addition to salary, which cover healthcare costs and contribute to retirement funds for workers. Labor is willing to accept jobs with lower wages but with health insurance (Lavetti, 2023). A study in China also shows that respondents are willing to forgo approximately 1000 RMB of their starting monthly salary in exchange for commercial health insurance provided by their employer (Yan & Han, 2021). Job stability refers to the probability that an individual will retain their job without the risk of becoming unemployed. On average, individuals in the UK are willing to forgo approximately 55% of their hourly earnings to secure a permanent contract and 37.7% for a one-year contract, compared to a baseline of a one-month contract (Datta, 2019). Job stability, as indicated by the likelihood of being dismissed, is included due to the significant role of risk and uncertainty in job choices (Dillon, 2018) and gender differences in risk preferences (Croson & Gneezy, 2009). The innovativeness of work content refers to the potential within a job role to be enhanced or transformed through creative thinking and novel approaches. Many people believe that a repetitive job is automatically a boring job (Shackleton, 1981), but greater creativity in one’s work has positive associations with health (Mirowsky & Ross, 2007).
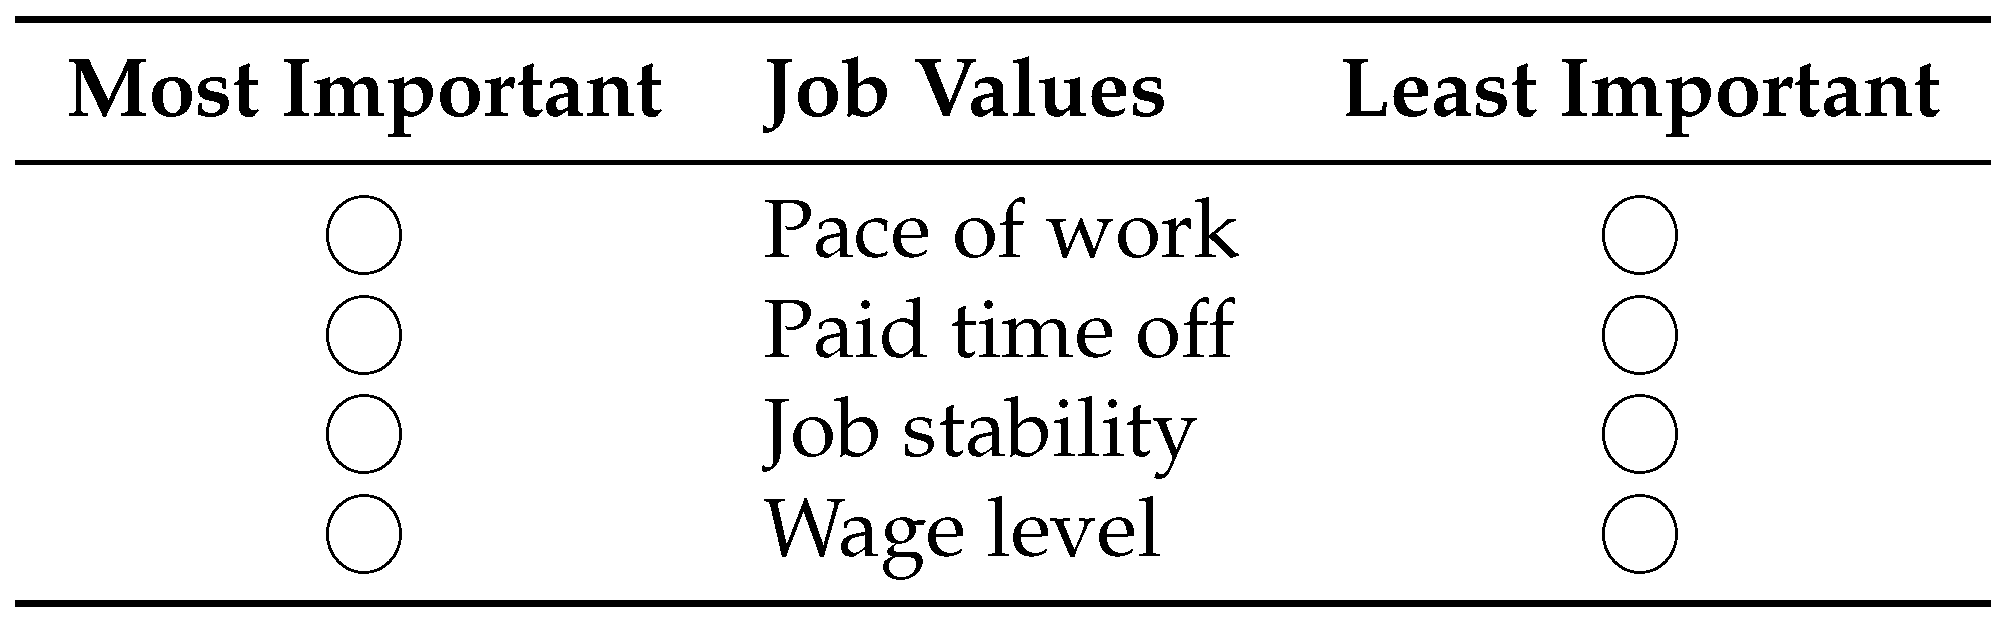
Each respondent indicated their “most important” and “least important” choices among the 13 job values when selecting a job. As a Case 1 BWS study, which has been introduced clearly by Louviere et al. (2013), we used a balanced incomplete design (BIBD) for the construction of choice sets. BIBD is a design category that assigns a subset of treatments to each block (Auger et al., 2007). As in previous studies (Jaeger et al., 2009; Wang et al., 2011), BIBD resulted in 13 choice sets, each containing four subsets of job values, with each job value appearing four times in 13 scenes. The order of the choice sets was randomized across participants. An example of the best–worst scaling set is shown in Figure 1.
In the survey, respondents were also asked to describe characteristics of their working conditions, following a design similar to that of Maestas et al. (2023). This design can help us compare working conditions between American and our sampled urban workers. In addition, respondents’ sociodemographic characteristics were also collected. Before the launch of the survey, a small pilot survey was conducted offline and respondents were asked to provide feedback on the clarity of the questions, and no issues were raised.

3.2. Data Collection

From July to September 2024, we engaged Wenjuanxing, a leading online survey company in China with a panel of 2.6 million respondents, to collect data. Several measures were implemented to ensure the quality of the survey. Firstly, each questionnaire was restricted to a single IP address, computer, and account. Secondly, all participants were employed full-time. Lastly, to identify inattentive respondents (Gao et al., 2016), we utilized a “trap question” method. This involved requiring participants to re-enter previously submitted personal information at the beginning of the survey, thus ensuring consistency with their earlier responses. After excluding respondents who failed the trap questions and those with incomplete responses, 622 valid observations were obtained for the final analysis.
Table 2 shows the sample characteristics, detailing gender, age, university type, and hukou status. The sample consists of 54.66% female respondents, exceeding the national proportion of 48.81%, while male respondents represent 45.34%, slightly below the national average of 51.19%. Regarding age distribution, respondents under 29 years constitute 19.77% of the sample, and those aged between 29–35 years and over 35 years account for 58.52% and 21.70%, respectively. The distribution of workers who graduated from different university classifications within the sample includes 19.61% from Tier 3 and below universities, 45.34% from Tier 2 universities, 13.83% from Non-Double First-Class Tier 1 universities, and 21.22% from Double First-Class universities. Additionally, the hukou status reveals that 31.99% of respondents hold a Rural Hukou, 26.69% possess a First Generation Urban Hukou, and 41.32% have a Second Generation Urban Hukou.

3.3. Econometric Model

In evaluating the responses to each best–worst question, we assume that respondents simultaneously select the pair of items that maximizes the difference between the best and worst choices. This is known as the maximum difference (maxdiff) model. This probabilistic model, introduced by Finn and Louviere (1992), is widely regarded as appropriate for the Case 1 best–worst scaling (BWS) approach (Louviere et al., 2015). Previous studies (Flynn, 2014; Louviere et al., 2015; Scarpa et al., 2011) demonstrate that separately estimating best and worst values can introduce bias due to error variance differences. Consequently, we employ the maxdiff model to assess workers’ preferences for job values.
In this study, we apply the maxdiff model to assess workers’ preferences for job values. According to random utility theory (McFadden, 1973) and Lancaster’s consumer theory (Lancaster, 1966), the utility U n j t for respondent n selecting alternative j in choice set t can be decomposed into a systematic component V n j t and an unobserved error term ε n j t :
U n j t = V n j t + ε n j t .
In BWS experiments, the choice depends on the pair of alternatives that maximizes the utility difference, where respondents choose j as best and k as worst if U n j t U n k t > U n l t U n m t for all j l and k m .
Following Lusk and Briggeman (2009), the observable importance of value j is represented by λ j , and the unobservable importance for respondent n is I n j = λ j + ε n j . Using a multinomial logit (MNL) model, the probability that respondent n selects j as best and k as worst among J ( J 1 ) pairs is given by:
P n j k = e λ j λ k l = 1 J m = 1 J e λ l λ m .
To account for heterogeneity in job values among respondents, we also employ the random parameters logit (RPL) model (Train, 2009). In the RPL model, the importance parameter λ n j that varies for each respondent n can be specified as follows:
λ n j = λ j + σ j u n j ,
where λ j and σ j represent the mean and standard deviation of λ i , respectively, and u n j is a normally distributed random error term with mean zero and unit standard deviation. The RPL model is estimated by maximizing a simulated log-likelihood function (Train, 2009). Once the RPL parameters are estimated, individual-specific estimates can be obtained by using these parameters as priors and incorporating each respondent’s actual choices to form posterior estimates (Huber & Train, 2001).
Following Lusk and Briggeman (2009), we calculate the share of preference S i for each value j as follows:
S i = e λ j k = 1 J e λ k .
Each share represents the forecasted probability of the corresponding value being chosen as the most important. We utilize the R packages mlogit and bws.sp to estimate the RPL model and the preference shares for job values based on individual-specific parameters, which have been clearly introduced by Hideo Aizaki and James Fogarty2.

4. Results

4.1. Wage Differentials Across Demographic Groups

Table 3 presents mean wages for full samples and by gender, Hukou, school type, and age. The mean annual wage in the sample is 130,500 yuan. Mean wages vary substantially by gender, Hukou, school type, and age, ranging from 91,700 yuan for those who graduated from Tier 3 and below universities to 185,700 yuan for those who graduated from Double First-Class Universities.
Estimating wage differentials jointly in a linear regression, we find that women’s wages are on average 8.6% lower than men’s. Individuals with a first-generation urban hukou earn 14.6% more than those with a rural hukou, while those with a second-generation urban hukou earn 24.8% more. Workers who graduate from Tier 2 universities earn 20.7% more than those from Tier 3 and below universities, workers who graduate from Non-Double First-Class Tier 1 universities earn 32.8% more, and graduates from Double First-Class Universities earn 58.3% more. Age also plays a role, with individuals aged 29–35 earning 17.9% more than those below 28 and those above 35 earning 12.9% more than those below 28.

4.2. Heterogeneity in Working Conditions in the Chinese Labor Market

We use survey data on the dimensions of job attributes outlined in Section 3 to examine the variation in working conditions across workers of different demographics and wage levels (Table A1 and Table A2). Furthermore, using ordered-logit models with job attributes as dependent variables and gender, hukou, education, and age as independent variables, we find that there are significant differences in working conditions across groups after accounting for differences in other demographic characteristics. Workers with second-generation urban hukou and better-graduated universities have uniformly better job amenities among almost all categories. Females tend to have somewhat worse job attributes than males.
From Table 4, we can observe that females tend to work in jobs that are less physically demanding. They are more likely to have their work schedules set by their company with no possibility for changes, and they are also less likely to get an innovative job. Women also face fewer opportunities for remote work and are less likely to work in teams. Comparing the working conditions of female workers in America (Maestas et al., 2023), our results show that women in both countries work in less physically demanding jobs and are less likely to work in teams. However, female workers in China are more likely to have fixed work schedules dictated by their companies and face fewer opportunities for remote work. Additionally, they are less likely to hold innovative jobs than male workers. This implies the need for more flexible and supportive work environments for women.
Table 4 also shows that compared to workers under 28 years old, workers aged between 29 and 35 have more control over their schedule, paid time off, social value of work, job stability, and innovation of work. Workers aged above 35 are less likely to work in a team but have more job stability. Comparing with the working conditions of older workers in America (Maestas et al., 2023), older workers generally enjoy greater job stability in both countries.
Unlike Maestas et al. (2023), who document large and robust differences in job characteristics by college degree status, our results in Table 4 reveal that graduates from more prestigious universities enjoy superior job amenities across a broad range of dimensions. Overall, compared to workers who graduated from Tier 3 and below universities, graduates from Double First-Class universities are more likely to be associated with better job characteristics across nearly all dimensions examined. Workers who graduated from higher-tier universities have greater control over their schedules, more paid time off, better access to job training, greater job stability, more innovative work content, and lower physical demands. The findings suggest that in the Chinese labor market, the prestige of the university attended plays a crucial role in determining the quality of job conditions.
Interestingly, workers with first-generation urban Hukou exhibit no significant differences in most working conditions, but workers with second-generation urban Hukou have significantly fewer physical job demands and are less likely to work in teams. They are also more likely to have paid time off and job stability. It indicates the significant influence of the Hukou system, with rural Hukou holders facing discrimination in both labor and housing markets (Kuang & Liu, 2012; Pi & Zhang, 2016) and a lasting impact evident in inequalities that extend to subsequent generations (Afridi et al., 2015).

4.3. The Value Structure of Job Attributes

Table 5 compares the results of the multinomial logit (MNL) and random parameters logit (RPL) models. Using the best–worst scaling (BWS) approach to assess the relative importance of various attributes, we designated telecommuting—deemed least important—as the baseline. The RPL model surpasses the MNL model in performance, as indicated by lower Akaike Information Criterion (AIC) and Bayesian Information Criterion (BIC) values, signifying a more precise fit. Additionally, the Adjusted McFadden’s R 2 value for the RPL model stands at 16.77%, almost double the 9.60% observed for the MNL model, reflecting its superior explanatory power. The statistically significant standard deviations of the job value parameters further reveal individual-level heterogeneity in job preferences.
Using the RPL estimates, we evaluated the 13 job values by determining their individual preference shares. Table 6 details these shares, ranked from highest to lowest in importance.
Overall, wage level is the most important job value, with a preference share of 51.74%. Medical and pension benefits account for 12.28% of the preference share, which is consistent with previous studies that workers are willing to accept jobs that pay less but offer health insurance (Lavetti, 2023) because health insurance and pension plans provide long-term financial security. If we consider other monetary job benefits—medical and pension benefits—the combined preference shares of monetary job benefits account for approximately 64.02%. This result is different from Maestas et al. (2023), who show that non-wage attributes play a central role in job choice and compensation.
Comparing the value of non-monetary job attributes, the results show that job stability, with a share of 15.94%, is the most valued. This significant share reflects the strong preference for job security, indicating that workers prioritize stable employment conditions highly. It is consistent with previous studies that although the proportion of self-employment has risen significantly over the past two decades and there has been a notable rise in alternative work arrangements (Katz & Krueger, 2019), workers in both the UK and the US still value job security (Datta, 2019).
The share of preference for paid time off is 2.52%, which is consistent with previous research showing that paid time off is a strong predictor of job choice and that a certain amount of paid leave is equivalent to a notable increase in wages (Maestas et al., 2023). With a preference share of 1.58%, autonomy is valued more than attributes such as pace of work (1.85%), schedule flexibility (3.60%), and job training (1.91%). The value placed on autonomy at work reflects a growing trend in the modern workplace toward more flexible and empowering work environments. As work becomes more complex and knowledge-based, providing workers with autonomy can lead to more innovative and efficient outcomes. Previous studies have also shown that job autonomy is significantly related to job satisfaction and performance (Saragih, 2015). It is also consistent that the majority of workers do not value scheduling flexibility (Mas & Pallais, 2017), and young people are usually attracted to fast-paced jobs (Li et al., 2023).
The combined preference shares for the social value of work, working in teams, innovation of work, physical job demands, and telecommuting are around 10%, indicating these values are less prioritized in job selection. Despite their recognized benefits, such as increased productivity from teamwork (Lazear & Shaw, 2007) and the rising trend of remote work (Oettinger, 2011), these job values play a smaller role in workers’ job decisions.

4.4. Heterogeneity of Job Values

To identify the heterogeneity of job values, we compare individual values across groups in Table A3, then we applied Ward’s linkage cluster analysis to group workers by their job values and inspected the dendrogram to determine where natural groupings emerged. Table 7 shows the relative importance of job values across the three identified classes. This study confirms that there are substantial and heterogeneous preferences for job amenities values, which is consistent with previous studies (Mas & Pallais, 2017; Wiswall & Zafar, 2018).
Group 1 places overwhelming importance on wage level, which constitutes 80.78% of their valuation. This group represents workers who prioritize immediate financial rewards above all other job attributes. Therefore, this group can be called “Wage-Focused Workers”. Group 2 has a more balanced job value profile. Although they place a notable emphasis on wage level (51.29%), they also value job stability (18.88%) and medical and pension benefits (12.57%) significantly. This group represents workers who seek a balance between financial compensation and job security, without entirely disregarding other job attributes. Therefore, this group can be named “Balanced Compensators”. Group 3 places the highest importance on job stability, which accounts for 23.26% of their valuation. Therefore, this group can be named “Stability Seekers”.

4.5. The Consistency of Actual Working Conditions and Job Values

Our data allow us to investigate the consistency between respondents’ actual working conditions and their values of job attributes by testing whether individuals who have selected jobs with specific amenities value those amenities more. To do so, Table A4 presents the results of ordered logit models exploring workers’ actual working conditions and their values for various job attributes. The independent variables are the actual working conditions of the workers, and the dependent variables are the values assigned to each job attribute and demographic characteristics.
We find substantial evidence that individuals who have selected jobs with specific amenities disproportionately value those characteristics, except for wage level, job stability, pace of work, and working in teams3. This suggests that stated preferences indeed reflect actual preferences in the labor market (Maestas et al., 2023). Therefore, workers’ job values can be a good predictor of their selection in real jobs and can be a survey tool for the labor market.

5. Discussion and Conclusions

As the world’s largest labor market, China’s labor market is undergoing rapid transformation and presents a range of complex employment phenomena. In this paper, we provide a comprehensive picture of working conditions and job value preferences among Chinese workers and examine whether stated job values reflect actual job choices. We first document systematic differences in working conditions across demographic groups, then estimate how workers value those job characteristics using a carefully designed best–worst scaling approach, and finally assess the consistency between stated preferences and actual working conditions.
Our analysis reveals systematic disparities in working conditions across the Chinese labor market. Workers possessing second-generation urban Hukou and degrees from prestigious universities generally enjoy superior job amenities across nearly all categories examined. Conversely, female workers tend to experience inferior job attributes compared to their male counterparts. These findings highlight the presence of Hukou-based inequality and a less favorable work environment for women in the Chinese labor market, underscoring the need for targeted policy interventions.
From a policy standpoint, the gender disparities documented here call for stronger enforcement of anti-discrimination legislation and corporate diversity mandates. In particular, policies that expand women’s access to flexible scheduling, remote work opportunities, and parental leave could help mitigate structural disadvantages in the labor market. The persistent advantage of second-generation urban Hukou holders, even after controlling for education and other demographic characteristics, suggests that reforming the Hukou system alone is insufficient. Complementary policies that equalize access to social welfare benefits, professional networks, and career development opportunities are also needed to close the gap between urban natives and rural migrants (Afridi et al., 2015; Pi & Zhang, 2016).
Furthermore, our results reveal substantial heterogeneity in job values across individuals, which is consistent with prior evidence (Lavetti, 2023; Mas & Pallais, 2017). Based on individuals’ preference shares for job values, we can segment workers into three classes: Wage-Focused Workers (35.85%), Balanced Compensators (46.30%), and Stability Seekers (17.85%). These segments have direct implications for human resource management and compensation design. Wage-Focused Workers, who assign over 80% of their valuation to wage level, are best attracted through competitive salaries. Balanced Compensators—the largest group—respond to comprehensive packages combining competitive wages with job security and employee benefits. Stability Seekers, who disproportionately value job stability and social security benefits, are most likely to be drawn to the public sector, a pattern consistent with the documented competition for government positions among college graduates (Li et al., 2023). Private sector firms seeking to compete for this segment could consider offering longer-term labor contracts, enhanced pension contributions, and clearer career progression pathways. Given that heterogeneity in preferences for wages and amenities shapes the overall wage structure (Maestas et al., 2023) and that non-pecuniary benefits can serve as a sorting device to attract and retain key workers (Oyer, 2008), these findings suggest that a one-size-fits-all approach to compensation is suboptimal. The three-segment framework developed here provides an empirical basis for more targeted compensation strategies that could also help reduce youth unemployment by aligning private sector offerings with workers’ heterogeneous preferences.
Finally, the expressed preferences for job values align partially with the actual choices of job conditions, indicating that job values can serve as a reliable indicator of shifts in labor market supply. Given the rising unemployment among young workers and their marked preference for state-sector employment due to job stability (Li et al., 2023), juxtaposed with reported labor shortages in the private sector, these findings offer important practical insights. Addressing the private sector’s talent gap requires not only creating more positions but also redesigning compensation packages that credibly signal job security and long-term career growth—attributes currently associated primarily with public employment. Policymakers could facilitate this rebalancing by strengthening labor contract enforcement, improving unemployment insurance coverage, and incentivizing private firms to invest in non-wage benefits. More broadly, our finding that stated preferences are valid predictors of actual job choices suggests that BWS-based surveys could serve as a low-cost tool for monitoring shifts in labor market supply without requiring large-scale administrative data.
This study has several limitations that suggest directions for future research. The sample is relatively small and characterized by younger, highly educated, and predominantly urban respondents, which may limit the generalizability of the findings. A larger, nationally representative survey would enable more robust conclusions. Furthermore, future research should investigate regional heterogeneity in job values, particularly comparing worker preferences in central and western China with those in coastal urban areas, as well as differences between rural and urban workers.


Funding

No funding was received for this work.

Institutional Review Board Statement

This research adhered to ethical standards for social science research. The Ethics Committee of Nanjing Tech University determined that formal ethical review and approval were waived for this study.

Informed Consent Statement

Prior to participation, all subjects provided informed consent. Data collection and storage were performed in a manner that ensured participant anonymity and confidentiality.

Data Availability Statement

All data and models used during the study are available from the corresponding author by request.

Conflicts of Interest

The author declares no conflicts of interest.

Appendix A. Supplementary Tables

Table A1. Working conditions by gender, hukou and university classifications.
GenderHukouUniversity Classifications
FemaleMaleRural1st-Gen.2nd-Gen.Tier 3−Tier 2Non-DFC T1DFC
How much control do you have over your working schedule?
Set by company, no changes43.5331.9140.2040.3635.4150.8238.6538.3725.76
Choose between fixed schedules24.1224.8226.6325.3022.1818.8523.7623.2631.82
Adapt hours within limits26.1837.2328.1430.1234.2422.1332.6236.0533.33
Determine my own schedule6.186.035.034.228.178.204.962.339.09
Is it possible for you to work from home or another location?
No45.2937.2344.7242.1738.9153.2845.0433.7228.79
Some times51.4758.8751.7656.0256.4240.9852.4862.7967.42
Many times3.243.903.521.814.675.742.483.493.79
How would you describe the physical demands of this job?
Primarily sit throughout the day73.5364.8957.7965.6681.3251.6471.9973.2678.79
Moderate physical activity23.2430.5036.6829.5216.7340.9823.7625.5819.70
Intense physical activity3.244.615.534.821.957.384.261.161.52
How would you describe the pace of your job?
Relaxed18.5317.0220.6017.4715.9518.8519.8620.9310.61
Some fast-paced69.1273.0569.8571.0871.6073.7769.5067.4473.48
Fast-paced12.359.939.5511.4512.457.3810.6411.6315.91
How much independence do you have in determining what you work on?
Very little independence29.1220.9225.6326.5124.5135.2525.8920.9318.18
Some independence58.8269.8664.8266.8761.0954.1064.8968.6067.42
A lot of independence12.069.229.556.6314.4010.669.2210.4714.39
How much paid time off do you get per year?
As needed20.2926.6027.6421.6920.6240.1621.6324.429.85
3 days13.536.7414.0712.656.2313.119.5710.479.85
5 days29.7126.9526.1333.7326.8519.6730.5029.0731.82
10 days22.9429.0820.6025.9029.5718.8528.0120.9330.30
15 days13.5310.6411.566.0216.738.2010.2815.1218.18
How much do you work with others?
Primarily work by myself18.8213.8313.0720.4816.7317.2119.5013.9511.36
Work with others, own performance25.8824.4722.6121.0829.9627.8725.5322.0924.24
Work with others, team performance55.2961.7064.3258.4353.3154.9254.9663.9564.39
Does your job provide opportunities to learn new skills?
Never9.418.1611.067.837.7817.217.092.339.09
Some74.1278.3775.3880.7273.5472.1379.0879.0771.21
A lot16.4713.4813.5711.4518.6810.6613.8318.6019.70
Does your job provide a sense of value to society?
No5.592.845.033.014.675.744.264.653.03
Some64.1263.8365.8370.4858.3773.7766.3154.6556.06
A lot30.2933.3329.1526.5136.9620.4929.4340.7040.91
What is the stability of this position?
Instability4.714.616.534.823.118.204.613.492.27
Relatively stable66.7668.7970.8570.4863.4272.1368.7960.4765.91
Very stable28.5326.6022.6124.7033.4619.6726.6036.0531.82
How would you describe the innovation demands of this job?
Routine work28.2420.9226.1325.9023.3539.3424.4723.2613.64
Some innovation55.8858.1658.7956.0256.0352.4659.2252.3359.09
A lot of innovation15.8820.9215.0818.0720.628.2016.3124.4227.27
Note: All values are percentages (%). DFC = Double First-Class; T1 = Tier 1; 1st-gen. = First-generation; 2nd-gen. = Second-generation.
Table A2. Working conditions by age and income.
AgeAnnual Income (yuan)
<2829–35>35<80 K80–120 K120–160 K160–300 K>300 K
How much control do you have over your working schedule?
Set by company, no changes44.7233.7944.4446.0141.0338.4633.040.00
Choose between fixed schedules26.0224.7322.2222.0922.5627.3528.7021.88
Adapt hours within limits23.5836.5423.7027.6131.7929.9130.4353.13
Determine my own schedule5.694.959.634.294.624.277.8325.00
Is it possible for you to work from home or another location?
No47.1538.1945.9355.8345.1330.7733.0418.75
Some times47.9758.7950.3739.8851.7964.9665.2275.00
Many times4.883.023.704.293.084.271.746.25
Physical demands
Primarily sit throughout the day69.1170.6067.4155.2170.2669.2382.6193.75
Moderate physical activity26.8325.5528.8941.7224.1025.6415.656.25
Intense physical activity4.073.853.703.075.645.131.740.00
Pace of work
Relaxed21.9515.6620.0025.1515.9016.2411.3021.88
Some fast-paced67.4871.9871.1167.4874.3672.6571.3059.38
Fast-paced10.5712.368.897.369.7411.1117.3918.75
Independence at work
Very little independence28.4624.4525.1934.3627.1817.9524.350.00
Some independence62.6065.3860.7456.4465.6470.9461.7471.88
A lot of independence8.9410.1614.079.207.1811.1113.9128.13
Paid time off per year
As needed29.2717.5832.5935.5821.5419.6613.9115.63
3 days11.3812.364.4414.1110.265.1313.910.00
5 days30.0830.2222.2223.9332.3127.3533.0415.63
10 days19.5128.0225.1915.9526.6735.9024.3537.50
15 days9.7611.8115.5610.439.2311.9714.7831.25
Working with others
Primarily work by myself9.7617.8619.2615.3416.9221.3713.0415.63
Work with others, own performance27.6422.8029.6325.7724.6222.2224.3540.63
Work with others, team performance62.6059.3451.1158.9058.4656.4162.6143.75
Opportunities to learn new skills
Never7.327.9712.5914.728.215.986.960.00
Some80.4973.0880.0074.2377.9581.2073.9162.50
A lot12.2018.967.4111.0413.8512.8219.1337.50
Sense of value to society
No6.504.122.967.984.100.005.220.00
Some66.6760.9969.6369.9466.1564.9660.8728.13
A lot26.8334.8927.4122.0929.7435.0433.9171.88
Stability of position
Instability4.884.953.706.754.624.272.613.13
Relatively stable75.6165.3866.6771.1772.3160.6868.7043.75
Very stable19.5129.6729.6322.0923.0835.0428.7053.13
Innovation demands
Routine work28.4623.3525.9337.4223.0823.0818.263.13
Some innovation59.3555.2259.2649.6964.1064.1053.9134.38
A lot of innovation12.2021.4314.8112.8812.8212.8227.8362.50
Note: All values are percentages (%). K = 1000 yuan.
Table A3. The differences of job values across groups (preference shares, %).
Job ValuesGenderHukouUniversityAge
FMRural1st2ndT3−T2Non-DFCDFC<2829–35>35
Wage level53.1552.0651.8355.7151.3151.4854.2155.6248.4756.1751.3053.09
Job stability13.8814.9615.0312.9014.8015.6313.8611.8515.9213.5514.8713.75
Med. & pension12.3212.6214.0911.6411.7213.1912.6511.5511.969.6012.9313.79
Paid time off3.313.323.323.323.323.133.213.483.614.133.043.33
Autonomy2.062.072.002.062.132.031.942.042.392.022.141.91
Pace of work1.561.531.501.451.651.581.421.461.841.541.571.48
Sched. flexibility2.012.031.952.022.072.011.911.972.311.992.071.90
Job training2.402.042.312.012.321.942.042.182.981.972.402.03
Social value3.383.222.513.154.033.123.193.713.473.623.173.38
Teams1.812.021.711.992.001.811.722.062.281.801.981.80
Innovation1.992.051.711.682.471.891.901.942.421.592.351.51
Physical demands1.141.091.091.081.171.211.021.171.211.061.141.11
Telecommuting0.980.990.960.981.020.980.930.971.140.971.020.92
Note: F = Female; M = Male; 1st = First-generation Urban; 2nd = Second-generation Urban; T3− = Tier 3 and below; T2 = Tier 2; Non-DFC = Non-Double First-Class Tier 1; DFC = Double First-Class.
Table A4. The consistency of the actual working conditions and job values.
VariablesWageStabilityPTOAutonomyPaceScheduleTrainingSocialTeamsInnov.Phys.Tele.
Value of X a 0.0860.529 3.353 * 16.56 ***5.731 10.80 ** 9.189 *** 3.761 ***2.454 18.58 *** 21.43 *** 47.12 ***
(0.237)(0.700)(1.961)(4.693)(5.652)(4.235)(2.668)(1.243)(3.977)(3.301)(7.311)(10.090)
Female 0.381 ***0.0900.037 0.200 0.015 0.461 ***0.048 0.219 0.300 * 0.370 ** 0.453 ** 0.342 **
(0.143)(0.173)(0.145)(0.166)(0.175)(0.149)(0.189)(0.169)(0.161)(0.161)(0.182)(0.165)
1st-gen. Urban 0.639 *** 0.020 0.111 0.264 0.139 0.113 0.003 0.252 0.278 0.122 0.137 0.032
(0.194)(0.240)(0.193)(0.222)(0.238)(0.202)(0.259)(0.232)(0.222)(0.218)(0.230)(0.222)
2nd-gen. Urban 1.002 *** 0.440 ** 0.361 **0.0130.1920.170 0.387 *0.094 0.441 ** 0.103 1.043 ***0.127
(0.179)(0.214)(0.181)(0.204)(0.215)(0.183)(0.235)(0.209)(0.197)(0.196)(0.226)(0.201)
Tier 2 univ. 0.909 *** 0.448 * 0.779 *** 0.386 *0.032 0.364 * 0.557 ** 0.457 *0.026 0.798 *** 0.740 ***0.255
(0.201)(0.250)(0.204)(0.227)(0.239)(0.212)(0.269)(0.243)(0.216)(0.219)(0.232)(0.227)
Non-DFC T1 1.364 *** 0.922 *** 0.753 *** 0.582 **0.0320.364 1.021 *** 0.910 ***0.390 1.034 *** 0.968 *** 0.740 **
(0.253)(0.310)(0.263)(0.292)(0.309)(0.265)(0.335)(0.304)(0.286)(0.286)(0.311)(0.292)
DFC univ. 2.368 *** 0.623 ** 1.196 *** 0.766 *** 0.545 * 0.660 ***0.501 0.885 *** 0.523 ** 1.359 *** 1.028 *** 0.793 ***
(0.251)(0.289)(0.242)(0.273)(0.288)(0.248)(0.320)(0.283)(0.264)(0.265)(0.296)(0.273)
Age 29–35 0.788 *** 0.404 * 0.388 **0.1720.252 0.401 **0.247 0.434 * 0.238 0.2750.0480.233
(0.192)(0.235)(0.195)(0.218)(0.232)(0.198)(0.253)(0.229)(0.215)(0.210)(0.240)(0.218)
Age above 35 0.593 *** 0.511 *0.3140.4180.0100.180 0.502 *0.261 0.423 *0.2810.0520.089
(0.228)(0.279)(0.240)(0.267)(0.278)(0.242)(0.304)(0.276)(0.252)(0.252)(0.288)(0.262)
Note: * p < 0.10; ** p < 0.05; *** p < 0.01. Xa refers to individual’s relative importance of corresponding values. PTO = Paid Time Off; Innov. = Innovation; Phys. = Physical demands; Tele. = Telecommuting; Non-DFC T1 = Non-Double First-Class Tier 1; DFC = Double First-Class.

Notes

1
‘Involution’: The anxieties of our time summed up in one word, https://news.cgtn.com/news/2020-12-04/-Involution-The-anxieties-of-our-time-summed-up-in-one-word-VWNlDOVdjW/index.html (accessed on 8 June 2025).
2
Hideo Aizaki and James Fogarty, An Illustrative Example of Case 1 Best–Worst Scaling, http://lab.agr.hokudai.ac.jp/nmvr/03-bws1.html#the-modeling-approach (accessed on 8 June 2025).
3
Workers who value wage and job stability more are not in a high-wage job; education level, hukou and age explain more of this difference. Pace of work and working in teams may be mainly determined by employers.

References

  1. Afridi, F., Li, S. X., & Ren, Y. (2015). Social identity and inequality: The impact of China’s hukou system. Journal of Public Economics, 123, 17–29. [Google Scholar]
  2. Auger, P., Devinney, T. M., & Louviere, J. J. (2007). Using best–Worst scaling methodology to investigate consumer ethical beliefs across countries. Journal of Business Ethics, 70(3), 299–326. [Google Scholar]
  3. Bazzani, C., Gustavsen, G. W., Nayga, R. M., Jr., & Rickertsen, K. (2018). A comparative study of food values between the United States and Norway. European Review of Agricultural Economics, 45(2), 239–272. [Google Scholar] [CrossRef]
  4. Brown, C. (1980). Equalizing differences in the labor market. The Quarterly Journal of Economics, 94(1), 113–134. [Google Scholar] [CrossRef]
  5. Caputo, V., & Lusk, J. L. (2022). The basket-based choice experiment: A method for food demand policy analysis. Food Policy, 109, 102252. [Google Scholar] [CrossRef]
  6. Cerroni, S., Nayga, J. R. M., Pappalardo, G., & Yang, W. (2022). Malleability of food values amid the COVID-19 pandemic. European Review of Agricultural Economics, 49(2), 472–498. [Google Scholar]
  7. Cohen, E. (2009). Applying best-worst scaling to wine marketing. International Journal of Wine Business Research, 21(1), 8–23. [Google Scholar]
  8. Croson, R., & Gneezy, U. (2009). Gender differences in preferences. Journal of Economic Literature, 47(2), 448–474. [Google Scholar] [CrossRef]
  9. Datta, N. (2019). Willing to pay for security: A discrete choice experiment to analyse labour supply preferences (CEP Discussion Papers 1632). London School of Economics and Political Science, Centre for Economic Performance. Available online: https://researchonline.lse.ac.uk/id/eprint/103390 (accessed on 8 June 2025).
  10. Dillon, E. W. (2018). Risk and return trade-offs in lifetime earnings. Journal of Labor Economics, 36(4), 981–1021. [Google Scholar] [CrossRef]
  11. Duncan, G. J., & Holmlund, B. (1983). Was Adam Smith right after all? Another test of the theory of compensating wage differentials. Journal of Labor Economics, 1(4), 366–379. [Google Scholar] [CrossRef]
  12. Ellison, B., McFadden, B., Rickard, B. J., & Wilson, N. L. (2021). Examining food purchase behavior and food values during the COVID-19 pandemic. Applied Economic Perspectives and Policy, 43(1), 58–72. [Google Scholar]
  13. Eriksson, T., & Kristensen, N. (2014). Wages or fringes? Some evidence on trade-offs and sorting. Journal of Labor Economics, 32(4), 899–928. [Google Scholar] [CrossRef]
  14. Finn, A., & Louviere, J. J. (1992). Determining the appropriate response to evidence of public concern: The case of food safety. Journal of Public Policy & Marketing, 11(2), 12–25. [Google Scholar] [CrossRef]
  15. Flynn, T. N. (2014). Valuing citizen and patient preferences in health: Recent developments in three types of best-worst scaling. Expert Review of Pharmacoeconomics & Outcomes Research, 10(3), 259–267. [Google Scholar]
  16. Flynn, T. N., Louviere, J. J., Peters, T. J., & Coast, J. (2007). Best–worst scaling: What it can do for health care research and how to do it. Journal of Health Economics, 26(1), 171–189. [Google Scholar] [CrossRef] [PubMed]
  17. Gao, Z., House, L. A., & Xie, J. (2016). Online survey data quality and its implication for willingness-to-pay: A cross-country comparison. Canadian Journal of Agricultural Economics, 64(2), 199–221. [Google Scholar]
  18. Gronberg, T. J., & Reed, W. R. (1994). Estimating workers’ marginal willingness to pay for job attributes using duration data. Journal of Human Resources, 29, 911–931. [Google Scholar] [CrossRef]
  19. Gutman, J. (1982). A means-end chain model based on consumer categorization processes. Journal of Marketing, 46(2), 60–72. [Google Scholar] [CrossRef]
  20. Huber, J., & Train, K. (2001). On the similarity of classical and Bayesian estimates of individual mean partworths. Marketing Letters, 12, 259–269. [Google Scholar] [CrossRef]
  21. Hwang, H., Mortensen, D. T., & Reed, W. R. (1998). Hedonic wages and labor market search. Journal of Labor Economics, 16(4), 815–847. [Google Scholar] [CrossRef]
  22. Jaeger, S. R., Danaher, P. J., & Brodie, R. J. (2009). Wine purchase decisions and consumption behaviours: Insights from a probability sample drawn in Auckland, New Zealand. Food Quality and Preference, 20(4), 312–319. [Google Scholar] [CrossRef]
  23. Katz, L. F., & Krueger, A. B. (2019). The rise and nature of alternative work arrangements in the United States, 1995–2015. ILR Review, 72(2), 382–416. [Google Scholar]
  24. Kniesner, T. J., Viscusi, W. K., Woock, C., & Ziliak, J. P. (2012). The value of a statistical life: Evidence from panel data. Review of Economics and Statistics, 94(1), 74–87. [Google Scholar] [CrossRef]
  25. Kuang, L., & Liu, L. (2012). Discrimination against rural-to-urban migrants: The role of the hukou system in China. PLoS ONE, 7(11), e46932. [Google Scholar] [CrossRef] [PubMed]
  26. Lancaster, K. J. (1966). A new approach to consumer theory. The Journal of Political Economy, 74(2), 132–157. [Google Scholar] [CrossRef]
  27. Lavetti, K. (2023). Compensating wage differentials in labor markets: Empirical challenges and applications. Journal of Economic Perspectives, 37(3), 189–212. [Google Scholar] [CrossRef]
  28. Lazear, E. P., & Shaw, K. L. (2007). Personnel economics: The economist’s view of human resources. Journal of Economic Perspectives, 21(4), 91–114. [Google Scholar]
  29. Lee, J. A., Soutar, G. N., & Louviere, J. (2007). Measuring values using best-worst scaling: The LOV example. Psychology & Marketing, 24(12), 1043–1058. [Google Scholar]
  30. Li, H., Meng, L., Xiong, Y., & Cook, S. L. (2023). Job preferences and outcomes for China’s college graduates. The China Quarterly, 258, 529–547. [Google Scholar]
  31. Louviere, J., Lings, I., Islam, T., Gudergan, S., & Flynn, T. (2013). An introduction to the application of (case 1) best–worst scaling in marketing research. International Journal of Research in Marketing, 30(3), 292–303. [Google Scholar] [CrossRef]
  32. Louviere, J. J., Flynn, T. N., & Marley, A. A. J. (2015). Best-worst scaling: Theory, methods and applications. Cambridge University Press. [Google Scholar]
  33. Lusk, J. L., & Briggeman, B. C. (2009). Food values. American Journal of Agricultural Economics, 91(1), 184–196. [Google Scholar] [CrossRef]
  34. Maestas, N., Mullen, K. J., Powell, D., Von Wachter, T., & Wenger, J. B. (2023). The value of working conditions in the United States and implications for the structure of wages. American Economic Review, 113(7), 2007–2047. [Google Scholar] [CrossRef]
  35. Marley, A. A., & Louviere, J. J. (2005). Some probabilistic models of best, worst, and best–worst choices. Journal of Mathematical Psychology, 49(6), 464–480. [Google Scholar] [CrossRef]
  36. Mas, A., & Pallais, A. (2017). Valuing alternative work arrangements. American Economic Review, 107(12), 3722–3759. [Google Scholar] [CrossRef]
  37. McFadden, D. (1973). Conditional logit analysis of qualitative choice behavior. In Frontiers in econometrics. University of California. [Google Scholar]
  38. Mirowsky, J., & Ross, C. E. (2007). Creative work and health. Journal of Health and Social Behavior, 48(4), 385–403. [Google Scholar] [CrossRef] [PubMed]
  39. Oettinger, G. S. (2011). The incidence and wage consequences of home-based work in the United States, 1980–2000. Journal of Human Resources, 46(2), 237–260. [Google Scholar] [CrossRef]
  40. Oyer, P. (2008). Salary or benefits? In Work, earnings and other aspects of the employment relation (Vol. 28, pp. 429–467). Emerald Group Publishing Limited. [Google Scholar]
  41. Pi, J., & Zhang, P. (2016). Hukou system reforms and skilled-unskilled wage inequality in China. China Economic Review, 41, 90–103. [Google Scholar] [CrossRef]
  42. Rokeach, M. (1973). The nature of human values. Free Press. [Google Scholar]
  43. Rosen, S. (1974). Hedonic prices and implicit markets: Product differentiation in pure competition. Journal of Political Economy, 82(1), 34–55. [Google Scholar] [CrossRef]
  44. Rosen, S. (1986). The theory of equalizing differences. Handbook of Labor Economics, 1, 641–692. [Google Scholar] [CrossRef]
  45. Saragih, S. (2015). The effects of job autonomy on work outcomes: Self efficacy as an intervening variable. International Research Journal of Business Studies, 4(3), 203–215. [Google Scholar]
  46. Scarpa, R., Notaro, S., Louviere, J., & Raffaelli, R. (2011). Exploring scale effects of best/worst rank ordered choice data to estimate benefits of tourism in alpine grazing commons. American Journal of Agricultural Economics, 93(3), 813–828. [Google Scholar] [CrossRef]
  47. Shackleton, V. J. (1981). Boredom and repetitive work: A review. Personnel Review, 10(4), 30–36. [Google Scholar] [CrossRef]
  48. Sun, J., Ortega, D. L., & Lin, W. (2023). Food values drive Chinese consumers’ demand for meat and milk substitutes. Appetite, 181, 106392. [Google Scholar] [CrossRef] [PubMed]
  49. Thurstone, L. L. (1927). A law of comparative judgment. Psychological Review, 34(4), 273. [Google Scholar] [CrossRef]
  50. Train, K. E. (2009). Discrete choice methods with simulation. Cambridge University Press. [Google Scholar]
  51. Wang, T., Wong, B., Huang, A., Khatri, P., Ng, C., Forgie, M., Lanphear, J. H., & O’Neill, P. J. (2011). Factors affecting residency rank-listing: A Maxdiff survey of graduating Canadian medical students. BMC Medical Education, 11, 1–7. [Google Scholar] [CrossRef]
  52. Wang, Z., & Subramaniam, G. (2023). China’s workforce dynamics: A conceptual framework for assessing employee work attitudes in Shanghai. Asia Pacific Journal of Business, Humanities and Education, 8(1), 96–108. [Google Scholar]
  53. Wiswall, M., & Zafar, B. (2018). Preference for the workplace, investment in human capital, and gender. The Quarterly Journal of Economics, 133(1), 457–507. [Google Scholar] [PubMed]
  54. Yan, B., & Han, Z. (2021). An empirical study on Chinese college students’ preference for non-monetary job characteristics. Education & Economy, 37(2), 86–96. Available online: https://kns.cnki.net/kcms2/article/abstract?v=29HrapzBqeXzwSmj11J9lrjIWxSKUqMwhPIiiYu3Mt3hAndAzD9NTyIcOkX0uJ07Oe5t7NmjHwBvcfSrco0dwcAU28JlIDPXOwBjsN_kL7bZ_mpCbs5r6yyav1lLDns2ebp7lMM_sNw9MyIq_3JIoMghUBquF266vDnJaulKS-3ubTKan50LlQ==&uniplatform=NZKPT&language=CHS (accessed on 8 June 2025).
Figure 1. The example of the best–worst scaling choice set. Note: Respondents were asked to select which of the following values is most important and least important when choosing a job (one answer each).
Economies 14 00249 g001
Table 1. Job values with descriptions.
Job AmenitiesDescription
Wage levelThe wage level that is paid.
Job stabilityThe probability that an individual will retain their job without the risk of becoming unemployed.
Medical and pension benefitsCompensation is provided by employers, in addition to salary, that covers healthcare costs and contributes to a retirement fund for workers.
Autonomy at workIndependence in determining work tasks.
Innovation of workPotential within a job to be enhanced through creative thinking and novel approaches.
Pace of workThe intensity and speed required for job tasks.
Paid time offAmount of paid leave provided annually.
Job trainingPrograms to improve employee skills and knowledge.
Social value of workPerceived contribution to society.
Working in teamsCollaboration with others in the workplace.
Schedule flexibilityControl over working hours.
Physical job demandsThe physical effort required by the job.
TelecommutingAbility to work from home or another location.
Table 2. Sample characteristics.
VariablesCategoriesObservationsAll Samples (%)Population (China)
GenderFemale34054.6648.81 a
Male28245.3451.19 a
Age<2912319.7738.40 b
29–3536458.52
>3513521.70
University classifications cTier 3 and below12219.61
Tier 2 universities28245.34
Non-Double First-Class Tier 18613.83
Double First-Class universities13221.22
HukouRural Hukou19931.99
First-generation Urban Hukou16626.69
Second-generation Urban Hukou25741.32
N 622
a Data from the 2022 China national statistical yearbook. b Median age from China 2023. c Tier 3 and Below Universities (lower quality, easier admission); Tier 2 Universities (moderate quality and admission difficulty); Non-Double First-Class Tier 1 Universities (high quality, more competitive admission); Double First-Class Universities (top quality, most competitive admission).
Table 3. Differences in annual wages by demographic characteristics.
PercentageMean Annual Wage (yuan)Raw Log Wage DifferentialLog Wage Differential from Joint Regression
Full sample100130,500
Gender
Female54.66127,600 0.071 * 0.086 ***
Male45.34134,100(0.041)(0.035)
Hukou
Rural Hukou31.99102,600
First-gen. Urban Hukou26.69129,600 0.238 *** 0.146 ***
(0.051)(0.048)
Second-gen. Urban Hukou41.32152,800 0.367 *** 0.248 ***
(0.045)(0.043)
University classifications
Tier 3 and below8.8191,700
Tier 2 universities12.06121,100 0.253 *** 0.207 ***
(0.049)(0.048)
Non-DFC Tier 114.28131,900 0.355 *** 0.328 ***
(0.064)(0.062)
Double First-Class18.73185,700 0.676 *** 0.583 ***
(0.057)(0.057)
Age
Below 2810.33107,800
29–3514.10140,500 0.260 *** 0.179 ***
(0.052)(0.047)
Above 3512.52124,4000.145 0.129 ***
(0.062)(0.055)
Adj- R 2 = 25.61%
Column 3 shows the unadjusted difference in log wages, whereas Column 4 shows the differences from a joint regression where dummies for all the groups are included jointly. Standard errors in parentheses. * p < 0.10 ; *** p < 0.01 .
Table 4. Heterogeneity in working conditions.
LogControlPhysicalPaceAutonomyWorkingPaidJobSocialJobInnovationTele-
WageScheduleDemandsof Workat Workin TeamsTime OffTrainingValueStabilityof WorkCommuting
Female 0.086 ** 0.461 *** 0.434 **0.018 0.205 0.304 *0.0400.083 0.208 0.083 0.406 *** 0.337 **
1st-gen. Urban Hukou 0.146 *** 0.111 0.149 0.132 0.267 0.276 0.123 0.047 0.220 0.031 0.116 0.036
2nd-gen. Urban Hukou 0.248 ***0.167 1.007 ***0.1960.019 0.439 ** 0.354 *0.3600.162 0.437 ** 0.005 0.118
Tier 2 universities 0.207 *** 0.356 * 0.767 ***0.0210.3640.023 0.770 *** 0.559 ** 0.431 * 0.438 * 0.706 ***0.226
Non-DFC Tier 1 0.328 ***0.359 0.955 ***0.026 0.586 **0.394 0.734 *** 1.037 *** 0.908 *** 0.901 *** 1.011 *** 0.703 **
Double First-Class 0.583 *** 0.695 *** 1.006 *** 0.560 * 0.818 *** 0.532 ** 1.169 *** 0.602 * 0.850 *** 0.621 ** 1.365 *** 0.839 ***
Age 29–35 0.179 *** 0.415 **0.0630.2510.171 0.233 0.435 **0.284 0.403 * 0.413 * 0.355 *0.245
Age above 35 0.130 **0.1720.0880.0070.385 0.422 *0.353 0.471 0.231 0.514 *0.2450.067
* p < 0.10 ; ** p < 0.05 ; *** p < 0.01 . Baseline groups: Male, Rural Hukou, Tier 3 and below universities, Age below 28.
Table 5. Results of the mixed logit model and conditional logit model.
Job ValuesMNLRPL
CoefficientCoefficientStd. Dev.
Wage level 2.4884 *** 3.7592 *** 2.3737 ***
(0.052)(0.088)(0.091)
Job stability 1.9835 *** 2.5816 *** 0.9779 ***
(0.048)(0.059)(0.067)
Medical and pension benefits 1.7381 *** 2.3208 *** 1.4317 ***
(0.047)(0.063)(0.070)
Autonomy at work 0.6163 *** 0.7366 ***0.0799
(0.043)(0.046)(0.055)
Innovation of work 0.2181 *** 0.2719 *** 1.1382 ***
(0.043)(0.050)(0.057)
Pace of work 0.3383 *** 0.4283 *** 0.4498 ***
(0.042)(0.044)(0.055)
Paid time off 0.8732 *** 1.0949 *** 0.9039 ***
(0.043)(0.050)(0.058)
Job training 0.3650 *** 0.4610 *** 1.1144 ***
(0.042)(0.048)(0.055)
Social value of work 0.2178 *** 0.2480 *** 1.6668 ***
(0.043)(0.052)(0.062)
Working in teams 0.4409 *** 0.5293 *** 0.5438 ***
(0.043)(0.048)(0.056)
Schedule flexibility 0.5951 *** 0.7224 *** 0.1525 *
(0.043)(0.049)(0.061)
Physical job demands0.06610.0813 0.4690 ***
(0.043)(0.048)(0.055)
AIC33,54030,892
BIC33,65431,120
AIC/N0.34570.3184
Adj. McFadden’s R 2 9.60%16.77%
Log-Likelihood−16,758−15,400
Observations97,03297,032
* p < 0.10 ; *** p < 0.01 . Baseline: Telecommuting. MNL = Multinomial Logit; RPL = Random Parameters Logit.
Table 6. Preference shares and job value rankings.
Job ValuesShares (MNL)Shares (RPL)Ranking
Wage level30.10%51.74%1
Job stability18.17%15.94%2
Medical and pension benefits14.21%12.28%3
Schedule flexibility5.99%3.60%4
Paid time off4.63%2.52%5
Innovation of work4.53%2.48%6
Working in teams3.88%2.05%7
Job training3.60%1.91%8
Pace of work3.51%1.85%9
Autonomy at work3.11%1.58%10
Social value of work3.11%1.55%11
Physical job demands2.67%1.31%12
Telecommuting2.50%1.21%13
Table 7. Relative importance of job values for different classes.
Job ValuesGroup 1:Group 2:Group 3:
Wage-FocusedBalancedStability
WorkersCompensatorsSeekers
Wage level80.78%51.29%16.96%
Job stability5.68%18.88%23.26%
Medical and pension benefits5.87%12.57%20.93%
Paid time off1.72%3.15%5.48%
Autonomy at work0.84%1.98%3.70%
Pace of work0.62%1.46%2.78%
Schedule flexibility0.84%1.96%3.58%
Job training0.81%1.98%4.22%
Social value of work0.77%1.69%7.43%
Working in teams0.67%1.65%3.63%
Innovation of work0.55%1.40%4.23%
Physical job demands0.45%1.02%2.03%
Telecommuting0.40%0.95%1.77%
Share (%)35.8546.3017.85
Disclaimer/Publisher’s Note: The statements, opinions and data contained in all publications are solely those of the individual author(s) and contributor(s) and not of MDPI and/or the editor(s). MDPI and/or the editor(s) disclaim responsibility for any injury to people or property resulting from any ideas, methods, instructions or products referred to in the content.