1. Introduction
Per capita household expenditure is widely used as a welfare indicator in developing economies because it captures realized living standards more directly than current income and is often less sensitive to short-term volatility, seasonality, and reporting error. In applied welfare analysis, expenditure-based measures are especially informative when households face unstable earnings or rely on multiple income sources. At the same time, per capita expenditure is not shaped by resources alone. It may also vary with household size, demographic composition, health-related burdens, and locational disadvantage, all of which can alter household needs, budget allocation, and the capacity to smooth consumption over time (
Browning & Crossley, 2001;
Deaton, 1997;
Deaton & Paxson, 1998;
Deaton & Zaidi, 2002). In this sense, per capita household expenditure should be examined empirically as a welfare outcome associated with income, household scale, demographic needs, vulnerability, and location. Household size is especially important because shared consumption may generate economies of scale, while congestion and resource dilution may weaken these advantages as households become larger (
Browning & Crossley, 2001;
Deaton & Paxson, 1998). Illness burden, ethnic disadvantage, and locational constraints may further shape expenditure, either by increasing unavoidable spending or by limiting access to stable livelihoods and essential services (
Ayyash & Sek, 2020;
Deaton, 1997;
Heshmati et al., 2019;
Madudova & Corejova, 2023;
Mpuuga et al., 2025;
Nguyen-Phung & Le, 2024).
Although these mechanisms are well established conceptually, micro-level evidence remains uneven in three respects. First, many studies examine household size or demographic composition separately, making it difficult to identify their joint association with per capita expenditure. Second, nonlinearities in household size are often not modeled explicitly, despite the theoretical importance of scale economies and resource dilution (
Browning & Crossley, 2001;
Deaton & Paxson, 1998). Third, expenditure studies in developing-country settings do not always integrate household composition, income, health-related burdens, and structural disadvantage within a single empirical framework. This limitation is particularly relevant in subnational contexts, where welfare differences may persist across households facing distinct demographic and socio-economic constraints despite living within the same broader institutional environment (
Ayyash & Sek, 2020;
Epo et al., 2025;
Heshmati et al., 2019;
Mpuuga et al., 2025;
Nguyen-Phung & Le, 2024).
These issues are salient in Vietnam. Existing evidence points to persistent welfare gaps across ethnic groups, substantial vulnerability to health-related out-of-pocket spending, and continuing challenges in poverty reduction and inclusive development (
Mpuuga et al., 2025;
Thuong et al., 2022;
World Bank, 2022). At the same time, relatively little micro-level evidence is available on how household size, age composition, illness burden, and socio-economic disadvantage are jointly associated with per capita expenditure within a single provincial setting. This matters because expenditure is not only an outcome of available resources; it also reflects household needs, coping strategies, and the degree to which families can smooth consumption under demographic and health-related pressures (
Ayyash & Sek, 2020;
Deaton & Zaidi, 2002;
Heshmati et al., 2019).
This study examines the correlates of per capita household expenditure using cross-sectional survey data from 320 households in Binh Dinh Province, Vietnam, collected in 2025. The empirical analysis estimates log-linear ordinary least squares models in which per capita household expenditure is related to household size, its squared term, demographic composition, per capita income, illness burden, ethnic-minority status, and selected household-head and locational characteristics. To strengthen statistical inference in a moderate-sized sample, the analysis complements conventional estimation with bias-corrected and accelerated bootstrap procedures. Given the cross-sectional design, the estimates should be interpreted as conditional associations rather than causal effects.
This study contributes to the literature in four ways. First, it estimates an Engel-type expenditure–income association using household-level data from a developing provincial economy in Vietnam. Second, it models household size nonlinearly, allowing potential economies of scale and resource dilution to be examined within the same specification. Third, it distinguishes demographic expenditure needs from health-related financial pressure by jointly including the child, elderly, and female shares and severe or chronic illness burden. Fourth, it examines whether ethnic-minority disadvantage remains associated with lower per capita expenditure after controlling for income, household composition, illness burden, and locational characteristics. Together, these contributions position this study within household welfare analysis and applied development economics, while providing micro-level evidence from a subnational Vietnamese setting.
2. Literature Review
2.1. Theoretical Framework
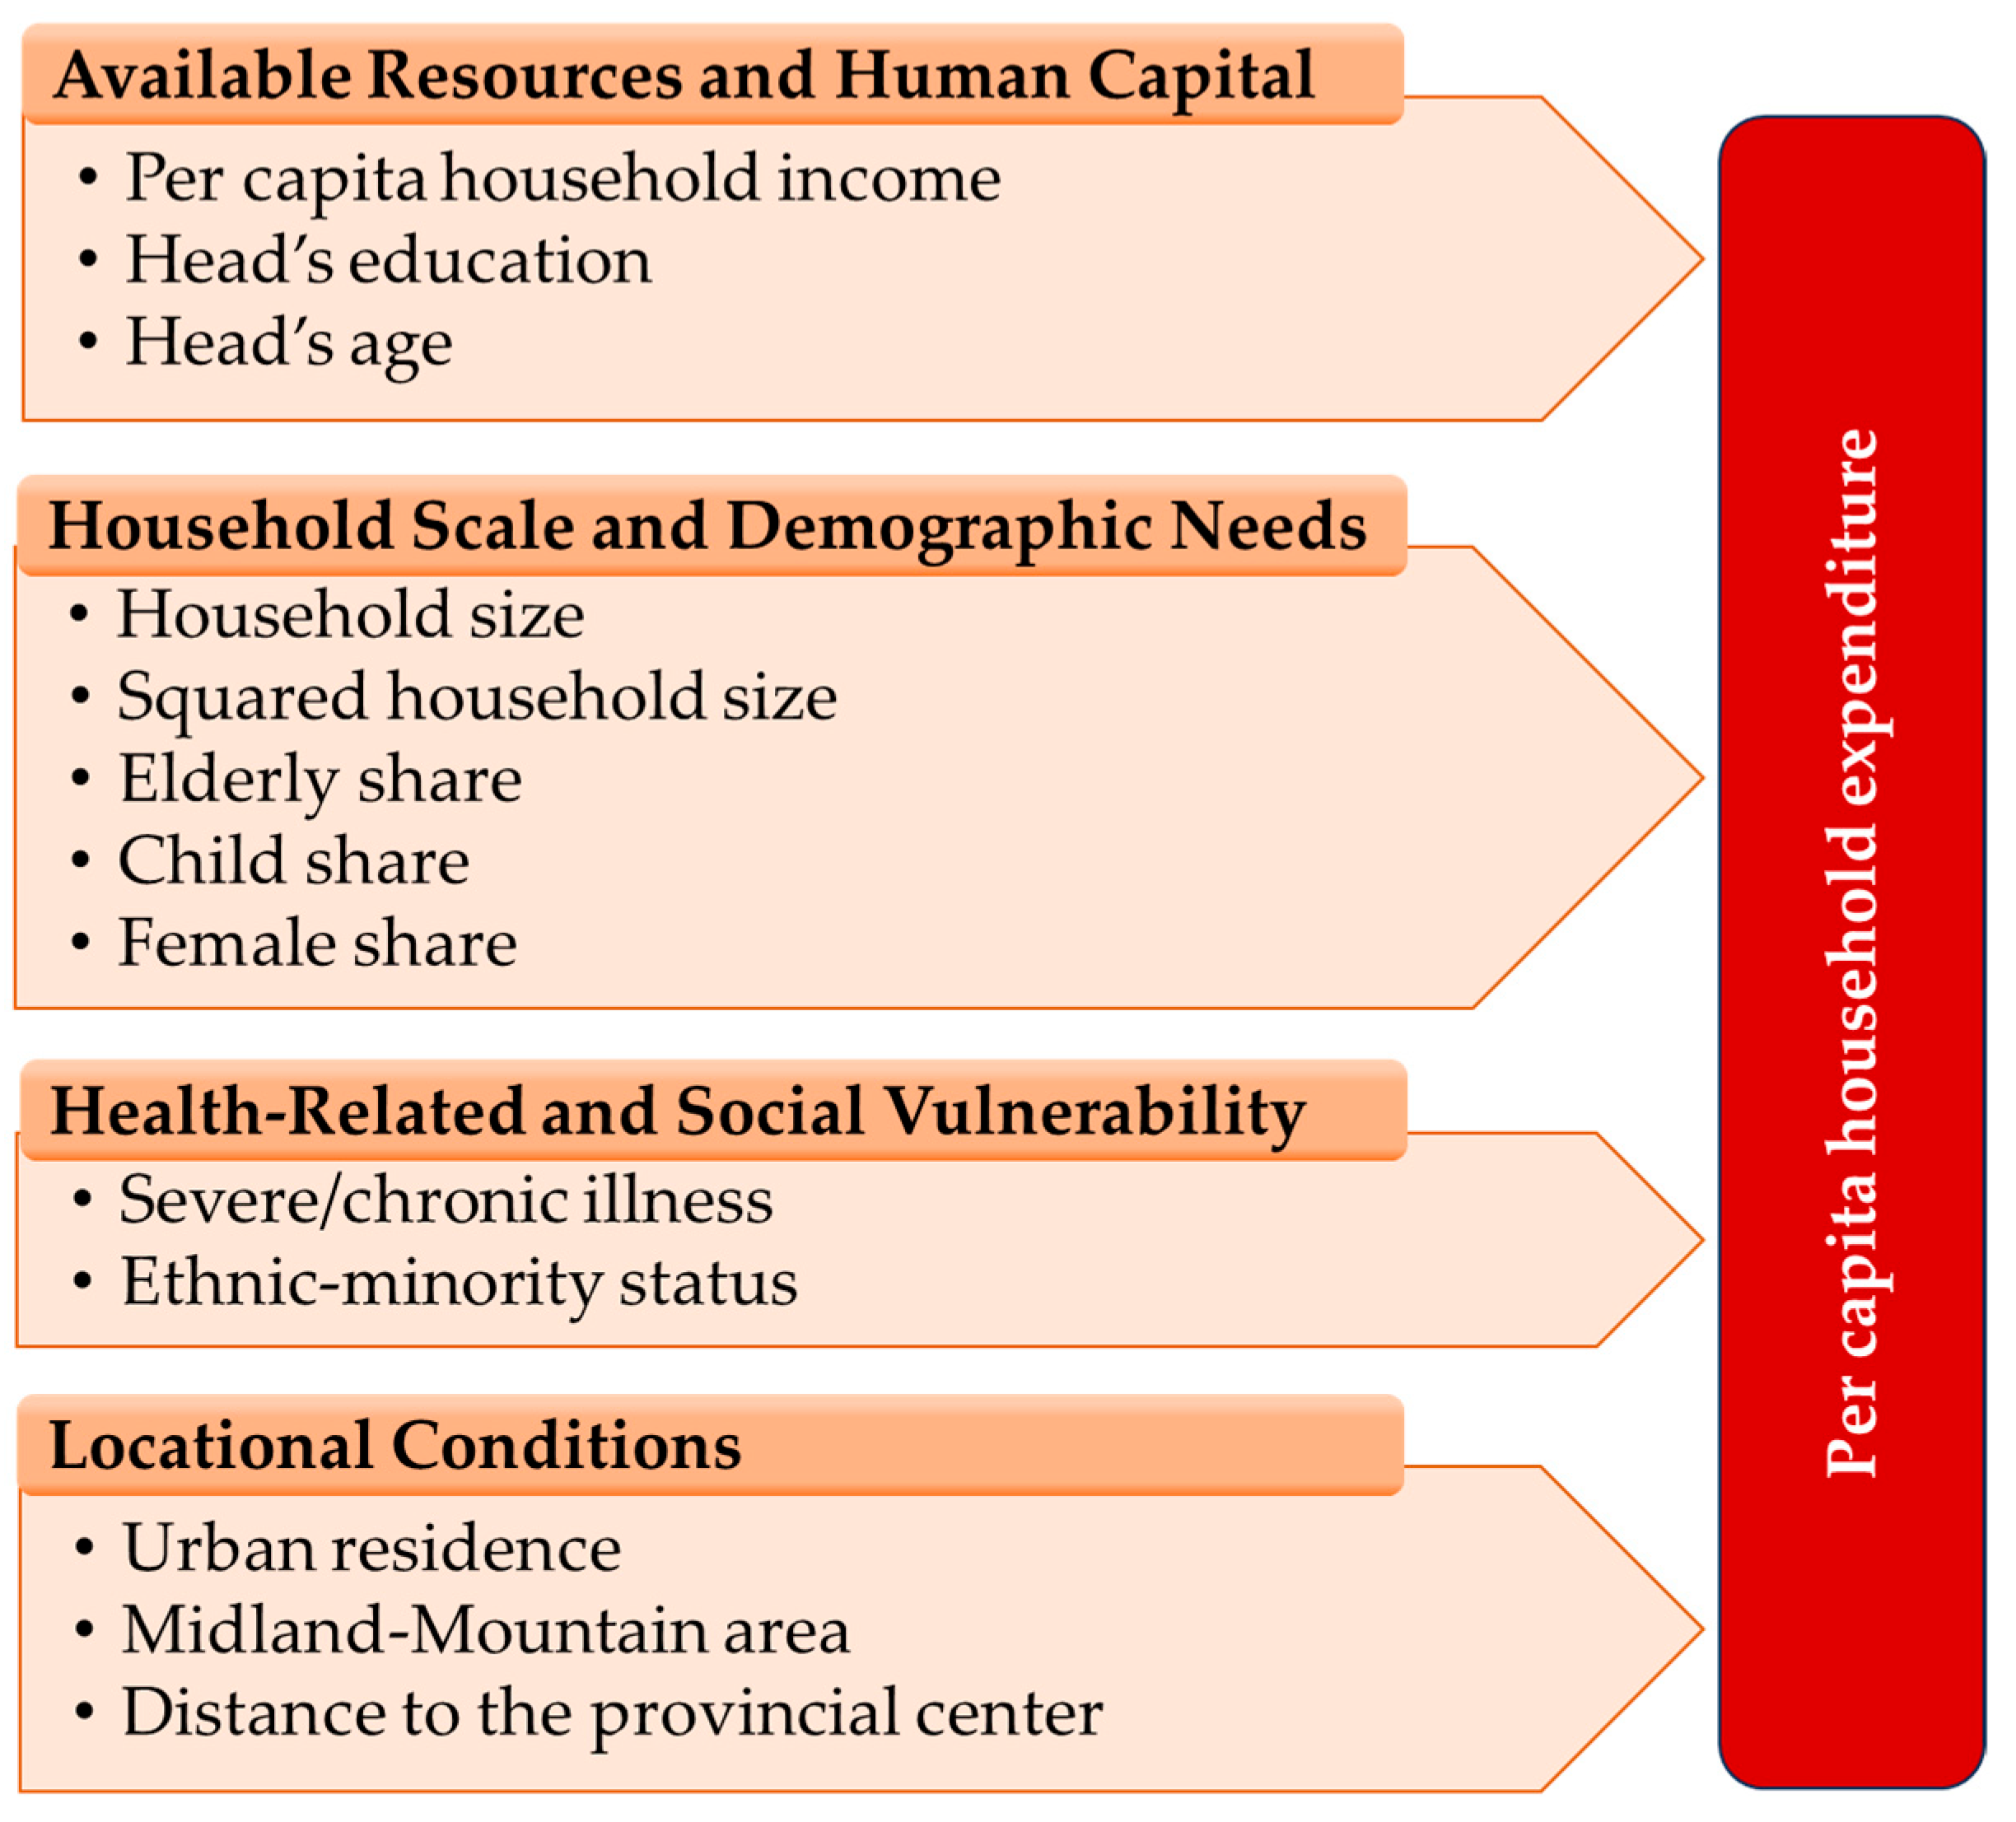
This study is organized around four analytical dimensions that are directly aligned with the empirical specification: available resources and human capital, household scale and demographic needs, health-related and social vulnerability, and locational conditions. The use of per capita household expenditure as the welfare outcome is consistent with the expenditure-based approach to welfare analysis, which is widely used because expenditure often reflects realized living standards more reliably than current income, especially when income is volatile or imperfectly reported (
Deaton & Zaidi, 2002;
Madudova & Corejova, 2023). These four dimensions provide the conceptual basis for the empirical model rather than a separate descriptive framework.
The first dimension is available resources and human capital, captured by per capita income, the household head’s education, and the household head’s age. Income provides the immediate resource base for consumption, while education reflects human capital that may improve earning capacity and allocative efficiency within the household (
Heckman, 2015). The head’s age is included to capture life-cycle differences in saving, precautionary motives, and consumption priorities (
Browning & Crossley, 2001). Together, these variables represent current household resources and longer-run economic capacity.
The second dimension is household scale and demographic needs, represented by household size, squared household size, the child share, the elderly share, and the female share. Household size is included because some goods and services, such as housing, utilities, and consumer durables, are jointly consumed, generating economies of scale within the household (
Deaton & Paxson, 1998;
Madudova & Corejova, 2023). However, these gains from sharing may weaken as households become larger, implying a nonlinear association between household size and per capita expenditure (
Deaton & Paxson, 1998). Child, elderly, and female shares are included because households with different age and gender structures may face different consumption needs. This logic is consistent with the equivalence-scale literature, which emphasizes that welfare comparisons across households should account for both household size and differences in needs across members (
Madudova & Corejova, 2023;
White & Masset, 2002).
The third dimension is health-related and social vulnerability, represented by illness burden and ethnic-minority status. Severe or chronic illness can increase unavoidable out-of-pocket spending and reallocate household budgets toward treatment and care, thereby weakening the link between observed expenditure and underlying welfare (
Mpuuga et al., 2025;
Thuong et al., 2022). Health expenditure shocks can also intensify financial stress and poverty risk (
Mpuuga et al., 2025;
Voto et al., 2025). Ethnic-minority status is included because it may capture structural disadvantage associated with weaker access to education, markets, public services, and stable income opportunities, particularly in Vietnam (
World Bank, 2022).
The fourth dimension is locational conditions, represented by urban residence, mountain location, and distance to the provincial center. Location may shape household expenditure through differences in labor-market access, schools, health services, transportation networks, and consumer markets (
Nguyen, 2019). It may therefore be associated with both income-generating opportunities and the costs of meeting household needs (
Ayyash & Sek, 2020;
World Bank, 2022). In this study, locational variables are treated as contextual conditions that may be associated with expenditure alongside household resources, demographic structure, and vulnerability.
Taken together, these four dimensions imply that per capita household expenditure should be analyzed as a welfare outcome associated with resources, household scale and needs-, vulnerability-, and location-specific conditions. The empirical model assesses these dimensions jointly in a cross-sectional setting, and
Figure 1 summarizes their links with per capita household expenditure.
2.2. International Empirical Evidence
International empirical studies point to several regularities in household expenditure behavior. First, per capita expenditure is generally positively associated with household income, but the response is often less than proportional. This pattern is consistent with life-cycle and consumption-smoothing arguments, according to which households do not translate current income gains one-for-one into current consumption but may allocate part of additional resources to savings, debt reduction, or precautionary buffers (
Browning & Crossley, 2001;
Carroll, 1997). Recent applied work also shows that household consumption expenditure is associated with a broader set of household characteristics rather than income alone (
Ayyash & Sek, 2020;
Habanabakize, 2021).
Second, household size is consistently identified as an important correlate of expenditure. Larger households may benefit from shared consumption of housing, utilities, and other household public goods, generating economies of scale; however, the marginal benefit of sharing tends to weaken as household size increases. This implies that the relationship between household size and per capita expenditure may be nonlinear rather than strictly monotonic (
Deaton & Paxson, 1998). Applied empirical studies similarly show that household size is closely related to consumption expenditure and expenditure inequality (
Deaton & Paxson, 1998;
Heshmati et al., 2019).
Third, demographic composition matters because households with different age and gender structures face different expenditure needs. A higher child share may be associated with greater demand for food, schooling, and care-related spending, although the net association with per capita expenditure depends on how these needs interact with household scale economies. The expenditure implications of population aging are more mixed across settings: older households may devote larger budget shares to healthcare and related services, but total per capita expenditure may increase, remain stable, or decline depending on pension coverage, health insurance, and household support arrangements. Evidence from consumer expenditure data indicates that healthcare is one of the few expenditure categories that tends to rise with age, even when other spending categories fall (
Chalise, 2020;
White & Masset, 2002). Gender-related differences appear more clearly in budget allocation than in the overall level of per capita expenditure; when women control a larger share of resources, households often allocate more toward food quality, child wellbeing, schooling, and health-related items, although this association is context-dependent (
Thomas, 1990).
Finally, evidence from low- and middle-income countries emphasizes the role of vulnerability and structural disadvantage. Health expenditure shocks can increase out-of-pocket spending and push households into financial stress or poverty, while disadvantages linked to location, ethnicity, or weak access to services can widen welfare gaps across otherwise similar households. Recent studies in
Economies show that health expenditure shocks and out-of-pocket medical payments are closely tied to poverty risk and expenditure pressure, reinforcing the importance of incorporating vulnerability-related factors in household expenditure models (
Mpuuga et al., 2025;
Voto et al., 2025).
2.3. Empirical Evidence from Vietnam
Evidence from Vietnam broadly supports the international findings but also points to important context-specific features. Studies using Vietnamese household survey data show that expenditure-based welfare measures are central to poverty assessment and that adjustments for household size and composition matter for the interpretation of living standards (
National Statistics Office, 2025).
White and Masset (
2002) further show that child poverty estimates in Vietnam are sensitive to assumptions about adult equivalence scales, highlighting the importance of household composition in welfare analysis (
White & Masset, 2002).
Vietnamese evidence also documents persistent welfare gaps between ethnic-minority households and the Kinh-Hoa majority.
Baulch et al. (
2007) show that majority households have substantially higher living standards than minority households, while recent World Bank assessments continue to emphasize that ethnicity and remoteness remain major drivers of unequal welfare outcomes despite overall poverty reduction (
Baulch et al., 2007;
World Bank, 2022).
With respect to demographic structure and health-related vulnerability, the Vietnamese literature suggests that children may place additional pressure on household budgets through education and care needs, while the expenditure implications for older household members are often mediated by healthcare needs and financial protection (
General Statistics Office, 2021). Recent survey evidence shows that out-of-pocket spending for older household members can account for a large share of household health expenditure and can generate catastrophic spending or financial distress, especially in rural and remote settings (
N. H. Giang et al., 2022). Related work also indicates that healthcare utilization among older people can impose substantial burdens on Vietnamese households, particularly where chronic conditions are present (
L. T. Giang et al., 2023).
The broader literature on health expenditure in Vietnam reaches similar conclusions. Catastrophic health expenditure remains a significant risk, especially in disadvantaged and mountainous regions, and severe illness episodes can materially worsen household welfare (
Thuong, 2021;
Thuong et al., 2022). Together, these findings suggest that age structure may be associated with household expenditure not only through demographic needs but also through health-related financial pressure.
Overall, the Vietnamese evidence confirms that income, household composition, ethnicity, and health-related shocks are all relevant to welfare outcomes. However, much of the literature focuses on poverty, ethnic inequality, child poverty, or catastrophic health expenditure separately. Relatively few studies assess household size, demographic composition, income, health burden, ethnic-minority status, and structural disadvantage jointly within a single micro-level expenditure model. This is the empirical gap to which the present study responds.
2.4. Research Gaps
The foregoing review points to several limitations in the literature. First, while expenditure-based measures are widely used in welfare analysis, many studies examine either total household expenditure or welfare indices based on externally imposed equivalence scales, rather than modeling per capita household expenditure directly within a unified empirical framework. In addition, nonlinearities in household size are not always incorporated explicitly, which makes it difficult to identify whether scale economies persist as households become larger or whether resource dilution begins to dominate.
Second, demographic structure is often represented by broad dependency measures, such as aggregate dependency ratios, rather than by separate indicators for children, older adults, and gender composition. Although such aggregate measures are useful for summary description, they can obscure differences in expenditure needs across household members and limit the interpretability of demographic associations in expenditure models.
Third, the literature does not always consider demographic structure together with vulnerability-related and contextual factors in a single specification. Health-related burdens, ethnic disadvantage, and locational conditions may all shape household expenditure alongside income and household composition. When these factors are examined separately, inference on the correlates of per capita expenditure may remain incomplete, especially in settings where social and spatial disadvantages intersect.
This limitation is particularly relevant in Vietnam, where much of the available evidence focuses on national poverty, ethnic inequality, child poverty, or catastrophic health expenditure. Few studies have examined per capita household expenditure using micro-level data from a single province in a way that captures within-province heterogeneity.
Against this background, the present study provides micro-level evidence on the correlates of per capita household expenditure in Binh Dinh Province, Vietnam. Specifically, it models per capita household expenditure as a function of income, household size and its quadratic term, demographic composition, health-related burden, ethnic-minority status, and locational conditions within a single empirical framework. In doing so, this study offers evidence on how household scale, demographic needs, and vulnerability-related factors are associated with welfare differences in a developing-region context, while complementing conventional estimation with bootstrap-based inference and standard diagnostic checks.
2.5. Research Hypotheses
Per capita household expenditure is expected to be positively associated with monthly per capita household income, although the elasticity is likely to remain below one because households smooth consumption over time rather than adjusting expenditure one-for-one with current income changes. In addition, the household head’s education is expected to be positively associated with expenditure, whereas the head’s age may show a negative association because of life-cycle and precautionary effects (
Browning & Crossley, 2001;
Deaton & Zaidi, 2002).
H1. Available resources and human capital are significantly associated with per capita household expenditure.
Household scale and demographic structure are also expected to matter. Household size is hypothesized to exhibit a nonlinear association with per capita household expenditure because economies of scale may operate at smaller household sizes, while resource dilution may become more important as household size increases. A higher child share is expected to be positively associated with expenditure, whereas the associations of elderly share and female share with expenditure are left open ex ante (
Deaton & Paxson, 1998;
White & Masset, 2002).
H2. Household scale and demographic needs are significantly associated with per capita household expenditure.
Health-related and social vulnerability may further be associated with household expenditure. Severe or chronic illness is expected to be positively associated with expenditure because of higher out-of-pocket spending, while ethnic-minority status is expected to be negatively associated with expenditure because it may capture persistent structural disadvantage in access to opportunities and services (
Mpuuga et al., 2025;
Thuong et al., 2022;
World Bank, 2022).
H3. Health-related and social vulnerability are significantly associated with per capita household expenditure.
Finally, locational conditions are expected to be associated with expenditure through differences in market access, service access, and economic opportunities. Urban residence is expected to be positively associated with per capita household expenditure, while residence in a midland–mountain area and greater distance to the provincial center are expected to be negatively associated with expenditure, conditional on the other observed household characteristics in the model (
World Bank, 2022).
H4. More favorable locational conditions are associated with higher per capita household expenditure.
3. Methods
3.1. Data and Study Setting
This study uses cross-sectional household survey data collected in Binh Dinh Province, Vietnam, between January and April 2025, before the provincial administrative reorganization implemented in July 2025. For consistency, the study area is referred to as Binh Dinh Province. The province provides a suitable setting for examining household expenditure because it contains marked intra-provincial differences between the more urbanized eastern coastal/plain area and the less-connected western midland–mountain area.
The final sample consists of 320 households. The target sample size was determined using Cochran’s formula for proportions at the 95% confidence level, assuming maximum variability and an allowable error of 0.055. After applying the finite population correction to the household population of the six selected administrative units, the minimum required sample size was approximately 316 households; the final sample was set at 320 households to maintain statistical precision.
The survey followed a multi-stage stratified cluster design. Six district-level units were selected to capture intra-provincial heterogeneity: Quy Nhon City, Phu Cat District, and Phu My District in the eastern coastal/plain area and An Lao District, Van Canh District, and Vinh Thanh District in the western midland–mountain area. The sample was allocated as follows: Quy Nhon City, 71 households; Phu Cat District, 61; Phu My District, 58; An Lao District, 43; Van Canh District, 43; and Vinh Thanh District, 44. This allocation combined a minimum number of observations per district-level unit with proportional allocation to household population size, balancing statistical coverage with representation of less-populated midland–mountain areas.
Within each district-level unit, two communes or wards were selected to reflect medium and lower living-standard conditions and to capture variation in the urban–rural setting, accessibility, infrastructure, and dominant livelihood activities. Eligible households were listed with support from local administrative authorities and were randomly selected from local household lists to meet the assigned quota. Face-to-face interviews were conducted using a semi-structured questionnaire administered to household heads or, when unavailable, to adult household representatives knowledgeable about household socioeconomic conditions. The questionnaire included items on household demographic composition, household size, household-head education, income sources, expenditure categories, health conditions of household members, ethnicity, place of residence, and locational/accessibility characteristics. These items provided the household-level information used to construct the variables defined in
Section 3.2 and
Table 1.
The sample is therefore best interpreted as an analytically stratified household sample designed to examine within-sample associations across contrasting territorial settings, rather than as a fully representative probability sample of the entire province or Vietnam as a whole. Accordingly, the regression estimates are reported without sampling weights.
3.2. Variables and Measurement
The dependent variable is the natural logarithm of monthly per capita household expenditure (ln_exp). Monthly per capita expenditure was calculated as total annual household expenditure divided by the average number of household members during the year and then by 12. Total expenditure included spending on food and drink; education; healthcare; productive investment; housing construction and repairs; housing-related living conditions; social obligations such as weddings and funerals; and other reported items. The variable was measured in million VND per person per month before logarithmic transformation. All households reported positive expenditure, so the logarithmic transformation was applied directly.
The key explanatory variable is the natural logarithm of monthly per capita household income (ln_inc). Monthly household income was calculated from wages and salaries; agriculture; forestry and fisheries; non-farm self-employment and services; remittances; and other regular transfers. Monthly per capita income was obtained by dividing total monthly household income by household size and was measured in million VND per person per month before logarithmic transformation. All households reported positive income, so the logarithmic transformation was applied directly.
The remaining explanatory variables follow the analytical framework in
Figure 1. Available resources and human capital are represented by
ln_inc, the household head’s age (
age_head), and education level (
edu_head). Household scale and demographic needs are measured by mean-centered household size (
hhsize_c), its squared term (
hhsize_c2), the elderly share (
share65), the child share (
share_u15), and the female share (
share_female). Mean-centering household size before squaring reduces collinearity between the linear and quadratic terms and facilitates interpretation of the nonlinear household-size association.
Health-related and social vulnerability are captured by the number of household members with severe or chronic illness (illness) and ethnic-minority status (minority). The illness variable is self-reported and refers to physician-diagnosed severe or chronic conditions, including cancer, cardiovascular disease, diabetes, chronic kidney failure, severe mental disorders, and serious neurological or spinal conditions. Ethnic-minority status is coded 1 for ethnic-minority households and 0 for Kinh households.
Locational conditions are represented by urban residence (
urban), residence in the western midland–mountain zone (
mountain), and road distance to Quy Nhon (
dist_QN). Urban residence is coded 1 for urban households and 0 otherwise; mountain residence is coded 1 for households in the western midland–mountain zone and 0 for those in the eastern coastal/plain area. Distance to Quy Nhon is measured in kilometers.
Table 1 reports the operational definitions, scales, and expected directions of all variables.
3.3. Empirical Specification
To examine the correlates of per capita household expenditure, the following log-linear regression model is estimated:
where
- -
ln_exp denotes the natural logarithm of per capita household expenditure for household i.
- -
is the intercept.
- -
are slope coefficients.
- -
is the idiosyncratic error term.
The log-linear specification is chosen for three reasons. First, it reduces the influence of skewness in expenditure and income distributions. Second, it allows the coefficient on logged income to be interpreted as an expenditure–income elasticity. Third, it provides a convenient framework for examining the nonlinear role of household size by including both the linear and quadratic terms.
The coefficients are interpreted as conditional associations rather than causal effects, given the cross-sectional nature of the data.
3.4. Estimation Strategy and Diagnostic Checks
The baseline model is estimated using ordinary least squares (OLS). OLS is appropriate here because the dependent variable is continuous, and the primary objective is to estimate conditional associations between per capita household expenditure and a set of household-level characteristics within a transparent and interpretable framework.
To strengthen inference, this study complements conventional OLS estimation with bias-corrected and accelerated (BCa) bootstrap inference based on 2000 replications. This procedure is used to improve the reliability of standard errors and confidence intervals in a moderate-sized sample and to reduce sensitivity to distributional assumptions.
Several diagnostic checks are conducted to assess model adequacy. Multicollinearity is evaluated using variance inflation factors (VIFs), with values below 5 taken as evidence that collinearity is not severe. Residual dependence is assessed using the Durbin–Watson statistic, reported as a standard diagnostic even though the data are cross-sectional. The distribution of residuals is examined using residual plots, histograms, and normal probability plots, while overall model fit is evaluated using the F-test and adjusted . These diagnostics verify that the estimated model is sufficiently stable for interpretation.
3.5. Remarks on Interpretation
Given that the data are cross-sectional, the empirical results should be interpreted as conditional associations rather than causal effects, and because the survey does not provide a credible external instrument, the analysis does not attempt causal identification. The estimated coefficients may reflect unobserved household characteristics, measurement error, omitted variables, or simultaneity in some cases. Accordingly, this analysis is intended to identify robust empirical patterns consistent with the analytical framework, rather than to make strong causal claims.
Particular caution is required when interpreting the coefficient on per capita household income. Since income and expenditure were measured in the same household survey, the estimated income coefficient should be understood as an expenditure–income association rather than as a causal marginal propensity to consume. Both income and expenditure may be jointly shaped by unobserved factors, such as household assets, occupation, earning capacity, preferences, risk exposure, and recent economic or health shocks.
Similarly, the coefficient on severe or chronic illness should not be interpreted as indicating higher welfare. Given that total household expenditure includes healthcare spending, a positive illness coefficient may partly reflect unavoidable medical and care-related costs. In this sense, illness-related expenditure is interpreted as evidence of health-related financial pressure rather than welfare-enhancing consumption.
4. Results
4.1. Descriptive Statistics
Table 2 reports descriptive statistics for the variables included in the empirical model. The estimation sample consists of 320 households with complete information on all variables.
The dependent variable, the natural logarithm of per capita household expenditure, has a mean of 0.896 and a standard deviation of 0.797, with values ranging from −0.511 to 1.749. The natural logarithm of per capita household income has a mean of 1.218 and a standard deviation of 0.758, indicating substantial variation in household economic resources across the sample. The logarithmic transformation of expenditure and income is intended to reduce skewness and facilitate interpretation within the log-linear specification.
Household size also varies meaningfully across households. Average household size is 3.92 members, with observed values ranging from 1 to 8. In the empirical model, household size is mean-centered; the centered variable has a mean of zero and a standard deviation of 1.194, while the squared term exhibits sufficient dispersion to allow the nonlinear expenditure-size relationship to be identified.
Demographic composition is heterogeneous. The child share averages 9.20%, and the elderly share averages 3.72%, although both variables display wide ranges, indicating substantial differences in dependency structure across households. The female share has a mean of 55.30%, suggesting a broadly balanced gender composition in the sample.
With respect to household-head characteristics, the mean age of the household head is 55.14 years, and the mean education level is 3.16 on the seven-point scale used in the survey. Health-related vulnerability is captured by the number of household members with severe or chronic illness, which averages 0.191, indicating that serious illness burdens are concentrated in a subset of households.
Finally, the sample also shows considerable variation in social and locational characteristics. Ethnic-minority households account for 27.0% of the sample, 22.0% of households are located in urban areas, and 40.6% reside in midland–mountain areas. The mean road distance to the provincial center is 43.59 km, with a range from 5 to 75 km. Overall, the descriptive statistics indicate sufficient variation in household resources, demographic structure, vulnerability, and locational conditions to support the multivariate analysis that follows.
4.2. Bivariate Correlations
Bivariate correlations indicate that per capita household expenditure is positively associated with per capita household income, the household head’s education, and urban residence, and negatively associated with ethnic-minority status, mountain location, distance to the provincial center, the elderly share, and the household head’s age. The centered household-size term is positively correlated with expenditure, whereas its squared term is negatively correlated, a pattern consistent with the nonlinear specification estimated later in the regression analysis. By contrast, the child share, female share, and illness burden show relatively weak bivariate correlations with expenditure.
Table 3 reports Pearson’s correlation coefficients between log per capita household expenditure and the explanatory variables included in the model.
Correlations among the explanatory variables do not suggest severe multicollinearity. Although some locational variables are moderately correlated with one another, this is expected given the spatial structure of the study area. As reported below, variance inflation factors remain below conventional thresholds, indicating that multicollinearity is not a serious concern. Since these correlations are unconditional, differences between the bivariate patterns and the multivariate regression results are to be expected.
4.3. Linear Regression Results
Table 4 reports the OLS estimates for the log of per capita household expenditure. Overall, the model performs well, explaining a substantial share of the variation in expenditure across households (adjusted
;
,
). The results indicate that per capita household expenditure is most strongly associated with per capita household income, household size, child share, severe or chronic illness, and ethnic-minority status.
Per capita household income is the strongest correlate in the model. The coefficient on log per capita household income is 0.687 , implying an expenditure elasticity below one. This estimate indicates that a 1% increase in per capita household income is associated with an increase of about 0.69% in per capita household expenditure. The corresponding BCa 95% confidence interval [0.601, 0.773] is strictly positive, indicating a stable and precisely estimated association.
Household size exhibits a statistically significant nonlinear association with expenditure. The coefficient on the centered household-size term is positive
, whereas the coefficient on the squared term is negative
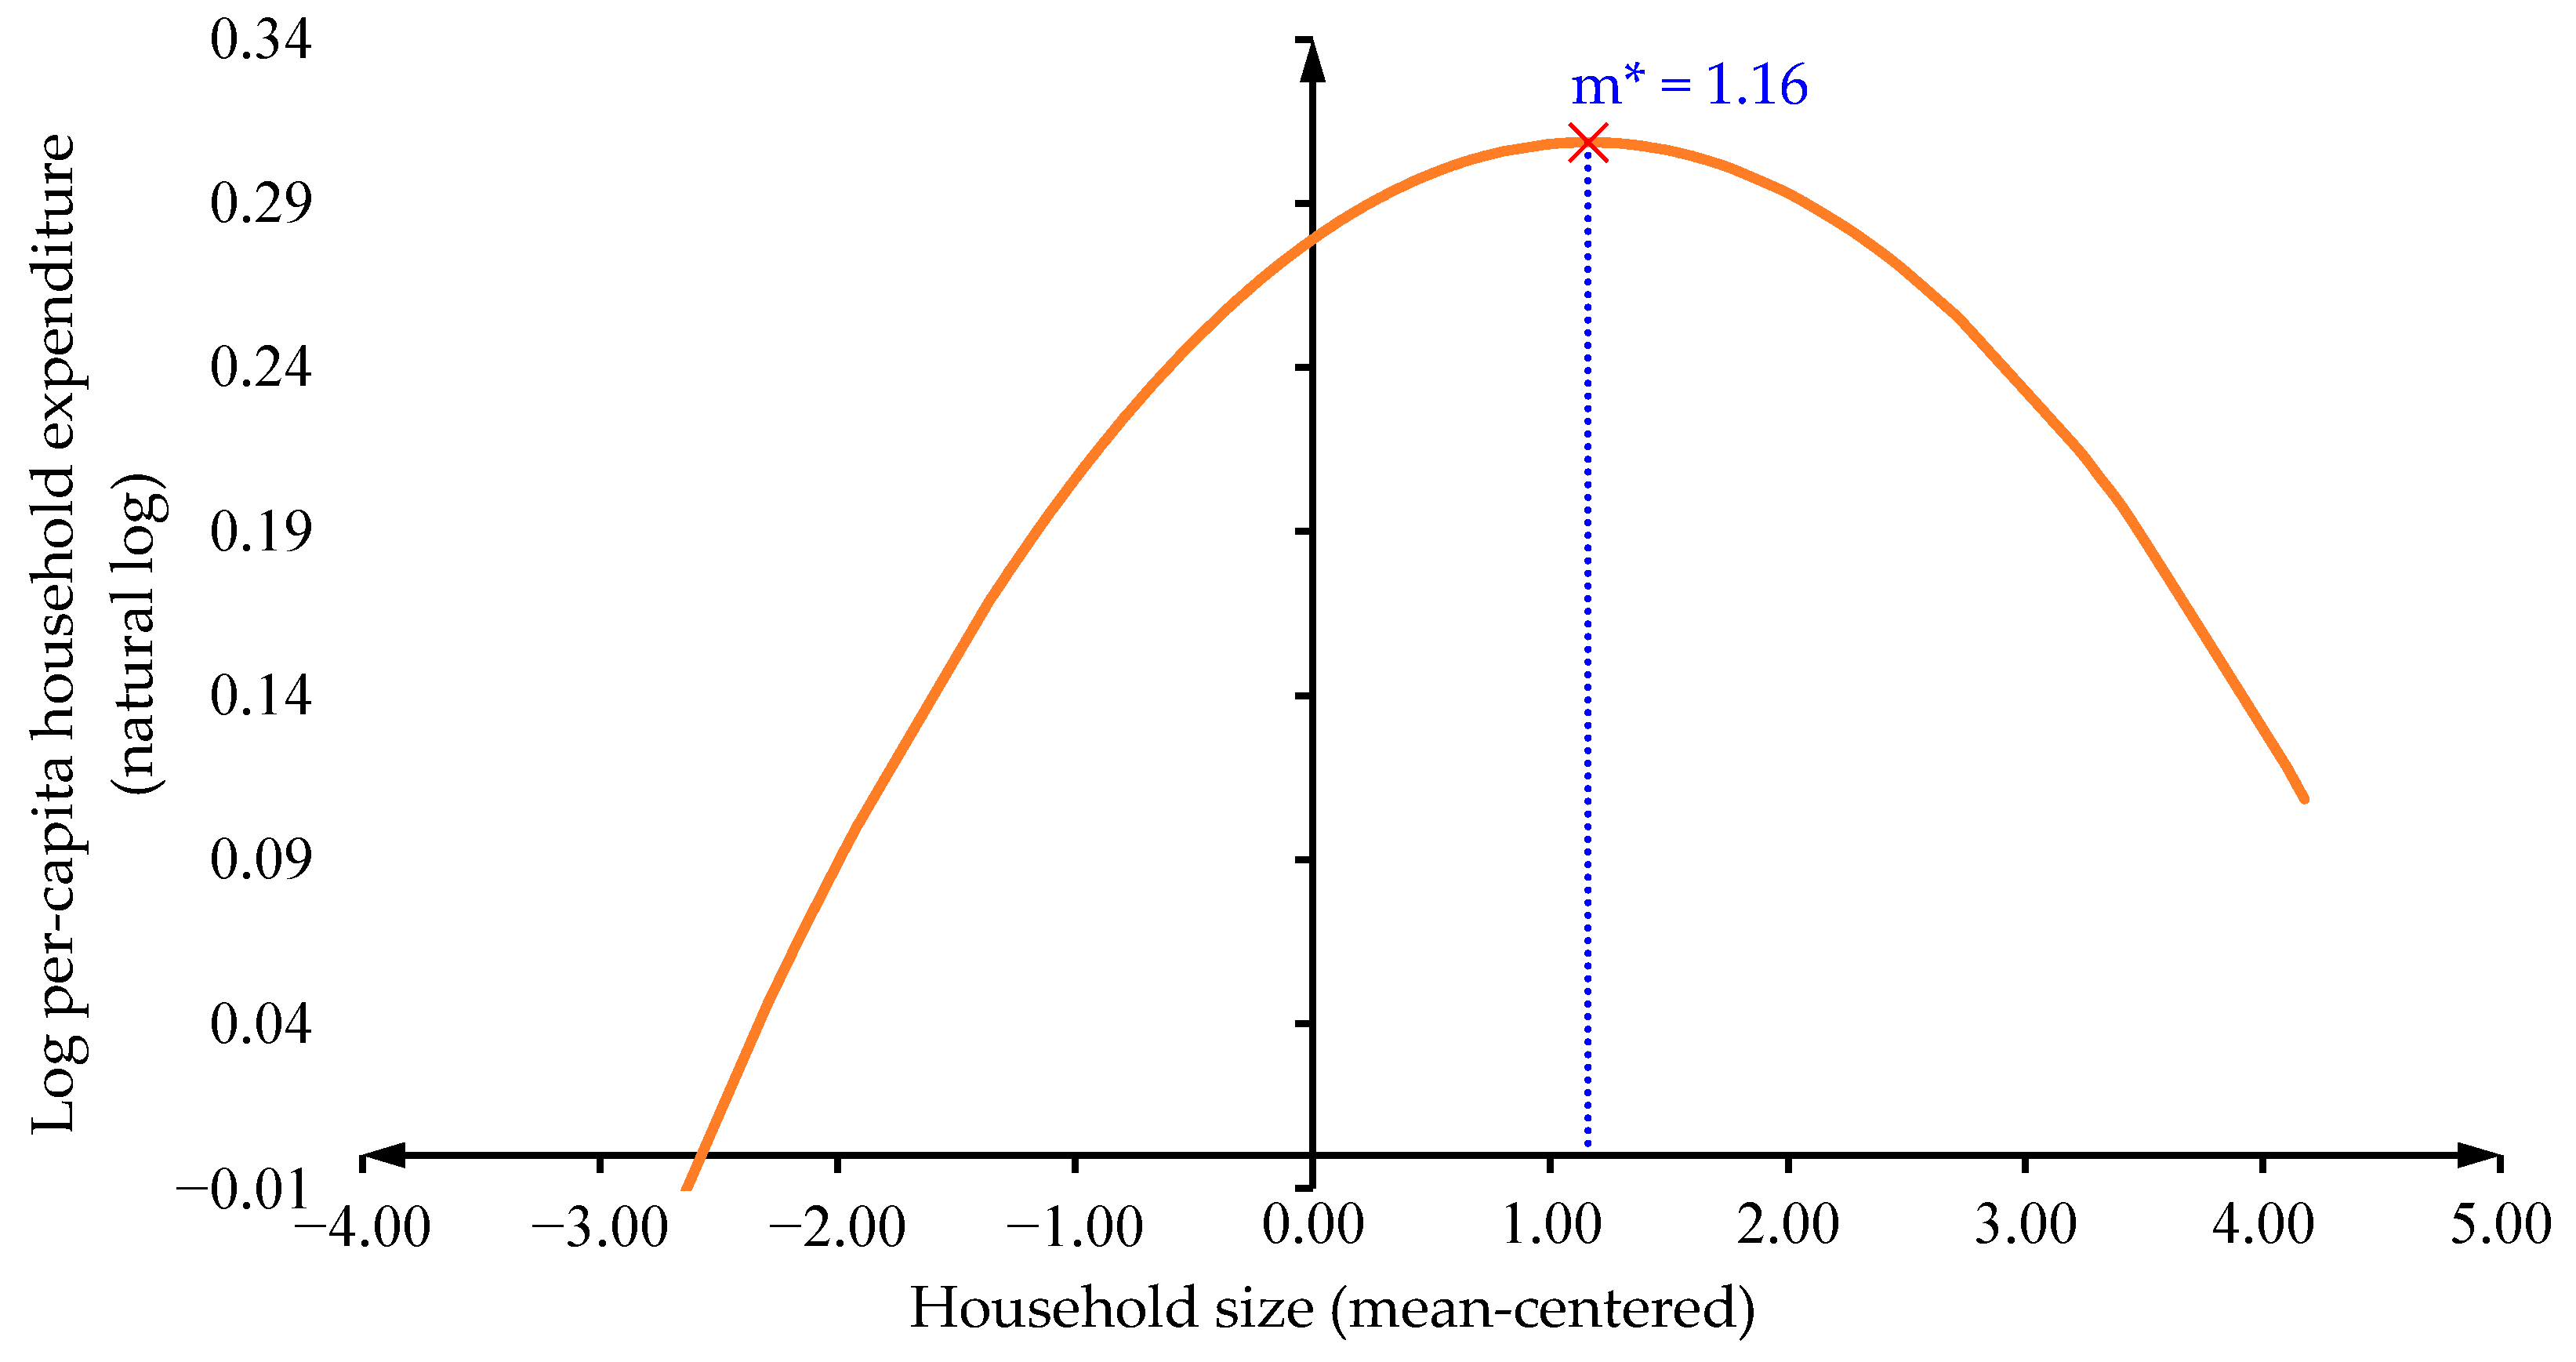
. The corresponding BCa confidence intervals remain away from zero for both terms, supporting a concave relationship between household size and per capita household expenditure. The turning point of the quadratic profile is calculated as
. Using the estimated coefficients, the turning point is approximately 1.16 centered units, which corresponds to about 5.1 household members after adding back the sample mean household size.
Figure 2 illustrates this fitted nonlinear relationship, showing that the expenditure profile initially rises with household size but flattens and eventually declines beyond the turning point. This pattern is consistent with scale economies at smaller household sizes and weaker marginal gains as household size increases.
Among the demographic variables, the child share is positively associated with expenditure , with a BCa 95% confidence interval of [0.002, 0.008]. Given that the share variables are measured in percentage points, this coefficient implies that a one-percentage-point increase in the child share is associated with an increase of about 0.5% in per capita household expenditure. By contrast, the elderly share and female share are not statistically significant in the full specification, and their bootstrap confidence intervals include zero.
The results also indicate clear health-related and social disparities. Severe or chronic illness is positively associated with expenditure , with a BCa 95% confidence interval of [0.145, 0.459]. Using the transformation , this coefficient corresponds to an increase of approximately 36.8% in per capita household expenditure for each additional severely or chronically ill household member. Ethnic-minority status is negatively associated with expenditure , with a BCa 95% confidence interval of , implying per capita expenditure that is approximately 25.2% lower than that of Kinh households, conditional on the other covariates.
Among the remaining controls, the household head’s age has a small negative coefficient , although its BCa confidence interval is close to zero. The coefficient on the household head’s education is positive but not statistically significant. The locational variables provide weaker evidence than the main household-level correlates. Urban residence is positively signed , mountain location is negatively signed , and distance to the provincial center is positively signed , but these coefficients are smaller and less stable than those for income, household size, child share, illness burden, and ethnic-minority status. For this reason, the locational effects should be interpreted cautiously.
Taken together, the baseline estimates suggest that per capita household expenditure in the study setting is primarily associated with household resources, nonlinear household scale effects, child-related expenditure needs, illness burden, and ethnic-minority disadvantage. These patterns provide the basis for the diagnostic and robustness analyses that follow.
4.4. Diagnostic Checks
The diagnostic results suggest that the baseline OLS specification is broadly suitable for interpretation, although some departures from constant error variance are present. Multicollinearity does not appear to be a serious concern, as all variance inflation factors (VIFs) are below 5, with a maximum VIF of 3.686. The Durbin–Watson statistic is 1.872, which lies close to 2 and does not suggest problematic residual dependence.
Visual residual diagnostics indicate that the residuals are broadly centered around zero, although normality is only approximate rather than exact. The histogram is reasonably symmetric, the normal probability plot shows some deviation in the tails, and the standardized residual-versus-predicted plot does not reveal a pronounced funnel pattern, although some structured banding is visible. Influence diagnostics further indicate that the main regression results are not driven by a small number of highly influential observations: the maximum Cook’s distance is 0.072, while only a limited number of observations show moderately high leverage or studentized residuals slightly beyond the conventional ±3 threshold.
Heteroskedasticity was additionally assessed using the Glejser test, in which the absolute residuals were regressed on the full set of explanatory variables. The test is statistically significant , indicating evidence of non-constant error variance. Accordingly, the coefficient estimates are interpreted with additional support from BCa bootstrap inference based on 2000 replications.
4.5. Robustness Checks
Two simple robustness checks were conducted to assess whether the baseline findings depend on the locational controls. First, the model was re-estimated without distance to the provincial center. Second, the full set of locational variables was excluded (urban residence, mountain location, and distance to the provincial center). Across both alternative specifications, the main coefficient patterns remained substantively stable. In particular, per capita income remained strongly positive, the household-size profile remained concave, the child share remained positively associated with expenditure, illness burden remained strongly positive, and ethnic-minority status remained negative.
The overall explanatory power of the models also changed only marginally, with the adjusted declining from 0.732 in the baseline model to 0.730 when distance to the provincial center was excluded and to 0.726 when the full locational block was removed. These results suggest that the main findings are not dependent on a particular choice of locational controls and are reasonably robust across alternative specifications.
5. Discussion
The discussion focuses on the main empirical patterns emerging from the regression results, with particular attention to the roles of household resources, household scale and demographic needs, health-related and social vulnerability, and locational conditions. Overall, the findings suggest that variation in per capita household expenditure is more strongly associated with income, nonlinear household-size effects, child-related expenditure needs, illness burden, and ethnic-minority disadvantage than with locational factors alone.
5.1. Available Resources and Human Capital
The findings provide partial support for H1: current household resources, especially per capita income, are the clearest resource-related correlate of per capita household expenditure, whereas the direct roles of education and age are weaker once income is controlled for. The less-than-proportional expenditure–income association suggests that households do not translate income differences one-for-one into current expenditure. This pattern is consistent with life-cycle and consumption-smoothing theory, which suggests that households do not adjust current expenditure one-for-one with current income changes (
Browning & Crossley, 2001;
Jappelli & Pistaferri, 2010). It is also consistent with the welfare-measurement literature, which treats expenditure as a useful indicator of realized living standards while recognizing that the expenditure–income relationship need not be unit elastic (
Deaton & Zaidi, 2002;
Madudova & Corejova, 2023).
This interpretation is broadly consistent with empirical evidence from developing and middle-income settings, where household resources remain central to expenditure differences even after other household characteristics are considered (
Ayyash & Sek, 2020;
Habanabakize, 2021;
Heshmati et al., 2019). In the present study setting, income therefore appears to constitute the main resource-related gradient in household expenditure, which is also in line with broader evidence on welfare inequality in Vietnam (
World Bank, 2022).
By contrast, the human-capital variables display weaker direct associations once income is controlled for. The weak direct association of the household head’s education suggests that education may influence expenditure mainly through earning capacity and economic opportunity rather than through an independent expenditure channel once current income is included in the model. This interpretation is consistent with the broader household-economics literature, in which education is typically understood as a productivity-enhancing asset that shapes labor-market outcomes and household resources (
Heckman, 2015). It is also compatible with applied evidence showing that income-related variables tend to dominate direct education effects in reduced-form expenditure equations (
Heshmati et al., 2019).
The negative but modest association between the household head’s age and expenditure is also consistent with life-cycle considerations, under which older households may exhibit slower expenditure growth or stronger precautionary motives relative to earlier stages of the life course (
Browning & Crossley, 2001). Overall, this first dimension indicates that per capita household expenditure is associated primarily with current economic resources, while education and age appear to play more indirect or secondary roles once income is explicitly taken into account.
5.2. Household Scale and Demographic Needs
The findings provide clear support for H2 with respect to household scale and child-related expenditure needs. Household size is associated with per capita expenditure in a nonlinear way, suggesting that scale economies exist but are not unlimited. At smaller household sizes, shared consumption of housing, utilities, and other household public goods may support higher per capita expenditure, whereas this advantage weakens as household size increases and household needs expand. This interpretation is consistent with the broader literature on household economies of scale and with the longstanding view that welfare comparisons across households should account for both shared consumption and variation in needs across members (
Deaton & Paxson, 1998;
Deaton & Zaidi, 2002).
This result is also consistent with recent microdata-based evidence showing that larger households may benefit from cost-sharing, but that these benefits depend on the composition of household consumption and household production arrangements (
Casado et al., 2025;
Crossley & Lu, 2018). In the Binh Dinh setting, the nonlinear pattern is plausible because households often share housing and utilities, but additional members also increase food, education, health, and care-related needs.
The positive association of the child share further indicates that demographic composition matters beyond household size alone. Households with more children may face higher needs for food, schooling, clothing, transport, and care, even when income and overall household size are taken into account (
Rapp & Thévenon, 2025). This finding is consistent with the equivalence-scale literature, which emphasizes that children impose distinct consumption needs that are not fully captured by simple per capita normalization (
Deaton & Zaidi, 2002;
White & Masset, 2002).
By contrast, the elderly share does not show a robust direct association with total per capita expenditure. This should not be interpreted as evidence that aging is irrelevant for household welfare (
Glinskaya et al., 2021). Rather, it suggests that the expenditure implications of older household members may be more heterogeneous than those of children, depending on pension support, family care arrangements, and medical cost protection (
Chalise, 2020). In this model, aging may be reflected less through the elderly share itself and more through specific channels, such as illness and care needs.
The female share also has no robust direct association with total per capita expenditure after other household characteristics are considered. This result is consistent with the intra-household allocation literature, which suggests that gender-related effects may be more visible in budget composition than in aggregate expenditure levels. Women’s bargaining position and gender composition may influence what households spend on—such as food quality, child wellbeing, or health—more than how much households spend in total (
Doss, 2013;
Thomas, 1990).
Taken together, the second analytical dimension shows that H2 is supported mainly through the nonlinear household-size pattern and child-related needs. Elderly and female shares appear to have weaker direct associations with total expenditure once income, illness, and other household characteristics are held constant. This overall pattern reinforces the view that household scale and demographic composition matter for welfare analysis, but that their associations are not uniform and cannot be fully captured by simple per capita or dependency measures alone (
Deaton & Paxson, 1998;
Deaton & Zaidi, 2002;
White & Masset, 2002).
5.3. Health-Related and Social Vulnerability
These findings provide strong support for H3, showing that health-related and social vulnerability are important dimensions of variation in per capita household expenditure. Severe or chronic illness is associated with higher expenditure, while ethnic-minority status is associated with lower expenditure after other household characteristics are taken into account. These opposite signs are empirically important because they indicate two different vulnerability mechanisms: illness raises expenditure through financial pressure, whereas ethnic-minority status is linked to lower realized expenditure through structural disadvantage. This result is consistent with the broader literature showing that illness shocks increase household out-of-pocket spending and place pressure on current budgets, especially in settings where financial protection remains incomplete (
Mpuuga et al., 2025;
Voto et al., 2025).
This positive association should not be interpreted as evidence of higher welfare. Rather, it is more plausibly read as an indicator of health-related financial pressure. Higher spending associated with illness is more likely to reflect defensive or unavoidable expenditure than improved living standards (
Bales & Hương, 2025). This interpretation is consistent with evidence from low- and middle-income countries showing that health shocks can raise direct medical payments, crowd out other forms of consumption, and increase the risk of impoverishment or financial distress (
Mpuuga et al., 2025;
Van Minh et al., 2013;
World Health Organization, 2021).
This finding is also consistent with evidence from Vietnam, where catastrophic health expenditure remains a concern, especially among disadvantaged households and those facing severe or chronic illness (
Thuong et al., 2022). Studies on older people in Vietnam similarly show that healthcare utilization and out-of-pocket payments can impose substantial burdens where chronic conditions are present (
L. T. Giang et al., 2023;
N. H. Giang et al., 2022). In the present model, severe or chronic illness therefore captures a form of expenditure pressure that is not reducible to income, household size, or location alone.
The negative association of ethnic-minority status points to a different form of vulnerability. It suggests that lower expenditure among ethnic-minority households is not explained solely by observed income or residence but may also reflect broader structural disadvantage (
Nguyen & Tarp, 2024). This interpretation is consistent with evidence from Vietnam showing that ethnic-minority households continue to face weaker access to education, labor-market opportunities, infrastructure, and public services, resulting in persistent welfare gaps relative to the Kinh majority (
Baulch et al., 2007;
Dutta, 2022;
World Bank, 2022).
Taken together, these findings show that household expenditure is associated not only with resources and demographic needs but also with exposure to health-related financial pressure and structural social disadvantage. Although illness and ethnic-minority status operate in different directions, both indicate forms of vulnerability that affect household welfare beyond the income channel alone. This interpretation is consistent with the World Bank’s broader assessment that poverty and welfare gaps in Vietnam remain closely linked to ethnicity, vulnerability, and unequal access to opportunities and services (
World Bank, 2022).
5.4. Locational Conditions
The findings provide only limited support for H4. Locational variables have the expected signs, with urban residence positively associated with expenditure and midland–mountain residence negatively associated with expenditure, but their direct associations are weaker than those of income, household scale, child-related needs, illness, and ethnic-minority status. This suggests that spatial differences in expenditure may operate partly through household resources, demographic structure, and vulnerability rather than through location alone. This interpretation is consistent with the broader literature on spatial inequality, which shows that locational disparities often work indirectly through differential access to jobs, education, infrastructure, and services rather than as purely independent geographic effects (
Huang et al., 2022;
World Bank, 2022).
The positive sign for urban residence is consistent with the idea that urban households face a more favorable opportunity and consumption environment, including better access to labor markets, services, schooling, and a wider range of goods. However, the weak direct association in the full model suggests that much of the urban–non-urban difference may already be captured by income and other household characteristics. In this sense, urban residence appears to reflect a conditional locational advantage, but not a dominant independent correlate of expenditure (
World Bank, 2022).
Similarly, the negative sign on midland–mountain residence is consistent with the disadvantaged conditions of more remote and topographically constrained areas, where households often face weaker market integration, poorer infrastructure, and more limited service access. Yet the result also suggests that this locational disadvantage may work mainly through income, illness, ethnicity, and other household-level conditions rather than through a large independent location effect. This interpretation is consistent with evidence from Vietnam showing that remoteness and disadvantaged geography are closely linked to broader inequalities in opportunities and service access (
Baulch et al., 2007;
World Bank, 2022).
The distance variable should also be interpreted cautiously. Rather than indicating a robust distance-related pattern, the result suggests that distance to the provincial center does not have a strong independent association with per capita expenditure once household resources, demographic composition, illness, and area type are considered. This supports the interpretation that remoteness affects welfare mainly through access conditions and opportunity structures, rather than through distance per se as an isolated determinant (
Huang et al., 2022;
World Bank, 2022).
Taken together, the locational results indicate that place matters, but mainly as a context through which resources, needs, vulnerability, and access conditions are distributed. Per capita household expenditure in the study setting is therefore associated more strongly with household resources, demographic needs, and vulnerability-related constraints than with location as an independent factor. These results reinforce the value of modeling expenditure within a unified framework that jointly considers income, household structure, illness burden, ethnic disadvantage, and location-specific conditions.
6. Conclusions, Policy Implications, and Future Research
The policy implications follow from the main empirical associations. Per capita household expenditure is most strongly associated with income, household scale, child-related needs, illness burden, and ethnic-minority disadvantage. Accordingly, the policy discussion focuses on household-centered measures, while treating locational conditions as contextual factors that shape access to resources and services (
World Bank, 2022).
6.1. Main Conclusions
This study examined the conditional associations between household demographic structure, vulnerability, locational conditions, and per capita household expenditure using household survey data from Binh Dinh Province, Vietnam. The findings show that per capita household expenditure is most strongly associated with current household resources, especially per capita income. Household size is associated with expenditure in a nonlinear way, suggesting that scale economies exist but weaken as household needs expand. Child-related needs are also associated with higher expenditure, while elderly and female shares show weaker direct associations in the full model.
The results also highlight the importance of vulnerability. Severe or chronic illness is associated with higher expenditure, indicating health-related financial pressure rather than higher welfare. Ethnic-minority status is associated with lower expenditure, suggesting persistent social disadvantage even after household resources, demographic structure, illness, and location are taken into account. Locational variables have weaker direct associations, implying that spatial differences may operate partly through income, demographic needs, illness, ethnicity, and access conditions rather than through location alone.
Overall, this study shows that household expenditure is associated with the combined roles of economic resources, household needs, health-related vulnerability, social disadvantage, and locational context. Although the analysis does not establish causal effects, the provincial household sample provides useful micro-level evidence on within-province welfare differences that may be obscured in broader national-level analyses.
6.2. Policy Implications
The findings suggest that policies aimed at improving household welfare should combine income support, human-capital development, demographic-sensitive welfare targeting, health financial protection, and place-sensitive assistance. First, the strong association between per capita income and expenditure highlights the importance of stable employment, productivity-enhancing support, and income-stabilization mechanisms (
Jain et al., 2025). In Vietnam, broader policy assessments similarly emphasize that poverty reduction and welfare improvement depend not only on growth but also on the quality, stability, and inclusiveness of employment pathways (
World Bank & Ministry of Planning and Investment of Vietnam, 2016). This is especially relevant for households near the margin of vulnerability, whose expenditure may remain sensitive to temporary losses in wages, self-employment income, or informal earnings (
International Labour Organization, 2021;
World Bank, 2022). The weak direct association between the household head’s education and expenditure does not imply that human capital is unimportant. Rather, it suggests that education may operate mainly through income, job quality, and access to more secure employment. Income support, human-capital development, and social protection should therefore be viewed as complementary components of household welfare policy (
Timár et al., 2023).
Second, welfare targeting should better reflect household scale and demographic needs. The nonlinear household-size pattern suggests that simple per capita thresholds may not fully capture economies of scale at smaller household sizes or resource dilution as households become larger. This implication is consistent with the literature on household scale economies and demographic adjustment in welfare comparisons (
Deaton & Paxson, 1998;
Deaton & Zaidi, 2002;
White & Masset, 2002). It is also in line with broader poverty-analysis guidance emphasizing the importance of equivalence scales and demographic adjustments when comparing household welfare across household structures (
Deaton & Zaidi, 2002;
Haughton & Khandker, 2009). The positive association between child share and expenditure further suggests the need for child-sensitive welfare targeting, particularly where education, nutrition, childcare, and care costs place sustained pressure on household budgets (
White & Masset, 2002). Child-sensitive social protection, childcare, school feeding, and related in-kind services may reduce household expenditure pressure while supporting human-capital accumulation (
Timár et al., 2023;
Bundy, 2009;
Currimjee et al., 2022).
Third, the positive association between severe or chronic illness and expenditure points to the need for stronger health financial protection. Given that higher expenditure among households with illness may reflect unavoidable medical and care-related costs rather than higher welfare, reducing direct medical payments and strengthening risk-pooling mechanisms should be a policy priority (
World Health Organization, 2021). Recent evidence shows that health expenditure shocks are closely linked to household poverty risk and financial stress in low- and middle-income settings (
Mpuuga et al., 2025;
Voto et al., 2025), while WHO emphasizes the importance of reducing reliance on point-of-service payments and strengthening pooled financing mechanisms (
World Health Organization, 2021). In Vietnam, catastrophic health expenditure remains a concern, especially in disadvantaged and mountainous regions, and severe illness can worsen household welfare even under broad health insurance coverage (
Thuong et al., 2022). The negative association between ethnic-minority status and expenditure indicates a different form of vulnerability. Income support alone may be insufficient if structurally disadvantaged households continue to face weaker access to education, labor-market opportunities, infrastructure, healthcare, social protection, and basic services (
Baulch et al., 2007;
World Bank, 2022;
World Health Organization, 2021).
Finally, policy design should remain household-centered while being sensitive to spatial disadvantage. The locational results suggest that spatial disparities may operate mainly through unequal access to opportunities and services rather than through location alone, which is consistent with broader evidence on poverty and equity in Vietnam (
Bui & Erreygers, 2020;
World Bank, 2022). Place-sensitive policy should therefore focus on improving access to labor markets, schools, healthcare, transport, and social protection delivery in disadvantaged areas (
Nguyen et al., 2017). This interpretation is consistent with recent OECD evidence showing that geographic inequality in access to essential services reflects differences in service availability, connectivity, and households’ ability to reach and use those services (
OECD, 2023,
2025a,
2025b). The weak association between distance to the provincial center and expenditure suggests that remoteness matters mainly through access barriers and institutional conditions rather than through distance itself (
OECD, 2023,
2024). In Vietnam, this means that the effectiveness of transfers and assistance depends not only on eligibility rules but also on coverage, delivery capacity, and responsiveness in harder-to-reach settings (
Timár et al., 2023;
World Bank, 2019).
Overall, the policy implication is not a purely place-based strategy but rather a place-sensitive and household-centered approach that addresses income instability, demographic needs, illness-related financial pressure, ethnic-minority disadvantage, and unequal access to services.
6.3. Limitations and Future Research
Several limitations should be acknowledged. First, the analysis is based on cross-sectional data, so the estimated coefficients should be interpreted as conditional associations rather than strict causal effects. Future research using panel data would make it possible to examine expenditure dynamics more directly and to assess how households adjust expenditure over time in response to income changes, demographic transitions, or health shocks.
Second, this study measures welfare using per capita household expenditure, which remains a useful but imperfect proxy for living standards. This measure does not fully account for age-specific needs or the extent of household scale economies. Future work could therefore compare the present results with estimates based on adult-equivalent expenditure measures or alternative welfare indicators.
Third, although the model includes a broad set of household, vulnerability, and locational variables, some potentially relevant factors are not directly observed. These may include household assets, debt, informal transfers, local price variation, infrastructure quality, and more detailed measures of service accessibility. Future studies could improve measurement by combining household survey data with administrative, geographic, or health-insurance records.
Fourth, the evidence is drawn from one province and one survey period. While the provincial focus is useful for identifying within-province heterogeneity, the results should not be generalized mechanically to other parts of Vietnam. Replication in other provinces and comparative analysis across regions would help clarify which expenditure patterns are context-specific and which are more broadly generalizable.
Despite these limitations, this study contributes new evidence on how household resources, scale, demographic needs, vulnerability, and locational conditions are associated with per capita household expenditure in a developing-region context. Future research can build on this framework by incorporating richer longitudinal data, alternative welfare measures, and broader comparative settings. Future research with larger samples could also examine whether the expenditure burden of severe or chronic illness differs systematically across ethnic groups.