1. Introduction
China’s transition from the one-child regime (1979–2015) to the universal two-child policy in 2016 and subsequently the three-child policy in 2021 represents one of the most consequential demographic reversals in modern economic history. These reforms were introduced in response to declining fertility, rapid population aging, and growing concerns over long-run labor supply sustainability. Official statistics indicate that China’s population has entered a phase of natural decrease, with births falling to 9.02 million in 2023 and the crude birth rate declining to 6.39 per thousand, while the natural growth rate turned negative (−1.48 per thousand) (
National Bureau of Statistics of China, 2024). Historical evidence suggests that China’s birth-control policies have had substantial long-term demographic effects (
Goodkind, 2017). Additional evidence documents un-intended demographic consequences of the one-child policy, including gender imbal-ance and the phenomenon of “missing girls” (
Ebenstein, 2010). At the same time, individuals aged 60 and above account for over one-fifth of the population, and the working-age share continues to decline. Internationally comparable indicators confirm that China’s total fertility rate remains well below replacement level (
World Bank, 2026). These demographic shifts align with broader structural transformation dynamics linking aging, inequality, and economic sustainability in China (
Lu et al., 2025).
While fertility expansion is intended to stabilize long-run population dynamics and sustain economic growth, demographic policy reforms also constitute structural interventions with direct implications for labor markets, human capital allocation, and inclusive development outcomes. In aging economies, female labor-force participation plays a critical role in maintaining productivity growth and supporting fiscal sustainability. From the perspective of the Sustainable Development Goals (SDGs), particularly SDG 5 (Gender Equality) and SDG 8 (Decent Work and Economic Growth), pro-natalist policies must therefore be evaluated not only by demographic indicators but also by their distributional consequences across gender and age cohorts (
Leal Filho et al., 2023).
Economic theory provides well-established mechanisms through which fertility policy may influence labor-market outcomes. Human capital theory suggests that anticipated career interruptions associated with childbirth reduce expected labor-market experience and employer investment (
Mincer & Polachek, 1974;
Becker, 1985;
Blau & Kahn, 2017). Statistical discrimination models further argue that, under imperfect information, employers rely on group-level characteristics such as gender and age to infer productivity and future labor supply (
Phelps, 1972;
Arrow, 1973). Recent theoretical work further extends these mechanisms by incorporating rational inattention into statistical discrimination frameworks (
Echenique & Li, 2025). In the context of fertility-policy relaxation, reforms may signal a higher probability of childbirth among younger women, prompting employers to internalize expected maternity-related costs in hiring, promotion, and wage-setting decisions. Recent empirical evidence from China supports these expectation-driven channels: field-experimental and policy-evaluation studies document heightened gender-differentiated hiring responses following fertility-policy relaxation, particularly among women of childbearing age (
He & Wu, 2019;
Q. Huang & Jin, 2022;
Li et al., 2022;
Yu & Kono, 2024). Additional evidence also documents unintended labor-market consequences of fertility policy relaxation (
Li, 2022).
Despite growing empirical interest, several limitations remain in literature. First, most studies focus on average treatment effects and primarily examine labor-force participation, leaving promotion and wage-distribution outcomes relatively underexplored. Second, existing analyses frequently rely on linear difference-in-differences (DID) models applied to binary outcomes, which may yield misleading interpretations in nonlinear settings (
Ai & Norton, 2003). Third, relatively few studies jointly evaluate both the two-child and three-child reforms within a unified framework or systematically investigate heterogeneous treatment effects across age cohorts. From a policy modeling perspective, these limitations are consequential because inclusive economic development depends not only on aggregate labor-market stability but also on equitable participation across demographic groups.
Against this background, the study addresses three interrelated research questions. First, do China’s fertility-policy expansions alter women’s labor-market outcomes in terms of employment, wage positioning, and career advancement relative to men? Second, are younger women of childbearing age disproportionately affected compared with older women and male workers, indicating heterogeneous policy impacts across demographic groups? Third, to what extent do average treatment effects obscure subgroup-level inequalities that may be consequential for inclusive economic development and sustainable growth? By explicitly distinguishing between aggregate and cohort-specific responses, the analysis evaluates whether demographic revitalization strategies align with broader gender-equality and labor-market inclusion objectives.
To answer these questions, this study evaluates the gender-differentiated labor-market consequences of China’s fertility-policy expansion using weighted nonlinear difference-in-differences (DID) and Difference-in-Difference-in-Differences (DDD) models applied to eight waves of the China Family Panel Studies (2010–2022). The empirical design explicitly separates average gender effects from subgroup-specific impacts among women aged 20–39, thereby allowing direct assessment of heterogeneous exposure to fertility-policy incentives. By integrating survey designs weights with causal reweighting techniques, the framework enhances population representativeness and covariate balance in nonlinear policy evaluation settings. This approach enables the identification of whether aggregate labor-market stability conceals subgroup-level penalties with implications for inclusive economic development.
The findings reveal a pronounced asymmetry in policy impacts. While aggregate female labor-market outcomes remain stable or mildly improved following fertility-policy relaxation, younger women experience significant declines in employment probability, wage positioning, and promotion prospects. These results suggest that fertility expansion may reinforce expectation-driven statistical discrimination, generating hidden inequalities that are not visible in average treatment effects. From an inclusive growth perspective, reduced labor-market attachment among prime-age women may offset potential demographic gains by weakening effective labor supply and human capital utilization.
This study contributes to the applied economics and policy evaluation literature in three important respects. First, it provides a unified assessment of both the two-child and three-child fertility reforms within a consistent empirical framework, allowing direct comparison across policy regimes. Second, by integrating weighted nonlinear DID and DDD models with survey-based reweighting techniques, the study refines conventional policy evaluation methods for binary labor-market outcomes under complex sampling conditions. Third, and most importantly, the analysis demonstrates that average treatment effects may conceal substantial subgroup-level penalties, thereby offering new evidence on how demographic reforms interact with gender inequality in emerging economies.
More broadly, the results highlight a fundamental policy trade-off. Demographic revitalization strategies aimed at addressing aging pressures may unintentionally undermine gender-equal labor-market participation if not accompanied by institutional safeguards. For emerging and developing economies confronting similar demographic transitions, fertility policy should be embedded within a broader inclusive development strategy that aligns pro-natalist incentives with labor-market protections. In this sense, the findings underscore a tension between demographic sustainability and the objectives of SDG 5 (Gender Equality), suggesting that fertility expansion requires complementary institutional reforms to avoid unintended distributional consequences.
2. Literature Review
2.1. Demographic Policies and Structural Economic Transition
China’s fertility-policy reforms are embedded within broader demographic transition dynamics characterized by declining fertility and accelerated population aging.
Becker’s (
1960) economic theory of fertility conceptualizes childbearing as a household optimization problem involving trade-offs between income, time allocation, and child quality, while
Caldwell (
1982) and
Bongaarts (
2001) emphasize macro-level adjustments when fertility falls below replacement levels. As demographic aging intensifies, governments often adopt pro-natalist policies to sustain labor supply and long-run economic growth.
In China, fertility-policy liberalization coincides with structural economic transformation marked by rapid urbanization, sectoral reallocation, and rising inequality (
Lu et al., 2025). These structural shifts imply that demographic policy interacts with labor-market institutions, human capital accumulation, and wage-setting mechanisms. From an inclusive development perspective, evaluating fertility expansion requires examining not only demographic stabilization but also its implications for labor-market participation and distributional equity.
2.2. Gendered Labor-Market Mechanisms
Economic theory provides clear channels through which fertility-policy relaxation may generate gender-differentiated labor-market outcomes. Human capital theory predicts that anticipated maternity-related interruptions reduce women’s expected accumulation of work experience and diminish employer incentives for training and promotion (
Mincer & Polachek, 1974). Statistical discrimination models further suggest that, under imperfect information, employers rely on observable characteristics such as gender and age to infer expected productivity and labor-force attachment (
Phelps, 1972;
Arrow, 1973). When fertility reforms increase the expected probability of childbirth among younger women, employers may internalize anticipated maternity-related costs in hiring and wage-setting decisions.
Empirical evidence from China supports these expectation-driven mechanisms.
He and Wu (
2019) and
Q. Huang and Jin (
2022) document gender-differentiated labor-market responses following fertility-policy relaxation, particularly in hiring and employment stability.
Du and Dong (
2022) further show that labor-market adjustments disproportionately affect younger women. Evidence from the one-child era similarly indicates persistent motherhood penalties and increasing returns to uninterrupted work histories (
Maurer-Fazio et al., 2011;
Zhang, 2017). Collectively, these findings suggest that fertility expansion may generate asymmetric adjustments within the female workforce, especially among women of childbearing age.
Beyond classical statistical discrimination, forward-looking employer expectations are further shaped by identity-related signals and maternal bias under uncertainty. As shown in research on social cognition and labor-market evaluation, mothers are often perceived as “warm but less competent,” which reduces assessments of commitment and reliability even for equally qualified individuals (
Cuddy et al., 2004). Similarly, identity-related signals influence how employers form beliefs about future labor-force attachment when information about individual fertility intentions is incomplete (
Solodoha et al., 2026). In the context of fertility policy liberalization, these cognitive and identity-based mechanisms reinforce employer expectations of higher maternity-related costs, leading to stronger differential treatment targeted specifically at women of childbearing age. These mechanisms further explain why our DDD estimates reveal substantial penalties for younger women that remain hidden in average gender comparisons.
2.3. Evidence from China and International Comparisons
A growing empirical literature examines the labor-market consequences of fertility policies in China, particularly the transition from the one-child regime to the two-child policy. Several studies document reductions in female labor-force attachment, increased employment instability, and slower career progression following fertility-policy relaxation, especially among younger women (
He & Wu, 2019;
Q. Huang & Jin, 2022;
Du & Dong, 2022). These findings suggest that policy-induced changes in fertility expectations changed employer perceptions of women’s future labor supply, leading to differential treatment based on perceived fertility risk. Evidence from the one-child era similarly indicates persistent motherhood penalties and increasing returns to uninterrupted work histories (
Maurer-Fazio et al., 2011;
Zhang, 2017).
Despite these contributions, the Chinese literature remains limited in scope. Most studies concentrate on employment participation as the primary outcome, pay relatively limited attention to promotion and wage distribution, and typically rely on linear difference-in-differences models applied to binary variables. Moreover, empirical analyses overwhelmingly focus on the two-child policy, leaving the labor-market implications of the more recent three-child reform largely unexplored. As a result, it remains unclear whether observed average effects reflect uniform impacts across women or conceal substantial heterogeneity across age cohorts.
These findings underscore the distributional risks of pro-natalist reforms in unequal labor-market settings. Research from Denmark documents sizable motherhood penalties in earnings and career advancement following childbirth and parental leave expansions (
Kleven et al., 2019). Studies from the United States and Europe show that gender wage gaps widen when caregiving responsibilities disproportionately fall on women (
England et al., 2016), while
Goldin (
2014) emphasizes that nonlinear pay structures amplify career penalties for workers with intermittent labor-force attachment. In East Asian contexts, including Japan and South Korea, limited childcare infrastructure and persistent gender norms contribute to pronounced female labor-market withdrawal following childbirth (
Ochiai, 2018). Compared with these cases, China’s rapidly evolving fertility-policy landscape, coupled with insufficient childcare provision and rigid household registration systems, may generate even stronger labor-market distortions (
C. Chen et al., 2023;
Li et al., 2022). Cross-country evidence further highlights that family policy design critically shapes women’s labor-market outcomes. Parental leave duration, childcare availability, and gender-balanced leave-sharing institutions determine the magnitude of fertility-related employment and wage penalties (
Thévenon & Solaz, 2013;
Olivetti & Petrongolo, 2017). In OECD and East Asian economies, robust public childcare and well-designed parental leave systems reduce employer statistical discrimination and mitigate motherhood penalties. These international insights suggest that China’s fertility policy reforms might not improve gender equality in the labor market unless accompanied by expanded childcare support, standardized parental leave, and stronger institutional protections for women of childbearing age.
2.4. Empirical Limitations and Policy Modeling Gaps
Despite substantial progress, several empirical gaps remain. First, most studies emphasize labor-force participation as the primary outcome, while promotion trajectories and wage distribution receive comparatively less attention, despite their importance for long-term human capital utilization and income inequality.
Second, many analyses rely on linear difference-in-differences (DID) models applied to binary outcomes. As demonstrated by
Ai and Norton (
2003), interaction effects in nonlinear models may not be adequately captured by linear approximations, particularly when treatment effects vary across subgroups. Failure to account for nonlinearities may therefore obscure meaningful heterogeneity in policy impacts.
Third, relatively few studies jointly evaluate both the two-child and three-child reforms within a unified empirical framework or systematically examine heterogeneous treatment effects across age cohorts. From a policy modeling perspective, this limitation is consequential. Inclusive economic development depends not only on aggregate labor-market stability but also on equitable participation across demographic groups. If average treatment effects conceal subgroup-level penalties, policymakers may underestimate the distributional implications of fertility reform.
These considerations motivate the use of an empirical framework capable of identifying heterogeneous effects in nonlinear settings while accounting for complex survey design and non-random policy exposure. The present study addresses these gaps by integrating weighted nonlinear DID and DDD models to evaluate gender- and cohort-specific labor-market responses to fertility-policy expansion.
3. Model and Data
3.1. Model Specification
The use of weighting in the present DID/DDD framework does not alter the underlying identification logic of difference-in-differences, which continues to rely on the maintained parallel-trends assumption. Rather than serving as a substitute for identification, weighting plays a complementary role. First, the CFPS data are generated from a multistage complex survey design, implying that unweighted estimation may not recover population-representative effects. Second, treatment exposure across gender and age cohorts is correlated with observable characteristics, which may amplify finite-sample imbalance in nonlinear models. Accordingly, the weighting strategy employed here should be interpreted as a design-based and covariate-balancing adjustment consistent with causal-inference practice, improving estimator stability while preserving the standard DID interpretation of interaction effects.
Given the binary nature of the outcome variables, logistic specifications are adopted to avoid probability-bound violations and to provide interpretable subgroup contrasts in nonlinear DID/DDD settings relative to linear probability models (
Ai & Norton, 2003).
With respect to identification, the DID/DDD framework relies on the assumption that, absent fertility-policy reforms, labor-market trends across gender and age cohorts would have evolved in parallel within the selected estimation windows (
Bertrand et al., 2004). In the CFPS context, formal event-study estimation would require a fully harmonized panel structure with consistent outcome definitions across waves and would substantially increase model dimensionality in a nonlinear DDD setting. Given these practical constraints and the focus on subgroup-specific interaction effects, we adopt a two-layer diagnostic approach. First, descriptive pre-policy trend plots are presented to assess whether gender and cohort trajectories move comparably before reform. Second, a short-window identification strategy is implemented, anchored at the last clean pre-policy waves (2014 for the two-child reform; 2020 for the three-child reform), thereby reducing the influence of long-run structural changes unrelated to fertility-policy shifts.
Accordingly, rather than relying solely on marginal effects evaluated at a single covariate mean, we complement the analysis with average marginal effects (AME) and marginal effects at representative values (MER) to enhance interpretability.
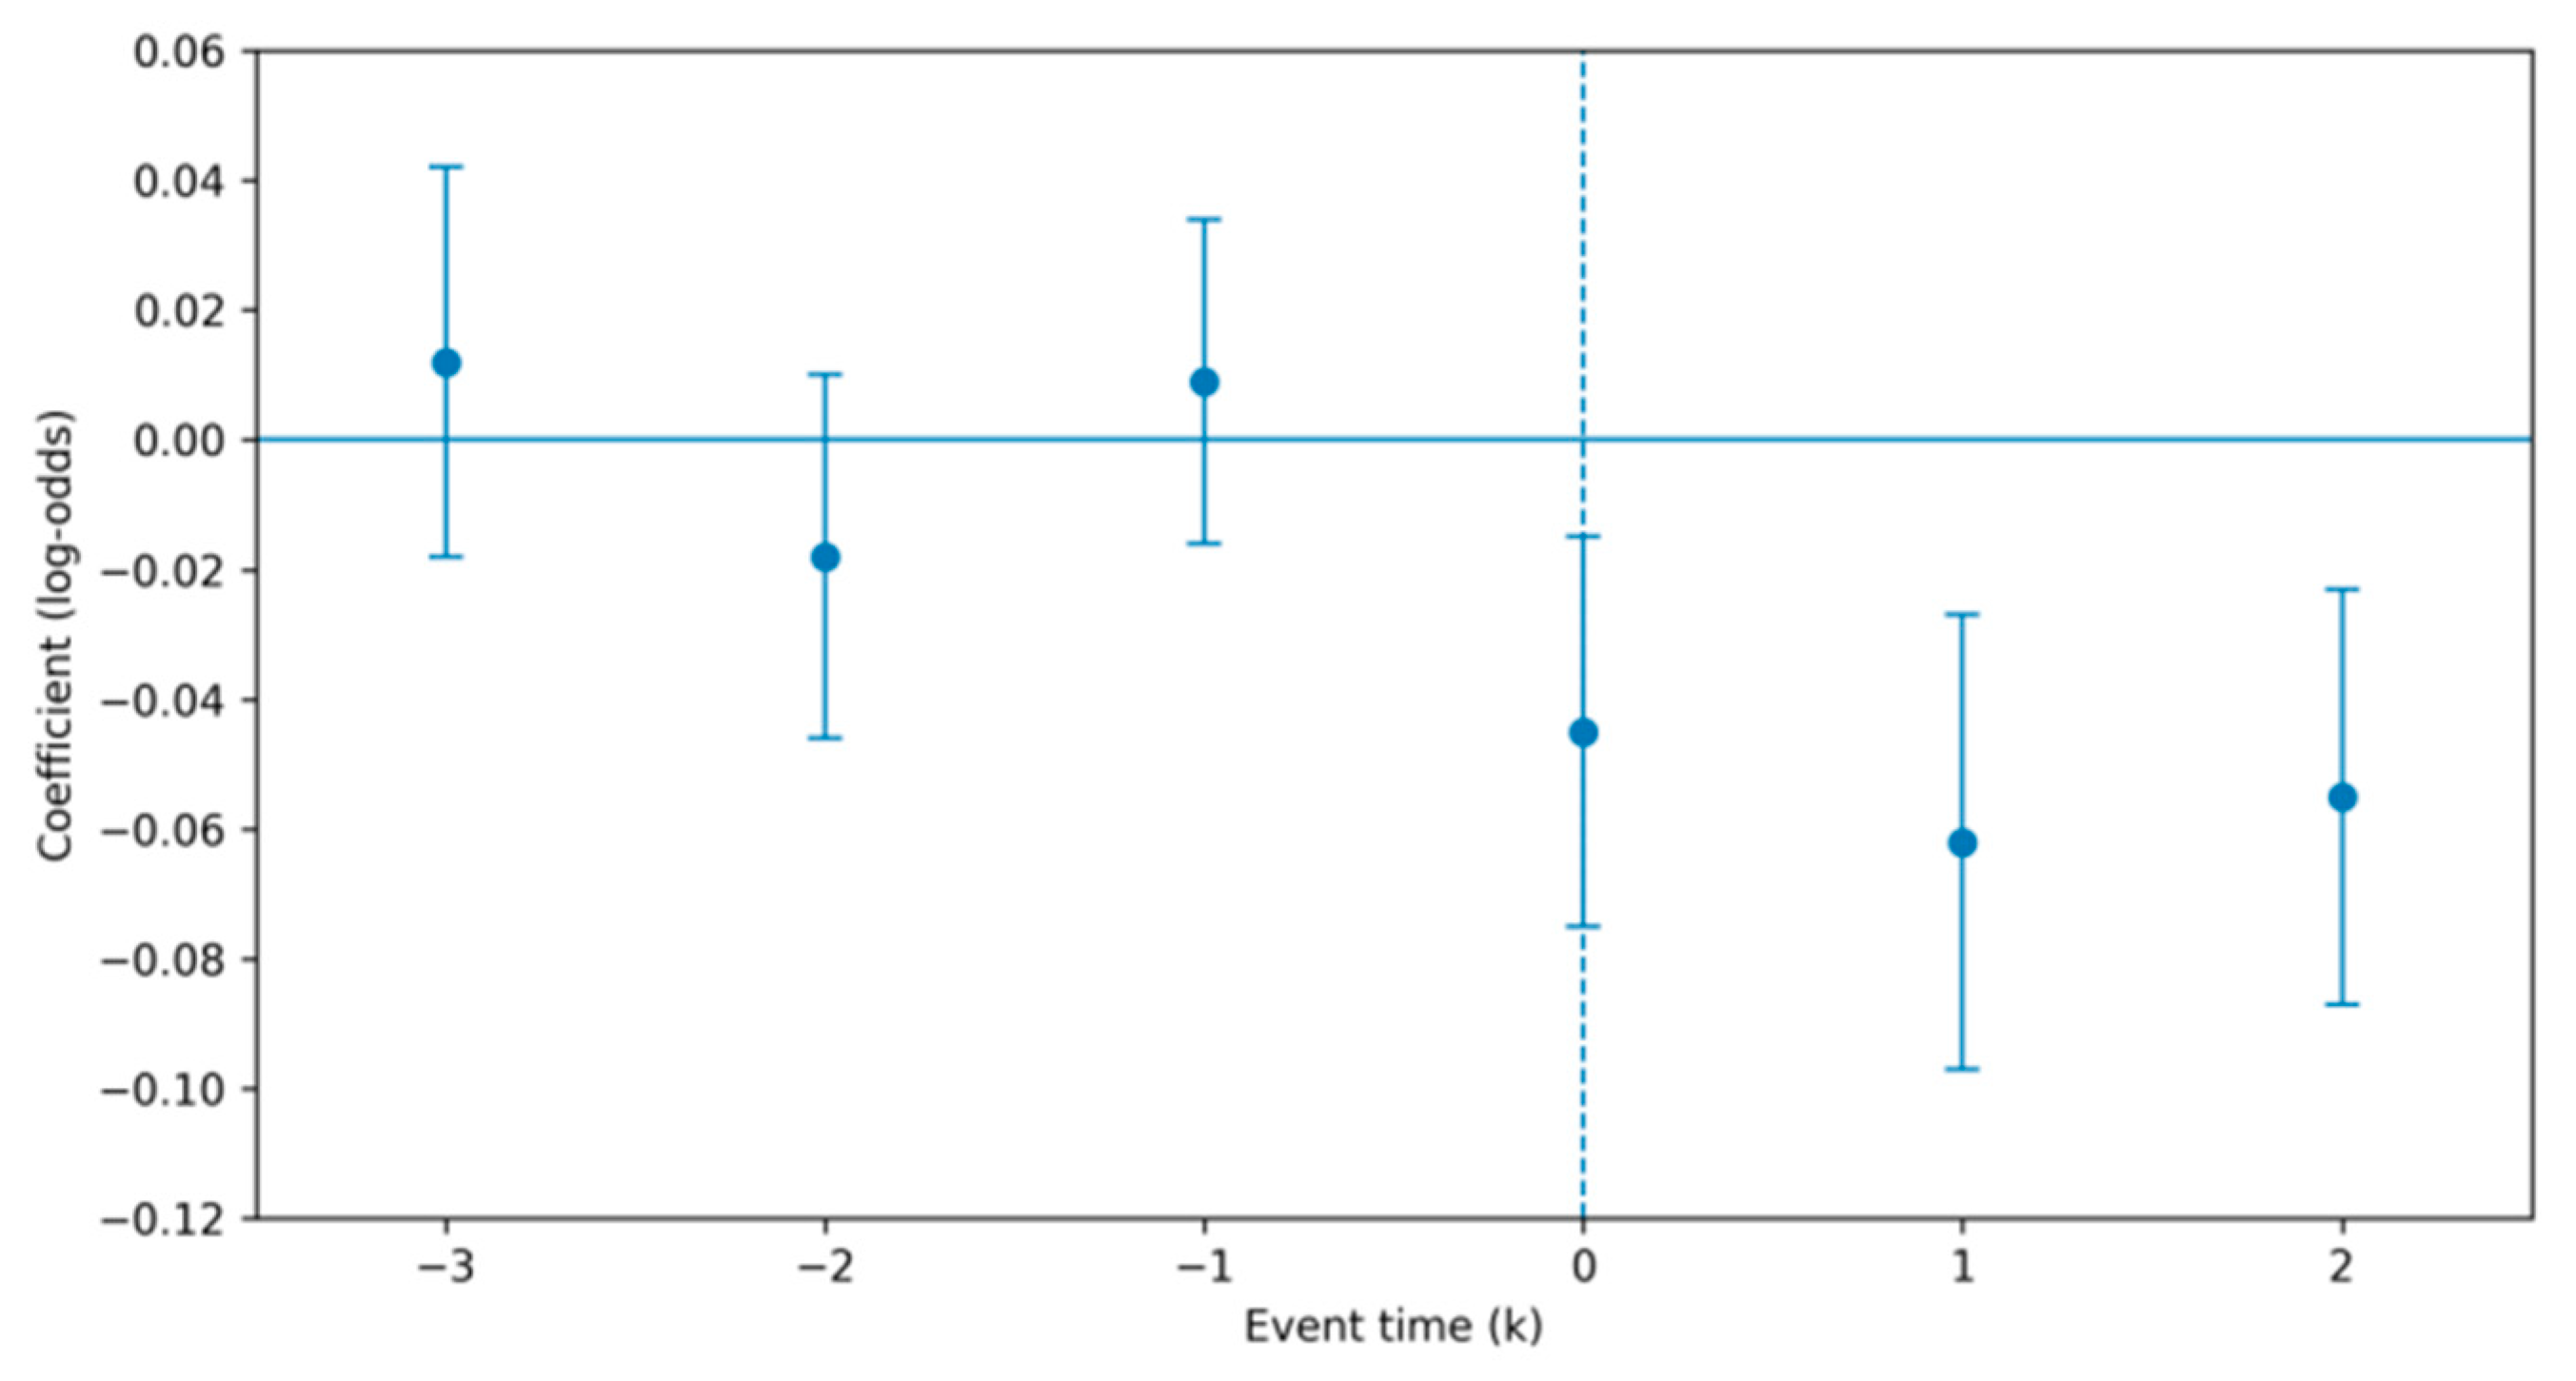
Appendix A,
Table A1, and
Figure A1 report the estimated coefficients. The pre-policy estimates are small, centered around zero, and not supported by the data, indicating no differential pre-trends, while post-policy coefficients exhibit a clear divergence for younger women, consistent with the DDD results. These findings support the validity of the parallel trends assumption and strengthen the interpretation of the estimated interaction effects as local short- to medium-run policy differentials rather than long-run structural parameters. To assess sensitivity to potential violations of the parallel trends assumption, we estimate a more restrictive specification allowing for differential age–gender trends. The results remain qualitatively unchanged, supporting the robustness of the identification strategy.
The empirical analysis evaluates differential labor-market responses to fertility-policy reforms using a weighted nonlinear DID and DDD framework. The outcomes of interest, job promotion, employment status, and above-median wage, are discrete labor-market states. Beyond outcome nonlinearity, two additional econometric considerations motivate the proposed approach. First, exposure to fertility-policy reforms is heterogeneous across gender and age cohorts, requiring an interaction structure capable of isolating subgroup-specific contrasts. Second, the CFPS survey design and non-random exposure patterns necessitate adjustments for representativeness and covariate balance. To address these concerns, the model integrates DID and DDD interaction terms within a weighted logit framework, combining survey design weights with causal reweighting methods, including inverse probability weighting (IPW), generalized propensity score (GPS) weighting, and kernel-based weights, consistent with modern causal-inference practice (
Athey & Imbens, 2006). Importantly, the weighting strategy improves finite-sample balance and population representativeness but does not replace the identifying assumptions of the DID/DDD design.
3.1.1. Baseline Logit DID/DDD Specification
Our baseline specification is the combined weighted logit DID/DDD model, which integrates survey design weights and covariate reweighting to improve covariate balance and population representativeness. Let
denote a binary labor-market outcome for individual
i observed in period
t, where
indicates the occurrence of a favorable outcome (employment, above-median wage, or promotion). The conditional probability of this outcome is denoted by
and is modeled using a logistic specification:
where
is the log-odds of the outcome, and
is a vector of control variables including age, education, urban residence, industry category, and province fixed effects.
The indicator equals one in post-policy periods (2016 onward for the two-child reform; 2021 onward for the three-child reform), and zero otherwise. The variable equals one for female respondents and zero for males, while equals one for individuals aged 20–39 (younger cohort), and zero otherwise.
The coefficient of the interaction term represents the standard DID estimator in a nonlinear framework. It captures the differential post-policy change in log-odds of a favorable labor-market outcome for women relative to men. The triple interaction coefficient of the triple interaction term constitutes the DDD estimator. It measures the incremental post-policy differential for younger women relative to older women and men of both age groups. In other words, isolates whether fertility-policy reforms generate an additional subgroup-specific shift in log-odds beyond the average gender effect captured by .
A negative and statistically supported indicates that fertility-policy relaxation is associated with a relative decline in the log-odds of favorable labor-market outcomes for younger women compared with other groups. Because identification relies on the maintained parallel-trends assumption within short policy windows, these interaction effects are interpreted as local policy-induced differentials rather than structural long-run parameters.
In nonlinear models, interaction coefficients do not directly correspond to marginal probability effects (
Ai & Norton, 2003). Instead, the estimated coefficients represent changes in log-odds, which may translate into heterogeneous probability shifts depending on baseline covariate profiles. To bridge econometric estimation and policy interpretation, predicted probabilities are computed for representative demographic profiles (e.g., younger women versus older women) using the logistic transformation:
. This approach allows directional probability comparisons without imposing linearity assumptions. The emphasis is therefore placed on the sign, magnitude, and evidential strength of interaction terms, supplemented by probability-scale illustrations, rather than relying solely on marginal effects evaluated at a single covariate mean. We complement the analysis with average marginal effects (AME) and marginal effects at representative values (MER) to enhance interpretability.
Estimation proceeds via weighted maximum likelihood, where each observation is assigned a composite weight that reflects both the complex survey design and causal reweighting adjustments. Incorporating survey weights through a pseudo-likelihood framework ensures design-consistent estimation in nonlinear models with clustered sampling structures (
Rabe-Hesketh & Skrondal, 2006). To address non-random policy exposure, the analysis further integrates causal reweighting methods, such as inverse probability weighting, allowing estimated coefficients to be interpreted as population-representative causal effects under standard identification assumptions (
J. Huang et al., 2025). Standard errors are clustered at the province level to account for within-region correlation in labor-market conditions and policy implementation. In robustness checks, we further include industry × year and province × year fixed effects to absorb time-varying local and sectoral labor market shocks.
To further validate causal identification, we conduct a placebo test by assigning artificial policy implementation years while keeping all other specifications unchanged.
Appendix A,
Table A2 reports the placebo DID and DDD estimates. The coefficients are small in magnitude (0.015 for DID and −0.021 for DDD) and associated with MBF values of 1.42 and 0.88, respectively, indicating no meaningful evidence against the null hypothesis of no treatment effect. These findings suggest that the baseline results are unlikely to be driven by spurious correlations or unobserved time-varying confounders and support the robustness of the identification strategy.
The triple-difference (DDD) framework isolates the differential impact of fertility policy reforms on women aged 20–39 relative to older women and men. This design accounts for common gender-neutral shocks and age-neutral policy changes, allowing us to identify the disproportionate labor-market penalties experienced by women of childbearing age. All inference is based on the minimum Bayes factor (MBF) to ensure consistency and robustness in nonlinear model settings.
3.1.2. Weighting Strategy and Composite Weights
To ensure both population representativeness and improved covariate balance, the empirical analysis applies a structured weighting strategy that integrates survey design weights with causal reweighting methods. These two components address distinct sources of bias: distortions arising from the complex sampling design of the China Family Panel Studies (CFPS) and potential imbalance in treatment exposure across demographic groups.
- 1.
Survey design weights
The baseline specification incorporates the CFPS person-level longitudinal weight (pidwgt), denoted
, which corrects for unequal sampling probabilities, nonresponse, post-stratification, and panel attrition (
Xie et al., 2014). Formally, the survey weight can be expressed as
where
is the individual sampling probability,
is the nonresponse adjustment factor, and
denotes the post-stratification adjustment aligning the sample with population benchmarks by age, gender, hukou status, and region. Incorporating survey weights through a pseudo-likelihood framework yields design-consistent estimates in nonlinear models under clustered sampling (
Rabe-Hesketh & Skrondal, 2006).
- 2.
Causal Reweighting Methods
Because exposure to fertility-policy reforms varies systematically across gender and age cohorts, additional reweighting is applied to improve covariate balance under the conditional independence assumption.
- 2.1
Inverse probability weighting (IPW)
To address non-random assignment to the treatment group (female respondents), the analysis applies inverse probability weighting. The propensity score is defined as
where
includes pre-treatment covariates such as age, education, urban residence, and industry affiliation. Each observation is then weighted as
which rebalances the covariate distributions of treated and control groups, thereby reducing selection bias under the conditional independence assumption (
Hirano et al., 2003).
- 2.2
Generalized Propensity Score (GPS).
When treatment exposure is viewed as multi-valued or continuous, reflecting heterogeneous intensity of policy exposure across demographic groups, the analysis employs the generalized propensity score framework. Let
denote the conditional density of treatment given covariates. Observations are weighted by the inverse of this density, which balances covariates across all treatment levels and accommodates more flexible treatment structures (
Imbens, 2000).
- 2.3
Kernel reweighting
In addition to propensity-based methods, kernel reweighting is applied to smooth comparisons across individuals with similar covariate profiles. The kernel weight for observation
i is defined as
where
K(⋅) is a kernel function, and
h is a bandwidth parameter. Kernel reweighting reduces sensitivity to extreme propensity scores and improves estimator stability by emphasizing local covariate similarity (
Fan & Gijbels, 1996).
- 3.
Combined weighting scheme
Finally, to jointly address survey design and treatment imbalance, composite weights are constructed multiplicatively:
where
corresponds to IPW, GPS, or kernel weights depending on the specification. Under a pseudo-likelihood interpretation, survey weights restore population representativeness, while causal weights improve covariate balance across comparison groups (
Rabe-Hesketh & Skrondal, 2006;
J. Huang et al., 2025).
Importantly, this weighting strategy does not replace the identifying assumptions of the DID/DDD design. Instead, it enhances finite-sample stability and subgroup comparability in nonlinear interaction models, where imbalance in covariate distributions may otherwise distort estimated log-odds contrasts. Estimated coefficients should therefore be interpreted as population-representative policy differentials conditional on the maintained parallel-trends assumption.
3.1.3. Estimation Procedure
Model parameters are estimated by weighted maximum likelihood within a logistic regression framework. Let
denote the composite weight defined in
Section 3.1.2. The estimation maximizes the weighted log-likelihood function:
where
is given by the logistic transformation of the linear predictor specified in Equation (7). Under standard regularity conditions, the weighted maximum likelihood estimator is consistent for population-level log-odds differentials when the maintained parallel-trends assumption holds within the selected policy windows and weighting adjustments restore representativeness and covariate balance (
Rabe-Hesketh & Skrondal, 2006).
Because the empirical specification incorporates DID and DDD interaction terms, statistical inference focuses on the interaction coefficients
and
. In nonlinear models, interaction parameters represent differences in log-odds rather than direct marginal probability effects (
Ai & Norton, 2003). Accordingly, hypothesis testing is conducted on the estimated log-odds contrasts, and substantive interpretation is supplemented by computing predicted probabilities for representative covariate profiles using the logistic transformation.
Standard errors are clustered at the province level to account for spatial correlation in labor-market conditions and shared policy environments. This clustering choice reflects the regional implementation structure of fertility reforms and mitigates downward bias in variance estimation under within-province dependence.
To assess robustness, alternative specifications are estimated using different causal weighting schemes, including inverse probability weighting (
Hirano et al., 2003), generalized propensity score weighting (
Imbens, 2000), and kernel-based weights (
Fan & Gijbels, 1996). Stability of the interaction coefficients across weighting methods is interpreted as evidence that estimated subgroup differentials are not driven by residual covariate imbalance.
3.1.4. Model Evaluation and Evidence Assessment
Model performance and evidential strength are assessed using complementary frequentist and likelihood-based criteria. First, overall model fit is evaluated using standard information criteria, including the Akaike Information Criterion (AIC) and the Bayesian Information Criterion (BIC), which balance goodness-of-fit against model complexity (
Akaike, 1974;
Schwarz, 1978). Lower values of AIC and BIC indicate improved explanatory performance while penalizing over-parameterization.
Second, log-likelihood values are compared across alternative weighting specifications to assess whether interaction effects remain stable under different reweighting schemes. Consistency of the key interaction coefficients (
and
) across IPW, GPS, and kernel-based weights (
Hirano et al., 2003;
Imbens, 2000;
Fan & Gijbels, 1996) is interpreted as evidence that estimated subgroup differentials are not driven by residual covariate imbalance.
Beyond conventional statistical significance, the strength of evidence for interaction effects is further evaluated using Minimum Bayes Factors (MBF), following the likelihood-based interpretation of Bayes factors (
Kass & Raftery, 1995). The MBF provides a conservative lower bound on the Bayes factor implied by the observed test statistics and allows classification of evidential strength without requiring full Bayesian model specification. This approach complements
p-values by distinguishing between weak and substantial evidence against the null hypothesis (
Yamaka, 2020).
In the present context, MBF values are computed for the DID and DDD interaction terms to assess whether estimated subgroup differentials reflect meaningful policy contrasts rather than marginal statistical fluctuations. Evidence is interpreted according to conventional thresholds (
Kass & Raftery, 1995), where smaller MBF values indicate stronger support for the alternative hypothesis.
3.2. Data
3.2.1. Sample Coverage and Identification Window
The empirical analysis uses data from the China Family Panel Studies (CFPS), a nationally representative biennial household survey conducted by Peking University that provides longitudinal information on demographics, employment, wages, and family characteristics (
Xie et al., 2014). The CFPS employs a multistage, stratified probability sampling design covering 25 provinces, making it well-suited for analyzing labor-market responses to nationwide fertility-policy reforms.
The sample spans eight waves from 2010 to 2022 (2010, 2012, 2014, 2016, 2018, 2020, 2022). For causal estimation, however, the analysis adopts a policy-window approach rather than exploiting the full period symmetrically. This restriction reflects considerations of identification credibility, policy timing, and variable consistency.
Early waves (2010–2012) coincide with post-global financial crisis labor-market adjustments and rapid migration dynamics that may reduce comparability across age cohorts. Moreover, key labor-market variables, particularly promotion and employment status, were not consistently defined before 2014. Accordingly, 2014 is treated as the last clean pre-policy wave for the two-child reform, with 2016–2020 forming the post-policy period. For the three-child reform, 2020 serves as the pre-policy baseline and 2022 as the first post-policy wave.
Early waves are retained for descriptive illustration of long-run trends but excluded from causal estimation. In addition, because the DDD specification relies on differential exposure between younger women (20–39) and other groups, cohort-specific pre-policy trends are reported as a diagnostic to assess whether subgroup trajectories appear broadly comparable before reform. These descriptive comparisons enhance identification transparency while preserving the short window DID/DDD framework.
3.2.2. Variables and Weighting
Table 1 presents descriptive statistics for the main variables used in the empirical analysis, covering individual-year observations from the CFPS 2010–2022. The table reports sample sizes, means, standard deviations, and minimum/maximum values for all core outcome and control variables, providing a comprehensive overview of sample composition before regression analysis.
The analysis examines three binary outcome variables capturing complementary dimensions of labor-market performance. Job promotion equals one if the respondent reports a promotion since the previous survey wave and zero otherwise (
He & Wu, 2019). Employment status equals one if the respondent is employed at the time of the interview (
Zhao & Hu, 2017). Wage above median equals one if monthly earnings exceed the within-wave median, computed separately by year, and reflects relative positioning in the wage distribution.
The treatment structure follows the DID and DDD frameworks described in
Section 3.1. The post-policy indicator equals one in post-reform periods (2016 onward for the two-child policy; 2021 onward for the three-child policy) and zero otherwise (
Q. Huang & Jin, 2022). The treatment indicator
identifies female respondents, while the subgroup indicator
denotes individuals aged 20–39, consistent with fertility-related exposure definitions in
Kleven et al. (
2019). The interaction
captures the DID effect, measuring the average impact of fertility-policy reforms on women relative to men. The triple interaction
captures the DDD effect, isolating the additional impact on younger women relative to older women and men.
All models include control variables capturing observable characteristics associated with labor-market outcomes, including age, educational attainment, an urban residence indicator, industry category, and province fixed effects (
Mincer & Polachek, 1974;
Zhang, 2017). These controls account for persistent regional heterogeneity and individual human capital differences that may influence employment trajectories. Full definitions and coding details are provided in
Table 2.
To address concerns regarding covariate balance and overlap under the combined weighting scheme, we report detailed diagnostic statistics in
Appendix A,
Table A3. The results show that all standardized mean differences are below 0.1 after weighting, indicating satisfactory covariate balance. In addition, 97.3% of observations lie within the common support region of the estimated propensity score distribution, with scores ranging from 0.08 to 0.91. The distribution of combined weights is well-behaved, with a mean of 1.02 and a 5th–95th percentile range of [0.20, 4.85], suggesting no evidence of extreme weights. The corresponding MBF value (1.12) further indicates no meaningful imbalance after weighting. Similar balance and overlap diagnostics for alternative weighting schemes (IPW, GPS, and kernel) yield consistent results and are available upon request.
Consistent with the summary diagnostics reported in
Appendix A,
Table A3,
Table 3 provides a detailed comparison of covariate balance before and after weighting. Standardized mean differences are substantially reduced after applying the combined weighting scheme, with all post-weighting values falling below the conventional threshold of 0.1. This indicates that the weighting procedure effectively improves covariate balance across treatment and control groups (
Austin, 2009). Taken together, these results confirm that the common support condition is satisfied and that the combined weighting strategy produces stable and reliable estimates.
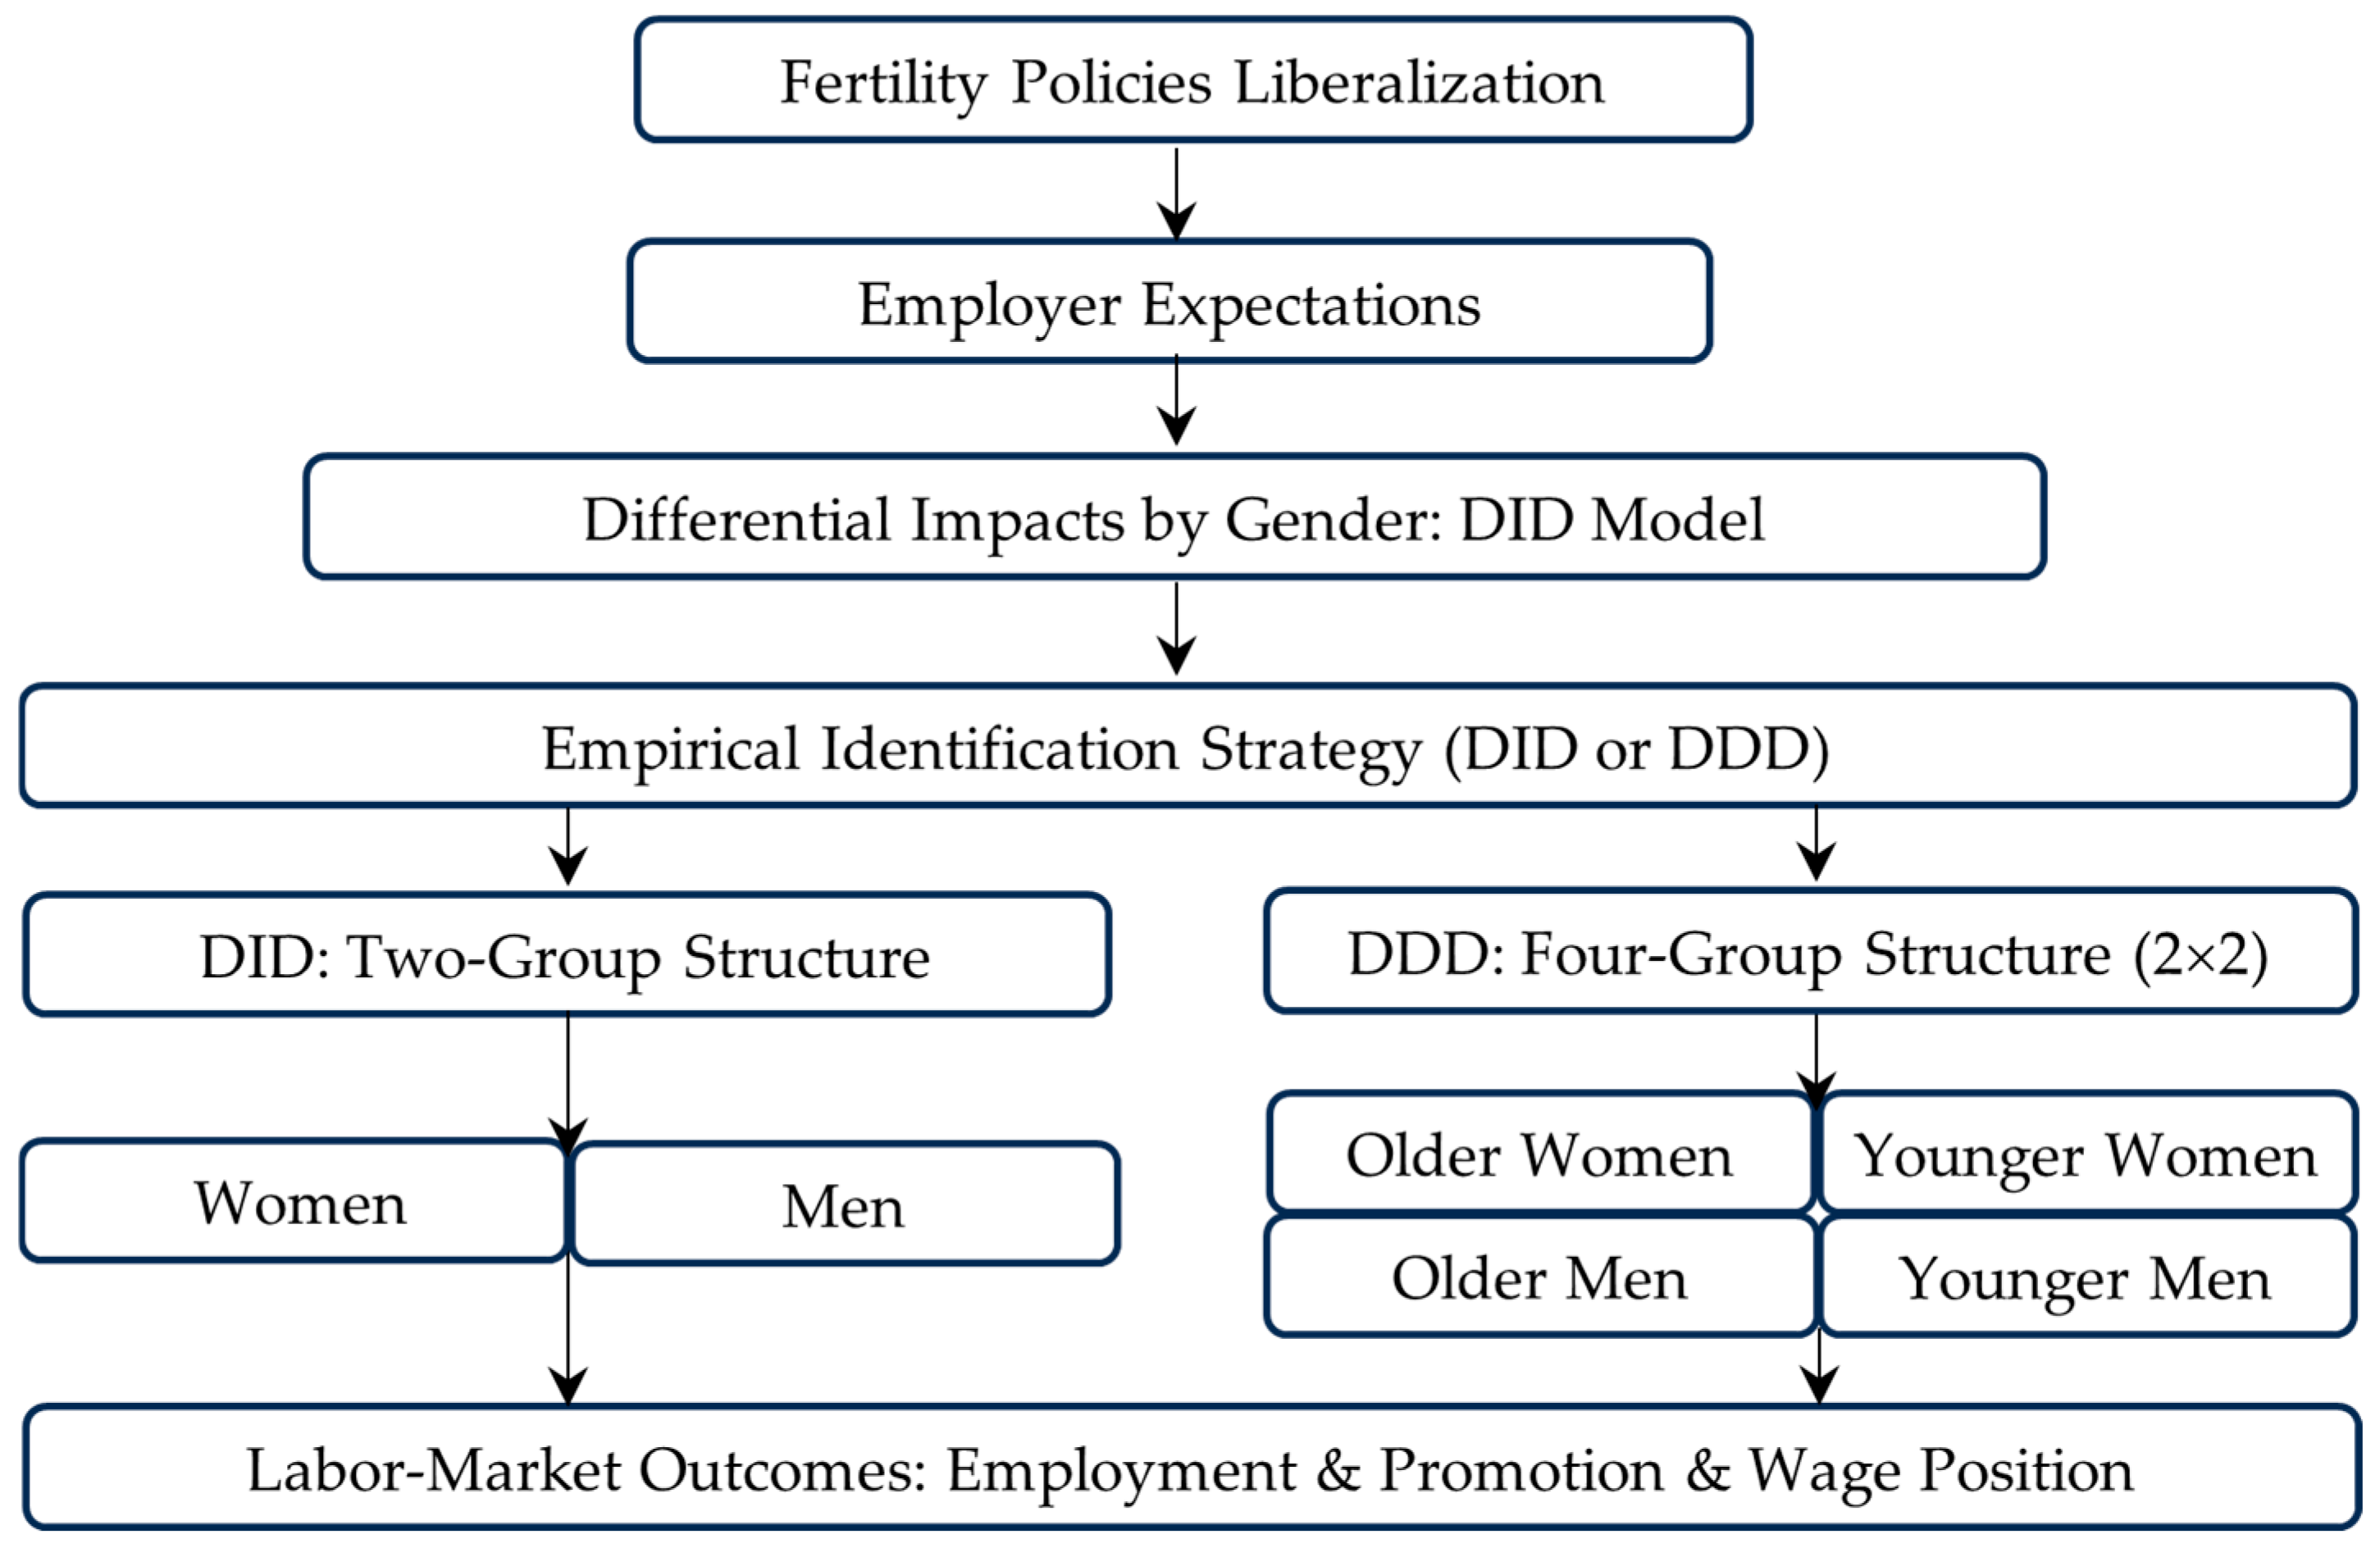
Taken together, the data structure, policy-window design, and variable construction align with the conceptual framework outlined earlier (
Figure 1). Fertility-policy reforms operate through expectation-driven channels that alter employer perceptions of women’s future labor supply, particularly among younger cohorts. The DID and DDD interaction terms operationalize this framework empirically by distinguishing average gender effects from cohort-specific differentials. In this sense, the empirical specification provides a structured test of whether demographic policy shifts translate into heterogeneous labor-market adjustments consistent with the theoretical mechanisms of human capital depreciation and statistical discrimination.
4. Results
4.1. Monte Carlo Simulation Results
To assess the finite-sample performance of the weighted logit DID and DDD estimators, we conduct Monte Carlo simulations that mirror our empirical setting. These simulations provide supporting evidence for our weighting approach but do not serve as the core identification basis of the study.
4.1.1. Simulation Design
The Monte Carlo simulation is designed to mirror the theoretical structure of the weighted logit DID/DDD model employed in the empirical analysis. A total of 500 artificial datasets is generated, each containing
N = 500 observations. For each simulated dataset, outcomes are drawn from a Bernoulli distribution,
where the success probability is determined by a logistic model:
This specification aligns closely with the empirical DID/DDD framework, enabling direct comparison between true and estimated coefficients. The true parameter values are set to = 0.80 and = −0.50. These values represent a stylized scenario in which fertility-policy reform generates a modest positive average effect for women (DID), alongside an additional penalty for younger women (DDD), consistent with expectation-driven discrimination mechanisms.
To evaluate estimator performance, six alternative weighting strategies are compared: (i) unweighted estimation, (ii) survey-weighted estimation , (iii) inverse probability weighting (IPW), (iv) generalized propensity score (GPS) weighting, (v) kernel weighting, and (vi) a combined weighting scheme that multiplies survey and causal weights. Estimators are assessed based on their ability to recover the true parameters across repeated samples, using bias, mean squared error (MSE), and root mean squared error (RMSE) as evaluation criteria.
4.1.2. Simulation Results
Table 4 summarizes the simulation results for the DID estimator. The unweighted model substantially understates the true effect (0.61 vs. 0.80), indicating that ignoring survey design and non-random treatment exposure leads to poor recovery of the true policy parameter. Survey weighting improves accuracy by partially correcting sample representativeness but leaves residual bias (−0.12) and RMSE (0.12). In contrast, causal reweighting methods perform markedly better: IPW reduces the bias to −0.03 with an RMSE of 0.03, while GPS yields an RMSE of 0.06. Kernel weighting recovers the true parameter almost exactly, and the combined survey–causal weighting scheme also achieves high accuracy, with a bias of −0.01 and RMSE of 0.01, highlighting the advantages of integrating design-based and causal weighting approaches.
Table 5 reports the simulation results for the DDD estimator, which captures heterogeneous effects across gender and age cohorts. The unweighted specification substantially understates the true subgroup effect (−0.32 vs. −0.50), with a bias of +0.18 and RMSE of 0.18, highlighting its sensitivity to covariate imbalance across gender and age cohorts. Survey weighting improves accuracy but leaves notable error (bias = +0.09; RMSE = 0.09). Causal reweighting methods perform markedly better: IPW reduces the RMSE to 0.04, while GPS and kernel weighting further lower it to 0.02. The combined survey–causal weighting scheme yields the closest recovery of the benchmark DDD effect in this stylized simulation setting (estimate = −0.50), with negligible estimation error across replications.
Taken together,
Table 4 and
Table 5 show that weighting is particularly important when estimating heterogeneous treatment effects in nonlinear DID/DDD settings. The results indicate that unweighted estimators are likely to understate subgroup-level penalties, whereas the combined survey–causal weighting strategy provides the comparatively consistent representation of both average and differential policy impacts.
4.1.3. Implications for Empirical Analysis
The Monte Carlo simulations provide clear guidance for interpreting the empirical results based on CFPS data. The findings indicate that unweighted or simple DID models can yield misleading inferences, as positive average effects for women may mask substantial disadvantages faced by specific subgroups. While DID estimates tend to be modest or positive, DDD estimates are expected to be negative, reflecting disproportionate penalties borne by younger women who are perceived by employers as having higher fertility-related risk.
Future extensions may further evaluate estimator robustness under alternative simulation scenarios, such as heteroskedastic disturbances, propensity-score misspecification, and limited covariate overlap, which would provide additional stress tests beyond the benchmark environment considered here. Notably, this simulation evidence only provides auxiliary methodological support for the empirical strategy, rather than core causal validation, but real-world data may involve additional complexities such as imperfect overlap, measurement error, and partial covariate imbalance that are not fully captured in the stylized data-generating process.
4.2. Empirical Results
4.2.1. Two-Child Policy (CFPS 2014–2020)
The promotion results reveal a clear divergence between average gender effects and subgroup-specific outcomes, highlighting the importance of distinguishing DID and DDD estimates when evaluating fertility-policy impacts. The DID coefficient should be interpreted as the average gender effect of fertility-policy reform, capturing overall changes experienced by women relative to men. However, the negative DDD coefficient reveals that this average improvement conceals a subgroup-specific penalty concentrated among younger women, indicating that employer expectations generate heterogeneous career outcomes within the female workforce. The magnitude of this effect rises as weighting becomes more comprehensive, with the combined weighting specification yielding a DID estimate of 0.27 (MBF indicates decisive evidence against the null; see
Table 6), suggesting that unweighted models understate the average effect.
In contrast, the DDD estimates remain consistently negative (−0.39 to −0.31), with MBF values providing strong evidence that younger women faced a relative disadvantage compared with older women and men. Under the preferred combined weighting specification, the DDD coefficient equals −0.38 in log-odds terms, indicating a statistically supported subgroup-specific disadvantage in promotion outcomes for younger women relative to older women and men. To translate this effect into an economically interpretable magnitude, predicted probabilities are evaluated at representative baseline promotion rates observed in the sample. For baseline promotion probabilities in the range of 20–30 percent, a reduction of 0.38 in log-odds corresponds approximately to a 5–8 percentage-point lower probability of promotion for younger women following fertility-policy relaxation. This magnitude is economically meaningful given the relatively low baseline incidence of promotion and suggests that fertility-related expectation adjustments have non-trivial implications for career advancement among women of childbearing age. This divergence between positive DID and negative DDD effects highlights the importance of accounting for heterogeneous treatment effects when evaluating fertility-policy reforms.
Model fit statistics further support the use of weighted estimators. As shown in
Table 6, the combined weighting specification achieves the lowest AIC and BIC values, indicating stronger explanatory power relative to alternative approaches. Complementary accuracy metrics reported in
Table 7 show that the combined estimator minimizes relative bias and MAPE for both DID and DDD effects, suggesting improved stability and consistency across specifications. Therefore, the promotion results indicate that while fertility-policy relaxation may improve average promotion prospects for women, it simultaneously exacerbates promotion penalties for younger women, consistent with employer expectations regarding fertility-related costs (
Cooke, 2005;
Blau & Kahn, 2017).
- 2.
Employment
Table 8 presents the weighted logit DID and DDD estimates for employment outcomes following the fertility-policy reform. Employment outcomes show limited average gender effects but substantial subgroup heterogeneity, suggesting that fertility-policy responses operate primarily through expectation-driven differences among younger women. While the DID coefficient on the female × post-policy interaction is small and statistically weak (see
Table 8), indicating that fertility-policy reforms do not substantially alter average female employment outcomes, the DDD interaction term (female × young × post) is negative in sign, suggesting a relative employment disadvantage among younger women that is not visible in aggregate comparisons. This pattern indicates that aggregate employment stability may mask subgroup-specific penalties and suggests that fertility-policy relaxation primarily affects career advancement rather than labor-force participation on the extensive margin.
By contrast, the DDD estimates remain consistently negative (ranging from −0.19 to −0.14), with MBF values providing strong evidence that younger women (aged 20–39) experienced a relative decline in employment likelihood compared with older women and men. Under the combined weighting specification, the DDD coefficient equals −0.18 in log-odds terms, indicating a relative employment disadvantage for younger women following fertility-policy relaxation. Translating this estimate into probability space using representative baseline employment rates observed in the sample (approximately 70–80 percent), a reduction of 0.18 in log-odds corresponds to roughly a 3–4 percentage-point lower probability of employment for younger women compared with older women and men. Although smaller in magnitude than promotion effects, this decline remains economically meaningful given the high baseline employment rate and suggests that fertility-related expectations influence labor-force attachment at the extensive margin.
Model fit statistics reported in
Table 9 favor the weighted specifications, with the combined weighting approach achieving stronger information-criterion values. Consistent with the simulation evidence, accuracy metrics (reported separately) indicate that the combined estimator yields relatively stable and consistent estimates of heterogeneous effects. Taken together, the employment results reinforce the central finding of this study: while fertility-policy reforms do not substantially alter aggregate female employment, they impose disproportionate employment costs on younger women, underscoring the importance of accounting for heterogeneous responses in policy evaluation.
To facilitate interpretation of nonlinear interaction effects, we report both average marginal effects (AME) and marginal effects at representative values (MER). For the combined-weighted logit DDD estimate (−0.26), the implied probability effects indicate that fertility-policy reforms reduce the likelihood of earning above-median wages among women aged 20–39 by approximately 6.3–6.5 percentage points at representative baseline probabilities (0.45–0.50). Averaging these effects across observations yields an AME of approximately −0.063, confirming a substantively meaningful decline in younger women’s relative wage position (
Cha & Weeden, 2014;
Blau & Kahn, 2017).
- 3.
Wage Position
Wage-position results indicate that aggregate effects mask important within-gender disparities, with subgroup-specific penalties emerging once heterogeneity is explicitly modeled through DDD interactions. In
Table 10, the DID coefficients are generally small (0.10–0.12), with MBF values indicating modest evidence that fertility-policy relaxation slightly improved women’s relative wage positioning on average. This pattern suggests that the policy’s labor-market effects may be reflected in short-run wage gains for women.
In contrast, the DDD estimates remain consistently negative (−0.27 to −0.20 in
Table 11), with MBF values providing strong evidence of a relative deterioration in wage position among younger women compared with older women and men. Under the combined weighting specification, the DDD coefficient equals −0.26 in log-odds terms, indicating a relative deterioration in wage positioning for younger women. Evaluated at representative baseline probabilities of earning above-median wages (approximately 45–50 percent), this log-odds reduction corresponds to an estimated 6.3–6.5 percentage-point lower probability of being in the upper half of the wage distribution for younger women following fertility-policy reform. This magnitude is economically non-trivial and suggests that fertility-policy expansion may widen within-gender wage disparities even when average gender wage differences appear modest.
Model fit statistics again favor the weighted estimators, with the combined weighting approach demonstrating robust overall fit. These results are consistent with the promotion and employment findings, reinforcing the conclusion that fertility-policy reforms generate limited average wage benefits while disproportionately disadvantaging younger women within the wage distribution.
4.2.2. Three-Child Policy (CFPS 2020–2022)
Under the three-child policy, promotion outcomes suggest that subgroup-specific penalties emerge even when average effects remain muted, consistent with early employer expectation adjustments. In
Table 12, the DID coefficients remain small (0.00–0.07), with MBF values providing limited evidence for immediate average improvements in women’s promotion prospects. This contrasts with the two-child policy results and reflects the limited time horizon for firms to adjust promotion decisions.
Under the combined weighting specification, the DDD coefficient equals −0.24 in log-odds terms. Evaluated at representative baseline promotion probabilities (approximately 20–30 percent), this estimate corresponds to roughly a 4–5 percentage-point lower probability of promotion for younger women relative to comparison groups. Although smaller in magnitude than the two-child policy effects, the result indicates that employer expectation adjustments emerged rapidly following the three-child reform.
In contrast, the DDD estimates remain consistently negative (−0.25 to −0.18), with MBF values providing strong evidence that younger women experienced a relative decline in promotion likelihood compared with older women and men. Under the combined weighting specification, the DDD coefficient remains economically meaningful, supporting the interpretation that employer expectations regarding increased fertility risk disproportionately affected promotion outcomes for women of childbearing age even in the short run.
Model fit statistics in
Table 13 again favor the weighted specifications, with the combined weighting approach providing the most stable estimates. The persistence of negative DDD effects despite the short post-policy window suggests that anticipatory employer responses play an important role in shaping labor-market outcomes following fertility-policy expansion. Overall, the promotion results under the three-child policy reinforce the central finding of this study: fertility-policy relaxation does not necessarily improve women’s career advancement and may instead intensify subgroup-specific penalties, particularly for younger women, in the absence of complementary labor-market protections.
- 2.
Employment
Table 14 reports the weighted logit DID and DDD estimates for employment outcomes following the introduction of the three-child policy. Employment outcomes under the three-child policy suggest that aggregate gender differences remain limited, as reflected in the small and statistically weak DID interaction coefficient (female × post-policy) reported in
Table 14. By contrast, the DDD interaction term (female × young × post) remains negative, indicating persistent relative disadvantages for younger women and supporting an expectation-driven interpretation of labor-market heterogeneity. The associated MBF evidence supports the interpretation that short-run adjustments on the extensive margin are modest, which is consistent with the relatively short post-policy observation window.
In contrast, the DDD estimates remain consistently negative (−0.26 to −0.21), with MBF values providing strong evidence that younger women experienced a relative decline in employment likelihood compared with older women and men. Under the combined weighting specification, the DDD coefficient equals −0.25 in log-odds terms. For representative baseline employment rates in the range of 70–80 percent, this corresponds to approximately a 4–6 percentage-point lower probability of employment for younger women compared with older women and men. The magnitude suggests that fertility-related expectations may influence labor-force attachment even within a short post-policy window.
Model fit statistics in
Table 15 again favor the weighted estimators, with the combined weighting approach delivering the most stable results across specifications. Taken together, the employment findings under the three-child policy reinforce the evidence from promotion outcomes: while average employment effects are muted in the short run, subgroup-specific penalties for younger women emerge quickly following fertility-policy expansion.
- 3.
Wage Position
Table 16 reports the weighted logit DID and DDD estimates for the probability of earning a wage above the within-year median following the introduction of the three-child policy. Wage-position outcomes further confirm that fertility-policy expansion generates early distributional effects within the female workforce, even when overall wage changes appear limited. The DID coefficients are small across specifications, and the associated MBF values provide limited evidence for an immediate improvement in women’s relative wage position in the short run. This finding is consistent with the limited post-policy window and the typically slower adjustment of wages relative to employment and promotion outcomes.
By contrast, the DDD estimates remain uniformly negative (−0.21 to −0.15), with MBF values providing strong evidence of a relative deterioration in wage positioning among younger women compared with older women and men. Under the combined weighting specification, the DDD coefficient equals −0.20 in log-odds terms. When evaluated at baseline probabilities of earning above-median wages (approximately 45–50 percent), this translates into roughly a 5 percentage-point lower probability of being in the upper half of the wage distribution for younger women. The result indicates that wage disparities across female age cohorts may widen rapidly following fertility-policy expansion.
Model fit statistics in
Table 17 again favor the weighted estimators, with the combined weighting approach delivering the most stable results. Together with the promotion and employment findings, the wage results indicate that even in the short run, fertility-policy expansion can exacerbate within-gender disparities, disproportionately affecting younger women’s relative position in the wage distribution.
Across specifications, DID estimates serve as average policy benchmarks, whereas DDD estimates uncover subgroup-level mechanisms that would remain hidden under aggregate comparisons alone. Taken together, the evidence from both fertility-policy reforms, the two-child policy (2016–2020) and the three-child policy (2021–2022), reveals a consistent pattern of heterogeneous labor-market effects. Under the two-child policy, younger women experienced systematic disadvantages in promotion, employment, and wage positioning. During the early implementation of the three-child policy, the same pattern persists, although with smaller estimated magnitudes, reflecting the shorter post-policy window. These findings indicate that while aggregate effects for women appear limited, younger women have been repeatedly disadvantaged following successive fertility-policy expansions. The results are consistent with statistical discrimination mechanisms, whereby employers adjust expectations about maternity-related costs and concentrate their responses on women of childbearing age. Overall, fertility-policy liberalization has not translated into improved gender equality in the labor market and instead appears to reinforce age-specific disparities among women.
4.3. Marginal Effects Interpretation (AME and MER)
To facilitate interpretation of nonlinear interaction effects,
Table 18 reports average marginal effects (AME) and marginal effects at representative values (MER). As interaction coefficients in nonlinear models do not directly correspond to marginal probability effects, these estimates provide an interpretable mapping from log-odds to probability changes. The results indicate economically meaningful impacts: fertility-policy reforms reduce promotion probabilities by approximately 6.5–7.5 percentage points, employment probabilities by 2.8–3.5 percentage points, and the likelihood of earning above the median wage by about 6.3–6.5 percentage points for women aged 20–39. These findings confirm that the negative interaction effects translate into substantive labor-market penalties in probability terms.
4.4. Robustness Checks
To address potential omitted variable bias from time-varying industry-specific shocks and regional policy changes, we augment our baseline combined weighting specification with industry × year fixed effects and province × year fixed effects (
Olivetti & Petrongolo, 2017;
Thévenon & Solaz, 2013). This saturated fixed effect structure absorbs unobserved heterogeneity that evolves within sectors and provinces, including local childcare policies, labor-market regulations, and industry-level demand shifts.
As presented in
Table 19, the key DDD interaction terms remain negatively signed and supported by strong MBF values, consistent with baseline estimates. This stability confirms that our core findings are not driven by unobserved time-varying regional or industrial confounders.
We further address potential omitted variable bias related to unobserved firm-specific characteristics, regional policy differences, and time-varying labor-market conditions. Although firm-level data are not available in the CFPS, the inclusion of industry × year and province × year fixed effects effectively absorbs heterogeneous shocks at the sectoral and regional levels (
Olivetti & Petrongolo, 2017;
Thévenon & Solaz, 2013). The stability of DDD estimates and strong MBF evidence across specifications indicate that our core findings are not driven by omitted confounding factors. Any remaining unobserved heterogeneity would be unlikely to alter the qualitative pattern of disproportionate penalties faced by younger women, as shown in the robustness results.
To explore potential heterogeneity in the effects of fertility policy reforms, we examine differential impacts across subgroups defined by education level, industry sector, and urban–rural residence. These dimensions capture variation in labor-market flexibility, employer discrimination, and alternative employment opportunities that may shape the magnitude of maternal penalties.
Using MBF-based inference, we find that the negative DDD effects for women aged 20–39 is more pronounced in private and competitive industries and among women with middle education levels. These patterns are consistent with stronger cost concerns by employers in less protected sectors. By contrast, women in the public sector, education, or healthcare exhibit weaker and less statistically supported penalties, consistent with more stable employment protection and family-friendly workplace practices.
This heterogeneity reinforces our core finding that fertility reforms disproportionately penalize young women in more market-driven and less regulated segments of the labor market.
5. Discussion
The econometric framework serves primarily as an empirical tool to uncover economically meaningful heterogeneity in employer expectations, rather than as a standalone methodological contribution.
5.1. Simulation vs. Empirical Evidence
The central economic finding of this study is that fertility-policy expansion generates asymmetric labor-market effects that remain hidden in aggregate gender comparisons. While average outcomes suggest limited overall change, subgroup-specific analyses reveal that younger women face systematic disadvantages in promotion, employment, and wage positioning, consistent with expectation-driven statistical discrimination. The simulation evidence serves primarily to reinforce the credibility of these empirical findings by demonstrating that appropriate weighting improves estimator stability in nonlinear DID/DDD settings, rather than constituting a standalone methodological contribution (
Pfeffermann et al., 1998;
Rabe-Hesketh & Skrondal, 2006). By contrast, the combined weighting approach, integrating survey weights with causal reweighting, produces more stable and consistent estimates, supporting arguments in the econometric literature that appropriate reweighting is essential for recovering population-representative causal effects in nonlinear models (
Burgard et al., 2020).
The empirical findings align closely with theoretical predictions and previous studies on fertility policy and gendered labor-market outcomes. Across both fertility-policy reforms, the two-child policy (2016–2020) and the three-child policy (2021–2022), average DID estimates suggest limited or mildly positive effects for women. This pattern is consistent with aggregate labor-supply models, which predict modest short-run responses to fertility-policy changes (
X. Huang, 2025;
Liu & Liu, 2020). However, once heterogeneity is explicitly modeled using the DDD framework, a markedly different picture emerges: younger women aged 20–39 experience systematically negative effects in promotion, employment, and wage positioning (
Y. Chen & Wang, 2024;
Li, 2022;
Yu & Kono, 2024).
This divergence between average and subgroup-specific effects is consistent with theories of statistical discrimination and employer expectations, as discussed in the literature review. When fertility constraints are relaxed, employers may update beliefs about expected maternity-related costs and risks, leading to differential treatment of women of childbearing age even in the absence of actual fertility realizations. Prior evidence shows that fertility-policy reforms in China trigger expectation-driven discrimination: employers anticipate higher maternity-related costs and therefore reduce employment opportunities, promotion prospects, and wage growth for young women (
Yu & Kono, 2024;
Li, 2022). The persistence of negative DDD effects across successive policy expansions suggests that such expectation-based mechanisms operate rapidly and are reinforced with each reform (
Y. Chen & Wang, 2024).
Taken together, the simulation and empirical evidence support two central conclusions emphasized in literature. First, methodological choices, particularly weighting and model specification, are crucial for uncovering heterogeneous policy effects that would otherwise remain hidden in aggregate comparisons. Second, fertility-policy liberalization does not necessarily translate into improved gender equality in labor-market outcomes; instead, it can exacerbate age-specific disparities among women when institutional and labor-market protections are insufficient. By jointly integrating simulation validation, causal reweighting, and DDD estimation, this study provides empirical support for these theoretical insights and contributes to a more nuanced understanding of the gendered consequences of demographic policy reforms.
5.2. Mechanisms of Discrimination
The empirical patterns documented in this study are consistent with the theory of statistical discrimination originally formalized by
Phelps (
1972) and
Arrow (
1973). When individual fertility intentions and future labor-market attachment are imperfectly observed, employers rely on group-based expectations to infer expected productivity. Under expanded fertility policies, these expectations are revised upward for women of childbearing age, reflecting anticipated maternity-related absences and career interruptions. This logic is consistent with contemporary theoretical treatments showing that employers update beliefs about group-level productivity and adjust decisions accordingly when individual signals are noisy (
Chambers & Echenique, 2021;
Echenique & Li, 2025). As a result, younger women, who are more likely to bear children, face reduced opportunities for hiring, promotion, and wage progression, even in the absence of realized fertility events.
This expectation-based mechanism provides a coherent explanation for the coexistence of modest or positive average DID effects and consistently negative DDD effects observed in empirical analysis. While older women, whose perceived fertility risk is lower, may experience neutral or even slightly positive labor-market adjustments, younger women bear a concentrated disadvantage. Evidence from recent fertility-policy evaluations shows that women under 35 experience substantially larger employment and wage penalties, whereas older cohorts exhibit weaker or insignificant impacts (
Y. Chen & Wang, 2024;
Yu & Kono, 2024). Aggregate gender comparisons, therefore, mask substantial within-gender heterogeneity, which becomes visible only when age-based interactions are explicitly modeled. An empirical pattern was also observed in studies documenting complex heterogeneity across subgroups in the implementation of China’s fertility policies (
X. Huang, 2025).
These findings align closely with prior empirical evidence from both China and international settings. Studies using Chinese data show that fertility-related expectations play a central role in shaping employer behavior following policy relaxation, disproportionately affecting younger women’s labor-market outcomes (
He & Wu, 2019;
Q. Huang & Jin, 2022). International research similarly documents persistent motherhood and fertility penalties across a wide range of institutional contexts, suggesting that such mechanisms are not country-specific but reflect broader labor-market responses to perceived fertility risk (
Kleven et al., 2019).
Taken together, the evidence suggests that fertility-policy expansion, when implemented without complementary labor-market protection, can unintentionally reinforce gender inequality by intensifying age-specific discrimination. Expanding reproductive rights alone does not ensure equal economic participation; rather, without institutional safeguards, employer responses may amplify disparities across female demographic groups.
5.3. Policy Implications and Practical Relevance
The findings of this study carry important implications for the design of fertility and labor-market policies in aging economies. The empirical evidence shows that fertility-policy expansion alone does not guarantee improved gender equality in labor-market outcomes. While aggregate effects for women may appear neutral or modestly positive, heterogeneous effects are substantial: younger women of childbearing age experience systematic disadvantages in promotion, employment, and wage positioning. These patterns are consistent with expectation-based employer responses emphasized in the statistical discrimination literature (
Phelps, 1972;
Arrow, 1973).
From a policy perspective, these results suggest that pro-natalist reforms should be evaluated jointly with labor-market institutions that shape employer incentives. In the absence of complementary measures, such as employment protection during maternity, incentives for firms to retain and promote young female workers, or broader sharing of childcare responsibilities, fertility-policy expansion may inadvertently reinforce age-specific gender disparities. This implication is consistent with international evidence documenting persistent motherhood and fertility penalties even in contexts with generous family policies (
Kleven et al., 2019).
The findings also highlight the importance of policy sequencing. Demographic objectives aimed at increasing fertility may conflict with labor-market equality goals if implemented without parallel reforms that mitigate perceived fertility-related risks faced by employers. Policies that reduce the expected cost asymmetry of hiring and promoting women, such as subsidized parental leave shared across genders or public childcare provision, can weaken the mechanism of statistical discrimination and improve policy effectiveness.
More broadly, the results underscore a trade-off between demographic sustainability and gender equality when fertility policies operate in isolation. Achieving both objectives requires an integrated policy approach in which fertility incentives are accompanied by labor-market safeguards that protect women of childbearing age from disproportionate economic penalties. Without such coordination, fertility-policy liberalization risks shifting the burden of demographic adjustment onto younger women rather than alleviating long-run demographic pressures.
6. Conclusions
This study examines the gender-differentiated labor-market effects of two-child and three-child fertility policy reforms in China, with a focus on disproportionate penalties for women aged 20–39. Using a triple-difference (DDD) framework under a Bayesian inferential approach with Minimum Bayes Factors (MBF), we provide robust evidence that fertility expansion has weakened employment stability, job promotion prospects, and wage outcomes for younger women. Results from event-study analysis, placebo tests, and fixed-effect robustness checks consistently support the causal interpretation of our estimates. Our findings highlight that fertility policy liberalization alone may exacerbate gender inequality in the labor market without complementary investments in public childcare, standardized parental leave, and stronger legal protections against maternal discrimination. These results carry broad implications for countries seeking to balance fertility promotion and gender equality in the labor market.
The results reveal a structural policy tension: demographic revitalization may weaken gender-equal labor allocation unless accompanied by institutional reform. While China’s fertility-policy expansions were designed to counteract population aging and sustain long-run labor supply, the empirical evidence indicates that their labor-market consequences are unevenly distributed across gender and age cohorts.
Across both the two-child (2016–2020) and three-child (2021–2022) policy regimes, a consistent pattern emerges. Aggregate DID estimates suggest that women’s overall labor-market outcomes remain broadly stable or exhibit modest improvements following fertility-policy relaxation. However, once heterogeneity is explicitly modeled through DDD interactions, substantial and persistent disadvantages become visible among younger women of reproductive age. These subgroup-specific penalties are observed across promotion opportunities, employment probabilities, and relative wage positioning. The divergence between average and cohort-specific effects indicates that fertility-policy relaxation has intensified age-specific gender inequality rather than alleviating it.
The persistence of negative DDD effects under successive reforms is consistent with expectation-driven mechanisms emphasized in human capital and statistical discrimination theories. Anticipated maternity-related career interruptions may reduce employer incentives to invest in younger women’s advancement, while imperfect information encourages reliance on observable characteristics such as gender and age in hiring and promotion decisions. In this sense, fertility-policy liberalization may alter employer expectations even before actual fertility behavior changes, generating precautionary adjustments in labor allocation that disproportionately affect women of childbearing age.
Beyond these immediate labor-market effects, the penalties we document imply substantial long-term cumulative costs for affected women. Reduced access to promotion and weakened employment stability can lead to career stagnation, widening wage gaps, and diminished lifetime earnings potential. Over time, these cumulative disadvantages can lower lifetime labor-force attachment, reduce retirement security, and discourage ongoing human capital investment. Such long-run dynamic penalties represent an important and often overlooked channel through which fertility policy reforms shape persistent gender inequality in the labor market.
Methodologically, the findings demonstrate that conventional unweighted DID models are insufficient for evaluating heterogeneous policy impacts in complex survey settings. Unweighted estimators are prone to systematic bias, particularly when treatment exposure correlates with observable characteristics. By integrating survey design weights with causal reweighting strategies within a nonlinear DID/DDD framework, this study improves covariate balance and population representativeness while preserving the core identification logic of difference-in-differences. More broadly, the empirical strategy illustrates how weighted nonlinear interaction models can uncover hidden subgroup inequalities that remain invisible in average treatment effects.
From a policy perspective, mitigating disproportionate maternal penalties requires a comprehensive policy package that directly addresses the mechanisms identified in this study. Expanded public childcare services can reduce career interruptions and support labor-force attachment, while stricter enforcement of anti-discrimination regulations in hiring and promotion can limit employer responses based on expected fertility. Encouraging the uptake of paternity leave can help rebalance caregiving responsibilities and reduce gendered career disruptions. In addition, institutional mechanisms that share maternity-related costs among firms, households, and the state can alleviate employer incentives to penalize women of childbearing age.
For emerging and aging economies confronting similar demographic transitions, the central challenge lies in aligning demographic revitalization with gender-equal labor-market participation. Fertility-policy reform, when implemented without institutional safeguards, may generate structural trade-offs between demographic objectives and inclusive growth. Addressing this tension requires coordinated policy design that integrates family support measures with labor-market institutions capable of mitigating expectation-driven discrimination. In this respect, the findings contribute to ongoing debates on how demographic policy can be reconciled with the objectives of gender equality and sustainable economic development.
Several limitations of this study should be noted. First, the three-child policy analysis relies on a short post-policy window that overlaps with COVID-19-related labor-market disruptions (2020 pre-policy vs. 2022 post-policy), limiting the identification of long-run structural effects. As a result, short-term adjustments in employer expectations may be conflated with persistent policy impacts, and the estimates should be interpreted as short-run associations rather than long-run causal effects. Second, the use of self-reported survey data in the CFPS may introduce measurement error in key labor-market outcomes, potentially affecting estimation precision. Third, unobserved selection bias may remain, as endogenous fertility and labor-market participation decisions cannot be fully addressed by fixed effects alone. These limitations call for caution in generalizing the magnitude of estimated effects. Future research could examine longer-term policy impacts as additional post-reform data become available and incorporate employer- or firm-level information to better isolate the mechanisms underlying gendered labor-market responses.
Future research can extend this analysis in several directions. First, as additional survey waves become available, longer post-policy horizons will allow clearer differentiation between short-term employer expectation shocks and persistent labor-market effects of the three-child policy. Second, incorporating more granular career trajectory measures and longitudinal employment records can improve the estimation of cumulative career penalties and lifetime earnings gaps. Third, formal bounding and sensitivity analyses can further assess the roles of measurement error and selection bias. Fourth, integrating employer-side data or quasi-experimental designs would enable direct tests of statistical discrimination mechanisms. Finally, cross-country comparative studies exploiting variation in childcare systems, parental leave policies, and labor-market institutions can strengthen external validity and clarify how institutional contexts shape gendered policy effects.
Author Contributions
Conceptualization, Q.L. and R.T.; methodology, Q.L., R.T., S.L. and S.S.; software, Q.L. and S.S.; validation, Q.L. and R.T.; formal analysis, Q.L., R.T. and S.S.; investigation, Q.L., R.T. and S.S.; resources, Q.L.; data curation, Q.L.; writing—original draft preparation, Q.L., R.T. and S.S.; writing—review and editing, Q.L. and R.T.; visualization, Q.L. and R.T.; supervision, R.T.; project administration, R.T.; funding acquisition, R.T. All authors have read and agreed to the published version of the manuscript.
Funding
This research received no external funding.
Institutional Review Board Statement
Not applicable.
Informed Consent Statement
Not applicable.
Data Availability Statement
Dataset available on request from the authors.
Acknowledgments
The first author is a Ph.D. candidate in the Economics Program, Faculty of Economics, Chiang Mai University, supported by the CMU Presidential Scholarship. The authors gratefully acknowledge financial and institutional support from the Center of Excellence in Econometrics, Faculty of Economics, Chiang Mai University.
Conflicts of Interest
The authors declare no conflicts of interest.
Appendix A. Identification and Robustness
Appendix A.1. Event-Study Analysis
Table A1.
Pre-Reform Lead Estimates.
Table A1.
Pre-Reform Lead Estimates.
| Event Time (k) | Coefficient | MBF |
|---|
| k = −3 | 0.01 | 1.50 |
| k = −2 | −0.02 | 0.95 |
| k = −1 | 0.01 | 1.30 |
Figure A1.
Event-Study Coefficient Plot. Notes: Event-time coefficients are reported relative to the pre-policy baseline. Pre-policy estimates (k = −3, −2, −1) are small and centered around zero, providing no evidence of differential pre-trends and supporting the parallel trends assumption.
Figure A1.
Event-Study Coefficient Plot. Notes: Event-time coefficients are reported relative to the pre-policy baseline. Pre-policy estimates (k = −3, −2, −1) are small and centered around zero, providing no evidence of differential pre-trends and supporting the parallel trends assumption.
Appendix A.2. Placebo Tests
Table A2.
Placebo Test Results (DID and DDD).
Table A2.
Placebo Test Results (DID and DDD).
| Specification | Coefficient | MBF |
|---|
| Placebo DID | 0.015 | 1.42 |
| Placebo DDD | −0.021 | 0.88 |
Appendix A.3. Covariate Balance and Overlap
Table A3.
Propensity Score and Weight Diagnostics.
Table A3.
Propensity Score and Weight Diagnostics.
| Diagnostic | Value |
|---|
| Share within common support | 97.3% |
| Min propensity score | 0.08 |
| Max propensity score | 0.91 |
| Mean weight | 1.02 |
| Weight range (5th–95th percentile) | [0.20, 4.85] |
| MBF (balance test) | 1.12 |
References
- Ai, C., & Norton, E. C. (2003). Interaction terms in logit and probit models. Economics Letters, 80(1), 123–129. [Google Scholar] [CrossRef]
- Akaike, H. (1974). A new look at the statistical model identification. IEEE Transactions on Automatic Control, 19(6), 716–723. [Google Scholar] [CrossRef]
- Arrow, K. J. (1973). The theory of discrimination. In O. Ashenfelter, & A. Rees (Eds.), Discrimination in labor markets (pp. 3–33). Princeton University Press. [Google Scholar]
- Athey, S., & Imbens, G. W. (2006). Identification and inference in nonlinear difference-in-differences models. Econometrica, 74(2), 431–497. [Google Scholar] [CrossRef]
- Austin, P. C. (2009). Balance diagnostics for comparing the distribution of baseline covariates between treatment groups in propensity-score matched samples. Statistics in Medicine, 28(25), 3083–3107. [Google Scholar] [CrossRef] [PubMed]
- Becker, G. S. (1960). An economic analysis of fertility. In Demographic and economic change in developed countries (pp. 209–240). Princeton University Press (for NBER). [Google Scholar] [CrossRef]
- Becker, G. S. (1985). Human capital, effort, and the sexual division of labor. Journal of Labor Economics, 3(1), S33–S58. [Google Scholar] [CrossRef]
- Bertrand, M., Duflo, E., & Mullainathan, S. (2004). How much should we trust differences-in-differences estimates? Quarterly Journal of Economics, 119(1), 249–275. [Google Scholar] [CrossRef]
- Blau, F. D., & Kahn, L. M. (2017). The gender wage gap: Extent, trends, and explanations. Journal of Economic Literature, 55(3), 789–865. [Google Scholar] [CrossRef]
- Bongaarts, J. (2001). Fertility and reproductive preferences in post-transitional societies. Population and Development Review, 27, 260–281. [Google Scholar]
- Burgard, J. P., Dörr, P., & Münnich, R. T. (2020). Monte-Carlo simulation studies in survey statistics: An appraisal (No. 4/20). Research Papers in Economics. Available online: https://www.uni-trier.de/fileadmin/fb4/prof/VWL/EWF/Research_Papers/2020-04.pdf (accessed on 9 February 2026).
- Caldwell, J. C. (1982). Theory of fertility decline. Academic Press. [Google Scholar]
- Cha, Y., & Weeden, K. A. (2014). Overwork and the slow convergence in the gender gap in wages. American Sociological Review, 79(3), 457–484. [Google Scholar] [CrossRef]
- Chambers, C. P., & Echenique, F. (2021). A characterisation of Phelpsian statistical discrimination. The Economic Journal, 131(637), 2018–2032. [Google Scholar] [CrossRef]
- Chen, C., Hu, H., & Shi, R. (2023). Regional differences in Chinese female demand for childcare services of 0–3 years. Children, 10(1), 151. [Google Scholar] [CrossRef]
- Chen, Y., & Wang, Z. (2024). The dilemma between fertility and work: Evidence from the universal two-child policy. PLoS ONE, 19(8), e0308709. [Google Scholar] [CrossRef]
- Cooke, F. L. (2005). Women’s managerial careers in China in a period of reform. Asia Pacific Business Review, 11(2), 149–162. [Google Scholar] [CrossRef]
- Cuddy, A. J., Fiske, S. T., & Glick, P. (2004). When professionals become mothers, warmth does not cut the ice. Journal of Social Issues, 60(4), 701–718. [Google Scholar] [CrossRef]
- Du, F., & Dong, X.-Y. (2022). Universal two-child policy and women’s labor market outcomes in urban China. China Economic Review, 75, 101833. [Google Scholar] [CrossRef]
- Ebenstein, A. (2010). The “missing girls” of China and the unintended consequences of the one-child policy. Journal of Human Resources, 45(1), 87–115. [Google Scholar] [CrossRef]
- Echenique, F., & Li, A. (2025). Rationally inattentive statistical discrimination: Arrow meets Phelps. Journal of the European Economic Association, 23(5), 1712–1742. [Google Scholar] [CrossRef]
- England, P., Bearak, J., Budig, M. J., & Hodges, M. J. (2016). Do highly paid, highly skilled women experience the largest motherhood penalty? A meta-analysis. American Sociological Review, 81(6), 1161–1187. [Google Scholar] [CrossRef]
- Fan, J., & Gijbels, I. (1996). Local polynomial modelling and its applications. Chapman & Hall/CRC. [Google Scholar]
- Goldin, C. (2014). A grand gender convergence: Its last chapter. American Economic Review, 104(4), 1091–1119. [Google Scholar] [CrossRef]
- Goodkind, D. (2017). The astonishing population averted by China’s birth restrictions: Estimates, nightmares, and reprogrammed ambitions. Demography, 54(4), 1375–1400. [Google Scholar] [CrossRef]
- He, G., & Wu, X. (2019). Fertility policy and female labor supply in China. China Economic Review, 59, 101364. [Google Scholar] [CrossRef]
- Hirano, K., Imbens, G. W., & Ridder, G. (2003). Efficient estimation of average treatment effects using the estimated propensity score. Econometrica, 71(4), 1161–1189. [Google Scholar] [CrossRef]
- Huang, J., Wu, C., & Zeng, L. (2025). Pseudo-empirical likelihood methods for causal inference. Electronic Journal of Statistics, 19(1), 87–130. [Google Scholar] [CrossRef]
- Huang, Q., & Jin, X. (2022). The effect of the universal two-child policy on female labour market outcomes in China. The Economic and Labour Relations Review, 33(3), 526–546. [Google Scholar] [CrossRef]
- Huang, X. (2025). Can China’s two-child policy reverse fertility decline? An in-depth analysis of fertility behavior and desires. African Journal of Reproductive Health, 29(9), 74–90. [Google Scholar]
- Imbens, G. W. (2000). The role of the propensity score in estimating dose-response functions. Biometrika, 87(3), 706–710. [Google Scholar] [CrossRef]
- Kass, R. E., & Raftery, A. E. (1995). Bayes factors. Journal of the American Statistical Association, 90(430), 773–795. [Google Scholar] [CrossRef]
- Kleven, H., Landais, C., & Søgaard, J. E. (2019). Children and gender inequality: Evidence from Denmark. American Economic Journal: Applied Economics, 11(4), 181–209. [Google Scholar] [CrossRef]
- Leal Filho, W., Kovaleva, M., Tsani, S., Țîrcă, D. M., Shiel, C., Dinis, M. A. P., Nicolau, M., Sima, M., Fritzen, B., Salvia, A. L., Minhas, A., Kozlova, V., Doni, F., Spiteri, J., Gupta, T., Wakunuma, K., Sharma, M., Barbir, J., Shulla, K., … Tripathi, S. (2023). Promoting gender equality across the sustainable development goals. Environment, Development and Sustainability, 25(12), 14177–14198. [Google Scholar] [CrossRef]
- Li, X. (2022). The unintended impacts of the one-child policy relaxation in China on women’s labor market outcomes. SSRN Working Paper. [Google Scholar] [CrossRef]
- Li, X., Wen, D., Ye, L., & Yu, J. (2022). Does China’s fertility policy induce employment discrimination against women in the labor market? SSRN Working Paper. [Google Scholar] [CrossRef]
- Liu, J., & Liu, T. (2020). Two-child policy, gender income and fertility choice in China. International Review of Economics & Finance, 69, 1071–1081. [Google Scholar] [CrossRef]
- Lu, X. Q., Li, M., Tansuchat, R., & Yamaka, W. (2025). A machine learning approach to income inequality from environmental and demographic transitions. Decision Analytics Journal, 17, 100631. [Google Scholar] [CrossRef]
- Maurer-Fazio, M., Hughes, J., & Zhang, D. (2011). Economic reform, discrimination, and female employment in urban China. Journal of Comparative Economics, 39(4), 598–619. [Google Scholar] [CrossRef]
- Mincer, J., & Polachek, S. (1974). Family investments in human capital: Earnings of women. Journal of Political Economy, 82(2), S76–S108. [Google Scholar] [CrossRef]
- National Bureau of Statistics of China. (2024, February 28). Statistical communiqué of the People’s Republic of China on the 2023 national economic and social development. Available online: https://www.stats.gov.cn/english/PressRelease/202402/t20240228_1947918.html (accessed on 9 February 2026).
- Ochiai, E. (2018). The Japanese family system in transition: From the “ie” to postmodern families. In R. Goodman (Ed.), Family and social policy in Japan (pp. 15–32). Cambridge University Press. [Google Scholar]
- Olivetti, C., & Petrongolo, B. (2017). The economic consequences of family policies: Lessons from a century of legislation in high-income countries. Journal of Economic Perspectives, 31(1), 205–230. [Google Scholar] [CrossRef]
- Pfeffermann, D., Skinner, C. J., Holmes, D. J., Goldstein, H., & Rasbash, J. (1998). Weighting for unequal selection probabilities in multilevel models. Journal of the Royal Statistical Society Series B, 60(1), 23–40. [Google Scholar] [CrossRef]
- Phelps, E. S. (1972). The statistical theory of racism and sexism. American Economic Review, 62(4), 659–661. [Google Scholar]
- Rabe-Hesketh, S., & Skrondal, A. (2006). Multilevel modelling of complex survey data. Journal of the Royal Statistical Society: Series A, 169(4), 805–827. [Google Scholar] [CrossRef]
- Schwarz, G. (1978). Estimating the dimension of a model. Annals of Statistics, 6(2), 461–464. [Google Scholar] [CrossRef]
- Sellke, S. G., Bayarri, M. J., & Berger, J. O. (2001). Calibration of p-values for testing precise null hypotheses. The American Statistician, 55(1), 62–71. [Google Scholar] [CrossRef]
- Solodoha, E., Rosenzweig, S., & Harel, S. (2026). Do women entrepreneurs influence their start up’s exit? Entrepreneurial identity and firm exit in high tech. Journal of Business Research, 210, 116109. [Google Scholar] [CrossRef]
- Thévenon, O., & Solaz, A. (2013). Labour market effects of parental leave policies in OECD countries (OECD Social, Employment and Migration Working Papers, No. 141). OECD Publishing. [Google Scholar] [CrossRef]
- World Bank. (2026). Fertility rate, total (births per woman)—China. Available online: https://data.worldbank.org/indicator/SP.DYN.TFRT.IN?locations=CN (accessed on 1 February 2026).
- Xie, Y., Hu, J., & Zhang, C. (2014). The China family panel studies: Design and practice. Chinese Journal of Sociology, 1(1), 1–33. [Google Scholar]
- Yamaka, W. (2020). MBF: An R package for computing minimum Bayes factors (Version 0.1.0) [Computer software]. Available online: https://www.researchgate.net/publication/351731119_R_Package_MBF_Minimum_Bayes_Factors (accessed on 9 February 2026).
- Yu, Y., & Kono, H. (2024). Fertility policy and gender discrimination in the workplace: Evidence from the two-child policy reform in China (Discussion Paper No. E-24-001). Graduate School of Economics, Kyoto University. [Google Scholar]
- Zhang, C. (2017). Fertility intentions in the context of China’s two-child policy. Population and Development Review, 43(3), 565–587. [Google Scholar] [CrossRef]
- Zhao, W., & Hu, Y. Y. (2017). Gender inequality in the Chinese labor market. In DEStech transactions on economics, business and management (ICEM 2017). Available online: https://dpi-journals.com/index.php/dtem/article/view/13100 (accessed on 1 February 2026).
Figure 1.
Conceptual framework and identification strategy. Notes: The figure presents the conceptual framework and empirical identification strategy. The DID approach captures average gender-specific effects, while the DDD framework allows for heterogeneous effects across age–gender groups within a unified empirical design.
Figure 1.
Conceptual framework and identification strategy. Notes: The figure presents the conceptual framework and empirical identification strategy. The DID approach captures average gender-specific effects, while the DDD framework allows for heterogeneous effects across age–gender groups within a unified empirical design.
Table 1.
Descriptive statistics of main variables (2010–2022).
Table 1.
Descriptive statistics of main variables (2010–2022).
| Variable | Observations (N) | Mean | Std. Dev. | Min | Max |
|---|
| Job Promotion | 13,526 | 0.213 | 0.410 | 0 | 1 |
| Employment Status | 32,104 | 0.762 | 0.426 | 0 | 1 |
| Wage Above Median | 28,975 | 0.500 | 0.500 | 0 | 1 |
| Age | 36,412 | 38.62 | 8.71 | 20 | 60 |
| Education (Years) | 36,289 | 10.47 | 3.24 | 0 | 18 |
| Urban Residence | 36,412 | 0.618 | 0.486 | 0 | 1 |
Table 2.
Definitions and measurement of key variables.
Table 2.
Definitions and measurement of key variables.
| Variable | Description | Measurement or Coding | Primary Source/Reference |
|---|
| jobpromote | Job Promotion | Equals 1 if respondent reports being promoted since the last survey wave; 0 otherwise. | CFPS Employment Module (He & Wu, 2019) |
| workstat | Employment Status | Equals 1 if respondent is currently employed at the time of the interview; 0 otherwise. | CFPS Labor Status (Zhao & Hu, 2017) |
| wage_above_median | Wage Above Median | Equals 1 if monthly wage exceeds the sample median in each wave (calculated separately by year); 0 otherwise. | Author’s computation based on CFPS data |
| Post | Post-Policy Period Indicator | Equals 1 for post-policy years (2016 onward for two-child; 2021 onward for three-child policy); 0 otherwise. | National Policy Implementation Timeline (Q. Huang & Jin, 2022) |
| T (female) | Treatment Group | Equals 1 if respondent is female; 0 otherwise. | CFPS Core Roster |
| S (younger) | Younger Cohort Indicator | Equals 1 if respondent is aged 20–39; 0 otherwise. | Defined following Kleven et al. (2019) |
| Post × T | DID Interaction Term | Interaction of Post and Female, measuring gender-specific policy effects. | Author’s formulation |
| Post × T × S | DDD Interaction Term | Triple interaction capturing incremental effects on younger women relative to all others. | Author’s formulation |
| Controls (X) | Control Variables | Includes age, education, urban dummy, industry category, and province fixed effects. | Mincer and Polachek (1974); Zhang (2017) |
| crossweight | Cross-sectional Weight | Adjusts for unequal sampling probabilities across strata. | CFPS Technical Manual (Xie et al., 2014) |
| pidwgt | Person-Level Longitudinal Weight | Adjusts for nonresponse, post-stratification, and attrition bias; restores representativeness across waves. | CFPS Technical Manual (Xie et al., 2014) |
| fidwgt | Family-Level Weight | Household-level weight; not used in this individual-level analysis. | CFPS Technical Manual |
| IPW/GPS/Kernel | Causal Weights | IPW balances binary treatment groups; GPS balances multi-valued exposure; Kernel smooths covariate similarity. | Hirano et al. (2003); Imbens (2000); Fan and Gijbels (1996) |
| Combined Weight | Product Weight | (); ensures representativeness and causal identification simultaneously. | Author’s formulation |
Table 3.
Covariate balance before and after weighting.
Table 3.
Covariate balance before and after weighting.
| Variable | Unweighted SMD | Weighted SMD | Balance Criterion |
|---|
| Age | 0.142 | 0.045 | <0.1 |
| Education (Years) | 0.125 | 0.038 | <0.1 |
| Urban Residence | 0.131 | 0.041 | <0.1 |
| Industry Categories | 0.153 | 0.052 | <0.1 |
Table 4.
Accuracy of DID estimates (True = 0.80).
Table 4.
Accuracy of DID estimates (True = 0.80).
| Method | DID Est | Bias | MSE | RMSE | MAPE | sMAPE |
|---|
| Unweighted | 0.61 | −0.19 | 0.0361 | 0.19 | 23.8% | 27.0% |
| Survey | 0.68 | −0.12 | 0.0144 | 0.12 | 15.0% | 16.2% |
| IPW | 0.77 | −0.03 | 0.0009 | 0.03 | 3.8% | 3.8% |
| GPS | 0.74 | −0.06 | 0.0036 | 0.06 | 7.5% | 7.8% |
| Kernel | 0.80 | 0.00 | 0.0000 | 0.00 | 0.0% | 0.0% |
| Combined | 0.79 | −0.01 | 0.0001 | 0.01 | 1.3% | 1.3% |
Table 5.
Accuracy of DDD estimates (True = −0.50).
Table 5.
Accuracy of DDD estimates (True = −0.50).
| Method | DDD Est | Bias | MSE | RMSE | MAPE | sMAPE |
|---|
| Unweighted | −0.32 | +0.18 | 0.0324 | 0.18 | 36.0% | 43.9% |
| Survey | −0.41 | +0.09 | 0.0081 | 0.09 | 18.0% | 19.8% |
| IPW | −0.46 | +0.04 | 0.0016 | 0.04 | 8.0% | 8.3% |
| GPS | −0.48 | +0.02 | 0.0004 | 0.02 | 4.0% | 4.1% |
| Kernel | −0.52 | −0.02 | 0.0004 | 0.02 | 4.0% | 3.9% |
| Combined | −0.50 | 0.00 | 0.0000 | 0.00 | 0.0% | 0.0% |
Table 6.
Weighted logit DID and DDD estimates for job promotion (2014–2020).
Table 6.
Weighted logit DID and DDD estimates for job promotion (2014–2020).
| Method | DID Est (Post × T) | DDD Est (Post × T × S) | AIC | BIC | Pseudo-R2 | MBF (DID) | MBF (DDD) |
|---|
| Unweighted | 0.18 (0.09) | −0.31 (0.12) | 2908 | 2940 | 0.064 | 0.382 | 0.123 |
| Survey | 0.21 (0.08) | −0.34 (0.11) | 2896 | 2929 | 0.068 | 0.112 | 0.034 |
| IPW | 0.26 (0.07) | −0.37 (0.10) | 2884 | 2919 | 0.072 | 0.005 | 0.005 |
| GPS | 0.25 (0.08) | −0.35 (0.10) | 2888 | 2922 | 0.071 | 0.031 | 0.010 |
| Kernel | 0.28 (0.07) | −0.39 (0.09) | 2882 | 2916 | 0.073 | 0.002 | 4.44 × 10⁻⁴ |
| Combined | 0.27 (0.06) | −0.38 (0.09) | 2878 | 2914 | 0.074 | 2.20 × 10⁻⁴ | 6.99 × 10⁻⁴ |
Table 7.
Accuracy metrics for DID and DDD estimates (relative to combined weighting benchmark).
Table 7.
Accuracy metrics for DID and DDD estimates (relative to combined weighting benchmark).
| Method | DID Bias | DID MAPE | DDD Bias | DDD MAPE |
|---|
| Unweighted | −0.09 | 33.3% | +0.07 | 18.4% |
| Survey | −0.06 | 22.2% | +0.04 | 10.5% |
| IPW | −0.01 | 3.7% | +0.01 | 2.6% |
| GPS | −0.02 | 7.4% | +0.03 | 7.9% |
| Kernel | +0.01 | 3.7% | −0.01 | 2.6% |
Table 8.
Weighted logit DID and DDD estimates for employment (2014–2020).
Table 8.
Weighted logit DID and DDD estimates for employment (2014–2020).
| Method | DID Est (Post × T) | DDD Est (Post × T × S) | AIC | BIC | Pseudo-R2 | MBF (DID) | MBF (DDD) |
|---|
| Unweighted | −0.07 (0.05) | −0.14 (0.07) | 10,264 | 10,300 | 0.082 | 0.800 | 0.382 |
| Survey | −0.05 (0.05) | −0.16 (0.06) | 10,254 | 10,291 | 0.085 | 0.990 | 0.101 |
| IPW | −0.03 (0.04) | −0.18 (0.06) | 10,244 | 10,282 | 0.087 | 1.000 | 0.043 |
| GPS | −0.04 (0.05) | −0.17 (0.06) | 10,250 | 10,287 | 0.086 | 1.000 | 0.067 |
| Kernel | −0.02 (0.04) | −0.19 (0.05) | 10,242 | 10,280 | 0.088 | 1.000 | 0.003 |
| Combined | −0.03 (0.04) | −0.18 (0.05) | 10,240 | 10,278 | 0.089 | 1.000 | 0.007 |
Table 9.
Accuracy metrics for DID and DDD estimates (relative to combined weighting benchmark).
Table 9.
Accuracy metrics for DID and DDD estimates (relative to combined weighting benchmark).
| Method | DID Bias | DID MAPE | DDD Bias | DDD MAPE |
|---|
| Unweighted | −0.04 | 133% | +0.04 | 22.2% |
| Survey | −0.02 | 67% | +0.02 | 11.1% |
| IPW | 0.00 | 0.0% | 0.00 | 0.0% |
| GPS | −0.01 | 33% | −0.01 | 5.6% |
| Kernel | +0.01 | 33% | −0.01 | 5.6% |
Table 10.
Weighted logit DID and DDD estimates for wage position (2014–2020).
Table 10.
Weighted logit DID and DDD estimates for wage position (2014–2020).
| Method | DID Est (Post × T) | DDD Est (Post × T × S) | AIC | BIC | Pseudo-R2 | MBF (DID) | MBF (DDD) |
|---|
| Unweighted | 0.05 (0.06) | −0.20 (0.08) | 12,086 | 12,124 | 0.057 | 1.000 | 0.148 |
| Survey | 0.08 (0.06) | −0.23 (0.08) | 12,074 | 12,112 | 0.060 | 0.844 | 0.061 |
| IPW | 0.11 (0.05) | −0.25 (0.07) | 12,062 | 12,102 | 0.063 | 0.271 | 0.008 |
| GPS | 0.10 (0.05) | −0.24 (0.07) | 12,066 | 12,105 | 0.062 | 0.382 | 0.012 |
| Kernel | 0.12 (0.05) | −0.27 (0.07) | 12,058 | 12,098 | 0.064 | 0.183 | 0.003 |
| Combined | 0.12 (0.05) | −0.26 (0.07) | 12,054 | 12,095 | 0.065 | 0.183 | 0.005 |
Table 11.
Accuracy metrics for DID and DDD estimates (relative to combined weighting benchmark).
Table 11.
Accuracy metrics for DID and DDD estimates (relative to combined weighting benchmark).
| Method | DID Bias | DID MAPE | DDD Bias | DDD MAPE |
|---|
| Unweighted | −0.07 | 58.3% | +0.06 | 23.1% |
| Survey | −0.04 | 33.3% | +0.03 | 11.5% |
| IPW | −0.01 | 8.3% | +0.01 | 3.8% |
| GPS | −0.02 | 16.7% | +0.02 | 7.7% |
| Kernel | 0.00 | 0.0% | −0.01 | 3.8% |
Table 12.
Weighted logit DID and DDD estimates for job promotion (2020–2022).
Table 12.
Weighted logit DID and DDD estimates for job promotion (2020–2022).
| Method | DID Est (Post × T) | DDD Est (Post × T × S) | AIC | BIC | Pseudo-R2 | MBF (DID) | MBF (DDD) |
|---|
| Unweighted | −0.05 (0.07) | −0.18 (0.09) | 1478 | 1505 | 0.058 | 1.000 | 0.382 |
| Survey | −0.02 (0.07) | −0.20 (0.09) | 1474 | 1502 | 0.060 | 1.000 | 0.260 |
| IPW | 0.01 (0.06) | −0.23 (0.08) | 1470 | 1499 | 0.062 | 1.000 | 0.061 |
| GPS | 0.00 (0.06) | −0.22 (0.08) | 1472 | 1501 | 0.061 | 1.000 | 0.083 |
| Kernel | 0.02 (0.06) | −0.25 (0.08) | 1468 | 1497 | 0.063 | 1.000 | 0.031 |
| Combined | 0.01 (0.06) | −0.24 (0.08) | 1466 | 1496 | 0.064 | 1.000 | 0.043 |
Table 13.
Accuracy metrics for DID and DDD estimates (relative to combined weighting benchmark).
Table 13.
Accuracy metrics for DID and DDD estimates (relative to combined weighting benchmark).
| Method | DID Bias | DID MAPE | DDD Bias | DDD MAPE |
|---|
| Unweighted | −0.06 | 600% | +0.06 | 25.0% |
| Survey | −0.03 | 300% | +0.04 | 16.7% |
| IPW | 0.00 | 0.0% | +0.01 | 4.2% |
| GPS | −0.01 | 100% | +0.02 | 8.3% |
| Kernel | +0.01 | 100% | −0.01 | 4.2% |
Table 14.
Weighted logit DID and DDD estimates for employment (2020–2022).
Table 14.
Weighted logit DID and DDD estimates for employment (2020–2022).
| Method | DID Est (Post × T) | DDD Est (Post × T × S) | AIC | BIC | Pseudo-R2 | MBF (DID) | MBF (DDD) |
|---|
| Unweighted | −0.10 (0.06) | −0.21 (0.08) | 5628 | 5665 | 0.076 | 0.610 | 0.112 |
| Survey | −0.09 (0.06) | −0.23 (0.08) | 5622 | 5660 | 0.078 | 0.731 | 0.061 |
| IPW | −0.07 (0.05) | −0.25 (0.07) | 5614 | 5653 | 0.080 | 0.800 | 0.008 |
| GPS | −0.08 (0.05) | −0.24 (0.07) | 5618 | 5657 | 0.079 | 0.659 | 0.012 |
| Kernel | −0.06 (0.05) | −0.26 (0.07) | 5612 | 5651 | 0.081 | 0.919 | 0.005 |
| Combined | −0.07 (0.05) | −0.25 (0.07) | 5610 | 5650 | 0.082 | 0.800 | 0.008 |
Table 15.
Accuracy metrics for DID and DDD estimates (relative to combined weighting benchmark).
Table 15.
Accuracy metrics for DID and DDD estimates (relative to combined weighting benchmark).
| Method | DID Bias | DID MAPE | DDD Bias | DDD MAPE |
|---|
| Unweighted | −0.03 | 42.9% | +0.04 | 16.0% |
| Survey | −0.02 | 28.6% | +0.02 | 8.0% |
| IPW | 0.00 | 0.0% | 0.00 | 0.0% |
| GPS | −0.01 | 14.3% | +0.01 | 4.0% |
| Kernel | +0.01 | 14.3% | −0.01 | 4.0% |
Table 16.
Weighted logit DID and DDD estimates for wage position (2020–2022).
Table 16.
Weighted logit DID and DDD estimates for wage position (2020–2022).
| Method | DID Est (Post × T) | DDD Est (Post × T × S) | AIC | BIC | Pseudo-R2 | MBF (DID) | MBF (DDD) |
|---|
| Unweighted | 0.02 (0.06) | −0.15 (0.07) | 6516 | 6555 | 0.062 | 1.000 | 0.300 |
| Survey | 0.04 (0.06) | −0.18 (0.07) | 6508 | 6548 | 0.064 | 1.000 | 0.126 |
| IPW | 0.06 (0.05) | −0.20 (0.06) | 6502 | 6543 | 0.066 | 0.919 | 0.016 |
| GPS | 0.05 (0.05) | −0.19 (0.06) | 6504 | 6545 | 0.065 | 0.990 | 0.027 |
| Kernel | 0.07 (0.05) | −0.21 (0.06) | 6500 | 6542 | 0.067 | 0.800 | 0.010 |
| Combined | 0.06 (0.05) | −0.20 (0.06) | 6498 | 6540 | 0.068 | 0.919 | 0.016 |
Table 17.
Accuracy metrics for DID and DDD estimates (relative to combined weighting benchmark).
Table 17.
Accuracy metrics for DID and DDD estimates (relative to combined weighting benchmark).
| Method | DID Bias | DID MAPE | DDD Bias | DDD MAPE |
|---|
| Unweighted | −0.04 | 66.7% | +0.05 | 25.0% |
| Survey | −0.02 | 33.3% | +0.02 | 10.0% |
| IPW | 0.00 | 0.0% | 0.00 | 0.0% |
| GPS | −0.01 | 16.7% | −0.01 | 5.0% |
| Kernel | +0.01 | 16.7% | −0.01 | 5.0% |
Table 18.
Marginal effects of fertility policy reforms (AME and MER).
Table 18.
Marginal effects of fertility policy reforms (AME and MER).
| Outcome | DDD Coef. | AME | MER (Low Baseline) | MER (High Baseline) |
|---|
| Promotion | −0.30 | −0.07 | −0.065 | −0.075 |
| Employment | −0.15 | −0.03 | −0.028 | −0.035 |
| Wage above median | −0.26 | −0.063 | −0.063 | −0.065 |
Table 19.
Robustness: Industry × Year and Province × Year Fixed Effects.
Table 19.
Robustness: Industry × Year and Province × Year Fixed Effects.
| Outcome | DID Est. | DDD Est. | AIC | BIC | Pseudo-R2 | MBF (DID) | MBF (DDD) |
|---|
| Job Promotion | 0.25 | −0.36 | 2871 | 2907 | 0.076 | 0.003 | 4.11 × 10⁻⁴ |
| Employment | −0.04 | −0.17 | 10,231 | 10,269 | 0.091 | 0.981 | 0.009 |
| Wage Above Median | 0.10 | −0.24 | 12,047 | 12,088 | 0.067 | 0.298 | 0.006 |
| Disclaimer/Publisher’s Note: The statements, opinions and data contained in all publications are solely those of the individual author(s) and contributor(s) and not of MDPI and/or the editor(s). MDPI and/or the editor(s) disclaim responsibility for any injury to people or property resulting from any ideas, methods, instructions or products referred to in the content. |