Article

Determinant of Profitability: An Empirical Investigation of the Role of Financial Structure, Technological Innovation, and Managerial Attributes

1
Department of Research Methodology, Faculty of Economic Mathematics, Thuongmai University, Hanoi 10000, Vietnam
2
Department of Economic Management, Faculty of Economics, Thuongmai University, Hanoi 10000, Vietnam
*
Author to whom correspondence should be addressed.
Economies 2026, 14(3), 85; https://doi.org/10.3390/economies14030085
Submission received: 25 October 2025 / Revised: 26 November 2025 / Accepted: 1 December 2025 / Published: 10 March 2026

Abstract

Our work is one of the lasted studies on the impact of factors on the profitability of enterprises in the electronics and electrical equipment industry from a transitional economy. Panel data were collected from publicly listed firms in the period 2015–2024. The research result showed that technological innovating enterprises were more profitable than non-technological innovating enterprises. Other factors also have a positive impact on the profitability of enterprises, namely fixed asset turnover, and firm size. However, the financial leverage has a negative impact on ROA and ROE. The gender of the manager has no effect on the profitability of electronics and electrical goods enterprises in this study.

1. Introduction

Innovation is set to become a vital factor in improving organizational competitive advantage, and as a result it can help enhance sustainable firms’ growth and firms’ value. Many leaders have recognized innovation as a global strategy that their corporates must pursue consistently in the long term. Innovation has become inseparably linked to both economic growth and social advancement, establishing itself as a cornerstone of development, particularly in an era characterized by rapid technological transformation (Schumpeter & Swedberg, 2021). Innovation is now recognized as a critical determinant of success, serving as a key driver of organizational resilience and adaptability. Large corporations are progressively adopting agile models to foster innovation in products and processes, while startups are gaining momentum by delivering disruptive solutions that challenge established market paradigms (Bessant & Tidd, 2019). For recent years, there has been a rapid rise in the use of the innovation term, and one of the most popular definition belongs to the third edition of the Oslo Manual (OECD, 2005); this organization has defined the concept of innovation as the implementation of a new or significantly improved product (good or service), or process, a new marketing method, or a new organizational method in business practices, workplace organizations, or external relations (OECD, 2005).
In addition, according to the OECD (2009) the first two types of innovation are traditionally more closely related to technological innovation. Firms are considered innovative if they have implemented an innovation during the period under review (the observation period is usually two to three years) while marketing and organizational innovation are referred to as non-technological innovation. In this paper, for the standard meaning of innovation, we will use the term “technological innovation”, defined as the technical process through which new and/or improved technologies are developed and proliferated through commercialization (Sagar & Van der Zwaan, 2006).
A firm’s profitability often refers to a company’s capacity to generate earnings relative to its sales, assets, equity, or other financial metrics. It is a key indicator of financial performance. Profitability is crucial for a firm’s growth in the long term, especially, this is a key financial outcome in the publicly listed companies due to the fact that a higher profitability helps firms attract more new investors and customers. Profitability could be measured by various indicators in which return on assets (acronym ROA) and return on equity (acronym ROE) have been used in our study.
The nexus between innovation and firm-level financial performance has been extensively examined in prior research (Aas & Pedersen, 2011). On the theory, the impact of innovation on firm profitability cannot be explained from a single viewpoint. Several grounded theories have been proposed to explore the relationship between technological innovation and firm profitability; the most common perspectives are the Resource-Based View (RBV) and the Technology Acceptance Model (TAM). The RBV approach represents that internal resources are critical inputs for innovation, that bring many benefits to organizations. The RBV offers a theoretical framework that enables firms to identify their internal resources and capabilities so that enterprises focus on developing new products or processes. The fourth industrial revolution has made the RBV model become more important; it helps to explain the key drivers of how firms pursue technology-based innovation. In fact, high technological capability could ensure that firms achieve high profitability in comparison with their competitor. Moreover, the TAM emphasizes the determinants influencing an organization’s adoption and utilization of new technologies. It posits that perceived usefulness—the degree to which a technology enhances task performance—and perceived ease of use—the extent to which using the technology requires minimal effort—are the primary drivers of technology acceptance (Onita & Ochulor, 2024). While the theoretical approach has been easily understood, the earlier empirical studies have been inconclusive. Over the prior literature, innovation is considered to be a key determinant which has positively affected financial performance; this is because it can help firms improve their current position, build up a stronger competitive advantage, and reach a higher performance (Mai et al., 2019; Walker, 2005). However, technological innovation can have various impact on firm’s profitability, depending on length of time (Adner & Levinthal, 2001; Lawless & Anderson, 1996). Nevertheless, the effect of innovation on a firm’s profitability over time seems to be unobserved in the previous research. Such misleading assumptions which skip the length of time can lead to serious consequences with regard to unobserved heterogeneity due to cross-sectional data. It can cause measurement errors; this is a main issue with regard to the survey method. In order to solve the problem, our study followed the suggestion of Mai et al. (2019); a dummy variable was generated to distinguish between companies with technological innovating orientation and non-innovators.
Concerning firm’s performance, this study will delve into the key determinants of profitability; we shed light on the role of technological innovation associated with a firm’s profitability. The electronics and electrical appliance firms were chosen for several reasons. First of all, they usually have been critical to technological innovation from the inherent attribute of their sector. Secondly, these firms have been considered to be valuable for studying competitive strategies due to their constant need to innovate and their interdisciplinary nature.
This paper is organized into five sections: Section 1 gives a brief overview of technological innovation and profitability, and Section 2 analyses hypothesis development. In Section 3, data sources and research methods are presented. Key findings are in Section 4, and our conclusions are drawn in Section 5.

2. Development of Empirical Hypothesis

Both scholars and practitioners have extensively explored the impact of various factors on corporate profitability. Much work on the potential of determinants of profitability has been carried out by many researchers, yet there are still some critical issues related to the factors affecting them. In this study, we try to develop several main hypotheses as follows:

2.1. Effect of Fixed Asset Turnover on Profitability

According to Brigham and Houston (2009), the fixed asset turnover (FAT) ratio measures how a firm efficiently employs its plant and equipment to produce sales within a specific timeframe, and thus the FAT ratio reflects the firm’s efficiency in utilizing its fixed assets to generate sales (Sunjoko & Arilyn, 2016), when this ratio increases, fixed assets are used better. The higher ratio a company has, the more of their fixed assets the company manages. As a result, companies can achieve greater sales as well as higher profitability. The finding of Sunjoko and Arilyn (2016) indicated that FAT negatively affected the profitability of pharmaceutical companies listed at the Indonesia Stock Exchange in the period 2007–2013. Additionally, the research of Purba and Bimantara (2020) demonstrated that FAT has a positive and significant effect on ROA. Using operating profit margin was another metric; more recent evidence from Jati et al. (2023) revealed that FAT had an effect on the Operational Profit Margin of five large-scale construction service companies in Indonesia with vulnerable observation periods from 2017 to 2021. Specifically, FAT had a positive effect on Operational Profit Margin; when FAT increased by 1%, Operational Profit Margin also went up by 2.15%.
Complexity, in terms of short-run model as well as long-run model FAT, had a positive impact on ROA. In particular, the short-run estimate indicated that lagged (by one year) 1% fall (rise) in FAT decreases (increases) current ROA by 1.99%, while the long-run dynamics revealed that a 1% decrease (increase) in FAT leads to a 2.61% decrease (increase) in ROA, holding other factors constant (Mahor & Banerji, 2024).
To sum up, the impact of FAT on business profitability could be statistically significant; however, the direction of this connection remains inconsistent, and it depends on specific measures of profitability. Drawing upon the prior literature, the following hypothesis in our study is proposed as below:
H1. 
Fixed Asset Turnover positively influences firm profitability.

2.2. Effect of Capital Structure on Profitability

There have been a lot of different studies of the effect of capital structure on firm profitability; however, the findings have remained controversial. Several scholars concluded that debt in the capital structure positively impacts on the profitability, whereas others argued that a higher debt leads to lower profitability. In theory, the association between capital structure and firm profitability can be clearly explained through the Pecking Order Theory proposed by Myers (1984), which demonstrated the firm’s preferences for internal sources of finance instead of external ones. In practice, Herciu and Ogrean (2017) revealed that debt-to-equity correlated significantly with ROE; their explanations highlighted that the identification of an optimal capital structure was really complex. Recently, Ghardallou (2022) employed the quantile regression on a sample of 120 non-financial companies listed on the Tadawul stock exchange between 2017 and 2020. Profitability was measured by ROA and; ROE while the debts-to-equity ratio was a proxy variable of capital structure. His finding showed that debts-to-equity ratio decreased business profitability. In particular, the liabilities-to-equity ratio had a stronger negative impact on the performance of highly profitable enterprises.
Lastly, by using various measurements of capital structure, the finding of Amin and Cek (2023) highlighted that the total debt-to-equity ratio deviating from the optimal golden ratio for firms in France as well as the UK had a negative and statistically significant effect on ROA and ROE. In particular, when firms employed debt to the tune of 0.618, it affected negatively on their profitability. In conclusion, current studies need to examine the relationship between capital structure and profitability. Thus, the second hypothesis in our study was developed as follows:
H2. 
A higher liability to equity ratio lead to a lower profitability.

2.3. Effect of Financial Leverage on Profitability

Financial leverage was established when companies selected fixed cost capital, a decision generally is aimed toward higher profitability (Van Horne & Wachowicz, 2005). The M&M theory from Modigliani and Miller (1958) highlighted that when joint stock companies decided to increase debt, shareholders could obtain more income. This is a compensation due to taking risks in financial decisions (high risk, high return), so profitability could be affected by financial leverage in the positive or negative direction. Despite the nexus between financial leverage and the firm’s profitability being explored by various studies, these findings remain inconsistent. It depends on measurement scales, and the nature of business. On the one hand, several prior studies demonstrate a negative relationship; specifically, Samo and Murad (2019) calculated financial leverage by debt-to-equity ratio while ROA and ROE represented profitability in the textile industry of Pakistan. Their result revealed that financial leverage had a negative impact on ROA as well as ROE, but the degree of the effect of the leverage variable debt ratio did not correlate strongly with ROA. On the other hand, earlier studies indicated the non-linear relationship between financial leverage and a firm’s profitability. In particular, the finding of Dalci (2018) indicated an inverted U-shape, in both a positive effect and a negative effect.
In addition, Endri et al. (2021) showed that debt-to-equity ratio had no significant effect on ROA, whereas it affected negatively on profitability for the dependent variable ROE. Similarly, debt-to-equity Ratio did not have a meaningful impact on the ROA in the context of the COVID-19 pandemic, but it really had significant negative effects on ROE (Li, 2024). So, we believe that there has been a negative relationship between financial leverage and business profitability, which can originate from agency problems; this study examines a hypothesis as follows:
H3. 
Financial leverage significantly negative impacts on profitability.

2.4. Effect of Technological Innovation on Profitability

The systematic study on the effect of technological innovation profitability was performed in 2021 by Jamai et al. (2021) who investigated the association between different type of innovation and SMEs performance, also identifing the determinant of a firm’s growth across industries from many previous articles. Their study concentrated on technological innovation (product and process innovation) as well as non-technical innovation (organizational and marketing innovation) while a firm’s performance was measured by various financial indicators like ROA, ROE, ROS, or ROI. Their findings indicated that the impact of innovation varies across industrial sectors, highlighting which innovation types contribute most effectively to enhancing firm profitability. Specifically, product innovation significantly affected selected sectors whereas both marketing innovation and product innovation became the primary drivers of growth among agro-food enterprises. Likewise, organizational and product innovations played an important role in improving a firm’s performance in the manufacturing and service sectors. Although process innovation has made significant contributions for a firm’s growth, there has been little evidence that process innovation significantly affects firm performance. It showed that process innovation influenced positively on Sustainable Supply Chain Performance; its effect was significant and crucial com-pared to other determinants of Supply Chain Performance (Qureshi et al., 2023). A recent review of the literature on this area by Wang and Ahmad (2024) found that green innovation (measured by both green product innovation and green process innovation) had a significant positive effect on all indicators of the profitability (ROA, ROE and Tobin’s Q) of 280 listed non-financial firms operating in South Asia.
So, based on the prior literature, this study comes to following hypothesis as below:
H4. 
Technological innovation is positively related to firm profitability.

2.5. Effect of Firm Size and Gender of Manager on Profitability

The relationship between firm size, manager’s gender, and profitability remain complex, and it depends on the context. Firm size could be measured in different ways across studies. Specifically, according to Cortés et al. (2021), firm size can be proxied by various indicators, such as sales, assets, number of employees, and other related measures. These measures include advantages as well as disadvantages, and the number of employees is a discrete variable that may not adequately capture changes in firm size. In contrast, asset values can occasionally take negative figures, unlike employment or sales indicators. Consequently, prior studies have argued that sales may be used as a more reliable measure of firm size (Cortés et al., 2017, 2021; Pascoal et al., 2016).
On the one hand, regarding the effect of firm size on business profitability, expanding the scope of operations has consistently been a strategic priority for firms. Theoretically, the positive association between firm size and performance is often explained by economies of scale, which enable larger firms to distribute fixed costs more efficiently, enhance productivity, and strengthen competitive advantage (Wang & Ahmad, 2024). On the other hand, in terms of gender diversity, the role of females has been changing more and more in the joint stock company. According to the results of Luh and Kusi (2023), although men continued to dominate executive positions in listed non-financial firms in Ghana, the presence of women in top corporate leadership roles such as CEO, COB, or board member, had a positive influence on firm profitability, as measured by ROA and other financial indicators. These effects remain robust even after controlling for year and industry fixed effects. Thus, we argue two hypotheses as below:
H5a. 
Firm size significantly impacts on profitability.
H5b. 
Gender of manager on profitability significantly impacts on profitability.

3. Data and Research Method

3.1. Data Sources

The sample was selected on the basis of the list of listed companies and industry classifications.
The criteria for selecting the sector was based on reference to industry systems commonly used by stock exchange around the world such as the Industry Classification Benchmark (which was developed by Dow Jones and FTSE and is currently managed by FTSE Russell), and the Global Industry Classification Standard (which was built and developed by MSCI and tailored to the specific characteristics of the Vietnamese economy (FiinGroup, 2025). The initial sample consisted of 23 companies from the electronic and electrical equipment sector which were listed as well as registered for trading on all threestock exchanges: HOSE, HNX, and Upcom.
Secondary data were collected during the period from 2015 to 2024. All of the main variables were gathered from audited financial statements and annual reports. The Stata package was performed to analyze the panel data.

3.2. Research Method

In order to investigate carefully the effect of the main factors on a firm’s profitability, we followed the panel data regression procedure based on (V. C. Nguyen & Huynh, 2023). First of all, the stationarity of data was examined by the unit root test. Next, pooled Ordinary Least Squares (OLS) and random effect model (REM) were performed; our study used the Breusch Pagan Lagrange Multiplier (BPLM) test, such as Stata’s xttest0, to choose between pooled OLS and REM for panel data. Then, the Hausman test was used to select fixed effects model (FEM) or REM. After choosing FEM, autocorrelation and heteroscedasticity were diagnostic. Consequently, there exist both autocorrelation and heteroscedasticity in FEM, which are common defects in panel data. Encountering these defects means that standard OLS assumptions are violated, making the model’s standard errors unreliable; therefore, methods like Heteroscedasticity and Autocorrelation Consistent (HAC) estimators, Generalized Least Squares (GLS), or model transformations should be applied to correct the issue. It can ensure robust statistical inference. Relying on p-value in FGLS model estimation, all hypotheses’ testing was supported or rejected.
The summary meaning and measure of the key variables are shown in Table 1.
This study aimed to identify the determinants of profitability in the electronics and electrical appliance industry. To achieve this objective, we analyze a sample of 23 firms operating in the electronics and electrical appliance sector and listed on the Vietnamese stock exchanges during the period 2015–2024. The dataset was collected from annual reports and financial statements.
Econometric function:
Profitabilityi,t = αi + αt + β1*FATi,t + β2*INNi,t + β3*DERi,t + β4*CAPi,t + γXi,t + ϵi,t
where
i indexes firms, t time.
Xi,t control variables, consisting of firm size (Size) and manager’s gender (COB). The gender of the chairman of the board was collected from the annual reports of the enterprises, which included the names and genders of the chairman of the board members.
ϵi,t: Random error in a panel data estimation

4. Results and Discussion

4.1. Overview of Electronics and Electrical Appliance Sector

Vietnam’s electronics industry was established in the 1960s, initially concentrated in the southern region with enterprises mainly engaged in the production of components for the electronics sector and several related supporting industries. According to the Ministry of Industry and Trade (2024), during the period from 2021 to 2024, despite severe impacts from the COVID-19 pandemic and the global economic slowdown, the export turnover of electronic products continued to rise in the first two years, reaching USD 155.5 billion in 2021 and USD 169.9 billion in 2022, before slightly declining to USD 163.8 billion. Nevertheless, the two major export categories—electronics, computers and components, and telephones and components—still recorded substantial export values of USD 57.3 billion and USD 52.3 billion, respectively. In parallel, the number of newly invested enterprises has continued to increase, marked by the establishment of production facilities by leading multinational corporations such as Samsung Group (South Korea), LG Group (South Korea), Intel Corporation (United States), and Foxconn Technology Group (Taiwan).
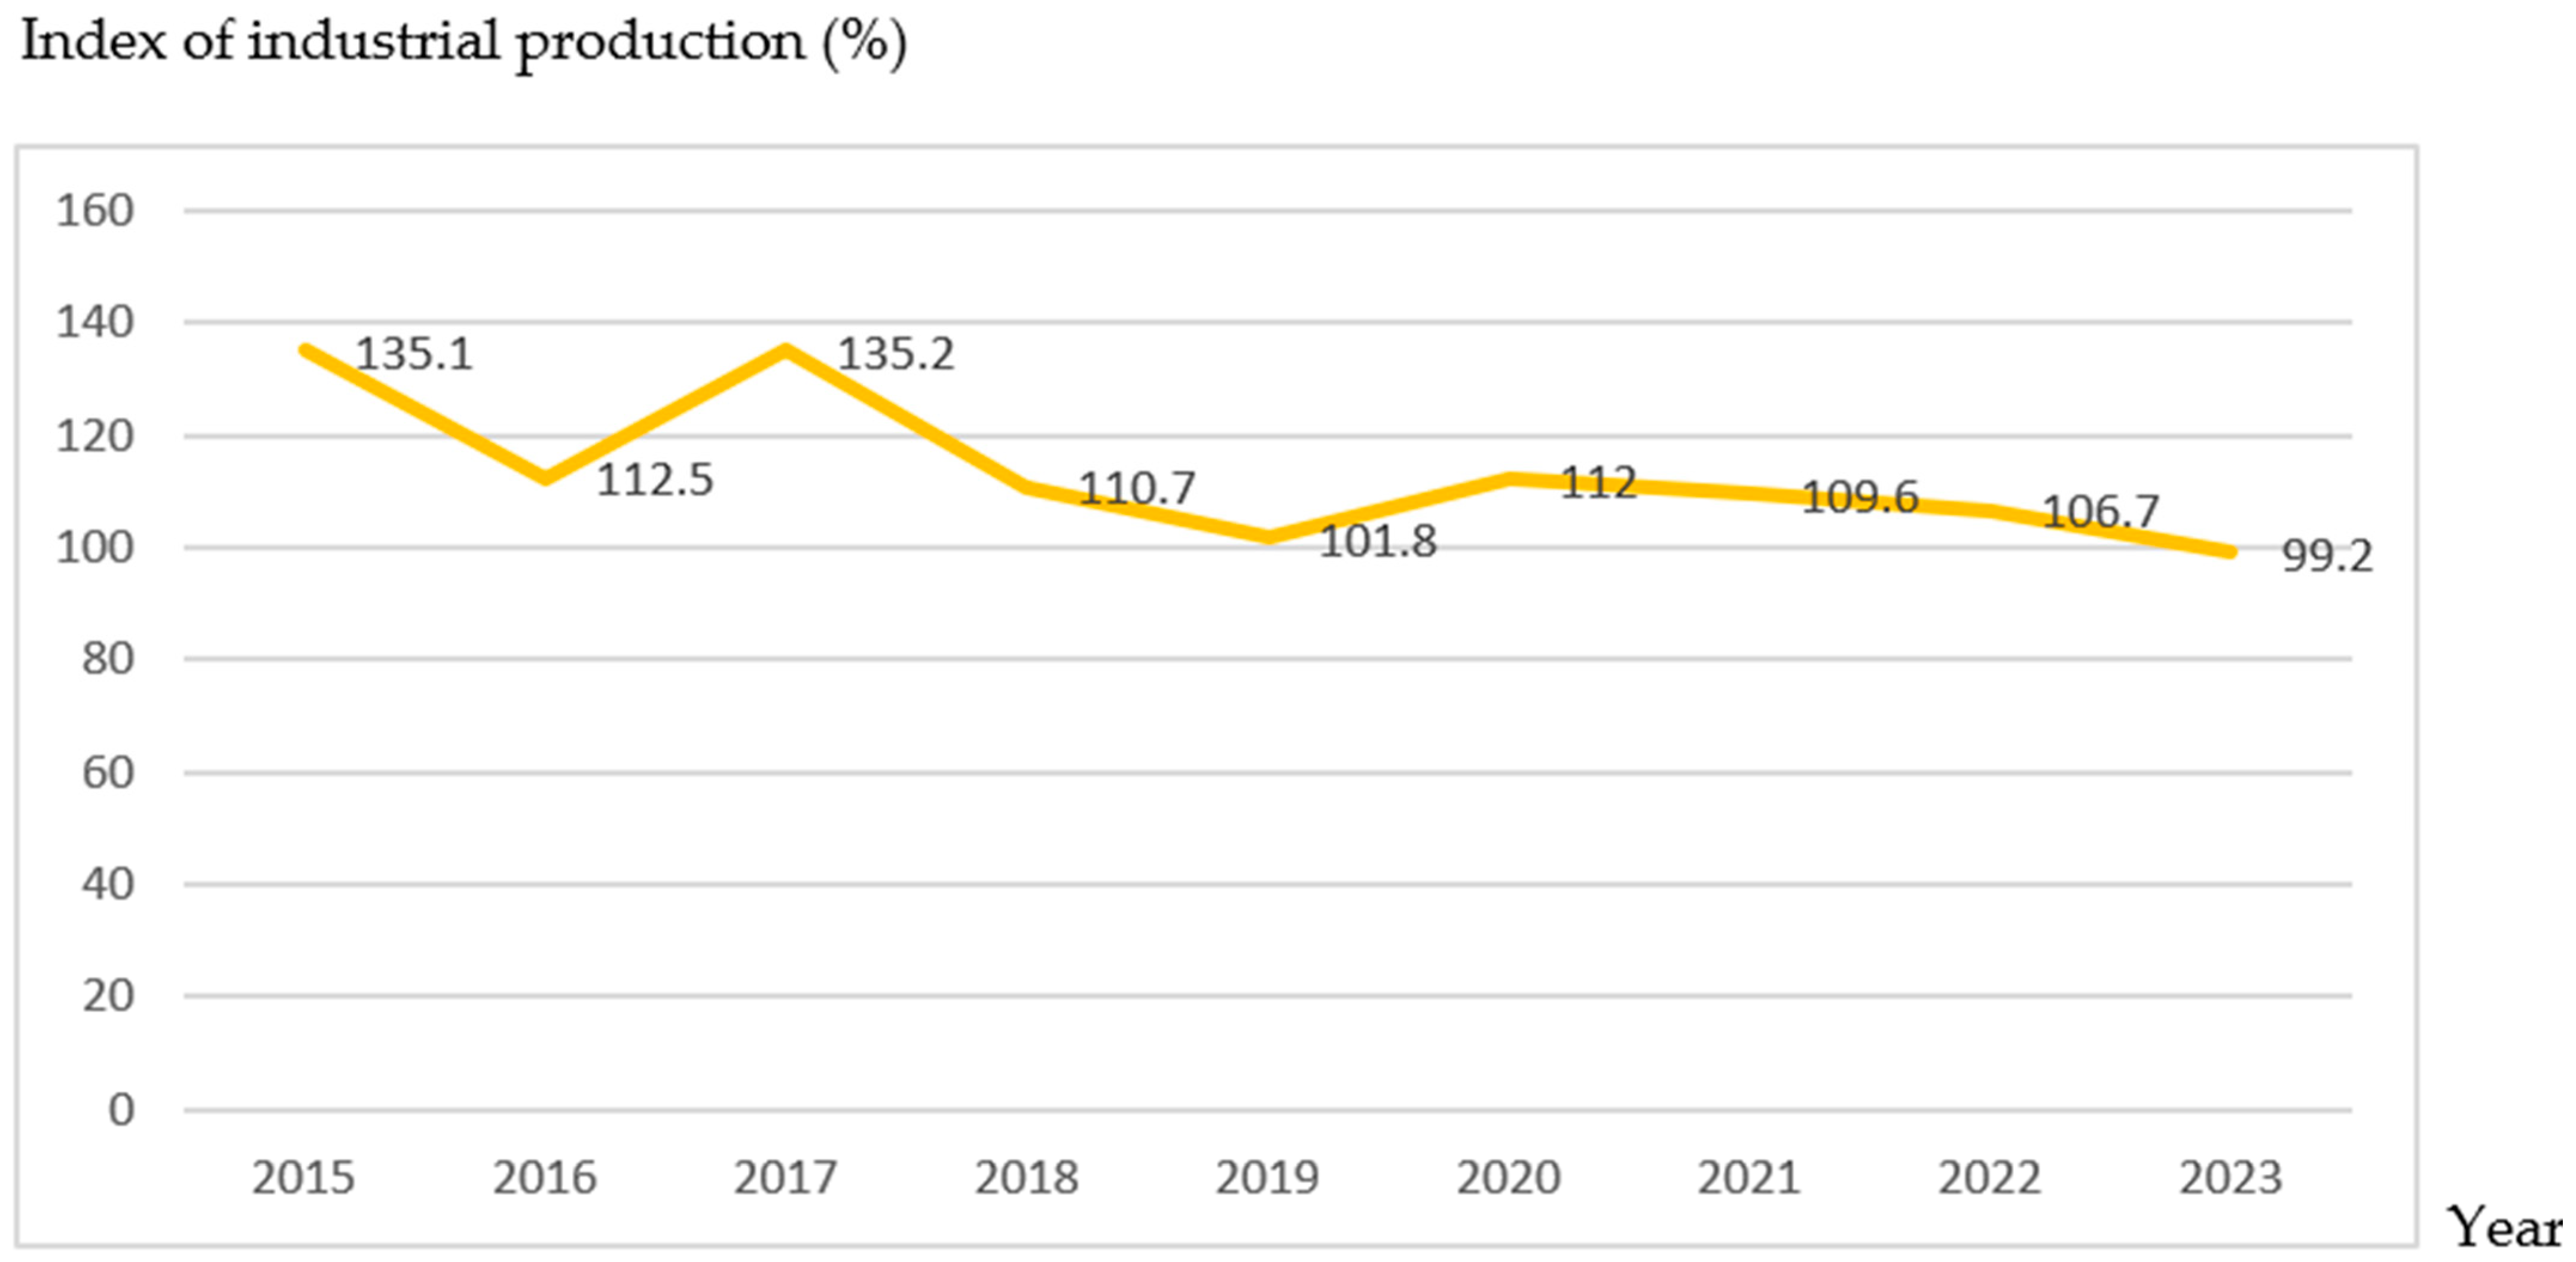
During the period 2016–2023, Vietnam’s electronic manufacturing index of industrial production (IIP) experienced significant fluctuations, with an average annual growth rate of approximately 15.1%—about 2.2 times higher than the overall industrial growth rate of 6.9% in the same period. The electronics industry’s IIP expanded rapidly between 2015 and 2018 but began to decline gradually from 2019 onward. Although it remained relatively high, reaching 99.2% in 2023, the slowdown could be primarily attributed to inflationary pressures, economic downturns, and a sharp decline in global demand for electronic products (Figure 1). In terms of contribution to industrial added value, the electronics added value achieved VND 418.6 trillion in 2022—the highest among all level-two industrial sectors under the national economic classification system—accounting for approximately 13.2% of total industrial added value (Ministry of Industry and Trade, 2024). In summary, these indicators underscore that the electronics industry has become one of Vietnam’s key strategic and high-value manufacturing sectors.
The electronics and electrical appliance sector primarily has depended on foreign technology and investment. The localization rate of the sector was from 5% to 10% in the previous period. Nearly 95% of the export value of the sector came from foreign invested enterprises. The products of electronics mostly belonged to fully imported goods in the domestic market, which means a product was 100% made overseas, whereas there has been a lack of manufactured goods from Vietnamese enterprises. Thus, domestic electronic products still have depended on imported components and FDI enterprises (Ministry of Industry and Trade, 2024). These figures show that Vietnamese electronic enterprises face a lot of challenges of technological innovation in comparison with other developing countries in the same period; simultaneously, the kinds of technology absorption and acquisition primarily have come from importing the means of production. These domestic firms only have assembled foreign sourced components for their operation; in fact, the central technology of enterprises has been mainly the adoption of effective technological processes, as a small number of domestic companies have attempted to change their technology.
The electronics industry in Vietnam continues to experience booming development with further investment from many multinational corporations (MNCs). This industry uses high technology but exploits an abundance of labor, in that the government always encourages it to invest in not only manufacturing, but also research and development (R&D) activities in Vietnam. Meanwhile, the sector’s domestic companies do not seem to have caught up with the industry’s development in the country. Therefore, it is necessary to manage human resources for innovation to keep up with both MNCs and market demands through improving internal and external mechanisms, to explore effective linkages between enterprises and local resources, such as universities, business development services, and business associations. In addition, the government needs to have effective policies to support enterprises to improve human resources, technological capabilities, and innovation (Chi Binh & Linh, 2017).
The economic policies implemented by the Vietnamese government during the period 1986–2017 have had an impact on the development of the Vietnamese electronics industry. Policies aimed at learning through technology spillovers from foreign direct investment led to the specific level of technological development in the Vietnamese electronics industry; problems during its implementation, coupled with institutional failures, brought about unintended consequences (Thi Pham et al., 2020).
Vietnam is an exciting context for studying the firm’s innovation patterns due to its ongoing economic and political transformation. The Vietnamese government has made many efforts to create a favorable business environment and support digital transformation to catch up with the 4IR trends (e.g., Directive 16 on the development of the Industry 4.0 of the Resolution No. 36a/NQ-CP on e-government, issued on 4 May 2017). As a country in the process of industrialization, modernization, and international integration, the 4IR opens up numerous opportunities for Vietnam to upgrade the technological level, create a tremendous change in the form of business service, as well as being a great opportunity for industrial production with advanced science and technology. Vietnamese manufacturing enterprises have transformed a labor-cost-driven model to an innovative-driven model, with new firms setting up while backward incumbent firms exit or restructure to adapt to the emerging competitive market (Santarelli & Tran, 2017). Most recently, on 22 December 2024, the Politburo issued Resolution 57-NQ/TW, focusing on breakthroughs in science and technology development, innovation, and national digital transformation.

4.2. Empirical Findings

The first step the data analysis was descriptive statistics. This step summarizes the characteristics of several key variables. The statistics illustrated the central tendency and variability of firm profitability and financial characteristics in the Vietnamese electronics and electrical appliance industry over the research period.
Table 2 provides the descriptive statistics of the key variables in the empirical analysis. As can be seen from Table 2, the key variables are described by basic statistics such as mean, standard deviation, minimum, and maximum values.
In terms of profitability, the results show that the average return on assets (ROA) is 5.2%, with standard deviation of 8.9%, ranging from −29.8% to 56.2%. Similarly, return on equity (ROE) had a mean of 9.7% and a standard deviation of 14.3%, suggesting notable heterogeneity in firm profitability. Such dispersion was typical in panel data, reflecting structural differences among firms, and necessitates diagnostic tests for potential econometric issues in subsequent regression analyses.
The sampled firms were relatively large and long-standing enterprises, with an average of 34.68 years of operation in the market. Next, average sales were approximately VND 2 trillion, and average total assets were VND 2.37 trillion. This figure shows that most firms in this sector were relatively large-scale enterprises.
Regarding capital structure, the results indicated that for every one unit of equity, firms employed 1.312 units of debt. This highlighted a heavier reliance on debt financing compared to equity, which might expose firms to higher financial risks but could also enhance profitability if borrowing costs are efficiently managed. The total debt-to-equity ratio (DER), comprising both short- and long-term debt, was 0.729. This figure reflects the fact that firms use 0.729 units of debt for every unit of equity. Although debt did not dominate equity financing, the results highlighted a tendency among firms in this industry to rely significantly on external borrowing.
Table 3 presents the correlation coefficients among the main variables in the panel regression model. The dependent variable was profitability (proxied by ROA and ROE), while the independent variables included fixed asset turnover ratio (FAT), technological innovation (INN), total debt-to-equity ratio (DER), capital structure (CAP), and firm size (SIZE). The correlation matrix highlighted the pairwise linear association among the independent variables, providing preliminary evidence regarding potential multi-collinearity issues.
Table 3 reports the pairwise correlations among the main variables in the model. All correlation coefficients were below the threshold of 0.8, in which the highest value observed was between ROE and FAT at 0.504. In addition, the variance inflation factors (VIFs) were consistently below 5. These figures indicate that the variables were weakly correlated and multi-collinearity was not an issue in this research model (Gujarati, 2009).

4.3. Panel Regression Results

After estimating a series of modeling choices, the BPLM test showed a better REM than POLS estimate, the F-test indicated an FEM estimate instead of POLS, and the Hausman test confirmed that the FEM estimate was better than the REM estimate (p-value was smaller than 0.05). Table 4 reports the results of the fixed-effects panel regression model. The findings indicated that five factors significantly affected the profitability of listed firms in the Vietnamese electronics and electrical appliance industry, namely: FAT, DER, SIZE, INN, and COB. However, the effect of the CAP variable on profitability was not significant, so the second hypothesis was rejected. Among these explanatory variables, FAT SIZE, INN, and COB impacted positively on the firm’s profitability, whereas the DER variable had a negative effect.
The explanatory power of the models was relatively strong, with the coefficient of determination (R2) reaching 44.6% for the ROA model and 56.5% for the ROE model. These values indicated that selected explanatory variables accounted for a substantial proportion of the variation in a firm’s profitability.

Diagnostic of Heteroscedasticity and Autocorrelation

Diagnostic tests were conducted to assess the potential econometric issues in the fixed-effects models. The results of the Breusch–Pagan Lagrange Multiplier test (xttest3) and the Wooldridge test for autocorrelation (xtserial) indicated the presence of both heteroscedasticity and autocorrelation in the ROA as well as ROE models, as evidenced by p-values below the 0.05 significance level. However, multi-collinearity was not detected among the independent variables.
To address these econometric issues, the feasible generalized least squares (FGLS) estimator was applied. Specifically, the corr(ar1) syntax was employed to correct for autocorrelation, while the panels(heteroskedastic) specification was used to address heteroscedasticity across panels (Table 5).

4.4. Key Findings and Discussion

The GLS results revealed four factors that significantly influence a firm’s profitability in the Vietnamese electronics and electrical appliance industry: fixed asset turnover, firm size, debt-to-equity ratio, and technological innovation. Notably, the COB gender variable became statistically insignificant in the adjusted model.
After estimating the FGLS model, the effect of financial structure, technological innovation and managerial attributes on corporate profitability could be illustrated as two equations below:
ROA = −0.124 + 0.00000109*FAT − 0.0244*DER + 0.00622*SIZE + 0.0229*INN
ROE = −0.464 + 0.00000224*FAT − 0.0213*DER + 0.0195*SIZE + 0.0476*INN
When fixed asset turnover increased by 1000 units (assumption other factors were constant), ROA rose by 1.09% and ROE by 2.24%, respectively. This highlighted the importance of efficient fixed asset utilization in enhancing profitability. It also was suitable for the earlier findings of Purba and Bimantara (2020) when FAT had a positive association with ROA. In addition, the effect of FAT is represented significantly in the model ROE—this was examined and empirically tested in the previous studies. This is a determinant that has not been mentioned in prior studies about the determinants of profitability. Specifically, the previous literature has only focused on total asset turnover ratio. However, the total asset turnover ratio is often suitable for overall business analysis; firms oriented technologies like electronics and electrical appliances seem to pay more attention to the efficiency of fixed asset usage.
Financial leverage (debt-to-equity ratio): The debt-to-equity ratio negatively impacted on profitability. Specifically, a 1% increase in debt relative to equity reduced ROA and ROE by 2.44% and 2.13%, respectively (assumption that other factors were constant). This finding highlighted the financial risks associated with excessive leverage and cautions firms against overreliance on debt financing. This was in good agreement with Endri et al. (2021) and Q. M. Nguyen and Nguyen (2024); their results suggested that firms should prioritize equity instead of debt to achieve greater financial benefits. Our result aligned with the under the lens of pecking order theory, which revealed that a greater financial leverage reduced a company’s profitability. Therefore, this study also confirmed that a lower DER tended to achieve higher ROE.
Technological innovation: Firms conducted technological innovation which helped higher profitability compared to those that did not, with ROA and ROE being 2.29% and 4.76% higher, respectively. This result confirmed the significant role of innovation in improving operational efficiency and a firm’s competitive advantage.
The analysis did not reveal any significant differences between capital structure and profitability. This might be explained by the descriptive statistics of capital structure, which represented a high standard deviation. As a result, there was considerable heterogeneity among electronic and electrical appliance firms.
In terms of firm characteristics, the empirical estimation highlighted the positive effect of firm size. In particular, firm size was a proxy by the logarithm natural of net sales. Larger firms tended to achieve higher profitability, potentially due to economies of scale, particularly in sales generation and market reach. In contrast, the gender of the president in the administration board had no significant effect on firm profitability under the GLS model, despite being marginally significant in the fixed-effects model. The discrepancy might reflect the stronger control for random shocks under GLS relative to FEM.

Role of Technological Innovation

In both the fixed-effects model and GLS models, technological innovation consistently demonstrated a positive and statistically significant impact on profitability, with a stronger effect observed in the GLS specification. Electronics and electrical appliance firms often require substantial investments in machinery and equipment, which enhance productivity and reduce marginal costs. As output expands, unit costs decline, thereby improving both ROA and ROE. These results provided strong evidence that profitability in this industry was driven primarily by key factors, namely FAT, DER, SIZE, INN and COB.
Using panel data from publicly listed companies in the Vietnamese stock market, this study highlighted the decisive role of technology innovation in enhancing financial performance. Technological innovation can help firms boost productivity, expand export participation, and also take advantage of gov-ernment support. However, the internal capabilities of domestic firms really have been weak. One of the most effective ways is through improving R&D internal capabilities through co-operation with FDI Korean enterprises such as Samsung Electronics Vietnam in both Bac Ninh (SEV) and Thai Nguyen (SEVT), LG Electronics Vietnam Hai Phong, LG Innotek Vietnam Hai Phong or American Electronics Group like Intel Vietnam and Foxconn Technology group. This can help domestic electronic firms better understand new technological progress and new intelligent manufacturing. It can be considered to be an effective shortcut solution for Vietnamese electronic and electrical appliance firms. Nonetheless, these enterprises should carefully prepare internal resources in order to absorb and acquire the development of new global technologies.

5. Conclusions

This study empirically analyzes the determinants of profitability, including both positive and negative influencing factors. Therefore, several managerial implications can be discussed as follows:

5.1. Managerial Implications

(i)
Promotion of new innovation policies: Vietnamese firms should take advantage of various innovation policies, such as access to preferential credit, tax incentives, as well as workforce training programs for technological innovation activities. For instance, funds targeted at innovating firms consist of the national technology innovation fund, Vietnam Venture Capital, conducting tax incentives of personal income tax for scientists and experts. Although managerial decisions are related to the selection of production technologies, they often require considerable investment; firms should prioritize their long-term capital on technologies innovation. In particular, advanced machinery systems, such as those based on automation or high-technology automatic processes have become a worthwhile investment. Conversely, systems that require lower initial capital outlays often involve higher operating costs because lower technologies tend to be less efficient. Therefore, evaluating the trade-off between initial investment and subsequent operating costs is essential to ensure that the chosen technological solution is suitable for corporate finance as well as production objectives. Regarding the long term, those systems could help enterprises save operational costs through enhancing material efficiency, reducing raw material consumption, reducing labor requirements, improving workflow consistency, and decreasing defect rates.
(ii)
Effective asset management: Enterprises need to enhance the efficiency of total asset turnover by improving asset management capacity. This means efficiently liquidating and disposing of idle fixed assets and making rational and effective decisions regarding the procurement of new fixed assets. The adoption of Artificial Intelligence (AI) should be considered as a key driver to boost the fixed asset turnover ratio in the digital transformation context.
(iii)
Optimal capital structure: Each firm must determine its optimal capital structure by appropriately balancing various sources of financing to maximize its profitability. Vietnamese firms also wisely utilize debt and avoid using high financial leverage. This is because the debt-to-equity ratio was found to statistically reduce a firm’s profit.
(iv)
Scaling and growth: Enterprises should consider expanding their scale when investment projects are abundant and capital is required for development. The diversity must be carefully benchmarked against its actual impact on the firm’s targeted capital structure; firms should also avoid over-expansion and consistently review the debt to total asset ratio.
(v)
Other implementation policies: The Vietnamese government needs to not only encourage but also require FDI electronic enterprises to build supporting relationships with other domestic electronic enterprises toward co-innovation and co-development together; In addition, the government also should strengthen the connection between FDI electronic enterprises and domestic electronic enterprises in order to carry out protocol and technology conversion for Vietnamese electronics enterprises toward a sustainable innovation ecosystem.

5.2. Limitations and Further Research Direction

While this study focused only on firm-level factors, macroeconomic factors—such as interest rates, exchange rates, and inflation were excluded due to the research scope. Moreover, the analysis was limited to the electronics and electrical appliance industry, which might constrain the generalization of the findings. Our further research direction may extend the analysis to other industries and incorporate non-financial and macroeconomic variables to obtain a more comprehensive understanding of the determinants of firm profitability in Vietnam.

Author Contributions

Conceptualization, T.D.P.; methodology, D.T.N. and T.D.P.; software, D.T.N.; validation, D.T.N. and T.D.P.; formal analysis, D.T.N.; investigation, T.D.P.; resources, T.D.P.; data curation, D.T.N.; writing—original draft preparation, D.T.N. and T.D.P.; writing—review and editing, D.T.N. and T.D.P. All authors have read and agreed to the published version of the manuscript.

Funding

This research received no external funding.

Institutional Review Board Statement

Not applicable.

Informed Consent Statement

Not applicable.

Data Availability Statement

The data sources we use in this report are primarily from: FiinGroup (2025), Methodology: Classification system for listed companies, available online: https://fiingroup.vn/upload/FiinX/INDUSTRY_CLASSIFICATION_BENCHMARK_vi.pdf, FiinProX_DNNY_Phannganh_09.2024.xlsx, accessed on 15 September 2025, and available online: https://fiintrade.vn/, accessed on 20 September 2025.

Conflicts of Interest

The authors declare no conflict of interest.

References

  1. Aas, T. H., & Pedersen, P. E. (2011). The impact of service innovation on firm-level financial performance. The Service Industries Journal, 31(13), 2071–2090. [Google Scholar] [CrossRef]
  2. Adner, R., & Levinthal, D. (2001). Demand heterogeneity and technology evolution: Implications for product and process innovation. Management Science, 47(5), 611–628. [Google Scholar] [CrossRef]
  3. Amin, H. I. M., & Cek, K. (2023). The effect of golden ratio-based capital structure on firm’s financial performance. Sustainability, 15(9), 7424. [Google Scholar] [CrossRef]
  4. Bessant, J., & Tidd, J. (2019). Innovation and entrepreneurship (4th ed.). John Wiley & Sons. [Google Scholar]
  5. Brigham, E. F., & Houston, J. F. (2009). Fundamentals of financial management (6th ed.). South Western Cengage Learning. [Google Scholar]
  6. Chi Binh, T. T., & Linh, N. M. (2017). Human resource management for innovation in Vietnam’s electronics industry. Asian Journal of Technology Innovation, 25(2), 345–366. [Google Scholar] [CrossRef]
  7. Cortés, L. M., Lozada, J. M., & Perote, J. (2021). Firm size and economic concentration: An analysis from a lognormal expansion. PLoS ONE, 16(7), e0254487. [Google Scholar] [CrossRef] [PubMed]
  8. Cortés, L. M., Mora-Valencia, A., & Perote, J. (2017). Measuring firm size distribution with semi-nonparametric densities. Physica A: Statistical Mechanics and Its Applications, 485, 35–47. [Google Scholar] [CrossRef]
  9. Dalci, I. (2018). Impact of financial leverage on profitability of listed manufacturing firms in China. Pacific Accounting Review, 30(4), 410–432. [Google Scholar] [CrossRef]
  10. Endri, E., Ridho, A. M., Marlapa, E., & Susanto, H. (2021). Capital structure and profitability: Evidence from mining companies in Indonesia. Montenegrin Journal of Economics, 17(4), 135–146. [Google Scholar] [CrossRef]
  11. FiinGroup. (2025). Methodology: Classification system for listed companies. FiinGroup. [Google Scholar]
  12. Ghardallou, W. (2022). Capital structure decisions and corporate performance: Does firm’s profitability matter? Journal of Scientific & Industrial Research, 81(08), 859–865. [Google Scholar] [CrossRef]
  13. Gujarati, D. N. (2009). Basic econometrics. McGraw-Hill. [Google Scholar]
  14. Herciu, M., & Ogrean, C. (2017). Does capital structure influence company profitability? Studies in Business and Economics, 12(3), 50–62. [Google Scholar] [CrossRef]
  15. Jamai, K., De Steur, H., Abidar, A., & Gellynck, X. (2021). The impact of innovation type on financial and non-financial performance of SMES. A scoping review. Journal of Innovation Management, 9(3), 27–57. [Google Scholar] [CrossRef]
  16. Jati, D., Setiawan, H., Purnomo, S. D., Muntahanah, S., Zuhaena, F., & Arinastuti, A. (2023). Determinants of profitability: Evidence from construction companies listed on indonesian securities market. JAMPE (Journal of Asset Management and Public Economy), 2(2), 108–118. [Google Scholar] [CrossRef]
  17. Lawless, M. W., & Anderson, P. C. (1996). Generational technological change: Effects of innovation and local rivalry on performance. Academy of Management Journal, 39(5), 1185–1217. [Google Scholar] [CrossRef]
  18. Li, J. (2024). Factors influencing financial performance of healthcare listed companies in China during COVID-19 pandemic. Rangsit University Library. [Google Scholar]
  19. Luh, P. K., & Kusi, B. A. (2023). How do females in top executive positions influence firm profitability: New insight from non financial firms on Ghana Stock Exchange. Gender in Management: An International Journal, 38(4), 525–544. [Google Scholar] [CrossRef]
  20. Mahor, N., & Banerji, A. (2024). Profitability analysis of indian readymade garment industry: Profitability analysis of indian readymade garment industry. Journal of Scientific & Industrial Research (JSIR), 83(8), 888–896. [Google Scholar]
  21. Mai, A. N., Van Vu, H., Bui, B. X., & Tran, T. Q. (2019). The lasting effects of innovation on firm profitability: Panel evidence from a transitional economy. Economic Research-Ekonomska Istraživanja, 32(1), 3411–3430. [Google Scholar] [CrossRef]
  22. Ministry of Industry and Trade. (2024). Công nghiệp hỗ trợ ngành điện tử của Việt Nam trong chuỗi cung ứng toàn cầu. NXB Công Thương.
  23. Modigliani, F., & Miller, M. H. (1958). The cost of capital, corporation finance and the theory of investment. The American Economic Review, 48(3), 261–297. [Google Scholar]
  24. Myers, S. C. (1984). Capital structure puzzle. National Bureau of Economic Research Cambridge. [Google Scholar]
  25. Nguyen, Q. M., & Nguyen, C. V. (2024). State ownership, board characteristics and corporate financial performance in publicy listed firms in Vietnam. Cogent Social Sciences, 10(1), 2301811. [Google Scholar] [CrossRef]
  26. Nguyen, V. C., & Huynh, T. N. T. (2023). Characteristics of the board of directors and corporate financial performance—Empirical evidence. Economies, 11(2), 53. [Google Scholar] [CrossRef]
  27. OECD. (2005). Oslo manual: Guidelines for collecting and interpreting innovation data. Organisation for Economic Cooperation & Development. [Google Scholar]
  28. OECD. (2009). Innovation in firms: A microeconomic perspective. OECD Publishing. [Google Scholar]
  29. Onita, F. B., & Ochulor, O. J. (2024). Technological innovations in reservoir surveillance: A theoretical review of their impact on business profitability. International Journal of Applied Research in Social Sciences, 6(8), 1784–1796. [Google Scholar] [CrossRef]
  30. Pascoal, R., Augusto, M., & Monteiro, A. M. (2016). Size distribution of Portuguese firms between 2006 and 2012. Physica A: Statistical Mechanics and Its Applications, 458, 342–355. [Google Scholar] [CrossRef]
  31. Purba, J. H. V., & Bimantara, D. (2020, October 23–24). The influence of asset management on financial performance, with panel data analysis. 2nd International Seminar on Business, Economics, Social Science and Technology (ISBEST 2019), Tangerang Selatan, Indonesia. [Google Scholar]
  32. Qureshi, K. M., Mewada, B. G., Kaur, S., Alghamdi, S. Y., Almakayeel, N., Almuflih, A. S., & Qureshi, M. R. N. M. (2023). Sustainable manufacturing supply chain performance enhancement through technology utilization and process innovation in industry 4.0: A SEM-PLS approach. Sustainability, 15(21), 15388. [Google Scholar] [CrossRef]
  33. Sagar, A. D., & Van der Zwaan, B. (2006). Technological innovation in the energy sector: R&D, deployment, and learning-by-doing. Energy Policy, 34(17), 2601–2608. [Google Scholar] [CrossRef]
  34. Samo, A. H., & Murad, H. (2019). Impact of liquidity and financial leverage on firm’s profitability—An empirical analysis of the textile industry of Pakistan. Research Journal of Textile and Apparel, 23(4), 291–305. [Google Scholar] [CrossRef]
  35. Santarelli, E., & Tran, H. T. (2017). Young innovative companies: Are they high performers in transition economies? Evidence for Vietnam. The Journal of Technology Transfer, 42(5), 1052–1076. [Google Scholar] [CrossRef]
  36. Schumpeter, J. A., & Swedberg, R. (2021). The theory of economic development. Routledge. [Google Scholar]
  37. Sunjoko, M. I., & Arilyn, E. J. (2016). Effects of inventory turnover, total asset turnover, fixed asset turnover, current ratio and average collection period on profitability. Jurnal Bisnis dan Akuntansi, 18(1), 79–83. [Google Scholar]
  38. Thi Pham, H. S., Nguyen, A. N., & Johnston, A. (2020). Economic policies and technological development of Vietnam’s electronics industry. Journal of the Asia Pacific Economy, 27, 248–269. [Google Scholar] [CrossRef]
  39. Van Horne, J. C., & Wachowicz, J. M. (2005). Fundamentals of financial management. Pearson Education. [Google Scholar]
  40. Walker, R. M. (2005). Innovation and organizational performance: A critical review of the evidence and a research agenda. Academy of Management Proceedings, 2005(1), B1–B6. [Google Scholar] [CrossRef]
  41. Wang, Y. Z., & Ahmad, S. (2024). Green process innovation, green product innovation, leverage, and corporate financial performance; evidence from system GMM. Heliyon, 10(4), e25819. [Google Scholar] [CrossRef]
Figure 1. The electronics’ index of industrial production. Source: the project on mechanisms to promote cooperative production linkages within industrial clusters.
Economies 14 00085 g001
Table 1. Summary meaning and measure of key variables. Source: author’s proposition.
Main VariablesMeaningCalculationExpectationReferences
Dependent variables (Profitability)
ROAReturn on assetsProfit after tax divide total assets (Dalci, 2018)
ROEReturn on equityProfit after tax divide shareholder’s equity
Independent variable
FATFixed asset
turnover ratio
Net sales/average fixed assets+(Sunjoko & Arilyn, 2016) (Purba & Bimantara, 2020)
INNTechnological
innovation
If product innovation or process innovation = 1, if not = 0+(OECD, 2009)
DERFinancial
leverage
Short-term debt-to-equity ratio + long-term debt-to-equity ratio(Samo & Murad, 2019)
Trade-off
theory
CAPCapital structureLiabilities/equity(Herciu & Ogrean, 2017; Ghardallou, 2022)
Control variables
SizeFirm sizeLn (net sales)+(Luh & Kusi, 2023)
Trade-off
theory
COBGender of chairman of the boardMale = 1
Female = 0
+
Table 2. Descriptive statistics of the main variables. Source: Data analysis from Stata 15.
VariableMeaningObsMeanStd. Dev.MinMax
ROAReturn on assets2160.0520.089−0.2980.562
ROEReturn on equity2160.0970.143−0.5591.163
OpeFirm foundation21934.6815.752364
SalesTotal net sales2172.024 × 10125.336 × 101203.406 × 1013
AssetsTotal assets2162.386 × 10128.250 × 10121.640 × 10106.119 × 1013
FATFixed asset
Turnover ratio
216249.6123026.277044,346.831
CAPCapital structure2161.3121.8150.00413.839
DERFinancial
leverage
2160.7291.12108.255
Table 3. Correlation matrix and VIF in the research model. Source: Data analysis from Stata 15.
Variables(1)(2)(3)(4)(5)(6)(7)(8)
(1) ROA1.000
(2) ROE 1.000
(3) FAT0.392 ***0.504 ***1.000
(4) CAP−0.178 ***−0.027−0.0371.000
(5) DER−0.168 **−0.016−0.039 1.000
(6) SIZE0.163 **0.351 ***0.0510.357 ***0.415 ***1.000
(7) INN0.418 ***0.425 ***0.071−0.105−0.0920.199 ***1.000
(8) COB0.132 *0.129 *0.0220.1090.148 **0.242 ***0.0781.000
VIF 1.013.704.051.501.131.07
*** p < 0.01, ** p < 0.05, * p < 0.1.
Table 4. Results of the fixed-effects regression model. Source: Data analysis from Stata 15.
(1)(2)
VariablesMeaningROA_fe1ROE_fe2
FATFixed Asset Turnover Ratio 7.85 × 10⁻⁶ ***1.98 × 10⁻⁵ ***
(1.71 × 10⁻⁶)(2.71 × 10⁻⁶)
DERFinancial Leverage −0.0309 ***−0.0587 ***
(0.00969)(0.0154)
SIZEFirm Size0.0234 ***0.0295 ***
(0.00692)(0.0110)
INNTechnological Innovation 0.0282 ***0.0569 ***
(0.00966)(0.0154)
COBGender of Chairman of the Board 0.0574 *0.134 **
(0.0339)(0.0539)
Constant −0.622 ***−0.812 ***
(0.184)(0.292)
Observations 181181
R-squared 0.4460.565
Number of id 2323
Standard errors in parentheses. *** p < 0.01, ** p < 0.05, * p < 0.1.
Table 5. FGLS estimation results correcting for heteroscedasticity and autocorrelation. Source: Data analysis from Stata 15.
(1)(2)Hypothesis
VariablesMeaningROA_glsROE_glsTesting
FATFixed Asset Turnover Ratio1.09 × 10−5 ***2.24 × 10⁻⁵ ***Supported
(8.24 × 10⁻⁷)(1.87 × 10⁻⁶)
DERFinancial Leverage−0.0244 ***−0.0213 **Supported
(0.00424)(0.00871)
SIZEFirm Size0.00622 ***0.0195 ***Supported
(0.00205)(0.00389)
INNTechnological Innovation0.0229 ***0.0476 ***Supported
(0.00489)(0.00872)
COBGender of Chairman of the Board0.01020.0216Rejected
(0.0136)(0.0218)
Constant −0.124 **−0.464 ***
(0.0531)(0.0995)
Observations 181181
Number of id 2323
Standard errors in parentheses. *** p < 0.01, ** p < 0.05.
Disclaimer/Publisher’s Note: The statements, opinions and data contained in all publications are solely those of the individual author(s) and contributor(s) and not of MDPI and/or the editor(s). MDPI and/or the editor(s) disclaim responsibility for any injury to people or property resulting from any ideas, methods, instructions or products referred to in the content.