Human Capital and Labor Supply Decisions in Immigrant Families: An Alternative Test of the Family Investment Hypothesis
Abstract
1. Introduction
2. Literature Review
2.1. Immigration and Human Capital
2.2. The Optimal Human Capital Investment Within Immigrant Families and Expected Labor Market Outcomes of Husbands and Wives
3. Methodology
3.1. The Difference in Differences Approach
3.2. Identification Issues
4. Data and Analysis
4.1. Descriptive Statistics
4.2. Analysis
5. Results
5.1. General Results
5.2. Labor Supply (Work Hours) Results
5.3. Wage Results
5.4. Robustness Checks
6. Discussion: Integration with the Literature
7. Conclusions
Author Contributions
Funding
Institutional Review Board Statement
Informed Consent Statement
Data Availability Statement
Conflicts of Interest
Appendix A
| Females | Males | |
|---|---|---|
| All | 13.63 | 13.50 |
| (3.15) | (3.15) | |
| Arrived single | 13.36 | 13.37 |
| (3.68) | (3.43) | |
| Arrived single and remained single | 13.08 | 13.00 |
| (3.90) | (3.49) |

| 1 | On the contrary, rejection of the FIH does not necessarily imply that the local credit market for investment in human capital is efficient, since a rejection might imply that the decision making of the spouses is not cooperative. |
| 2 | Although this paper did not distinguish between married and single women, it seems that the data did not reveal any tendency of women to accept “dead-end jobs”, as the FIH predicts. |
| 3 | For notational simplicity we omit in this section the individual index i and the time index t. |
| 4 | Identical estimators were constructed for females. |
| 5 | The patterns were reversed if the wife was the primary earner. |
| 6 | Jacquemet and Robin (2013) also used wage regression’s residuals to assess assortative matching in the U.S. |
| 7 | The matched data from the LFS and IS for 1994 was not made available to us. |
| 8 | We excluded non-Jewish native Israelis, since their labor market characteristics differed substantially from those of Jewish native Israelis. |
| 9 | Each outlier observation was checked in order to assess its validity and include it or exclude it from our data accordingly. For example, for individuals with reported 20 years of education, we checked if their profession and age could contradict the reported education. |
| 10 | Married immigrants were older than married natives, in part due to our restriction which excluded married immigrants who got married after more than one year since their arrival in Israel. |
| 11 | In previous specifications, we used separate cohort dummies for each year of immigration (1989–2004), but the dummies for the years 1992–2004 were not statistically significant; so, we pooled them together. Hence, the pooled dummy for 1992–2004 was the reference group. |
| 12 | Duleep and Sanders (1994) found that when one does not control for previous employment, there existed large differences in the apparent effects of children on married women’s labor supply between American-born white women and three ethnically distinct groups of newly arrived immigrants to the United States. Since we did not have panel/retrospective data, we used various indicators for children and allowed their impact to vary between natives and immigrants. |
| 13 | In order to follow the previous literature on the FIH, we estimated one equation on the pooled sample of all four types of individuals: married immigrants, married natives, single immigrants, and single natives (separately for males and females). |
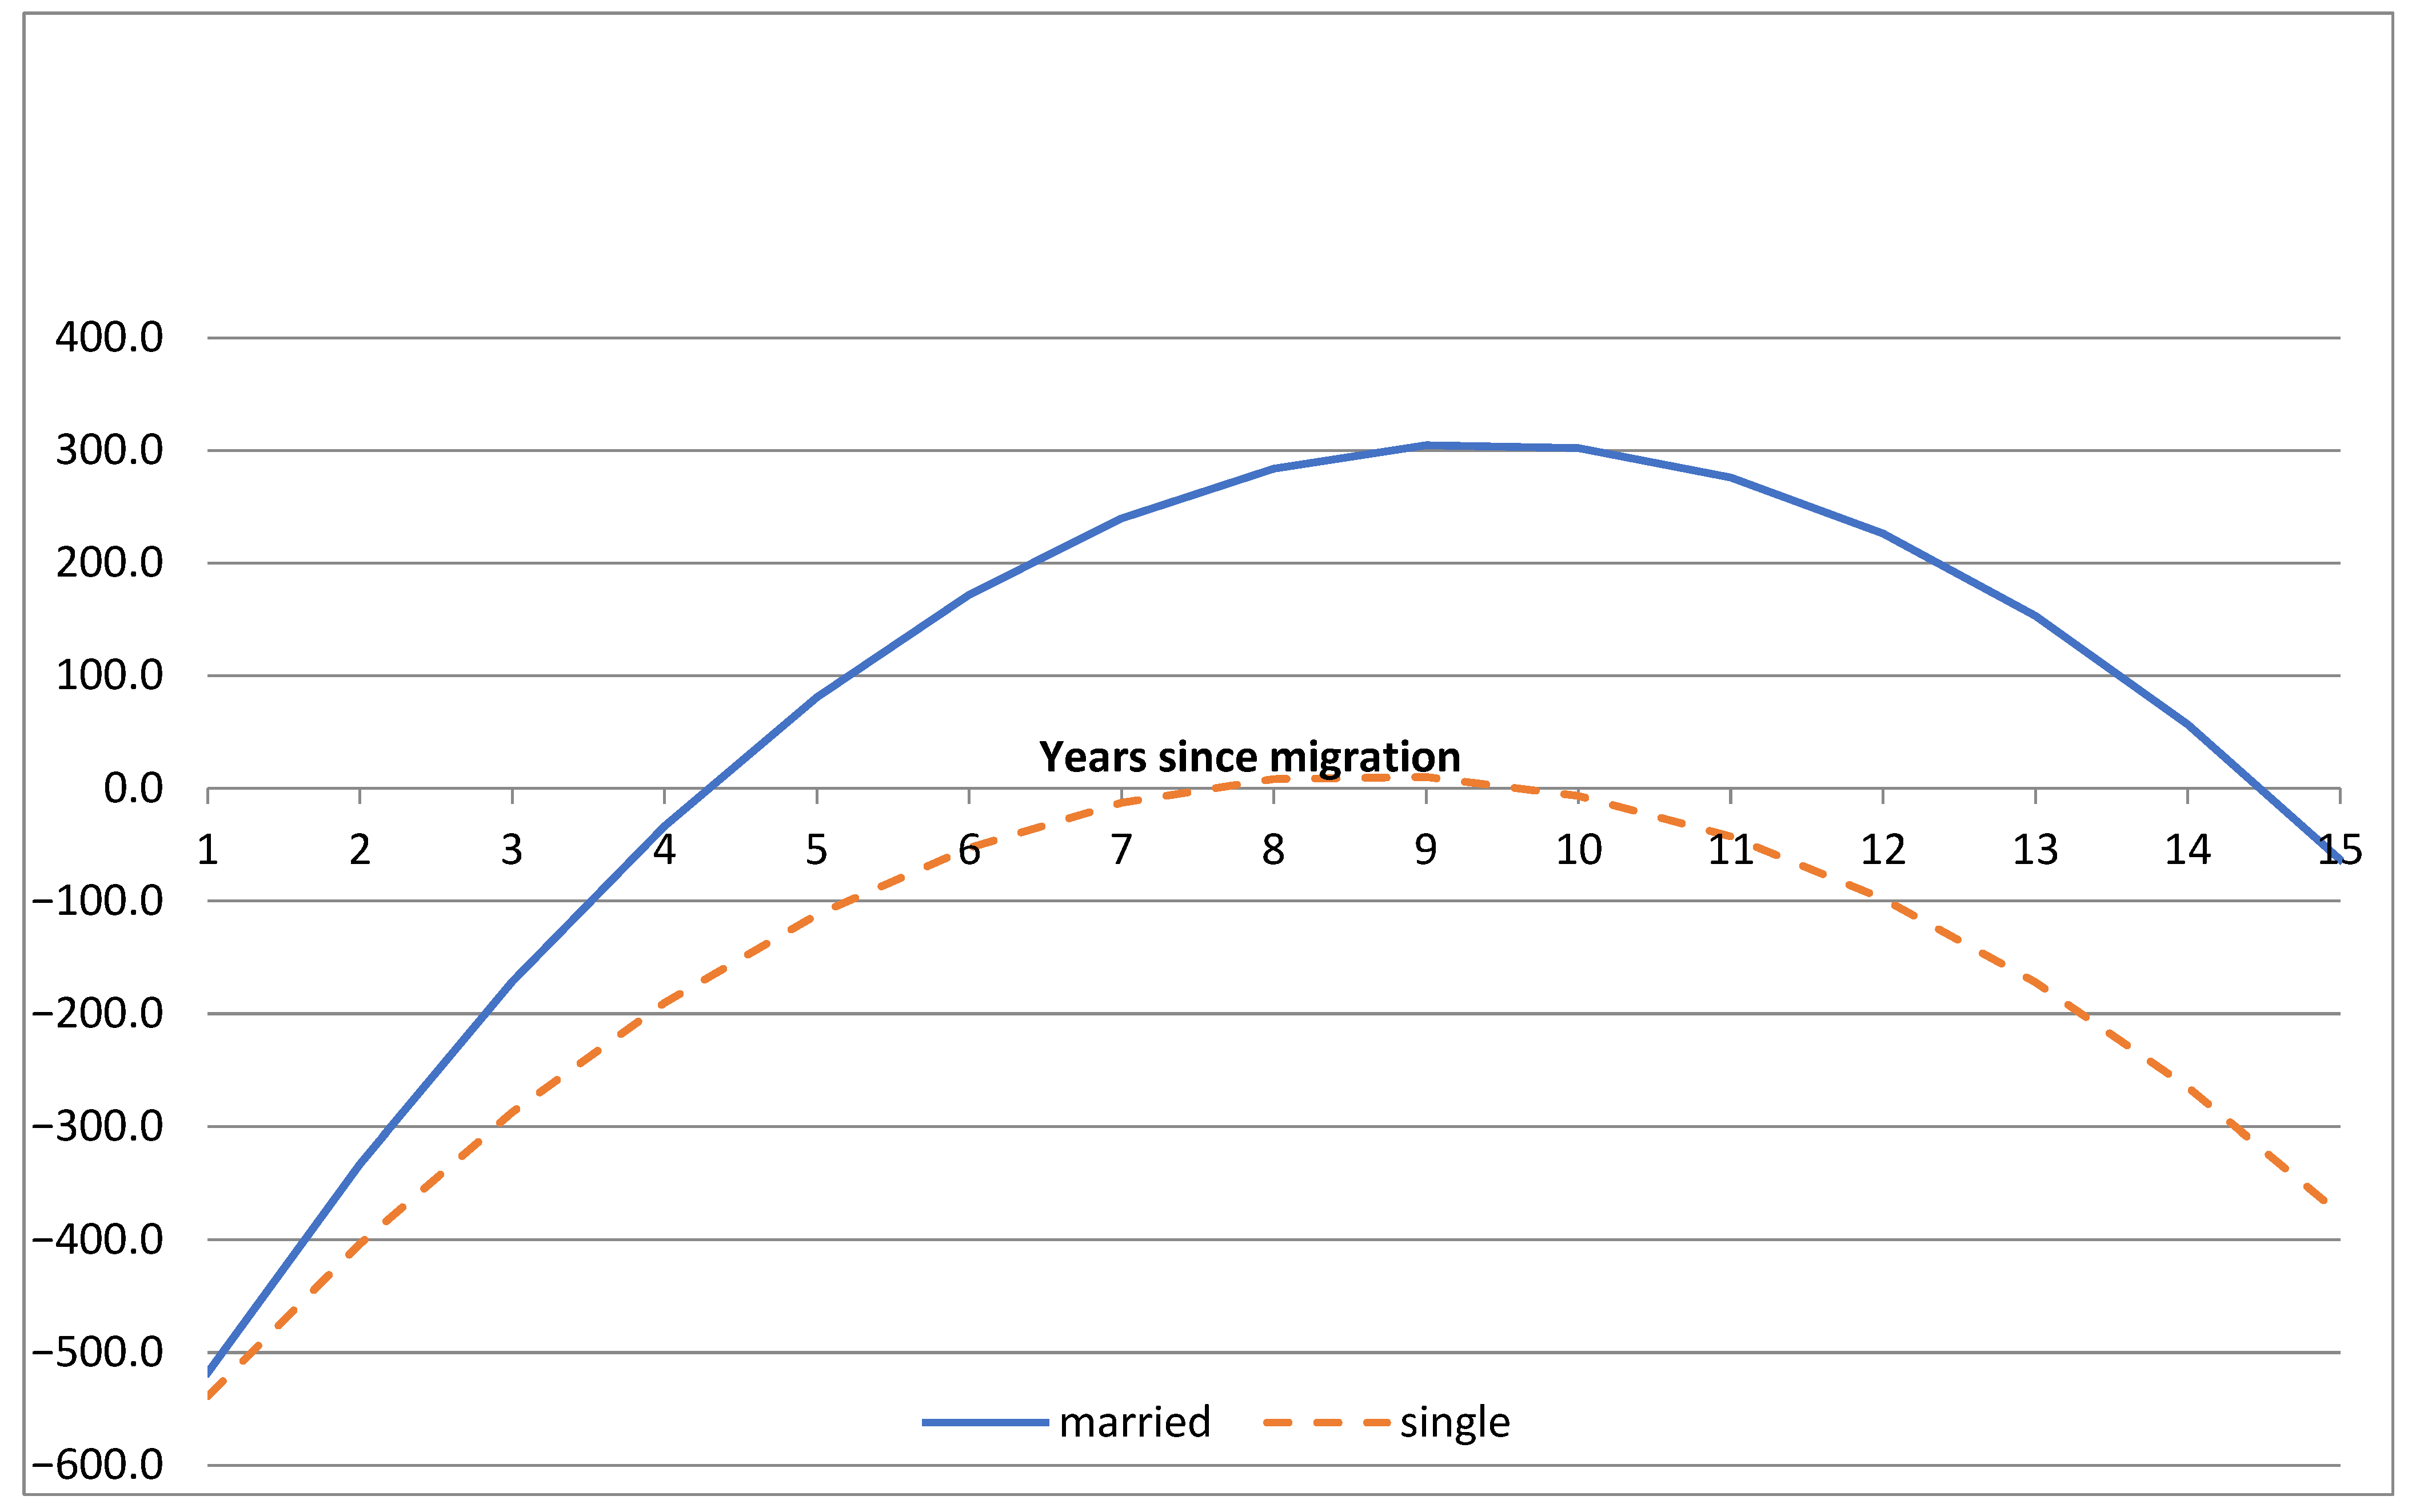
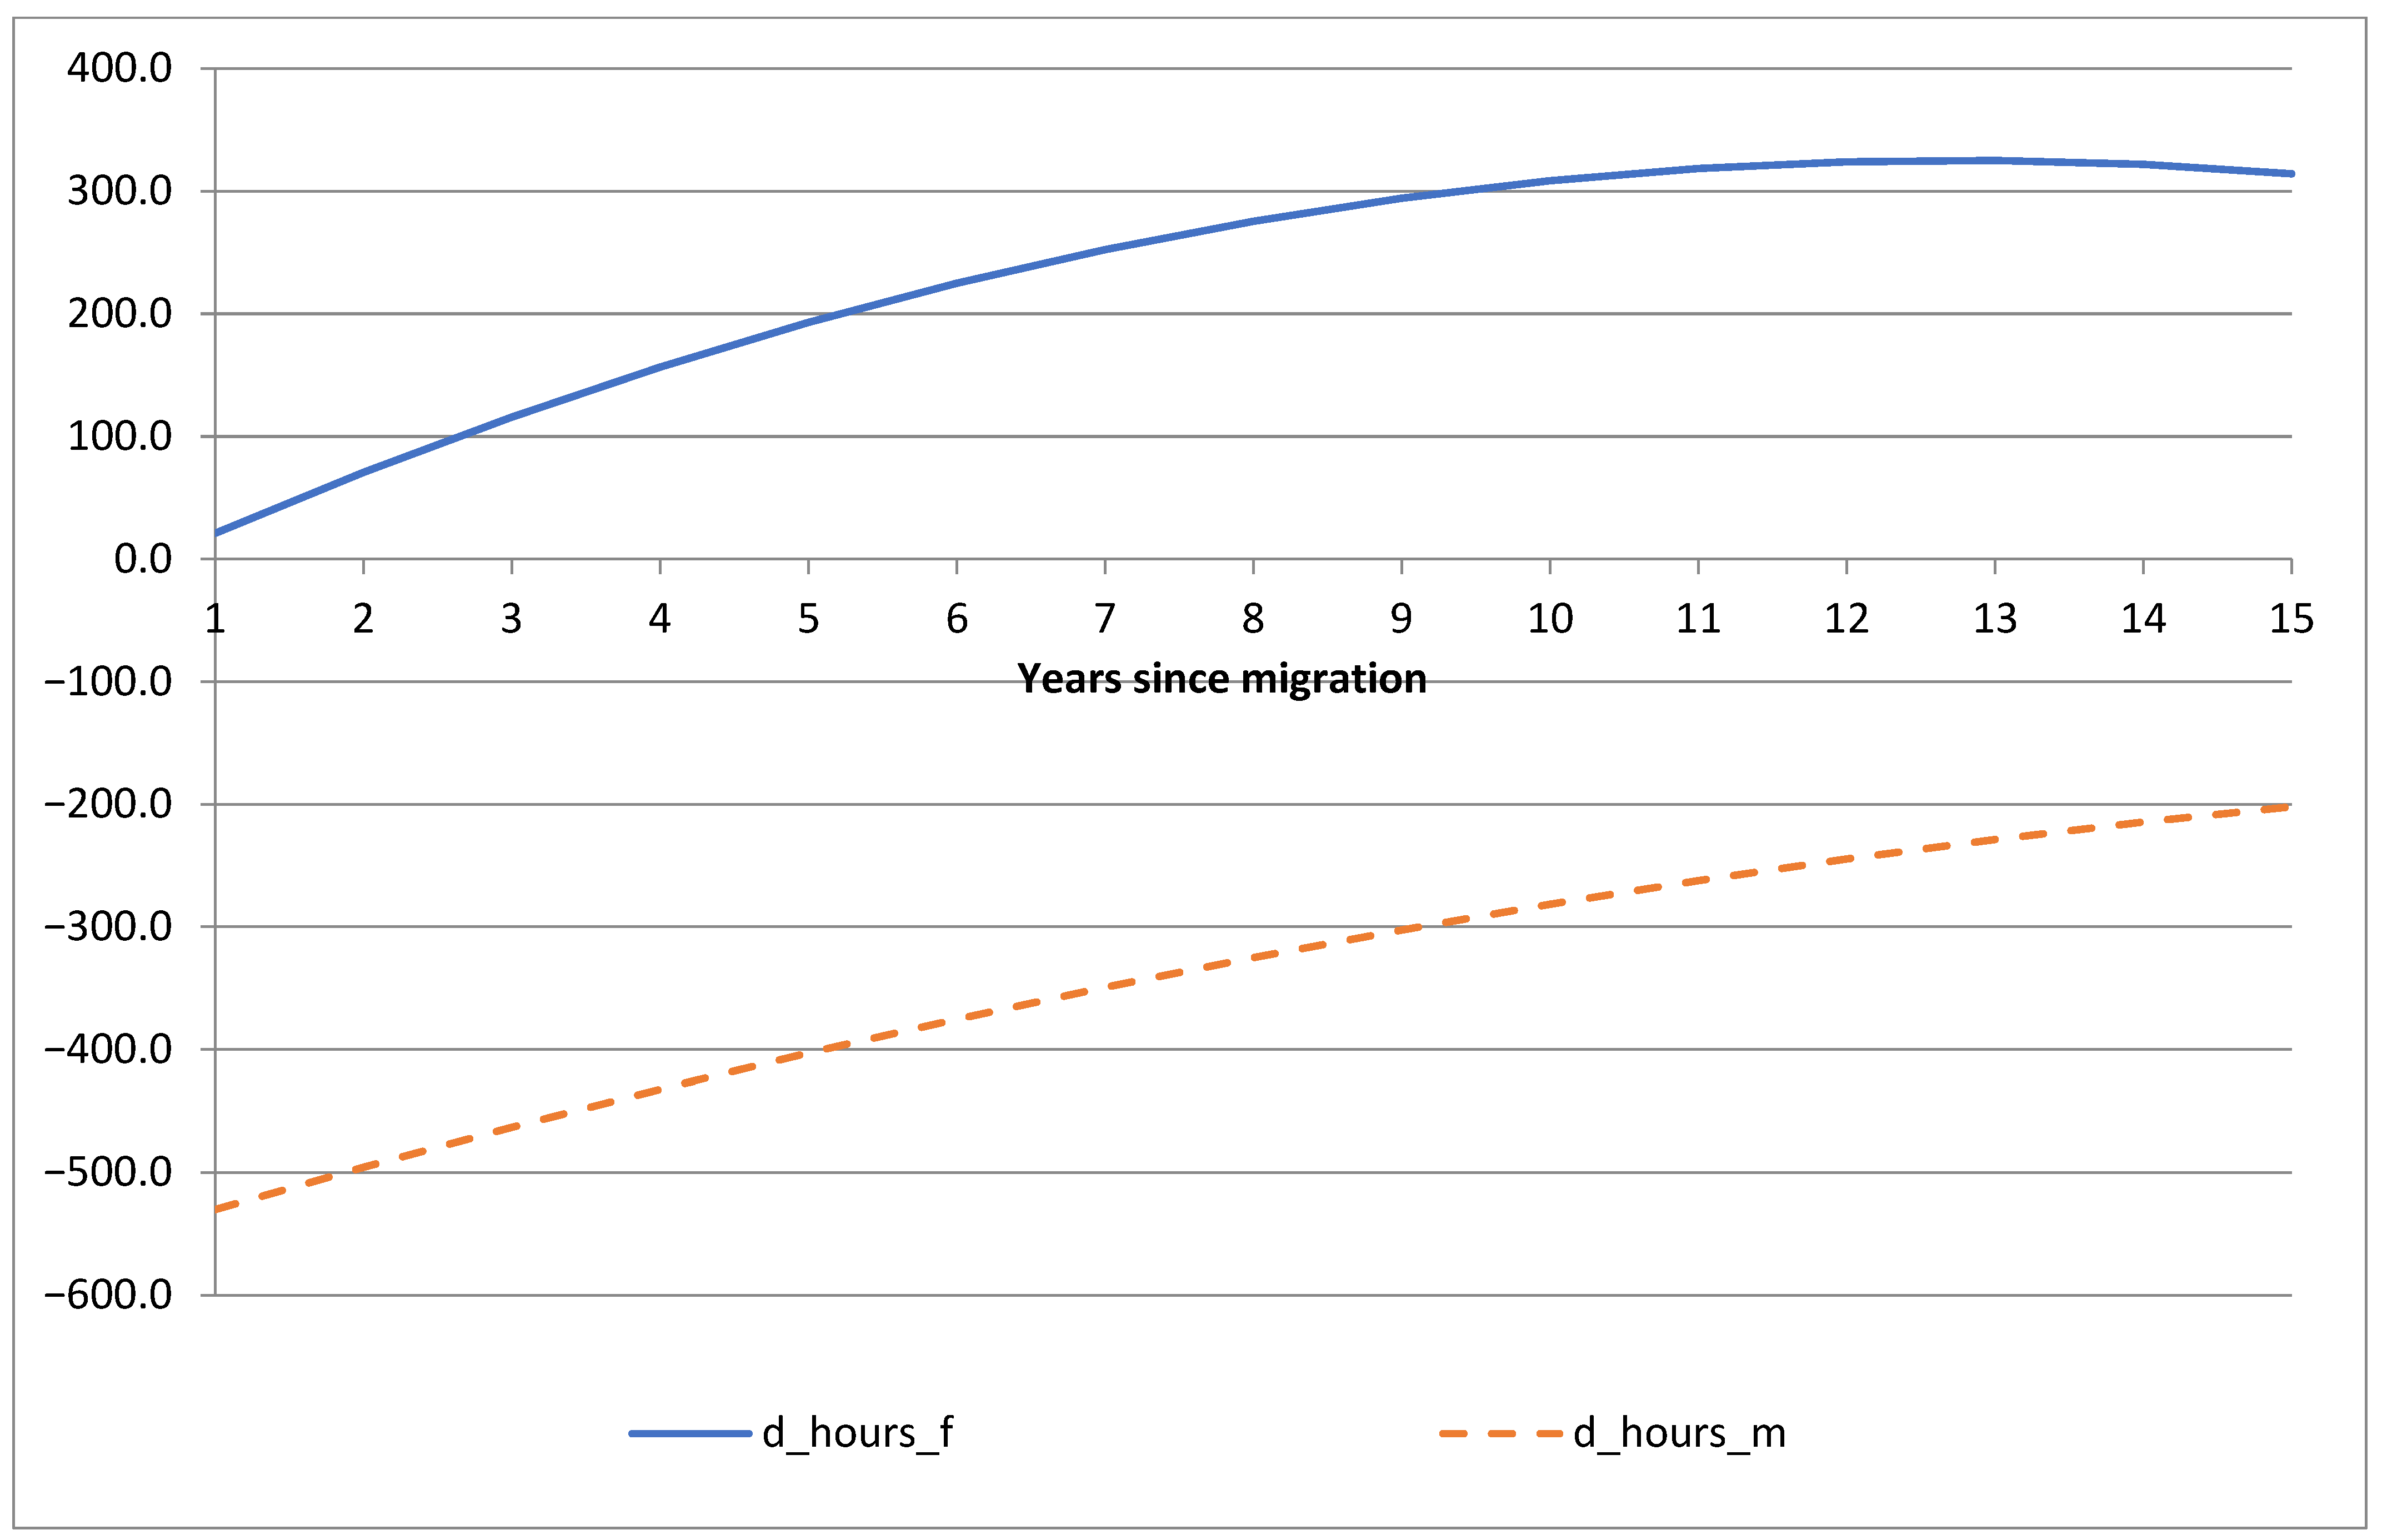
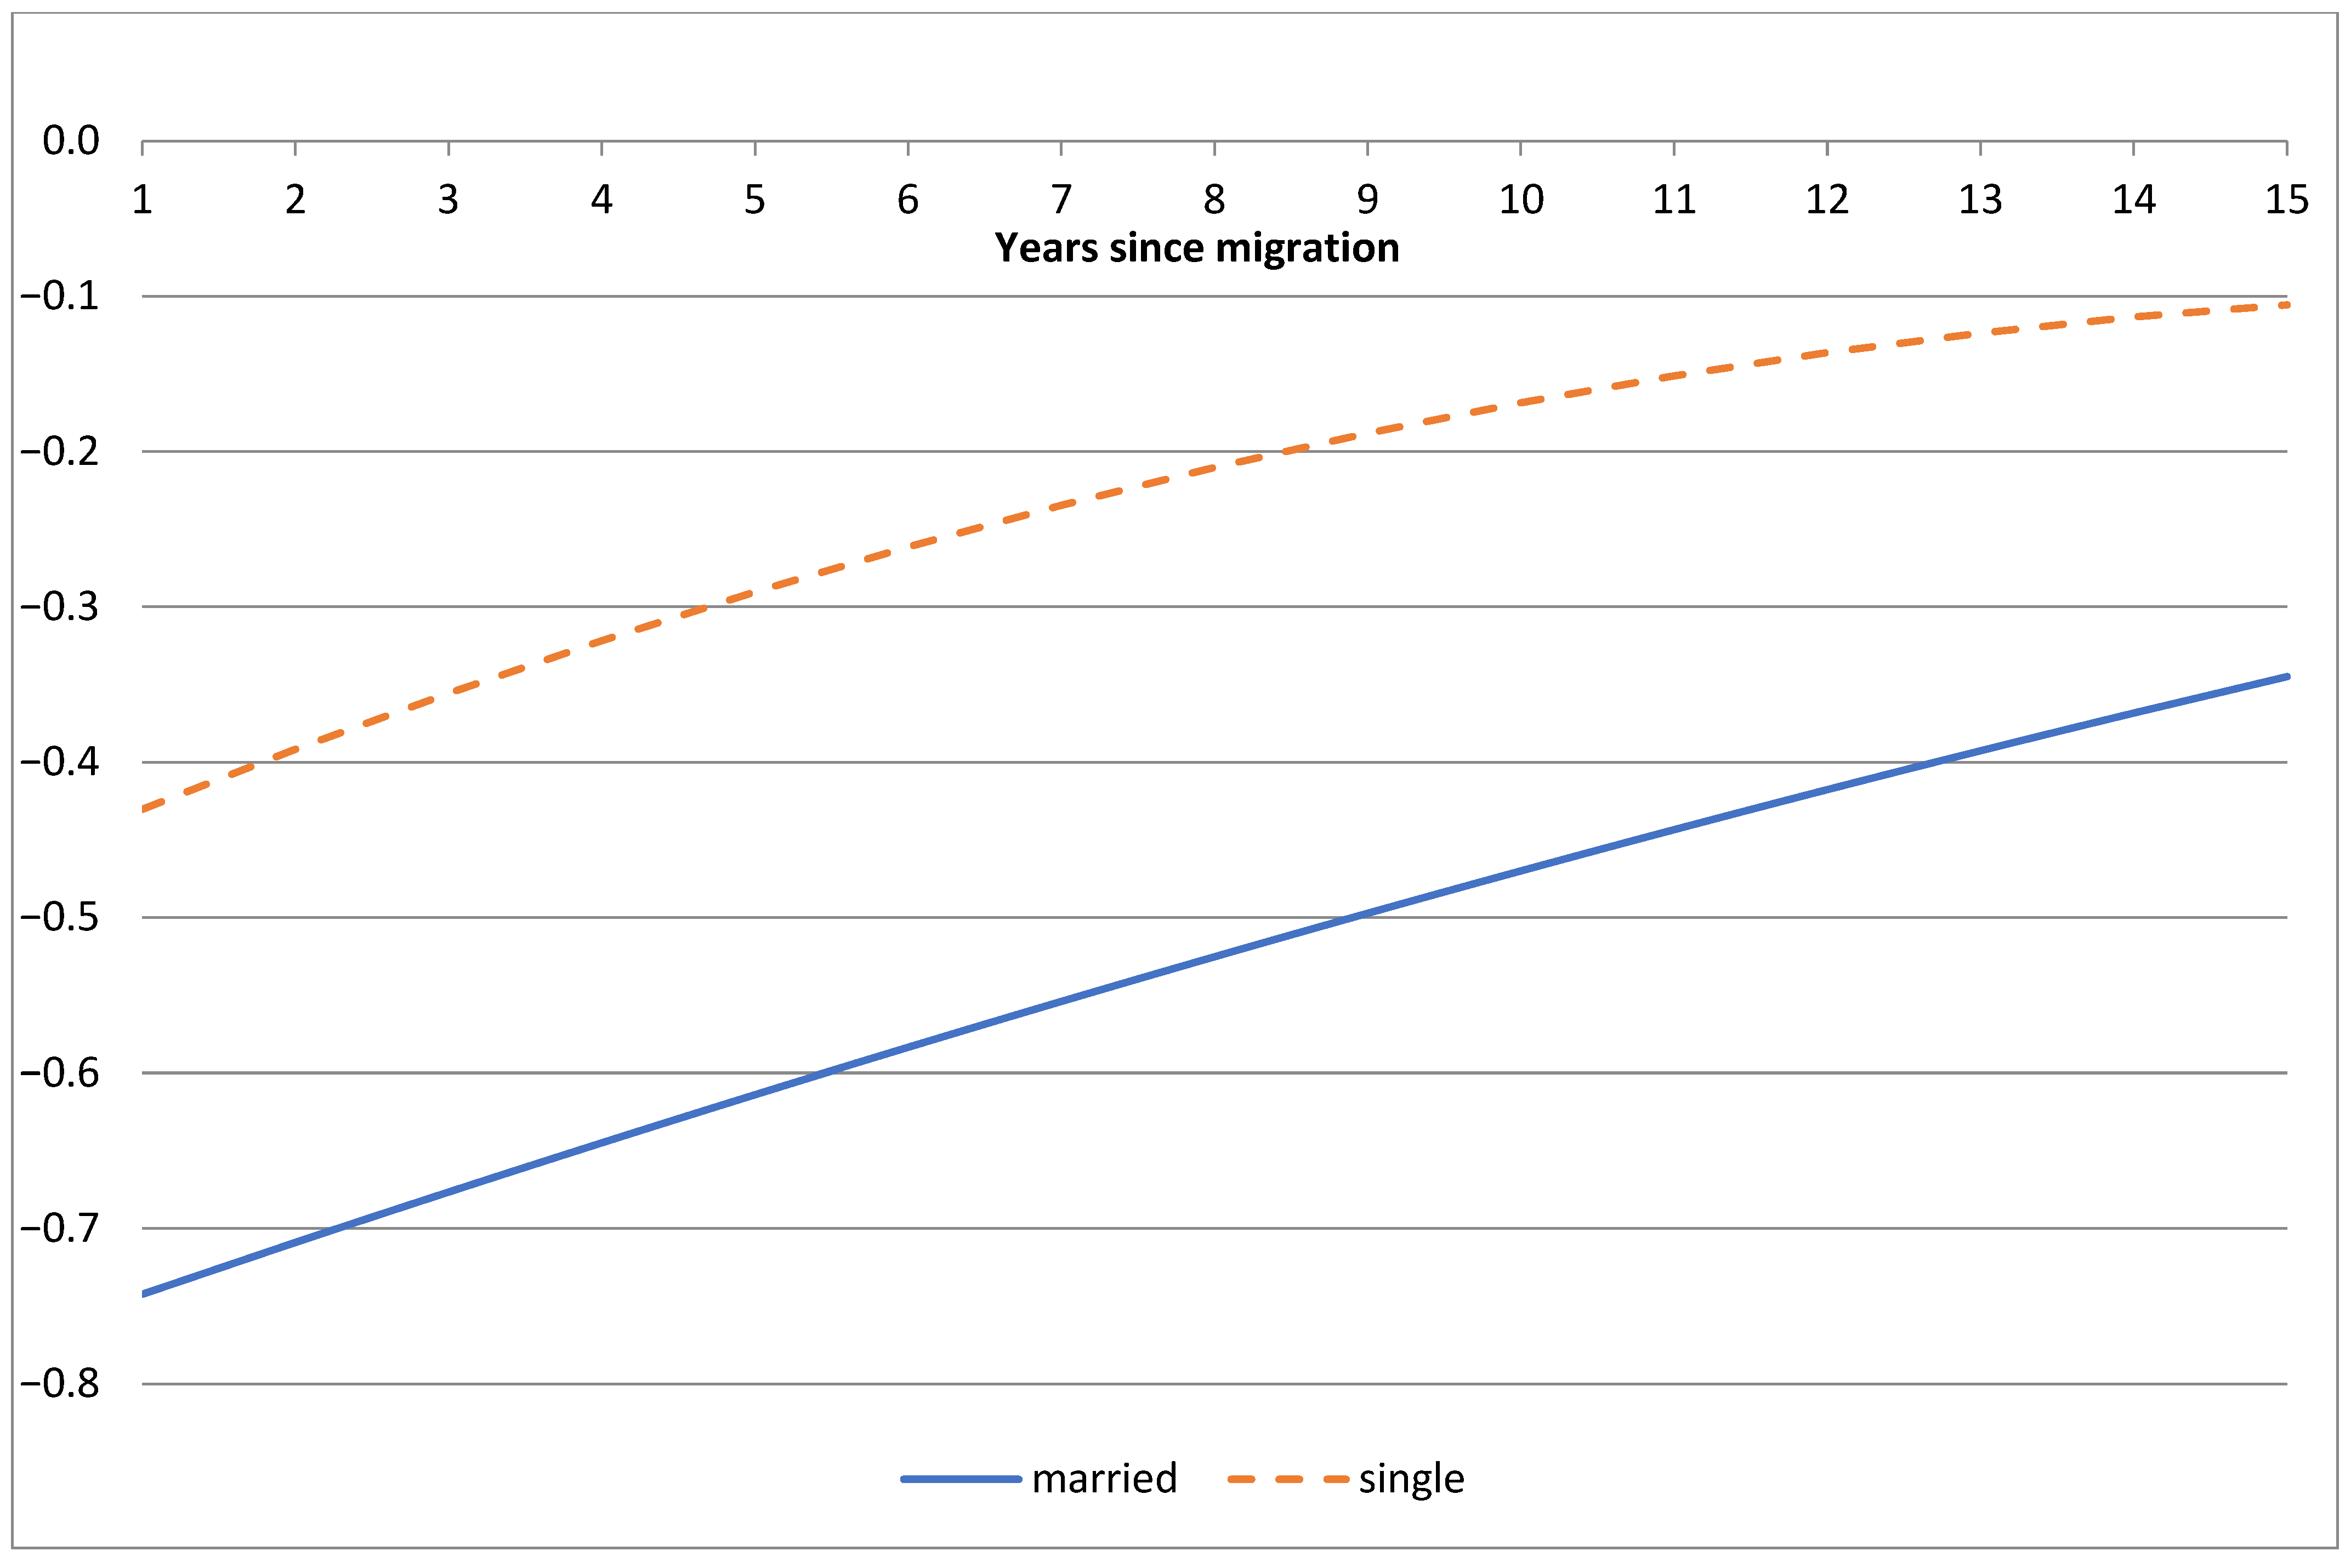
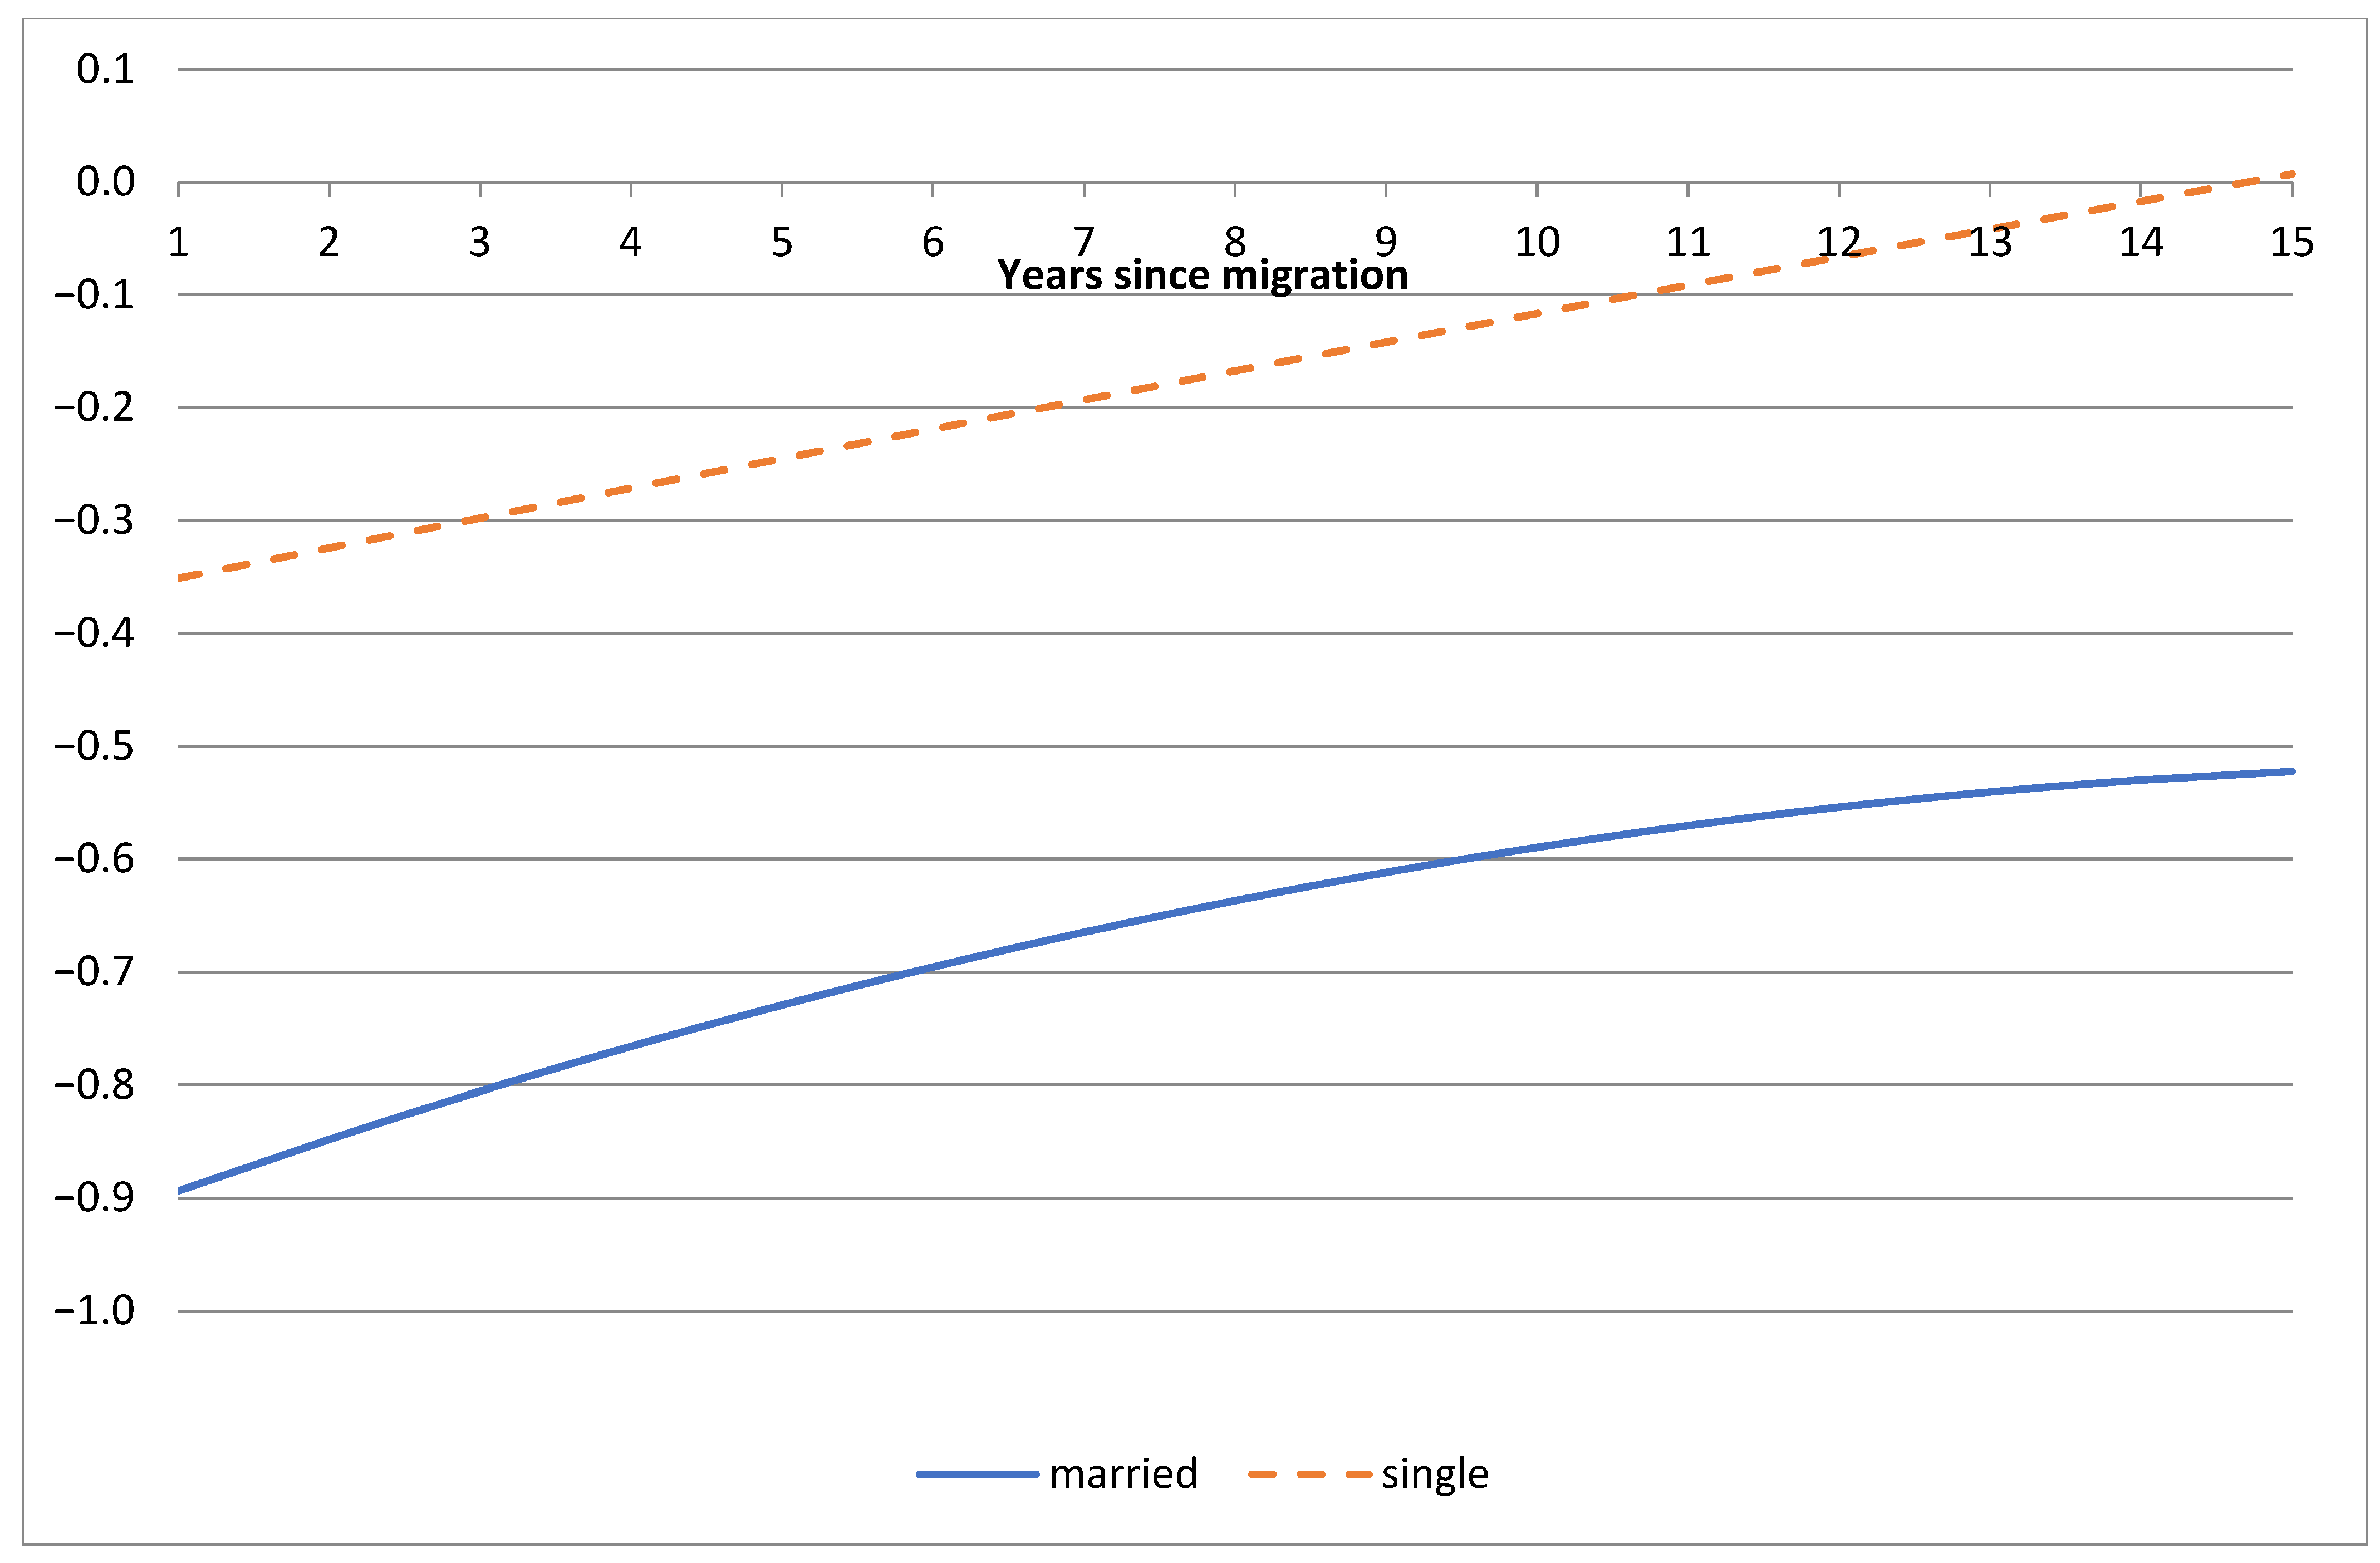
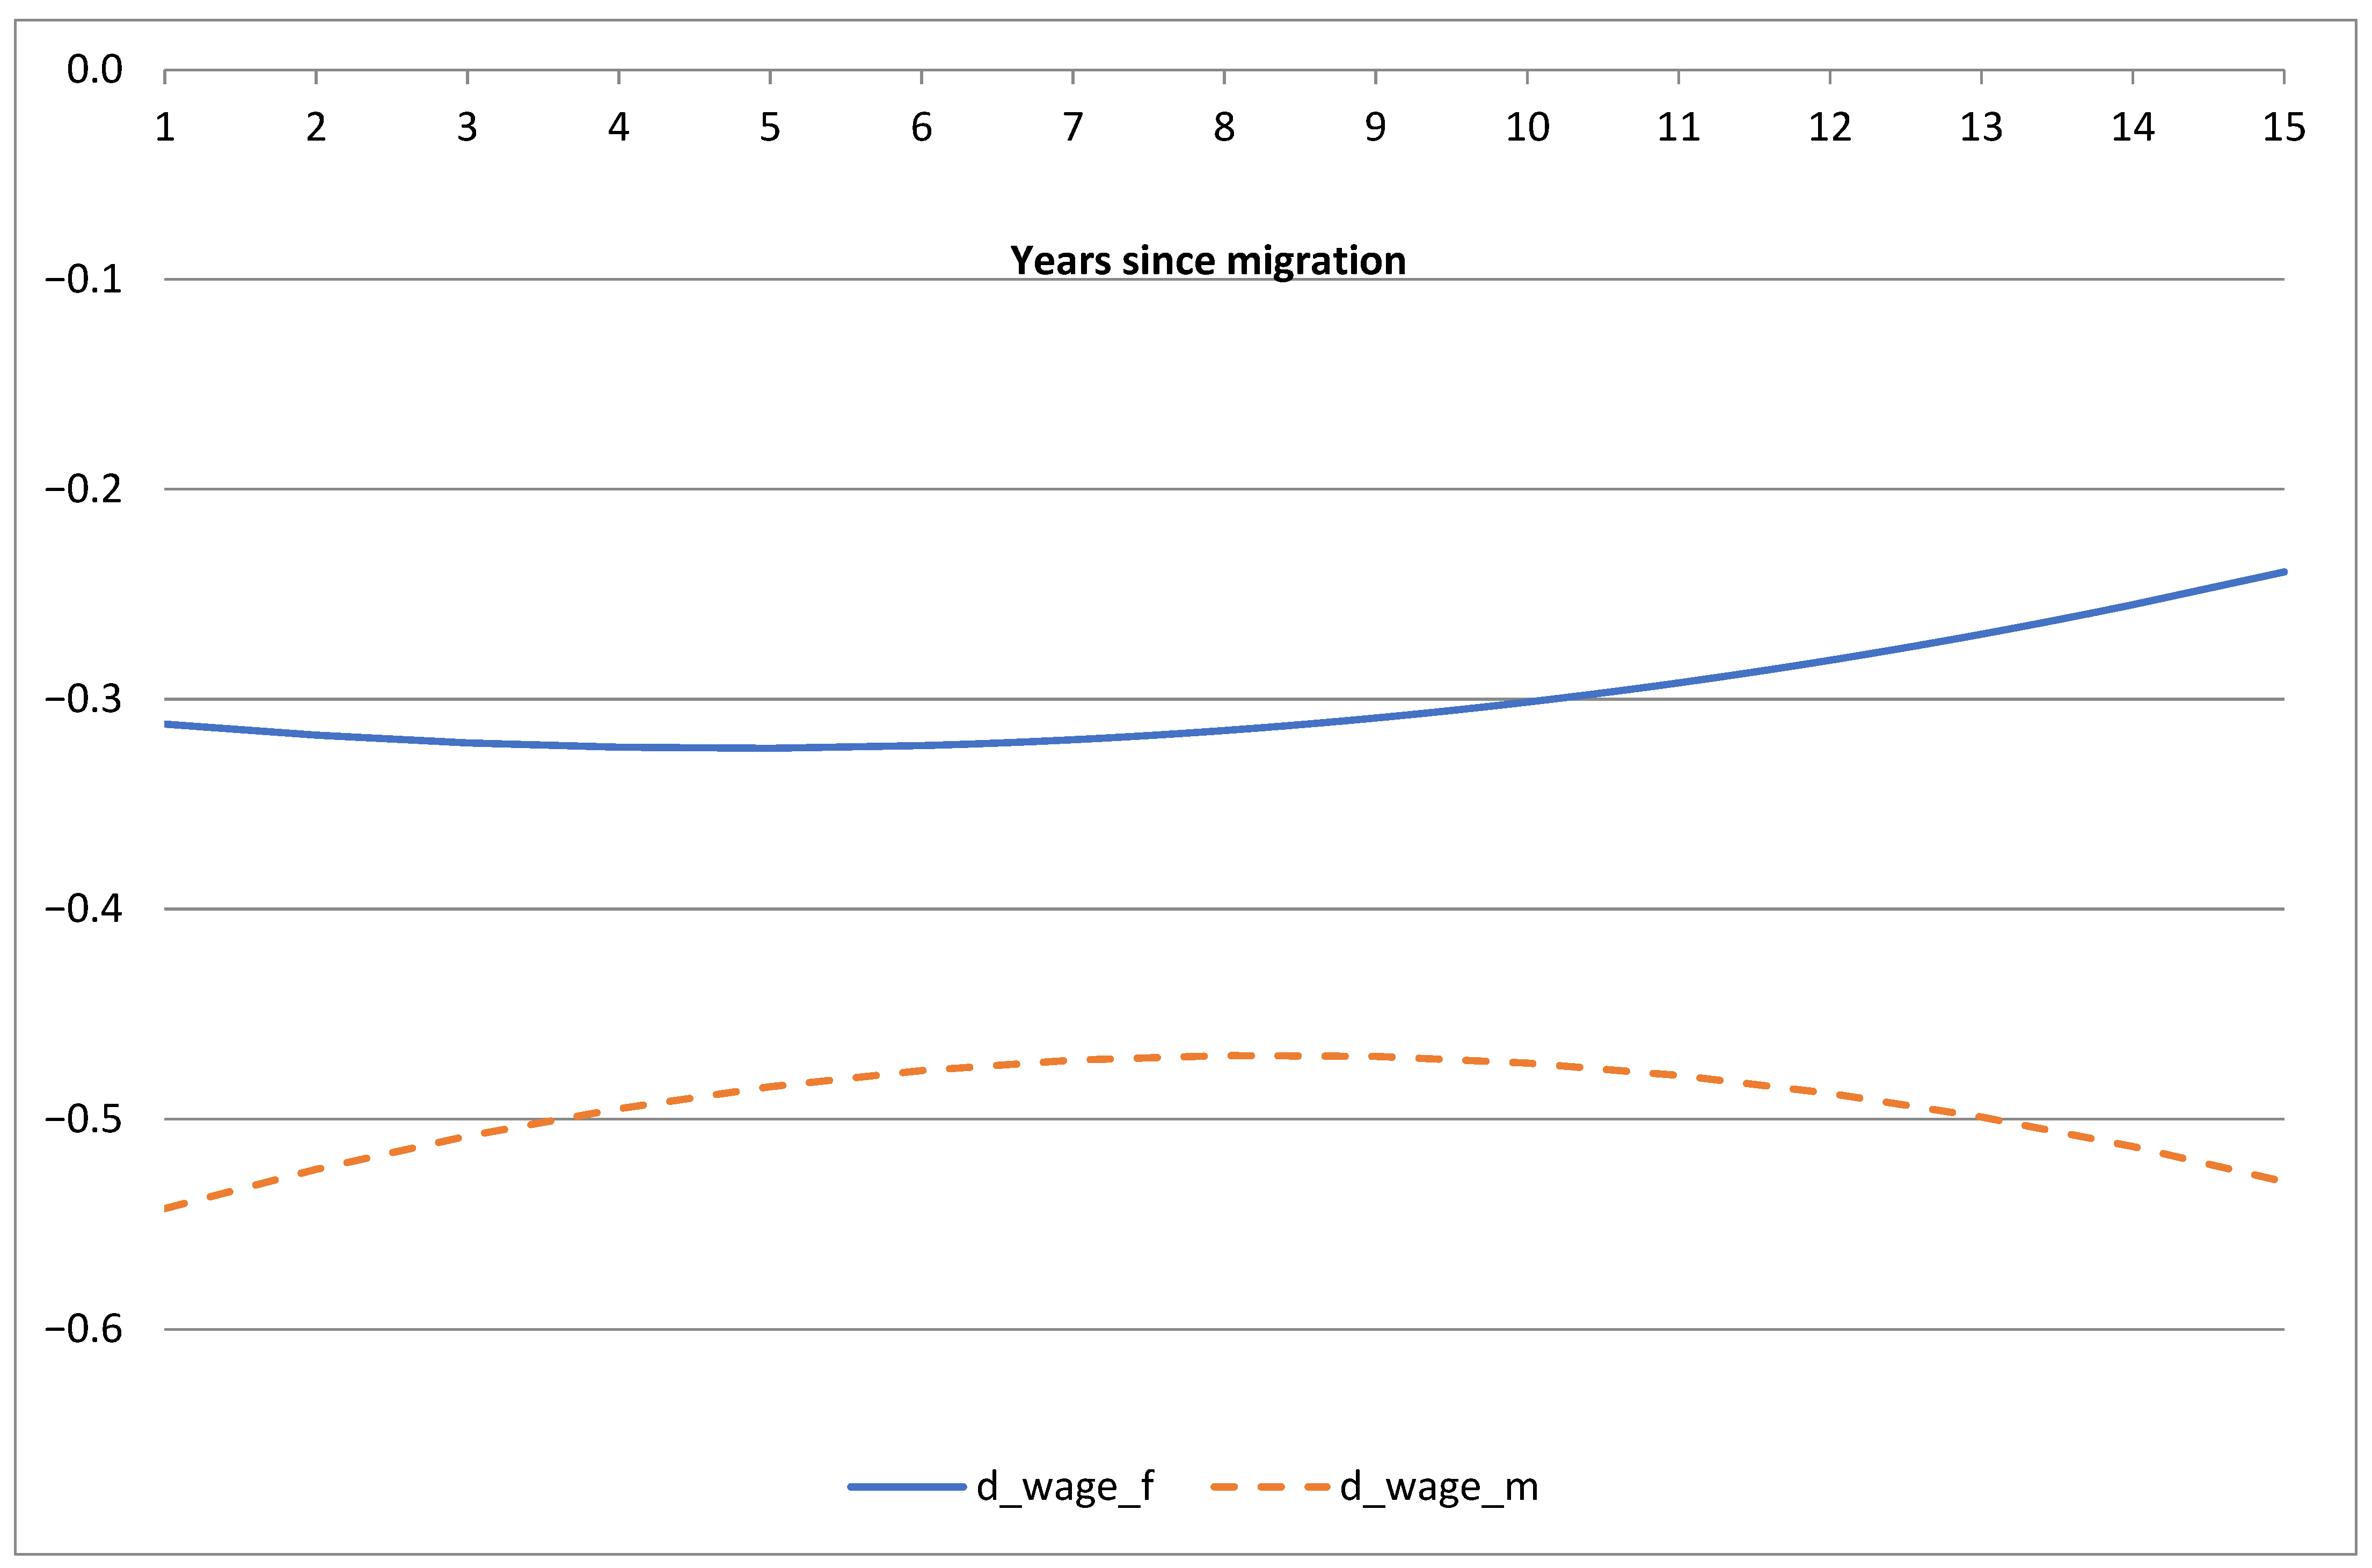
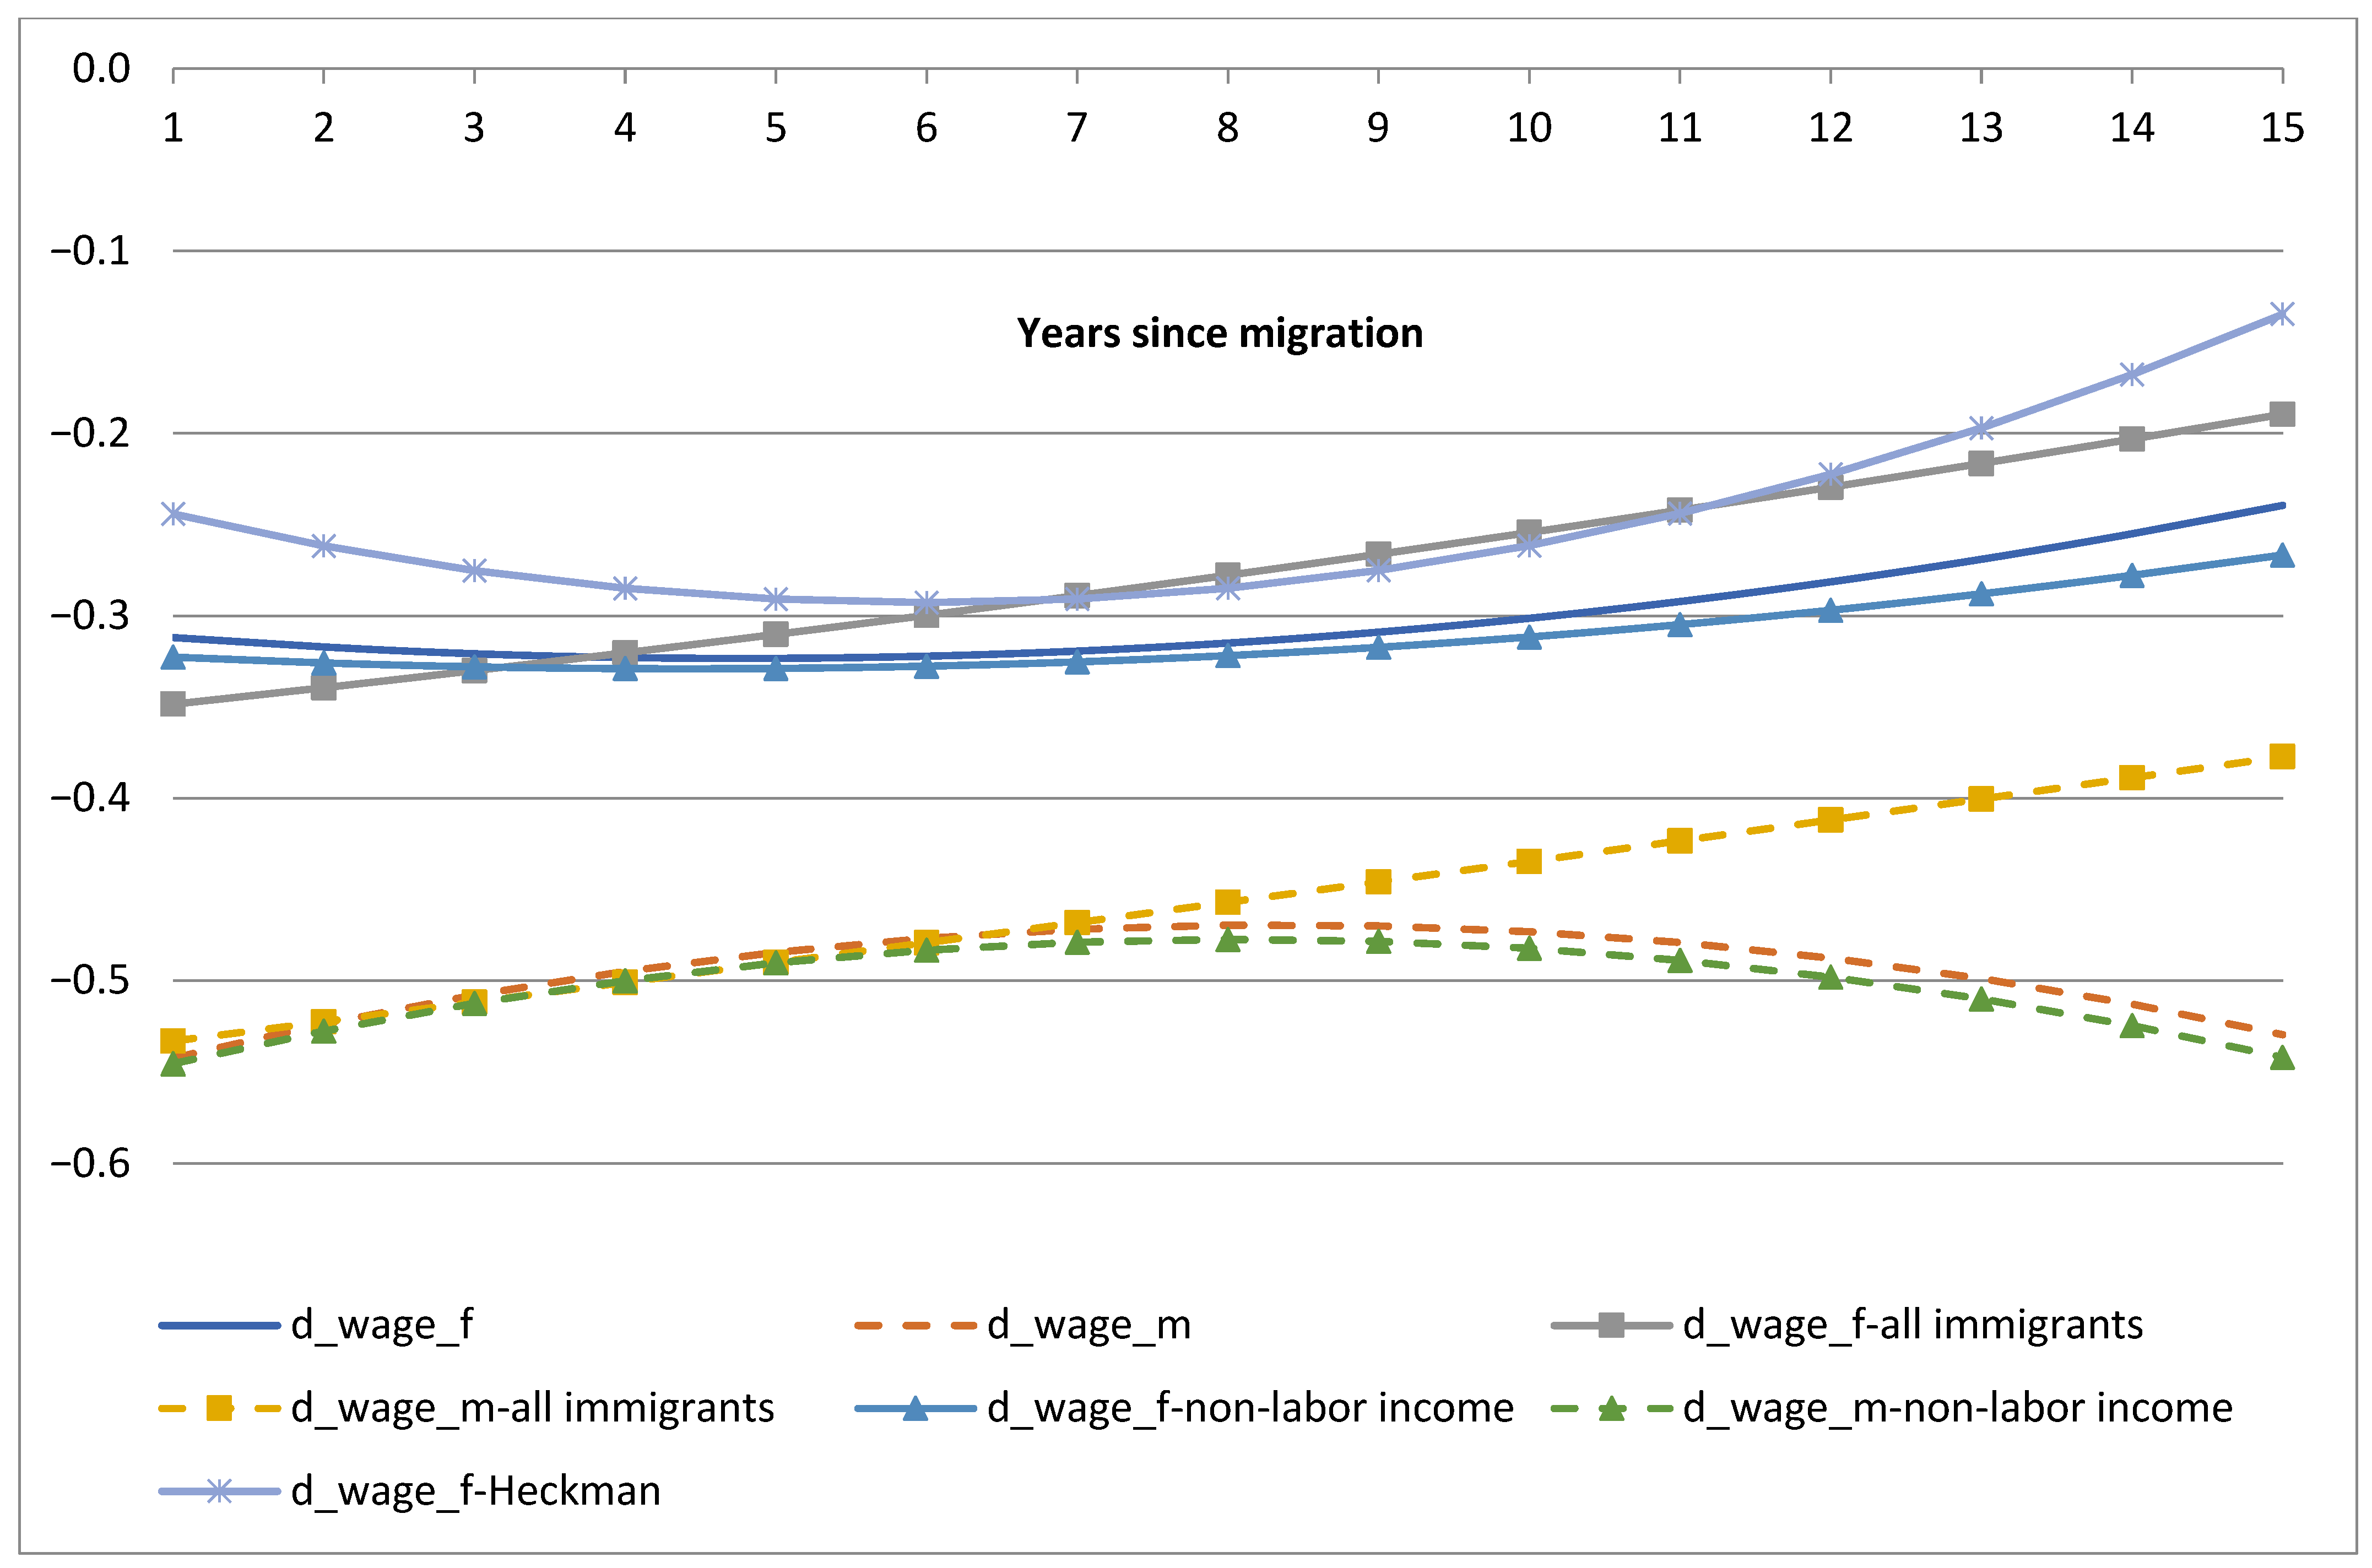
| 14 | In Figure 1, Figure 2, Figure 3, Figure 4, Figure 5, Figure 6, Figure 7 and Figure 8 we measured, on the horizontal axis, years since migration (YSM) for immigrants whose age was 30 (males) and 28 (females) on arrival. For natives, each point on the horizontal axis should be associated with the age of the individual, where age equals 30 + YSM for native males and 28 + YSM for native females. |
| 15 | This result may be consistent with the FIH if leisure was a normal good and a married male immigrant initially invested more than a single male immigrant and thus eventually earned a higher hourly wage. In any case, the results for female labor supply were not consistent with the FIH. |
| 16 |
References
- Adserà, A., & Ferrer, A. M. (2014). The myth of immigrant women as secondary workers: Evidence from Canada. American Economic Review, 104(5), 360–364. [Google Scholar] [CrossRef] [PubMed][Green Version]
- Baker, M., & Benjamin, D. (1997). The role of the family in immigrants’ labor market activity: An evaluation of alternative explanations. American Economic Review, 87(4), 705–727. [Google Scholar]
- Bernhardt, D., & Backus, D. (1990). Borrowing constraints, occupational choice, and labor supply. Journal of Labor Economics, 8(1), 145–173. [Google Scholar] [CrossRef]
- Blau, F. D., Khan, L. M., Moriarty, J. Y., & Souza, A. P. (2003). The role of the family in immigrants’ labor market activity: An evaluation of alternative explanations-comment. American Economic Review, 93(1), 429–447. [Google Scholar] [CrossRef]
- Borjas, G. J. (1985). Assimilation, changes in cohort quality, and the earnings of immigrants. Journal of Labor Economics, 3(4), 463–489. [Google Scholar] [CrossRef]
- Cohen-Goldner, S., Eckstein, Z., & Weiss, Y. (2012). Immigrants’ labor market mobility: The large wave of immigration to Israel, 1990–2000. The MIT Press. [Google Scholar]
- Cohen-Goldner, S., Gotlibovski, C., & Kahana, N. (2009). The role of marriage in immigrants’ human capital investment under liquidity constraints. Population Economics, 22(4), 983–1003. [Google Scholar] [CrossRef]
- Derby, S. J., Islam, A., & Smyth, R. (2020). Labour market and human capital behavior of immigrant couples: Evidence from Australia. International Migration, 58(2), 118–142. [Google Scholar] [CrossRef]
- Duleep, H. O., & Dowhan, D. J. (2002). Revisiting the family investment model with longitudinal data: The earnings growth of immigrant and U.S.-born women (IZA Discussion Paper No: 568). Institute for the Study of Labor (IZA). [Google Scholar]
- Duleep, H. O., & Regets, M. C. (1999). Immigrants and human-capital investment. American Economic Review, 89(2), 186–191. [Google Scholar] [CrossRef]
- Duleep, H. O., & Sanders, S. (1994). Empirical regularities across cultures: The effect of children on woman’s work. Journal of Human Resources, 29(2), 328–347. [Google Scholar] [CrossRef]
- Ferrer, A., & Dhatt, S. S. (2025). Immigrant gaps in job quality: Canadian immigrant women’s resilience to automation. Labour. [Google Scholar] [CrossRef]
- Ferrer, A., Pan, Y., & Schirle, T. (2023). The work trajectories of married canadian immigrant women, 2006–2019. Journal of International Migration and Integration, 24(Suppl. S3), 697–716. [Google Scholar] [CrossRef]
- Heckman, J. (1979). Sample selection bias as a specification error. Econometrica, 47(1), 153–161. [Google Scholar] [CrossRef]
- Jacquemet, N., & Robin, J. M. (2013). Assortative matching and search with labour supply and home production (No. CWP07/13). Cemmap Working Paper. Centre for Microdata Methods and Practice. [Google Scholar]
- Kanas, A., & Müller, K. (2021). Immigrant women’s economic outcomes in Europe: The importance of religion and traditional gender roles. International Migration Review, 55(4), 1231–1264. [Google Scholar] [CrossRef]
- Kim, S., & Varanasi, N. (2019). Labor supply of married foreign-born women in credit-constrained households. Economic Modelling, 81, 411–421. [Google Scholar] [CrossRef]
- Liu, Y., & Hagiwara, R. (2025). Does the labor force participation of married female immigrants decrease in a low female LFP host country? evidence from Japan. Population and Development Review. [Google Scholar] [CrossRef]
- Long, J. E. (1980). The effect of americanization on earnings: Some evidence for women. Journal of Political Economy, 88(3), 620–629. [Google Scholar] [CrossRef]
- Salikutluk, Z., & Menke, K. (2021). Gendered integration? How recently arrived male and female refugees fare on the German labour market. Journal of Family Research, 33(2), 284–321. [Google Scholar] [CrossRef]
- Tolts, M. (1992). Jewish marriages in the USSR: A demographic analysis. East European Jewish Affairs, 22(2), 3–19. [Google Scholar] [CrossRef] [PubMed]


| Females | Males | |||||||
|---|---|---|---|---|---|---|---|---|
| Married | Single | Married | Single | |||||
| Native | Immigrant | Native | Immigrant | Natives | Immigrant | Native | Immigrant | |
| Real hourly wage (NIS) | 34.061 (28.107) | 21.16 (19.33) | 24.784 (23.69) | 20.12 (27.72) | 42.919 (34.26) | 25.02 (19.68) | 26.143 (21.804) | 21.56 (18.50) |
| Annual work hours | 1137.74 (953.70) | 1317.73 (1043.9) | 1155.49 (1033.82) | 961.97 (1036.15) | 2077.726 (1082.51) | 1955.58 (1105.3) | 1053.224 (1166.67) | 1144.78 (1190.87) |
| Age | 36.057 (8.885) | 42.30 (9.83) | 26.695 (7.194) | 30.02 (10.84) | 38.715 (9.096) | 44.83 (9.89) | 26.061 (5.799) | 26.99 (7.44) |
| Years since migration (YSM) | 5.60 (3.75) | 6.22 (3.89) | 5.57 (3.74) | 6.50 (3.79) | ||||
| Schooling distribution (%) No schooling | 0.0004 (0.019) | 0.00 (0.03) | 0.003 (0.054) | 0.008 (0.089) | 0.001 (0.023) | 0.002 (0.041) | 0.005 (0.068) | 0.00 (0.097) |
| 1–8 years of schooling | 0.023 (0.15) | 0.027 (0.162) | 0.018 (0.133) | 0.038 (0.190) | 0.042 (0.2) | 0.038 (0.191) | 0.037 (0.19) | 0.045 (0.208) |
| 9–11 years of schooling | 0.106 (0.308) | 0.174 (0.379) | 0.047 (0.211) | 0.161 (0.368) | 0.149 (0.356) | 0.208 (0.406) | 0.106 (0.307) | 0.230 (0.421) |
| 12 years of schooling | 0.387 (0.487) | 0.107 (0.310) | 0.409 (0.492) | 0.21 (0.405) | 0.302 (0.459) | 0.099 (0.298) | 0.472 (0.499) | 0.229 (0.421) |
| Some college | 0.152 (0.359) | 0.197 (0.398) | 0.245 (0.43) | 0.255 (0.436) | 0.142 (0.349) | 0.158 (0.364) | 0.207 (0.405) | 0.248 (0.432) |
| College graduates | 0.206 (0.404) | 0.357 (0.480) | 0.2 (0.4) | 0.260 (0.439) | 0.183 (0.387) | 0.329 (0.470) | 0.126 (0.332) | 0.191 (0.393) |
| More than college | 0.126 (0.331) | 0.137 (0.344) | 0.079 (0.269) | 0.079 (0.270) | 0.183 (0.387) | 0.167 (0.373) | 0.047 (0.211) | 0.049 (0.214) |
| Num. of Observations | 16,561 | 6051 | 8950 | 1254 | 14,848 | 5929 | 11,271 | 1789 |
| Independent Variable | Annual Work Hours | Logged Wage | ||
|---|---|---|---|---|
| Females | Males | Females | Males | |
| Ysm | 163.8064 * (25.463) | 116.1209 * (24.9909) | 0.042 ** (0.0196) | 0.0271 *** (0.0164) |
| Ysm2 | −9.5161 * (1.7925) | −6.8518 * (1.7671) | −0.0012 (0.0013) | −0.0001 (0.0011) |
| Married | 94.3498 (170.0844) | 1451.5 * (198.1369) | −0.1835 (0.1149) | −0.3112 ** (0.1339) |
| Married*immig | −32.795 (83.7688) | −565.7942 * (85.5717) | −0.3051 * (0.0692) | −0.5637 * (0.0561) |
| Married*Ysm | 56.1562 ** (27.8824) | 36.7458 (28.0741) | −0.0077 (0.021) | 0.0226 (0.0178) |
| Married*Ysm2 | −2.2019 (1.9792) | −0.8328 (2.0034) | 0.0008 (0.0014) | −0.0014 (0.0012) |
| Independent Variable | Annual Work Hours | Logged Wage | ||
|---|---|---|---|---|
| Females | Males | Females | Males | |
| A. Controlling for Non-Labor Income | ||||
| Ysm | 144.1241 * (25.2245) | 101.5972 * (24.5766) | 0.0374 *** (0.0196) | 0.027 (0.0164) |
| Ysm2 | −8.304 * | −5.7702 * | −0.0008 | −0.0001 (0.0011) |
| (1.7796) | (1.7423) | (0.0013) | ||
| Married | 388.1918 ** | 1823.539 * | −0.1617 | −0.288 ** (0.134) |
| (168.4383) | (194.6827) | (0.1151) | ||
| Married*immig | −105.0443 (82.9447) | −571.8754 * (83.9832) | −0.3191 * (0.0693) | −0.5641 * (0.0561) |
| Married*Ysm | 61.1238 ** (27.6086) | 28.3091 (27.6053) | −0.0049 (0.021) | 0.0219 (0.0178) |
| Married*Ysm2 | −2.5844 | −0.4883 | 0.0006 | −0.0014 |
| (1.9641) | (1.975) | (0.0014) | (0.0012) | |
| B. Including FSU immigrants who migrated prior to 1989 | ||||
| Ysm | 28.9728 * (9.6197) | 14.1154 (8.9706) | 0.0333 * (0.0065) | 0.0328 * (0.0065) |
| Ysm2 | −0.3804 (0.3267) | −0.5348 *** (0.3086) | −0.0006 * (0.0002) | −0.0006 * (0.0002) |
| Married | 98.9584 (167.5081) | 1348.695 * (194.1738) | −0.1441 (0.113) | −0.3223 ** (0.1317) |
| Married*immig | −148.6004 ** (61.4516) | −701.7089 * (61.8044) | −0.3571 * (0.0448) | −0.5437 * (0.0402) |
| Married*Ysm | 87.198 * (10.9758) | 72.3773 * (10.8254) | 0.0085 (0.0074) | 0.0105 (0.0072) |
| Married*Ysm2 | −3.1719 * (0.3936) | −2.1715 * (0.3974) | 0.0002 (0.0002) | 0 (0.0003) |
| C. Heckman Correction ^ | ||||
| Ysm | 0.2635 * (0.0354) | |||
| Ysm2 | −0.0155 * (0.0025) | |||
| Married | −0.3897 *** (0.2333) | |||
| Married*immig | 0.094 (0.1175) | |||
| Married*Ysm | −0.0242 (0.0389) | |||
| Married*Ysm2 | 0.0032 (0.0027) | |||
Disclaimer/Publisher’s Note: The statements, opinions and data contained in all publications are solely those of the individual author(s) and contributor(s) and not of MDPI and/or the editor(s). MDPI and/or the editor(s) disclaim responsibility for any injury to people or property resulting from any ideas, methods, instructions or products referred to in the content. |
© 2025 by the authors. Licensee MDPI, Basel, Switzerland. This article is an open access article distributed under the terms and conditions of the Creative Commons Attribution (CC BY) license (https://creativecommons.org/licenses/by/4.0/).
Share and Cite
Cohen Goldner, S.; Gotlibovski, C.; Kahana, N. Human Capital and Labor Supply Decisions in Immigrant Families: An Alternative Test of the Family Investment Hypothesis. Economies 2025, 13, 211. https://doi.org/10.3390/economies13080211
Cohen Goldner S, Gotlibovski C, Kahana N. Human Capital and Labor Supply Decisions in Immigrant Families: An Alternative Test of the Family Investment Hypothesis. Economies. 2025; 13(8):211. https://doi.org/10.3390/economies13080211
Chicago/Turabian StyleCohen Goldner, Sarit, Chemi Gotlibovski, and Nava Kahana. 2025. "Human Capital and Labor Supply Decisions in Immigrant Families: An Alternative Test of the Family Investment Hypothesis" Economies 13, no. 8: 211. https://doi.org/10.3390/economies13080211
APA StyleCohen Goldner, S., Gotlibovski, C., & Kahana, N. (2025). Human Capital and Labor Supply Decisions in Immigrant Families: An Alternative Test of the Family Investment Hypothesis. Economies, 13(8), 211. https://doi.org/10.3390/economies13080211


